The State of Art in Transit Programs (2026)
Chapter: 3 Survey Results

CHAPTER 3
Survey Results
This chapter presents a discussion of the survey results. The purpose of the survey was to obtain additional information on the current state of art in transit programs in the United States and Canada beyond what was gathered in the literature review and to identify likely case examples and volunteers for case example interviews. The survey was intended for any representative of a transit agency that has integrated art into its system. The survey was distributed widely and open to responses for more than 2 months. A total of 17 responses were received, representing 14 art in transit programs, all of which are permanent programs within large and urban transit agencies.
The survey received a limited number of responses that did not include many known art in transit programs, including large, long-established programs and less formal programs in smaller and rural agencies. Because of this, the results do not offer a representative sample or inventory of existing art in transit programs in the United States and Canada. The results describe kinds of art in transit programs and related practices, expected benefits, and challenges that exist.
Methodology
The survey was divided into the following sections with all questions being optional, except for those that confirmed the status of the art in transit program and identified the respondent:
- Respondent and organization information
- Art in transit program, documentation, and stakeholders
- Funding sources
- Kinds of art
- Selecting art and artists, benefits and impacts, and challenges
The survey was conducted using Google Forms. A copy of the survey questionnaire is in Appendix A: Survey Questionnaire and Case Example Interview Guide. The surveyʼs instructions explained the study teamʼs intentions for the survey, that participation was completely voluntary, and that the survey was expected to take up to 15 minutes to complete. The survey offered contact information for the study team.
The survey instructions stated that respondents could be any representative of an art in transit program in the United States or Canada involved with selecting, siting, installing, maintaining, curating, assessing, or decommissioning art in a transit system. To prevent respondents from being confused or discouraged by the term “art in transit program,” the survey instructions and outreach material emphasized the following broad definition:
An “Art in Transit program” refers to any initiative to integrate art into a transit system, whether established or ad hoc. Art may be anything created by an artist, including temporary works and performance art but excluding advertising campaigns. (Advertising may have artistic components but is something that is paid for by an organization—private or public—to promote a product, service, event, action, political cause, etc.)
To accommodate respondents who did not represent an art in transit program, the survey had an alternate sequence with questions that concerned the prospect of creating an art in transit program, including the expected kinds of art, benefits of the program, and challenges with establishing a program.
The survey was distributed broadly to reach as many transit agencies and state departments of transportation that operate transit services as possible and to cover as wide a range of agency sizes, geographies, and services in the United States and Canada as possible. Outreach included using APTA, FTA, and TRB committee email lists and contacts identified by the study team and synthesis topic panel members. When possible, reminder emails were sent to these lists and contacts. Given the limited number of responses, the survey remained open to responses beyond the initial deadline, and three additional responses were received after the initial deadline.
In analyzing the responses, only information on art in transit programs that met the stated definition were considered. (The analysis excludes a response from someone affiliated with a university in Australia.) One program was represented by two responses, which were not contradictory and were combined into one response for this analysis. One response was received regarding a potential art in transit program that did not provide sufficient information to analyze.
Responses
Responses were submitted for 14 unique art in transit programs (Table 1). For a full record of the survey responses, see Appendix B: Survey Responses. Of the 14 responses, 13 represent existing programs operated by public transit agencies, all of which operate rail systems among other transit services and are in urban areas. One of the programs is in Canada. The remaining response referred to an interest in a potential future program. Nine of these agencies have annual budgets of more than $75 million, and one has a budget between $5 million and $75 million. Three respondents declined to provide a general value for the agencyʼs annual budget.
Program Management
The survey asked questions regarding program management, including whether the program is established or procures art on an ad hoc basis, or both; the year range in which the program was established; and the department the respondent works under, which is assumed to be the same department that houses the art in transit program. The survey also asked questions regarding the roles included in the programʼs governance structure and documentation used to guide the program, both allowing multiple-selection answers.
All 14 programs use established processes for procuring art, even if they do not operate as established art in transit programs. Seven of the programs are permanent and the sole channels for integrating art into the transit systems, and another five programs are permanent but conduct ad hoc processes for integrating art into the transit system. The remaining two programs are not established or permanent but do use consistent processes for integrating art (Figure 4). Eight of the programs were established before 2015, and five were established from 2015 through 2020. None of the programs were established after 2020 (Figure 5).
The programs mostly are housed within two kinds of departments: six programs are within departments that involve engineering, real estate, or capital programs; four are within customer-related departments, such as “Passenger Services and Customer Experience.” One program is housed within a strategic planning department, and another is its own department in the agency (Figure 6).

Long Description.
The column headers of the table are agency, geography, transit services, and annual budget. The data in the table row-wise are as follows: Row 1: Chicago Transit Authority: Urban; Bus, Subway, rapid transit; 75,000,000 dollars or more. Row 2: LA County Metropolitan Transportation Authority; Urban; Bus, bus rapid transit, light rail, subway, demand-response, active transportation, some freeway; 75,000,000 dollars or more. Row 3: Maryland Transit Administration MTA: Urban; Bus, Light rail, Subway, Commuter Rail, Mobility or Paratransit; Prefer not to answer. Row 4: Metro Transit, Minneapolis and Saint Paul: Urban; Bus, bus rapid transit, Light rail, Commuter Rail; 5,000,000 dollars to 74,999,999 dollars. Row 5: Metropolitan Atlanta Rapid Transit Authority (MARTA): Urban; Bus, bus rapid transit, Light rail, Subway, Demand-response; 75,000,000 dollars or more. Row 6: Metropolitan Transit Authority, New York: Urban; Bus, bus rapid transit, Subway, Commuter Rail; Prefer not to answer. Row 7: PATH, a subsidiary of the Port Authority: Urban, Intercity; Commuter Rail; 75,000,000 dollars or more. Row 8: San Diego Metropolitan Transit System: Urban, Intercity; Light rail; Prefer not to answer. Row 9: San Francisco Bay Area Rapid Transit District; Urban, Intercity; Subway, Commuter Rail; 75,000,000 dollars or more. Row 10: Sound Transit, Seattle: Urban and Suburban mix; Bus, bus rapid transit, Light rail, Subway, Commuter Rail; Billions annually. Row 11: The New Jersey State Council on the Arts: Rural, Urban, Statewide; Grant-making agency; 5,000,000 dollars to 74,999,999 dollars. Row 12: TransLink, Vancouver, BC: Urban; Bus, Subway, Commuter Rail, SeaBus; 75,000,000 dollars or more. Row 13: TriMet, Portland, OR: Urban; Bus, bus rapid transit, Light rail, Commuter Rail; 75,000,000 dollars or more. Row 14: Washington Metropolitan Transit Authority: Urban; Bus, Subway, paratransit; dollars 75,000,000 or more.

Long Description.
The pie chart illustrates the distribution of program types with three categories: ‘No program, but established process’ with a count of 2, ‘Established and ad-hoc’ with a count of 5, and ‘Established - sole channel for art’ with a count of 7.

Long Description.
The pie chart has a segment labeled ‘Before 2015’ that represents 8 units, making up the largest portion. The ‘2015 to 2020’ segment accounts for 5 units. The ‘After 2020’ segment shows 0 units, indicating no data for this period.

Long Description.
On this bar graph, the x-axis represents the overseeing department. The options are engineering, real estate or capital; customer-related; strategic planning; and art program. The y-axis represents the number of programs from 0 to 7 in increments of 1. The data in the bar graph are as follows: Engineering, real estate, or capital: 6. Customer-related: 4. Strategic planning: 1. Art program: 1. Note that the values are approximate.
To manage the program, 11 of the 14 programs have an arts manager or director/executive director. Eight of these programs have a combination of selection committees, hired external consultants, and advisory committees. Three have an arts manager/director and no other constituents under the programsʼ governance structures. The 3 of the 14 programs that do not have arts managers/directors have selection committees. One of these three has a governance board and an advisory committee. Few of the programs have a governance board, volunteer committee or team, or committee or team of other stakeholders. None of the programsʼ governance structures include a committee or team of only artists (Figure 7).
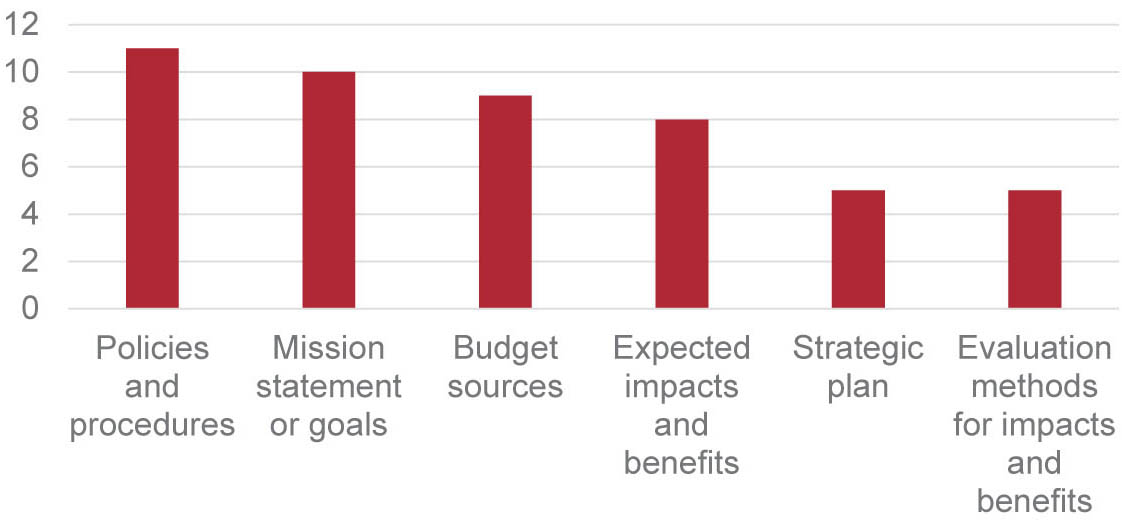
To describe the programsʼ management, 9 of 12 programs have documented mission statements or goals as well as policies and procedures in support of them. Two of 12 programs do not have documented mission statements or goals but have documented policies and procedures and methods for evaluating impacts and benefits. This means that 11 of 12 programs document their missions or expected impacts and benefits and have policies and procedures in support of these goals. The remaining program has a mission statement/goals and documents expected

Long Description.
On this bar graph, the x-axis represents the roles included in the program’s governance structure; options are manager or director, selection committee, external consultant, advisory committee, governance board, volunteer committee or team, stakeholder committee or team, and artist committee or team. The y-axis represents the number of programs from 0 to 12 in increments of 2. The data in the bar graph are as follows: Manager or Director: 11. Selection Committee: 9. External Consultant: 5. Advisory Committee: 5. Governance board: 2. Volunteer committee or Team: 2. Stakeholder committee or Team: 1. Artist committee or team: 0. Note that the values are approximate.
impacts and benefits with methods for evaluating them but does not have documented policies and procedures.
Nine of 12 programs document their budget sources. Eight of 12 programs document the expected impacts and benefits of the programs, with four of them also documenting methods to evaluate these. (One respondent stated that the program has methods for evaluating impacts and benefits but no documentation on the expected impacts and benefits.) Five of 12 programs have strategic plans (Figure 8).
Stakeholders
Respondents were asked to list which departments and external stakeholders were involved in each stage of the art in transit lifecycle. The options for stakeholders were the following: Customer Service/Engagement, Maintenance and Facilities, Operations, Security and Safety, Marketing, Accounting, Information Technology, Executive Leadership, Local Government, Private Sector, NGO, Selected Artist, External Experts, General Public, Transit Customers, and Neighboring Residents. The stages in the art in transit process were the following: Site selection, Art media selection, Artist selection, Installation, Maintenance, and Curation/Decommission. The following summary presents the stakeholders that are identified by at least 5 of the 13 respondents, listed in decreasing order by the number of respondents, for each stage:
- Site selection: Maintenance, Operations, Security and Safety, Executive Leadership, Local Government
- Art media selection: Maintenance, Selected Artist
- Artist selection: Executive Leadership, Local Government, NGO, Selected Artist, Neighboring Residents, External Experts, Accounting, Customer Service/Engagement
- Installation: Maintenance, Selected Artist, Security and Safety
- Maintenance: Maintenance, External Experts
- Curation/Decommissioning: Selected Artist, External Experts
- Not included at any stage: Information Technology, Marketing, General Public, Transit Customers, Private Sector
Of all the stages in the art in transit lifecycle, selecting artists involves the widest range of stakeholders, with the most respondents identifying executive leadership and local governments for this. Except for selecting artists and curation/decommissioning, most respondents identify maintenance for all stages. For installation and afterward, maintenance, external experts, and artists are the primary involved stakeholders. Security and safety are involved in site selection and installation, which are the processes most related to the physical site of the art; however, one respondent identified security and safety for all stages. Many respondents identified customer
Long Description.
On this bar graph, the x-axis represents the documentation used for the program; options are policies and procedures, mission statement or goals, budget sources, expected impacts and benefits, strategic plan, and evaluation methods for impacts and benefits. The y-axis represents the number of programs from 0 to 12 in increments of 2. The data in the bar graph are as follows: Policies and procedures: 11. Mission statement or goals: 10. Budget sources: 9. Expected impacts and benefits: 8. Strategic plan: 5. Evaluation methods for impacts and benefits: 5. Note that the values are approximate.
service and engagement as involved in many of the stages, but seven respondents did not identify it for anything. Two respondents did not identify selected artists for any of the stages.
When agencies engage the public, it primarily is through a local government (for site selection and artist selection) or neighboring residents (for artist selection). The general public and transit customers are not involved in any process for most respondents.
For curation/decommissioning, five respondents did not list any stakeholders, indicating that they do not decommission artwork. One respondent listed only curation/decommissioning for any of the stakeholders, and the non-respondent for this question indicated elsewhere in the survey that the primary function of that program also is curation and decommissioning.
Budgets and Funding
The survey asked questions on the art in transit programsʼ annual budgets, staffing, and funding sources, distinguishing between initial selection and installation and ongoing maintenance. It is apparent that respondents interpret these questions differently. Regarding the average annual budget, many respondents described that the programsʼ budgets are variable, project-specific, and calculated differently by allocation, such as for procurement, maintenance, program staff, and temporary programs. These allocations also may be taken from different agency budgets (i.e., capital and operational). Of 13 respondents, 6 did not offer more detailed information. Six respondents stated that their programsʼ average annual budgets are under $1 million, with the remaining program being greater than $1 million (Figure 9).
The survey asked for a general number of full- and part-time staff and volunteers. Reported part-time staff is considered as 0.5 full-time equivalent (FTE) staff. Nine of 13 respondents reported having one to five FTE employees, two reported 6 to 10 FTE employees, and one reported more than 10. The remaining respondent reported that the program has no staff (Figure 10).
The survey asked for a list of funding sources for selection and installation and for maintenance and separately asked if these funding sources were dedicated to the art in transit program. Combining these responses involves applying the dedicated/not-dedicated/no-response answers to all the funding sources identified (or not identified/no response). The results show that state and local government funding sources are most common both for selection and installation and for maintenance. Some programs have federal, NGO, and private-sector funding sources. Most state, local, and federal funding sources are not dedicated to the art in transit programs, and only

Long Description.
The pie chart illustrates budget distribution across four categories: Not applicable or varies or project dependent with 6 instances; Under 100 thousand dollars with 1 instance; 100 thousand to 1 million dollars with 5 instances; and Over 1 million dollars with 1 instance.

Long Description.
The pie chart includes four segments: 1 to 5 FTE with 9 instances, 6 to 10 FTE with 2 instances, Over 10 FTE with 1 instance, and None with 1 instance.
two respondents reported programs with dedicated funding for both selection/installation and maintenance. (Because the respondents include a Canadian program, not all programs have the same restrictions on federal funding for art.) None of the respondents reported programs that are funded through philanthropy or donations or through federal sources that are not related to transportation. While the responses for both selection/installation and maintenance are similar in the aggregate, most respondents individually reported different sources for each of these (Figure 11 and Figure 12). Respondents also were asked to list other funding sources. Beyond providing more detailed information on NGO and local government funding sources, these responses clarify information on within-agency sources, such as from the operations or general budget, allocated revenue from leasing, advertising, and property management, and from specific community relations/Indigenous relations departments.
Kinds and Locations of Art
The survey asked basic questions about the art included in the art in transit programs, such as the kinds of exhibits, the kinds of media, and the locations of artwork. All the programs have permanent art exhibits, and all but one have temporary exhibits. Five of the 14 programs also have

Long Description.
On this bar graph, the x-axis represents funding sources for selection and installation; options are state, local government, federal - transportation, NGO, private sector, no response, philanthropy or donations, and federal-not transportation. The y-axis represents responses ranging from 0 to 9 in increments of 1. Solid red shows not dedicated, red dashed lines show yes dedicated, and red gridded lines show no responses. The data in the graph are as follows: State: Not dedicated: 6, yes dedicated: 8. Local government: Not dedicated: 4, yes dedicated: 7. Federal - transportation: Not dedicated: 3, yes dedicated: 4. NGO: Not dedicated: 1, yes dedicated: 3. Private sector: Not dedicated: 1. No response: Not dedicated: 1, no response: 2. Philanthropy or donations, and federal - not transportation: Nil. Note that the values are approximate.

Long Description.
On this bar graph, the x-axis represents funding sources for maintenance; options are state, local government, federal-transportation, NGO, private sector, no response, philanthropy or donations, and federal-not transportation. The y-axis represents responses ranging from 0 to 7 in increments of 1. Solid red shows not dedicated, red dashed lines show yes dedicated, and red gridded lines show no responses. The data in the graph are as follows: State: Not dedicated: 6. Local government: Not dedicated: 2, yes dedicated: 4, no response: 5. Federal - transportation: Not dedicated: 2. NGO: Yes dedicated: 2. Private sector: Yes dedicated: 1, no response: 2. No response: Not dedicated: 2, yes dedicated: 3. Philanthropy or donations, and federal - not transportation: Nil. Note that the values are approximate.
rotating exhibits (Figure 13). All the programs have 2-dimensional and 3-dimensional pieces. Most of the programs also have literary, digital/media/electronic, and performance pieces. Fewer than half of the programs have interactive, kinetic, or audio pieces. One respondent added that the program has landscape art (Figure 14). Finally, all the programs have artwork located at transit stations in publicly accessible areas, and 12 of 14 programs have artwork also in fare-restricted areas of transit stations. Eight of the 14 programs have artwork located at bus shelters, and six of the programs have artwork onboard vehicles. Nine of the 14 programs have artwork on other agency property, and some respondents added that artwork is at bus garages, office buildings, and adjacent easements. One program also has artwork located on property owned by a partner organization (Figure 15).
Selecting Art and Artists
The survey asked questions about the criteria for selecting sites for artwork, the criteria for selecting artists and artwork, the methods for selecting artists and artwork, and the methods for publicizing project opportunities to artists. To maintain simplicity for respondents, these questions allowed multiple responses, and respondents were not able to indicate their relative priorities or whether the criteria or considerations were applicable in all or only some selections. Given this, these responses present the range and not the frequency of these selection criteria and methods.
All 14 programs select sites as part of capital projects or considering a physical site evaluation. (Two programs select sites as part of capital projects only.) In addition, seven of these programs consider neighborhood characteristics in selecting sites. Six of these programs also accept

Long Description.
On this bar graph, the x-axis represents the kinds of art exhibits; options are permanent, temporary, and rotating. The y-axis represents the number of programs from 0 to 16 in increments of 2. The data in the bar graph are as follows: Permanent: 14. Temporary: 13. Rotating: 5. Note that the values are approximate.

Long Description.
On this bar graph, the x-axis represents the kinds of art media; options are 2-D, 3-D, literary, digital or media or electronic, performance, interactive, kinetic, audio, and other - landscape. The y-axis represents the number of programs from 0 to 16 in increments of 2. The data in the bar graph are as follows: 2-D: 14. 3-D: 14. Literary: 10. Digital or media or electronic: 10. Performance: 9. Interactive: 6. Kinetic: 5. Audio: 4. Other – Landscape: 1. Note that the values are approximate.

Long Description.
On this bar graph, the x-axis represents the locations of art; options are station – public, station – fare-restricted, other property, bus shelters, on vehicles, partner property, other- bus garages, other - office buildings, other - easements. The y-axis represents the number of programs from 0 to 16 in increments of 2. The data in the bar graph are as follows: Station – public: 14. Station – Fare-restricted: 12. Other property: 9. Bus shelters: 8. On vehicles: 6. Partner property: 1. Other- Bus garages: 1. Other - Office buildings: 1. Other-Easements: 1. Note that the values are approximate.
external proposals for sites, and six accept other stakeholder input. Four of the 14 programs undertake longer-term master planning for siting artwork (Figure 16).
In selecting artists, 11 of 13 programs consider the artistsʼ portfolios and work experience. Of the 13 programs, including the other two programs that do not consider portfolios and work experience, 10 consider artistsʼ representation of the local community. Seven programs prioritize local artists (Figure 17). Five programs consider the effect on the selected artist personally, including increasing the artistʼs ability to be self-supporting through art or raising the artistʼs profile. Three of these five programs consider artistsʼ personal backgrounds when making selections.
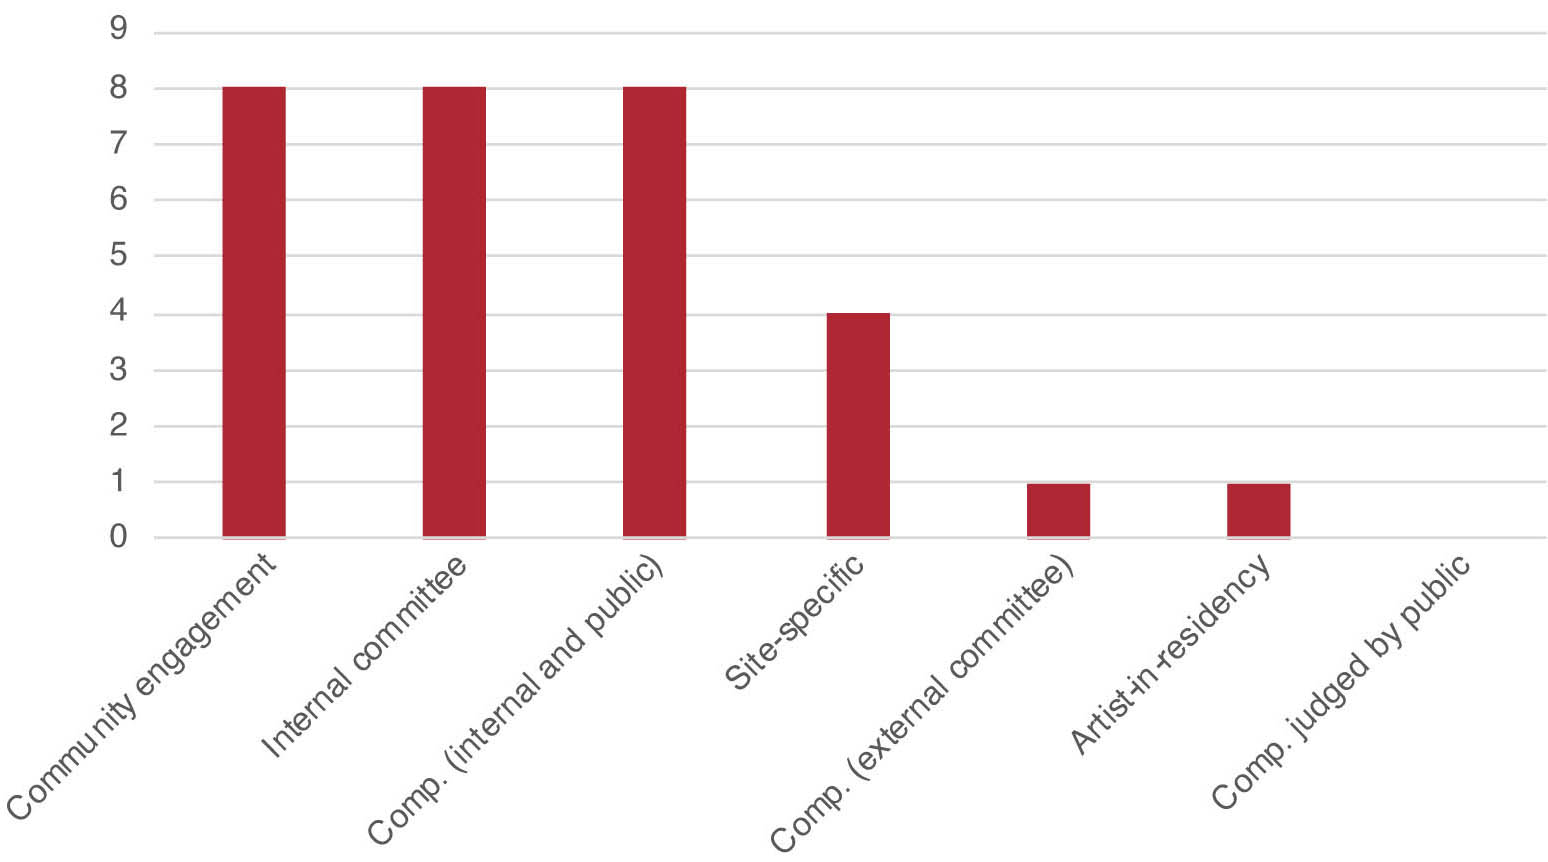
Every program uses either an internal committee or a public competition to select artists and artwork, and many use both. Eight of the 14 programs include a community engagement component in this process. Four of the programs use different selection methods depending on the site. One of the programs uses an artist-in-residency program, one selects artists and artwork through a competition judged by an external committee, and none uses a competition judged by the public only (Figure 18).
To publicize project opportunities for artists, 11 of the 14 programs use artist networks, such as email lists and artist organizations. Seven of the 14 programs post opportunities through the

Long Description.
On this bar graph, the x-axis represents the criteria for selecting sites; options are capital projects, physical evaluation, neighborhood characteristics, external proposal, stakeholder input, and master planning. The y-axis represents the number of programs from 0 to 14 in increments of 2. The data in the graph are as follows: Capital projects: 12. Physical evaluation: 12. Neighborhood characteristics: 9. External proposal: 6. Stakeholder input: 6. Master planning: 4. Note that the values are approximate.

Long Description.
On this bar graph, the x-axis represents the criteria for selecting artists; options are portfolio and experience, reflects community, home-local prioritized, helps self-support, impact on the artist’s profile, and personal background. The y-axis represents the number of programs from 0 to 12 in increments of 2. The data in the bar graph are as follows: Portfolio and experience: 11. Reflects community: 10. Home - local prioritized: 7. Helps self-support: 4. Impact on artist’s profile: 4. Personal background: 3. Note that the values are accurate.
Long Description.
On this bar graph, the x-axis represents the method for selecting artists and artwork; options are community engagement, internal committee, competition (internal and public), site-specific, competition (external committee), artist-in-residency, and competition judged by the public. The y-axis represents the number of programs from 0 to 9 in increments of 1. The data in the bar graph are as follows: Community engagement: 8. Internal committee: 8. Competition (internal and public): 8. Site-specific: 4. Competition (external committee): 1. Artist-in-residency: 1. Competition judged by public: 0. Note that the values are approximate.
transit agencyʼs general procurement process, and six place public advertising (Figure 19). One respondent also included that the program runs an invitational process, in which an advisory group of art professionals offers a long list of artists to be invited to submit proposals.
Benefits and Impacts
The survey asked respondents to rate the importance of a series of benefits and impacts when making decisions related to siting, selecting, maintaining, and decommissioning art as low, medium, high, or not considered. The benefits and impacts were ridership, economic, social, sustainability/environmental, educational opportunities, passenger experience, passenger safety, and the benefits to artists. To summarize the responses, these rankings were assigned numerical weightings and averaged, with the numerical results then being matched to the ranking with the closest numerical value (Table 2).
All 14 programs rank passenger experience as high. All programs also consider ridership impacts and passenger safety as most important. Social impacts also are considered similarly important, although one program does not consider these impacts at all. Both sustainability/environmental impacts and economic impacts are ranked among the programs with a similar spread that averages to medium. Although these averages are similar, most programs rank uniquely. Only one of the 14 programs considers educational opportunities as high, and eight consider them as medium. In line with the responses regarding artist selection, two of the programs consider the benefits to the artist as high, but three do not consider them at all. In an open-response option, respondents also identify reduction in graffiti and vandalism, improved community relations, and contribution to the surrounding area as benefits the program considers.

Long Description.
On this bar graph, the x-axis represents the methods for publicizing project opportunities; options are artists’ networks, the general procurement process, public ads, and other individuals. The y-axis represents the number of programs from 0 to 12 in increments of 2. The data in the bar graph are as follows: Artists networks: 11. General procurement process: 7. Public ads: 6. Other – individual: 1. Note that the values are approximate.

Long Description.
The column headers of the table are benefit or impact, weighted importance, and responses. The data in the table row-wise are as follows: Row 1: Passenger experience: High; 14. Row 2: Ridership impacts: High; 13. Row 3: Passenger safety: High; 14. Row 4: Social impacts: Medium to High; 14. Row 5: Sustainability or environmental impacts: Medium; 14. Row 6: Economic impacts: Medium; 14. Row 7: Educational opportunities: Medium to Low; 14. Row 8: Benefit to artists: Medium to Low; 13.
Most respondents did not respond to an open-response question about methods for assessing or measuring these benefits. The four responses to this question identified the following measures:
- The instances of graffiti and vandalism at sites before and after the installation of art
- Rider surveys and social media interactions
- Maintenance records for the durability of the art
- Demographics of artists and the service areas activated
Challenges
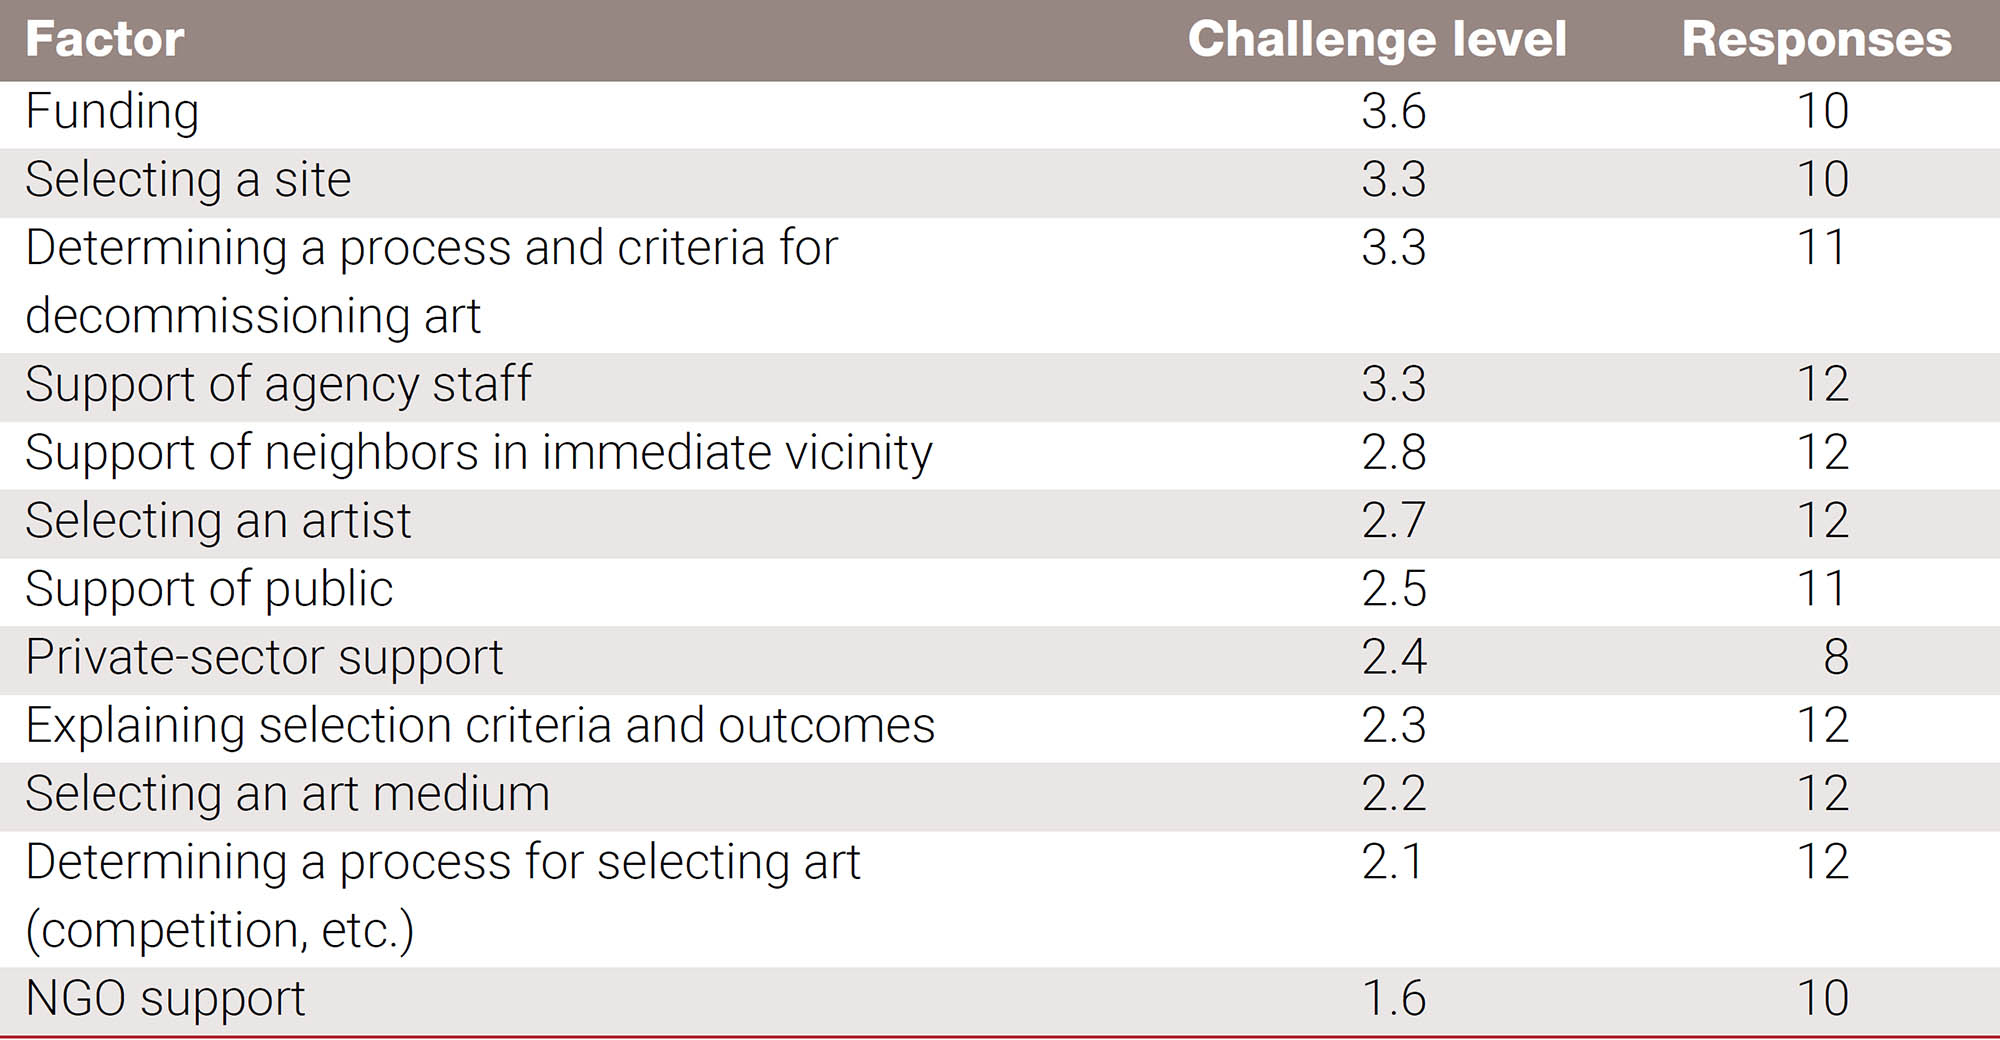
The survey asked respondents to rate the degrees that specified factors contributed challenges to the art in transit programs on an increasing scale of 1 to 5. These factors were selecting a site, determining a process for selecting art, public support, neighborhood support, agency staff support, NGO support, private-sector support, selecting an art medium, selecting an artist, funding, explaining selection criteria and outcomes, and determining a process for decommissioning. In general, each respondent selected a range of ratings. One respondent rated none of the factors above 3, although this appears to be an indication that the program does not experience significant challenges. One respondent rated every factor as either 1 or 5. To summarize the responses, these ratings were averaged (Table 3).
Funding is the greatest challenge among all the factors; although, one respondent rated it as 1. The average ratings for selecting a site, determining a decommissioning process, and support of agency staff are similar and high. The ratings for selecting a site are evenly spread, but the ratings for both decommissioning and agency staff support are skewed to the extremes. (Four respondents rated decommissioning 5, and five respondents rated it 1 or 2. Five rated agency staff support 5, and three rated it 1 or 2.) These spreads may indicate that these factors are important for some programs and not for others or that respondents who rated these factors on the less challenging end already have effective decommissioning procedures and sufficient support from other agency staff. At the least challenging end of the factors, all respondents rated NGO support 1 or 2. Similarly, seven respondents rated private-sector support 1 or 2, but one rated it 5. The rest of the factors received ratings distributed from 1 to 5 and average to a middle challenge level.
For an open-response question on additional challenges, respondents identified the following challenges:
- Site-related: safety and vandalism
- Maintenance and conservation
- Risk insurance
- Contracting and coordinating with the procurement department
Long Description.
The column headers of the table are factor, challenge level, and responses. The data in the table row-wise are as follows: Row 1: Funding: 3.6; 10. Row 2: Selecting a site: 3.3; 10. Row 3: Determining a process and criteria for decommissioning art: 3.3; 11. Row 4: Support of agency staff: 3.3; 12. Row 5: Support of neighbors in immediate vicinity: 2.8; 12. Row 6: Selecting an artist: 2.7; 12. Row 7: Support of public: 2.5; 11. Row 8: Private sector support: 2.4; 8. Row 9: Explaining selection criteria and outcomes: 2.3; 12. Row 10: Selecting an art medium: 2.2; 12. Row 11: Determining a process for selecting art (competition, etc.): 2.1; 12. Row 12: NGO support: 1.6; 10.


