Health and Safety Impacts of Aircraft Cabin Temperatures (2026)
Chapter: Appendix B: Supplemental Data and Analyses
Appendix B
Supplemental Data and Analyses
This appendix serves as an accompanying resource to the data and analyses presented in the body of the report, particularly Chapter 5, which presents the evidence on the health and safety impacts of cabin temperatures. It summarizes data from published research studies that include cabin temperature and humidity data and details the results of analyses that provide further support and context for the committee’s conclusions and recommendations (see Chapters 5 and 6). Appendix A provides an accounting of the committee’s data collection and analysis methods.
CABIN TEMPERATURE AND HUMIDITY DATA FROM PUBLISHED STUDIES
To characterize the range of cabin thermal conditions that would be reasonably representative of typical flights operated by Part 121 airlines, the committee reviewed the published literature (peer-reviewed articles and gray literature) for cabin temperature and humidity measurements captured in research studies. Table B-1 expands on Table 5-3 in Chapter 5 to also include the temperature and humidity ranges reported in the primary studies included in the review article by Wang and colleagues (2024). As discussed in Chapter 5, comparisons across studies should be interpreted cautiously, given the lack of standardized study protocols, common reliance on convenience sampling for flights, and variation in data collection instrumentation. Only the American Society of Heating, Refrigerating and Air-Conditioning Engineers (ASHRAE) RP-1262 study evaluated a link between cabin conditions and health outcomes (Battelle, 2018), but several
TABLE B-1 Summary of Cabin Temperature and Humidity Data from Published Studies
| Data Source | Number of Flights (N) | Reported Cabin Temperature (°C) | Reported Relative Humidity (%) | Flight Stage of Data Collection |
|---|---|---|---|---|
|
Spicer et al. (2004) (ASHRAE Research Project 1262-RP Part 1, 2026) |
4 | Stationary Measurements Min = 19.4°C Max = 26.4°C Mobile Measurements Min = 18°C Max = 27°C |
Min = 7.1% Max = 57.6% |
Monitored with 1-second time resolution from boarding phase through deplaning of passengers |
|
Battelle (2018), Spengler et al. (2012) (ASHRAE Research Project 1262-RP Part 2, 2026) |
80 | Mean = 24.38°C Standard error of mean = 0.20 Min = 19.22°C 10th percentile = 22.36°C 25th percentile = 23.67°C Median = 24.47°C 75th percentile = 25.16°C 90th percentile = 26.20°C Max = 31.29°C |
Mean = 10.74% Standard error of mean = 0.62 Min = 1.70% 10th percentile = 5.20% 25th percentile = 7.30% Median = 10.05% 75th percentile = 13.03% 90th percentile = 16.48% Max = 41.15% |
Continuous measurements (1-minute averages) made in flight from 10,000 feet ascent to 10,000 feet descent |
| RITE (2010) | 6 for humidity and 11 for temperature (data only reported for a subset of nearly 200 measured flights) | Min = 22°C Max = 29°C |
Beginning of Flight 35–50% Mid-flight 10–25% |
Monitored continuously during cruise (from 10,000 feet ascent to 10,000 feet descent). In some cases, the system was operating from gate to gate, some sampling from gate to gate |
| EASA (2017) | N = 12 for main study (aircraft with bleed air systems) and N = 8 for Boeing 787 study (aircraft with electronic compression system) | Main Study Results Min = 21°C Max = 28°C Mean = 24°C Median = 24°C 95th Percentile = 27°C B787 study Min = 18°C Max = 24°C Mean = 21°C Median = 22°C 95th percentile = 24°C |
Main Study Results Min = 5% Max = 28% Mean = 13% Median = 13% 95th percentile = 20% B787 study Min = 10% Max = 43% Mean = 18% Median = 18% 95th percentile=24% |
In-cruise |
| Nicholls and Vink (2025) | 143 | Boarding Data Min = 16.7°C Max = 30.2°C Mean = 23.5°C (SD 5.57) In-flight Data Min = 17.8°C Max = 31.3°C Mean = 24.4°C (SD 4.77) |
Boarding Data Min = 10% Max = 82% Mean = 36.4% (SD 15) In-flight Data Min = 9% Max = 59% Mean = 20% (SD 10.6) |
Measurements taken directly after boarding and 1 hour after takeoff. |
| Cui et al. (2017) | 10 | Min= 23.0°C Max= 26.6°C |
Min = 15.4% Max = 20.8% |
Automatically recorded every 30 seconds |
| Data Source | Number of Flights (N) | Reported Cabin Temperature (°C) | Reported Relative Humidity (%) | Flight Stage of Data Collection |
|---|---|---|---|---|
| Gameiro da Silva et al. (2023) | 25 | Data for “Cooling Season” (summer and spring months) Min = 22.7°C Max = 29.3°C Data for “Heating Season” (fall and winter months) Min = 23.6°C Max = 28.8°C |
Data for “Cooling Season” (summer and spring months) Min = 23.3% Max = 37.6% Data for “Heating Season” (fall and winter months) Min = 23.8% Max = 29.2% |
Recordings taken while flights were in cruising altitude |
| Primary Articles Included in Review by Wang and Colleagues (2024) * | ||||
| Yu et al. (2021) | 2 | Flight 1 Min = 26.2°C Max = 28.1°C Mean = 27.5 ± 0.4°C Flight 2 Min = 21.0°C Max = 28.1°C Mean = 27.2 ± 1.2°C |
Flight 1 Min = 14.0 Max = 66.4 Mean = 29.7 ± 15.3 Flight 2 Min = 13.8 Max = 67.0 Mean = 33.6 ± 17.5 |
Recordings were taken at 1-second intervals throughout flight |
| Cui et al. (2014a) | 14 | Min = 24°C Max = 29°C |
Recorded automatically every 30 seconds | |
| Cui et al. (2014b) | 10 | Average for front seats = 24.6°C Average for middle seats = 26.2°C Average for back seats = 25.6°C |
Average for front seats = 16.9% Average for middle seats = 17.7% Average for back seats = 17.8% |
Recorded automatically every 30 seconds from take off until landing |
| MacGregor et al. (2008) | 4 | Flight 1 mean = 24.5°C Flight 2 mean = 24.9°C Flight 3 mean = 24.8°C Flight 4 mean = 24.6°C |
Flight 1 mean = 11.4% Flight 2 mean = 8.8% Flight 3 mean = 12.7% Flight 4 mean = 10.6% |
Measurements taken during cruise |
| Ross et al. (2003) | 7 (Aircraft 146) and 6 (Aircraft 747) | Aircraft 146 Min = 21.7°C Max = 26.6°C Mean = 23.7°C Aircraft 747 Min = 21.9°C Max = 23.9°C Mean = 23°C |
Aircraft 146 Min = 13.2% Max = 32.2% Mean = 20.9% Aircraft 747 Min = 22.4% Max = 29.4% Mean = 25.7% |
Measurements began at boarding and were recorded at 1-minute intervals. The monitoring was stopped toward the end of passenger disembarkation |
| Lindgren and Norback (2002) | 26 | Min = 17.4°C Max = 26.8°C Mean = 22.2°C |
Min = 1% Max = 27% Mean = 6% |
Most measurements were restricted to the cruising period, at a flight altitude of 11,000–12,000 During eight of the flights, continuous measurements were performed from gate to gate. |
| Data Source | Number of Flights (N) | Reported Cabin Temperature (°C) | Reported Relative Humidity (%) | Flight Stage of Data Collection |
|---|---|---|---|---|
| Waters et al. (2002) | 36 | Min = 19°C Max = 29.5°C |
Min = 10.1% Max = 45.6% Mean = 19.8% SD = 6.7% |
Sampling was performed continuously from (at minimum) gate departure to gate arrival or “gate to gate”. |
| Dumyahn et al. (2000) | 16 (1994 study) and 6 (1996 study) | 1994 Survey Results Boarding: Min = 19°C Max = 25°C Mean = 23°C Cruise: Min = 23°C Max = 26°C Mean = 24°C 1996 Survey Results Boarding: Min = 23°C Max = 28°C Mean = 23.9°C Cruise: Min = 22°C Max = 26°C Mean = 25°C |
1994 Survey Results Boarding: Min = 22% Max = 55% Mean = 33% Cruise: Min = 10% Max = 24% Mean = 15% 1996 Survey Results Boarding: Min = 25% Max = 40% Mean = 35% Cruise: Min = 13% Max = 23% Mean = 18% |
Samples were continuously measured |
| Wieslander et al. (2000) | 4 | Aft Galley Min = 20.6°C Max = 25.4°C Mean = 22.2°C SD = 0.9 Forward Galley Min = 22.3°C Max = 23.3°C Mean = 23°C SD = 0.2 |
Aft Galley Min = 2.2% Max = 18.9% Mean = 6.4% SD = 3.5 Forward Galley Min = 1.8% Max = 8.7% Mean = 3.8% SD = 1.8 |
1-minute average values were sampled in flight |
| Lee et al. (1999) | 16 | Min = 17.8°C Max = 29.8°C Mean = 21.9°C |
Min = 4.9% Max = 76.8% |
Measurements were taken every 5 minutes each flight |
| Haghighat et al. (1999) | 43 | Min = 19 °C Max = 27 °C |
Min = 2% Mean = 7% |
Measurements taken every 5 minutes from time of boarding to landing |
| Pierce et al. (1999) | 8 | Min = 17.8°C Max = 26.1°C Mean (Domestic flights) = 22.8°C Mean (International flights) = 23.1°C |
Min = 8.8% Max = 27.8% Mean (domestic flights) = 16.5% Mean (international flights) = 12.9% |
Measurements taken with 5-minute averaging during boarding, ascent; and descent; while the aircraft was aloft; and during deplaning |
| Data Source | Number of Flights (N) | Reported Cabin Temperature (°C) | Reported Relative Humidity (%) | Flight Stage of Data Collection |
|---|---|---|---|---|
| Nagda et al. (1992) | 92 | Min= 21 °C Max = 27 °C Mean = approx. 24 °C |
Min = 5% Max = 38% |
Temperature and humidity were monitored continuously |
| O’Donnell et al. (1991) | 45 | Min = 13.2°C Max = 35.1°C Mean = 23.4°C SD = 1.6 |
Min = 4.6% Max = 48.5 Mean = 18.5% SD = 3.8 |
Data were recorded every 4 minutes for duration of flights |
| Malmfors et al. (1989) | 48 | Min = 20.1 °C Max = 28.3 °C |
Mean = 25% | All samplers were turned on when the aircraft left the gate and turned off when the aircraft stopped at the gate upon arrival. |
NOTE: Min = minimum; max = maximum; RH = relative humidity; SD = standard deviation.
* The primary article by Gladyszewska-Fiedoruk (2012) included in the review by Wang and colleagures (2024) only included data from a single flight and therefore did not report summary statistics. Data from that study are therefore not included in this table.
studies evaluated potential impacts on cabin occupant comfort by survey or comparison with expected thermal comfort ranges (Cui et al., 2017; Gameiro da Silva et al., 2023; Nicholls and Vink, 2025).
UNDERSTANDING CONDITIONS THAT CONTRIBUTE TO HOT AND COLD CABIN TEMPERATURES
Identifying when and why cabin temperatures exceed comfortable ranges is critical for developing effective mitigation strategies. While extreme heat or cold events are rare, patterns in complaint and safety reporting data (see Chapter 5) suggest that certain operational and environmental factors increase the likelihood of these conditions. Understanding these drivers provides insight into the magnitude of the problem (e.g., expected temporal and geographic variability) and can inform potential policies or procedures to reduce risk (discussed further in Chapter 6). For example, if problems primarily occur while aircraft are on the ground, mitigation efforts can be focused on that phase of operation.
This section examines the key contributors to cabin temperatures—including seasonal variation, flight phase, and aircraft type—that are crucial to better understanding the circumstances under which these temperatures become problematic. By exploring these factors, the committee aims to highlight opportunities for targeted interventions that can reduce risks from thermal exposures without imposing unnecessary operational burdens. Datasets from published research studies (e.g., Nicholls and Vink [2025], the Airliner Cabin Environment Research [ACER] program), and aviation industry safety and complaint reporting systems referenced in the discussions that follow (e.g., National Aeronautics and Space Administration [NASA] Aviation Safety Reporting System [ASRS], 2Hot2Cold app data) are described in Chapter 5 (see Tables 5-1 and 5-4).
Seasonal Variation and Relationship to Ambient Temperatures
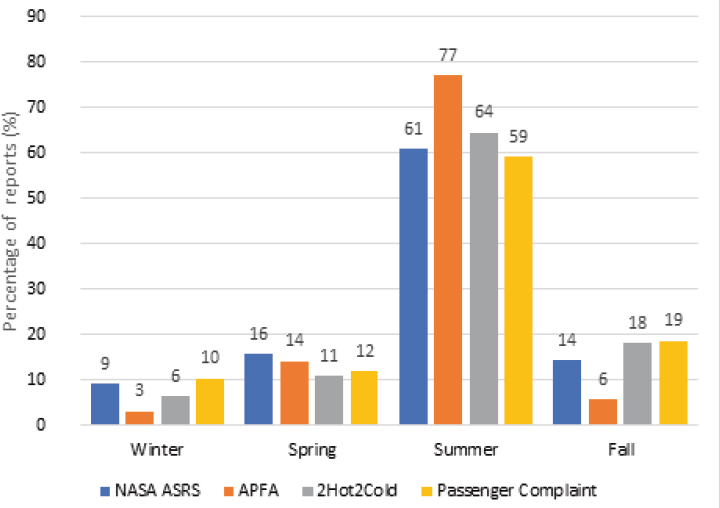
Data from aviation industry reporting systems reveal a strong seasonal effect, with cabin temperature issues most frequently reported during the summer months (June through August), as shown in Figure B-1. Passenger complaints submitted to the Department of Transportation (DOT) Office of Aviation Consumer Protection also peak sharply during summer. Increased U.S. air travel in summer relative to other months (as shown in Figure B-2) does not fully explain the magnitude of seasonal differences observed in temperature-related reporting.
Research data support this pattern. An analysis of an unpublished dataset from the ACER program shows that boarding temperatures follow expected seasonal trends—coolest in winter and warmest in summer (see
SOURCE: Created using data from AFA (2025), APFA (2025), DOT (2025b), and NASA (2025).

SOURCE: DOT (2025a).

NOTES: Flight phases were identified using changes in altitude and air pressure; when altitude data were unavailable, pressure alone was used. Signalprocessing algorithms were applied to detect sustained trends indicating ascent and descent, with boundaries reviewed and adjusted as needed. Because phase transitions were inferred from altitude and/or pressure data streams—without indicators of flight segment—some variability across algorithms is expected. The values shown here reflect results from one algorithm, and overall patterns were consistent across multiple approaches. “Missing” label indicates no date for the flight was captured, precluding seasonal categorization.
SOURCE: Created from unpublished ACER data (ACER, 2025).
Figure B-3). In-flight and post-landing conditions differ. Notably, fall flights recorded the highest in-flight and post-landing temperatures despite cooler boarding conditions; one possible explanation is that flight crews may overcompensate for cooler outdoor temperatures by heating the cabin beyond comfortable ranges. These findings underscore the influence of ambient conditions and operational decisions on cabin temperature, particularly during ground phases.
Variation by Flight Phase
Limited data from research studies suggest that cabin temperatures are generally similar while on the ground and in flight (see Figure B-4). However, these data likely reflect typical operational conditions and do not adequately capture events involving very hot or cold cabins.
In contrast, data from aviation industry reporting systems suggest that cabin temperature issues occur more frequently during ground operations, which was also emphasized during the committee’s public session discussion with flight attendant labor representatives. Only 15 percent of 2Hot2Cold reports referenced cabin temperature issues that occurred in flight; the majority occurred during boarding at the departure airport (see Figure B-5). As shown in Figure B-6, the highest cabin temperatures from the 2Hot2Cold dataset (greater than 30°C, or 86°F) are less commonly reported during flight. This pattern likely reflects the ability of the environmental control system to cool the aircraft once engines are running. However, approximately 20 percent of NASA ASRS reports describe temperature problems persisting both on the ground and in flight. For the most extreme temperature ranges observed (greater than 40°C, or 104°F), the number of cases involving both phases exceeded those occurring solely in flight (see Figure B-7). Multiple equipment issues—such as deferred pack repairs combined with auxiliary power unit (APU) or preconditioned air (PCA) unit failures—may explain these cases. Notably, of the NASA ASRS reports included in the committee’s analysis that noted one or more specific contributing equipment issues, 25.8 percent cited multiple equipment issues (NASA, 2025).
Flight delays may further contribute to cabin temperature issues by extending ground time, during which temperature control is more challenging, especially under extreme ambient conditions. As shown in Figure B-8, reports of the highest temperatures (greater than 32.2°C, or 90°F) were more common in 2Hot2Cold records involving delays of 30 minutes or more.

SOURCE: Created with data from Nicholls and Vink (2025).

NOTES: Details do not add to 100 because of rounding. N = 4,679.
SOURCE: Created with data from AFA (2025).

NOTES: Numbers in bars represent the percentage of reports for each temperature range stratified by phase of flight. N = 4,679.
SOURCE: Created with 2Hot2Cold data from AFA (2025).

NOTE: N = 46 on ground, 21 in flight, and 24 both. Percentages may not add to 100 due to rounding.
SOURCE: Created with data from NASA (2025).
Variation by Aircraft Manufacturer or Model
There is little indication that cabin temperature issues are specific to any one aircraft manufacturer or model. Data from research studies and aviation industry reporting systems indicate that these issues arise in aircraft from all major manufacturers (i.e., Airbus, Boeing, Embraer, and Mitsubishi [formerly Bombardier]) of commercial aircraft operated under a Part 121 certificate (see for example, Figure B-9).
While not tied to a specific manufacturer or model, an analysis of cabin temperature data from AFA’s 2Hot2Cold app shows that the most extreme temperatures—above 35°C (95°F) and below 10°C (50°F)—are reported more frequently on regional airline flights than on legacy and value carriers (see Figure B-10). These findings may reflect design differences between regional and mainline jets, operational factors such as shorter turnaround times and higher flight frequencies, or a combination of both, as discussed in Chapter 2. For example, ground crews may lack sufficient time to connect PCA units during quick turnarounds, necessitating reliance on the aircraft’s APU for cooling (NASEM, 2019).

SOURCE: Created with 2Hot2Cold data from AFA (2025).
Summary and Implications for Mitigation Strategies
Seasonal and flight phase variation in reports of cabin temperature issues point to summer ground operations as a critical risk period for heat-related discomfort and safety concerns. Elevated boarding temperatures during hot months, combined with operational factors such as delayed cooling or equipment limitations, increase the likelihood of conditions approaching heat stress thresholds. Conversely, cooler outdoor conditions in the fall may lead to overcompensation by heating systems, creating warm discomfort in flight. During winter, however, increased heating is necessary to maintain comfort and prevent excessively cold conditions, underscoring the need for balanced temperature management across all seasons. These patterns suggest the value of mitigation strategies aimed at proactive temperature management during summer ground operations and crewmember training to avoid unnecessary overheating during milder ambient conditions in the fall, while ensuring adequate heating during the winter to maintain thermal comfort.

SOURCE: Created with data from Nicholls and Vink (2025).

SOURCE: Created with 2Hot2Cold data from AFA (2025).
While environmental control systems typically stabilize conditions after takeoff, prolonged ground time combined with equipment limitations or failures can lead to extreme heat or cold exposures. These findings suggest that mitigation strategies focused on ensuring reliable cooling and heating during ground operations, prioritizing the rapid connection of ground-based air conditioning systems, and implementing contingency plans for delays could significantly reduce the risk of temperature-related discomfort and safety concerns.
Extreme cabin temperature events occur across all major aircraft types, but regional operations appear more vulnerable, potentially due to shorter ground times and limited access to PCA. These operational constraints, rather than inherent design flaws, likely drive the observed differences. Among the mitigation strategies that could improve ground cooling practices for regional flights are timely PCA connection and addressing APU reliability to ensure adequate cooling during quick turnarounds. These strategies are addressed further in Chapter 6, which outlines targeted interventions for ground operations and equipment management.
EXAMINING DURATION OF EXPOSURE
Chapter 5 presented in-flight temperature and humidity data from each of three datasets for which individual measurements were available (see Table 5-4). While longitudinal measurements were available for two of the datasets (ACER and ASHRAE 1262), the data presented from all three in Chapters 5 and 6 were at a single point in time—60 minutes into the flight for the Nicholls and Vink dataset, and at the top of descent for the ASHRAE 1262 and the ACER datasets. By picking a particular point in time it was hoped that unbiased data would result, as opposed to selecting data at arbitrary, inconsistent times. Additionally, the points in time used were far enough into the flights to provide a temperature that was representative of cruise conditions.
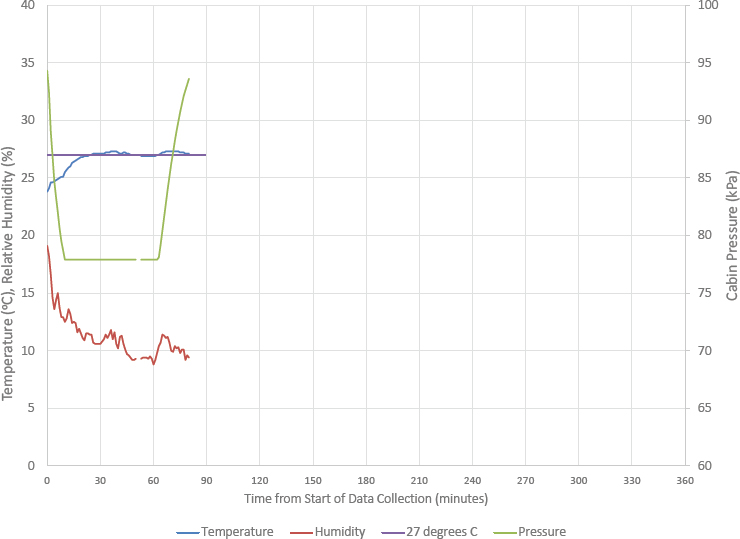
This procedure raises the question, however, of the duration of exposure associated with a given datum. This question is particularly important for hot conditions. A several-hour exposure is far different than exposure for just a few minutes. The ASHRAE 1262 and the ACER datasets include time-based recordings of temperature and humidity. Thus, these datasets include information about duration of exposures in addition to exposure at a given point in time. In order to assess exposure duration, flights for which the temperature was 27°C (80°F) or higher at top of descent—eight in total—were plotted and examined. This temperature is above the allowed range in ANSI/ASHRAE Standard 161-2023. Graphs of cabin temperature, cabin humidity, and cabin pressure are presented in Figures B-11 through B-18 for these flights.
A fairly consistent pattern is seen, with lower temperatures early in the flight that rise and then remain more or less stable, sometimes increasing slightly, during the remainder of the flight. This pattern likely reflects the higher activity levels and the preference for cooler conditions during boarding. There is also, consistently, a decrease in relative humidity as the flight progresses, which may also have some influence on the desired temperatures. There is no reason to expect the cooling capacity of the aircraft environmental control system (ECS) to decrease during cruise. So, every indication is that this increase in temperature is intentional and not due to cooling system inadequacy, as discussed in Chapter 6. Such scenarios are distinct from situations involving elevated cabin temperatures during ground operations when inadequate cooling capacity may be a factor. What is not known is who was providing inputs and making decisions about temperature setpoints during cruise—flight crew, cabin crew, and/or passengers.

NOTE: 27°C (80°F) represents the ANSI/ASHRAE Standard 161-2023 upper allowable limit for in-flight cabin temperature.
SOURCE: Created with data from the ASHRAE-1262 data set (ASHRAE, 2026).
There is one exception to this pattern, flight F005 in Figure B-13, where there is about a 10°C (18°F) abrupt increase in temperature during cruise. There is no information in the dataset concerning the reason for this large change and whether there was an ECS malfunction. It has all the appearance of an inadvertent control setting error (e.g., accidentally set to maximum) since the temperature appeared to be returning to previous values as the recording ended. This particular flight generated the highest cabin temperature in the ASHRAE 1262 dataset.
With respect to the question of exposure duration, these graphs indicate that the temperatures used in the assessments are typically representative of an extended exposure and are not the result of short fluctuations in cabin conditions. Even with the one anomalous flight, the exposure at the elevated temperature was on the order of 20 minutes.

NOTE: 27°C (80°F) represents the ANSI/ASHRAE Standard 161-2023 upper allowable limit for in-flight cabin temperature.
SOURCE: Created with data from the ASHRAE-1262 data set (ASHRAE, 2026).

NOTE: 27°C (80°F) represents the ANSI/ASHRAE Standard 161-2023 upper allowable limit for in-flight cabin temperature.
SOURCE: Created with data from the ASHRAE-1262 data set (ASHRAE, 2026).

NOTE: 27°C (80°F) represents the ANSI/ASHRAE Standard 161-2023 upper allowable limit for in-flight cabin temperature.
SOURCE: Created with data from the ASHRAE-1262 data set (ASHRAE, 2026).
NOTE: 27°C (80°F) represents the ANSI/ASHRAE Standard 161-2023 upper allowable limit for in-flight cabin temperature.
SOURCE: Created with data from the ASHRAE-1262 data set (ASHRAE, 2026).

NOTE: 27°C (80°F) represents the ANSI/ASHRAE Standard 161-2023 upper allowable limit for in-flight cabin temperature.
SOURCE: Created with data from the ASHRAE-1262 data set (ASHRAE, 2026).

NOTE: 27°C (80°F) represents the ANSI/ASHRAE Standard 161-2023 upper allowable limit for in-flight cabin temperature.
SOURCE: Created with data from the ASHRAE-1262 data set (ASHRAE, 2026).

NOTE: 27°C (80°F) represents the ANSI/ASHRAE Standard 161-2023 upper allowable limit for in-flight cabin temperature.
SOURCE: Created with data from the ASHRAE-1262 data set (ASHRAE, 2026).
REFERENCES
ACER (Airliner Cabin Environment Research). 2025. ACER data. Unpublished data document provided to the Committee on Health and Safety Impacts of Aircraft Cabin Temperatures. Available by request through the National Academies’ Public Access Records Office.
AFA (Association of Flight Attendants). 2025. 2HOT2COLD data through 2025-07-31, redacted for NAS. Document provided to the Committee on Health and Safety Impacts of Aircraft Cabin Temperature on September 9, 2025. Available by request through the National Academies’ Public Access Records Office.
APFA (Association of Professional Flight Attendants). 2025. Link for APFA’s hot cabin report form and CERS report data. Document provided to the Committee on Health and Safety Impacts of Aircraft Cabin Temperatures on September 6, 2025. Available by request through the National Academies’ Public Access Records Office.
ASHRAE (American Society of Heating, Refrigerating, and Air-Conditioning Engineers). 2026. 1262 data subset for analysis. Document provided to the Committee on Health and Safety Impacts of Aircraft Cabin Temperatures. Available by request through the National Academies’ Public Access Records Office.
Battelle. 2018. Relate air quality and other factors to comfort and health related symptoms reported by passengers and crew on commercial transport aircraft (part 2). Atlanta, Georgia: ASHRAE.
Cui, W., Q. Ouyang, and Y. Zhu. 2014a. Field study of thermal environment spatial distribution and passenger local thermal comfort in aircraft cabin. Building and Environment 80:213–220.
Cui, W., O. Qin, Y. Zhu, and S. Hu. 2014b. Spatial distribution of thermal environment parameters and its impact on passengers’ comfort in 14 Boeing 737 aircraft cabins. In A. Li, Y. Zhu, and Y. Li (eds.), Proceedings of the 8th International Symposium on Heating, Ventilation and Air Conditioning. Lecture Notes in Electrical Engineering, vol. 261. Berlin: Springer. Pp. 113–120.
Cui, W., T. Wu, Q. Ouyang, and Y. Zhu. 2017. Passenger thermal comfort and behavior: A field investigation in commercial aircraft cabins. Indoor Air 27(1):94–103.
DOT (Department of Transportation). 2025a. U.S air carrier traffic statistics through November 2025. Bureau of Transformation Statistics. https://www.transtats.bts.gov/traffic/ (accessed March 9, 2026).
DOT. 2025b. OACP [DOT Office of Aviation Consumer Protection] response to information request. Document provided to the Committee on Health and Safety Impacts of Aircraft Cabin Temperature on October 21, 2025. Available by request through the National Academies’ Public Access Records Office.
Dumyahn, T., J. Spengler, H. Burge, M. Muilenburg, and N. Nagda. 2000. Comparison of the environments of transportation vehicles: Results of two surveys. In N. L. Nagda (ed.), Air quality and comfort in airliner cabins. West Conshohocken, PA: ASTM International. Pp. 3–25.
EASA (European Union Aviation Safety Agency). 2017. CAQ—Preliminary cabin air quality measurement campaign. Cologne, Germany: European Aviation Safety Agency. https://www.easa.europa.eu/sites/default/files/dfu/EASA%20CAQ%20Study%20Final%20Report_21.03.2017.pdf (accessed Marh 28, 2026).
Gameiro da Silva, M., E. E. Broday, and C. Rodrigues Ruivo. 2023. Indoor climate quality assessment in civil aircraft cabins: A field study. Thermal Science and Engineering Progress 37:101581.
Haghighat, F., F. Allard, A. C. Megri, P. Blondeau, and R. Shimotakahara. 1999. Measurement of thermal comfort and indoor air quality aboard 43 flights on commercial airlines. Indoor and Built Environment 8(1):58–66.
Lee, S. C., C. S. Poon, X. D. Li, and F. Luk. 1999. Indoor air quality investigation on commercial aircraft. Indoor Air 9(3):180–187.
Lindgren, T., and D. Norbäck. 2002. Cabin air quality: Indoor pollutants and climate during intercontinental flights with and without tobacco smoking. Indoor Air 12(4):263–272.
MacGregor, I. C., C. W. Spicer, and S. S. Buehler. 2008. Concentrations of selected chemical species in the airliner cabin environment. Journal of ASTM International 5(8):1–20.
Malmfors, T., D. Thorburn, and A. Westlin. 1989. Air quality in passenger cabins of DC‐9 and MD‐80 aircraft. Environmental Technology Letters 10(6):613–628.
Nagda, N. L., M. D. Koontz, A. G. Konheim, and S. Katharine Hammond. 1992. Measurement of cabin air quality aboard commercial airliners. Atmospheric Environment. Part A. General Topics 26(12):2203–2210.
NASA (National Aeronautics and Space Administration). 2025. ASRS database online. https://asrs.arc.nasa.gov/search/database.html (accessed March 11, 2026).
NASEM (National Academies of Sciences, Engineering, and Medicine). 2019. Optimizing the use of electric preconditioned air (PCA) and ground power systems for airports. Washington, DC: The National Academies Press.
Nicholls, M., and P. Vink. 2025. Perceived and recorded temperature in aircraft cabins during 143 flights. Journal of Aviation Technology and Engineering 14(2):1–16.
O’Donnell, A., G. Donnini, and V. H. Nguyen. 1991. Air quality, ventilation, temperature and humidity in aircraft. ASHRAE Journal April:42–46.
Pierce, W. M., J. N. Janczewski, B. Roethlisberger, and M. G. Janczewski. 1999. Air quality on commercial aircraft. ASHRAE Journal 41:26–34.
RITE (National Air Transportation Center of Excellence for Research in the Intermodal Transport Environment). 2010. Report to the FAA on the airliner cabin environment. https://www.faa.gov/sites/faa.gov/files/data_research/research/med_humanfacs/cer/AirlinerCabinEnvironmentReport.pdf (accessed March 12, 2026).
Ross, D., D. Crump, C. Hunter, E. Perera, and A. Sheridan. 2003. Extending cabin air measurements to include older aircraft types utilized in high volume short haul operation. Watford, UK: Building Research Establishment client report no. 212034. https://www.aerohabitat.eu/uploads/media/10-08-2004_-_Aria_di_bordo_nei_voli_BA_146_e_Boeing_737__800_KB_.pdf (accessed March 28, 2026).
Spengler, J. D., J. Vallarino, E. McNeely, and H. Estephan. 2012. In-flight/onboard monitoring: ACER’s component for ASHRAE 1262, part 2. Airliner Cabin Environmental Research (ACER) Program. https://www.faa.gov/sites/faa.gov/files/data_research/research/med_humanfacs/cer/In-FlightOnboardMonitoring.pdf (accessed March 28, 2026).
Spicer, C., M. Murphy, M. Holdren, J. Myers, I. MacGregor, C. Holloman, R. James, K. Tucker, and R. Zaborski. 2004. Relate air quality and other factors to comfort and health related symptoms reported by passengers and crew on commercial transport aircraft (part 1). Atlanta, Georgia: ASHRAE. https://store.accuristech.com/standards/rp-1262-relate-air-quality-and-other-factors-to-comfort-and-health-symptoms-reported-by-passengers-and-crew-on-commercial-transport-aircraft-part-i?product_id=1717909 (accessed March 28, 2026).
Wang, S., X. Cao, D. Miao, L. Pang, and J. Li. 2024. A review of in-flight thermal comfort and air quality status in civil aircraft cabin environments. Buildings 14(7):2001.
Waters, M., T. Bloom, and B. Grajewski. 2002. Measurements of indoor air quality on commercial transport aircraft. Proceedings of Indoor Air January:782–787.
Wieslander, G., T. Lindgren, D. Norbäck, and P. Venge. 2000. Changes in the ocular and nasal signs and symptoms of aircrews in relation to the ban on smoking on intercontinental flights. Scandinavian Journal of Work, Environment & Health 26(6):514–522.
Yu, N., Y. Zhang, M. Zhang, and H. Li. 2021. Thermal condition and air quality investigation in commercial airliner cabins. Sustainability (Switzerland) 13(13):7047.
This page intentionally left blank.


