Health and Safety Impacts of Aircraft Cabin Temperatures (2026)
Chapter: 4 Applying Standards and Guidelines for Thermal Comfort and Heat and Cold Stress to Aircraft Cabin Occupants
4
Applying Standards and Guidelines for Thermal Comfort and Heat and Cold Stress to Aircraft Cabin Occupants
The committee was charged with reviewing the evidence on the health and safety impacts of cabin temperatures and assessing the applicability and feasibility of applying existing standards on air temperatures and humidity levels to ensure the health and safety of cabin occupants. Chapter 3 described health and safety risks resulting from the physiological, cognitive, and behavioral effects of exposure to hot and cold temperatures. As described in that chapter, health and safety impacts of thermal exposures can result not only from heat and cold stress, but also from thermal discomfort, which, in an aircraft setting, may impair cognitive processes essential to performing flight attendants’ safety critical duties and contribute to unruly passenger behavior. Building on that foundation, this chapter identifies cabin temperature and humidity levels at which discomfort, heat stress, or cold stress may be expected, using established thermal comfort, cold stress, and heat stress standards and guidelines1 applied in the unique context of commercial aircraft.
A central concept in this chapter is the use of thermal response zones—defined for the purposes of this report as ranges of temperature and humidity that correspond to comfort, discomfort, or physiological stress. By comparing available cabin temperature and humidity data with these
___________________
1 For the purposes of this report, the use of the terms “standard” and “guideline” in reference to specific documents reflects the nomenclature used by the bodies that developed the documents. This terminology is not intended to indicate whether compliance is mandatory or voluntary.
combined thresholds, the committee provides a framework for assessing the potential health and safety impacts of reported conditions (see Chapter 5).
This chapter begins with a summary of key thermal comfort and heat/cold stress standards and guidelines, including their scientific basis and limitations. It then describes how these standards and guidelines were applied to classify cabin thermal conditions into different thermal response zones, with supporting tables and figures. The temperature criteria from the aircraft-specific Standard 161 of the American National Standards Institute and the American Society of Heating, Refrigerating and Air-Conditioning Engineers (ANSI/ASHRAE), Air Quality within Commercial Aircraft (ANSI/ASHRAE, 2023a)—detailed in Chapter 2, are examined in relation to these thermal response zones. The chapter ends with a discussion of how such factors as activity level, clothing, humidity, and local cooling via personal air outlets influence the thresholds for comfort and thermal stress and the implications for the existing standards to ensure the safety and health of cabin occupants (discussed further in Chapter 6). This approach provides an objective basis for evaluating whether measured or reported cabin conditions are likely to pose health and safety risks, and it informed the committee’s subsequent findings and recommendations.
THERMAL COMFORT STANDARDS
The committee’s assessment of the applicability of temperature and humidity standards was not limited to those specifically developed for aircraft settings (e.g., ANSI/ASHRAE Standard 161-2023). The study scope was broad and also encompassed thermal standards for enclosed environments intended for public occupancy in general. Two widely used thermal comfort standards developed for the general population in any indoor space are:
- ANSI/ASHRAE Standard 55-2023, Thermal Environmental Conditions for Human Occupancy (ANSI/ASHRAE, 2023b); and
- Standard 7730:2025 of the International Organization for Standardization (ISO), Ergonomics of the Thermal Environment—Analytical Determination and Interpretation of Thermal Comfort using Calculation of the PMV and PPD Indices and Local Thermal Comfort Criteria (ISO, 2025).
Both standards are intended to define indoor environmental conditions under which most occupants are expected to experience thermal comfort.2 In both, the determination of thermal comfort was based on a model developed by Fanger (Charles, 2003). This model estimates how people are likely to perceive their thermal environment by considering a combination of environmental and personal factors, including air temperature, air movement, clothing insulation, and activity level. The primary metric used to assess the suitability of an environment for thermal comfort in this model is the predicted mean vote (PMV), which predicts the average thermal sensation of a large group of people exposed to the same environment (Fanger, 1982). The PMV is described in detail in the following section.
The Fanger Thermal Comfort Model
The Fanger thermal comfort model (Fanger model) estimates thermal comfort by applying an energy balance approach to the human body in a given environment (see below). Specifically, the model compares:
- Required heat loss for a given metabolic activity (i.e., the amount of heat the body must dissipate to maintain thermal equilibrium at a comfortable skin temperature and sweat rate), and
- Actual heat loss that would occur in the specific environment, considering air temperature, radiant temperature, humidity, air movement, clothing insulation, and activity level, with the body at the desired temperature and sweat rate for that activity level for the average adult (Charles, 2003).
The difference between these two values represents the thermal strain experienced by the body. Experimental data linking this thermal strain to individuals’ reported thermal sensation were used to develop the PMV index. The PMV represents the average comfort response of a group of occupants exposed to the same environmental conditions.
The Fanger model is based primarily on a major laboratory study involving 1,600 college-age research participants who were exposed to a variety of environmental conditions and activities (Rohles, 1971). While the initial study population consisted of college-age adults, subsequent research validated the model in a broader adult population (Van Hoof, 2008). Subjective thermal comfort in these studies was evaluated using a discrete 7-point scale, as shown in Table 4-1.
___________________
2 Another widely referenced standard, EN 16798-1:2019, Energy Performance of Buildings (CEN, 2019), also includes thermal comfort requirements for indoor environments; however, because its comfort criteria are based on ISO Standard 7730:2025 (ISO, 2025), it is not reviewed separately here.
TABLE 4-1 Subjective Thermal Comfort Scale
| Descriptor | Value |
|---|---|
| Hot | +3 |
| Warm | +2 |
| Slightly warm | +1 |
| Neutral | 0 |
| Slightly cool | -1 |
| Cool | -2 |
| Cold | -3 |
SOURCE: ©ISO. This material is adapted from ISO 7730:2025 with permission of the American National Standards Institute (ANSI) on behalf of the International Organization for Standardization. All rights reserved.
The PMV index predicts the mean value of the 7-point thermal sensation scale for a large group of people under the same environmental conditions (ISO, 2025). This provides a quantitative basis for defining thermal comfort zones in such standards as ANSI/ASHRAE Standard 55-2023 (ANSI/ASHRAE, 2023b) and ISO Standard 7730:2025 (ISO, 2025).
The PMV was calculated as the average thermal sensation reported by study participants exposed to a range of preselected environmental conditions. The thermal environment was characterized using six key factors (ANSI/ASHRAE, 2023b; ISO, 2025):
- Air temperature: The temperature of the air surrounding the occupant.
- Radiant temperature: A weighted average temperature of surrounding surfaces (e.g., walls, windows, and ceilings), which affects heat exchange by radiation.
- Air humidity: The amount of moisture in the air, influencing evaporative heat loss.
- Air speed: The velocity of air movement, which can enhance heat loss through convection and evaporation (Cramer et al., 2022).3
- Clothing insulation: The thermal resistance of clothing, typically measured in “clo” units. 1 clo = 0. 155 m2 °C/W and corresponds approximately to the clothing insulation provided when wearing a typical men’s two-piece business suit. 0 clo corresponds to a person wearing no clothing.
___________________
3 Convection is the transfer of heat between the skin and the surrounding air as air moves away from the skin. Evaporation is the vaporization of moisture (e.g., sweat) from the skin surface into the external environment (Cramer et al., 2022).
- Metabolic activity: The rate of energy expenditure by the occupant, typically measured in metabolic equivalent of task (MET) units.
By systematically varying these factors, the Fanger model predicts the average thermal sensation (PMV) for a group, enabling the establishment of comfort criteria that can be applied to a wide range of indoor environments, including, with appropriate adjustments and caveats, the aircraft cabin.
It is important to distinguish between the two temperature parameters—air temperature and radiant temperature. In indoor environments, including aircraft cabins, air temperature and radiant temperature are approximately equally important in determining the rate of heat exchange between a person and his or her surroundings. As a result, both play a critical role in determining thermal comfort and heat or cold stress. It is the combination of these two temperatures, rather than air temperature alone, that drives an individual’s perception of an environment as warm, cold, or comfortable (see Chapter 9 [Thermal Comfort] of ASHRAE, 2025).
For some applications, the term “operative temperature” is used. Operative temperature is a theoretical construct used to simplify calculations involving how a person experiences temperature in an enclosed space (ANSI/ASHRAE, 2023b). The simplifying assumption is that the temperature is uniform across the entire enclosure, and then the operative temperature is defined as the temperature that would make a uniform enclosed space feel the same to an occupant as the actual, real-world space with its non-uniform air temperature and radiant temperature. In practice, operative temperature is calculated as a weighted average of the air temperature and radiant temperature. Thus, when describing an environment as hot or cold, it is technically the operative temperature that best represents the thermal experience, not just the air temperature. In many indoor settings, air and radiant temperature are similar, but differences can occur. For example, in cold weather, exterior walls or windows may be cooler than the interior air, lowering the mean radiant temperature. After a rapid change in air temperature, interior surfaces may warm up or cool down more slowly than the surrounding air, creating a temporary mismatch. These distinctions are particularly relevant in the aircraft cabins, where rapid changes in environmental conditions can occur and where both air and surface temperatures contribute to occupants’ thermal comfort and physiological responses.
Over the more than 50 years since the Fanger model was first developed, its reliability and applicability have been extensively evaluated in a wide range of thermal comfort studies (Van Hoof, 2008). These studies have encompassed diverse geographics, ethnic groups, age groups, and indoor environments. Across these varied contexts, the Fanger model has consistently proven to be a robust and reliable basis for predicting thermally comfortable conditions in enclosed, air-conditioned environments.
For any given thermal environment, individuals may experience different levels of subjective comfort. Within a large group, responses can span the entire 7-point thermal sensation scale even when all are wearing the same clothing and are engaged in the same activity in the same environment (Van Hoof, 2008). The PMV index represents the average response of the group and is not intended to predict the response of any specific individual. To address this variability, the concept of predicted percent dissatisfied (PPD) was introduced. In this framework, individuals who report thermal sensations of +1 (slightly warm), 0 (neutral), or -1 (slightly cool) on the 7-point scale are considered satisfied with the thermal environment, while those selecting other values are considered dissatisfied. Fanger established a correlation between PMV and the percentage of dissatisfied occupants, allowing the model to predict the PPD as a function of PMV (Charles, 2003).
While the Fanger model has proven to be a reliable means for evaluating thermal environments, it is not without limitations. The following section discusses some of the limitations that may be particularly relevant for cabin crew and passengers in aircraft.
Limitations of the Fanger Model in the Context of Aircraft Settings
The Fanger model is based on laboratory experiments that used healthy adult subjects across a wide range of ages (Van Hoof, 2008). As a result, it does not necessarily apply to infants, children, and those who are ill, infirm, or who have physical disabilities or medical conditions that affect thermoregulation.
The Fanger model is based on steady-state exposure (Van Hoof, 2008). Most of the data used to develop the model were collected after 3 hours of constant exposure to a given environment. This may not accurately reflect responses to rapidly changing thermal conditions in aircraft, such as those that can occur during boarding, taxiing, or ground delays. Additionally, the model does not account for the effects of prior thermal exposure (e.g., entering a warm cabin from a cold outdoor environment).
The Fanger model assumes that all sweat generated is fully evaporated and does not address the level of skin wettedness required to achieve this evaporation. Skin wettedness, which refers to the subjective perception of moisture on skin, is an important factor for warm thermal discomfort (ASHRAE, 2025). As a result, the model may not accurately reflect the effects of humidity, particularly during periods of elevated activity in warm and humid environments.
In summary, the Fanger model remains a reliable means of identifying indoor conditioned spaces likely to elicit a high level of thermal comfort under steady-state conditions (Van Hoof, 2008). However, it is not intended
to address extreme conditions or associated cold or heat stress, and its applicability is limited in scenarios involving rapid environmental changes, high humidity, or vulnerable populations. Despite these limitations, it continues to serve as a valuable tool and is the specific resource referenced by the thermal comfort standards considered in this report.
Comparison of ANSI/ASHRAE Standard 55-2023 and ISO Standard 7730:2025
Both ANSI/ASHRAE Standard 55-2023 and ISO Standard 7730:2025 use the Fanger model as the primary basis for evaluating indoor environments for thermal comfort (ANSI/ASHRAE, 2023b; ISO, 2025). However, there are important differences in how each standard applies the model and defines the comfort zone. ANSI/ASHRAE Standard 55-2023 defines the comfort zone as the range where the PMV is between -0.5 and +0.5 (-0.5 < PMV < +0.5). This corresponds to a maximum PPD of 10 percent. By contrast, ISO Standard 7730:2025 introduces three classes of comfort environments:
Class A: -0.2 < PMV < +0.2
Class B: -0.5 < PMV < +0.5
Class C: -0.7 < PMV < +0.7
The comfort range specified in ANSI/ASHRAE Standard 55-2023 aligns with Class B in ISO Standard 7730:2025. While ISO Standard 7730:2025 provides detailed information on the parameter limits for each class, it does not prescribe which class should be used for a given application, leaving the decision to the user. This flexibility can be advantageous but also introduces ambiguity when applying the standard to nontraditional environments, such as aircraft cabins.
Both standards are based on the Fanger model’s steady state assumption, developed from data collected after 3 hours of constant exposure and activity (Van Hoof, 2008). However, they differ in how they address non-steady state conditions. ANSI/ASHRAE Standard 55-2023 requires a minimum 15-minute averaging period for non-steady-state conditions and notes that prior exposure (and presumably prior activity) can affect comfort perceptions in a new environment for up to 1 hour (ANSI/ASHRAE, 2023b). ISO Standard 7730:2025 also specifies steady-state conditions but sets explicit limits on the rate of environmental change for the standard to be applicable (ISO, 2025). It addresses step changes (such as entering a new environment) by stating that step increases in operative temperature have an immediate impact on thermal sensation, and the PMV calculation for the new environment applies immediately. For negative step changes in
operative temperature, the initial thermal sensation response overshoots before gradually approaching the steady-state response over about 30 minutes.
These differences highlight the need for careful interpretation when applying either standard to environments with rapidly changing conditions or varying activity levels, as commonly encountered in aircraft cabins. The lack of explicit guidance on which comfort class to use and the steady-state assumptions underlying both standards may limit their direct applicability to the dynamic and heterogeneous conditions present in aircraft cabin operations.
Considerations for Applying Thermal Comfort Standards
In addition to overall thermal sensation, several other factors can contribute to thermal discomfort in an indoor environment. These include
- vertical temperature stratification (temperature differences between floor and ceiling);
- radiant asymmetry (uneven temperatures of surrounding surfaces);
- localized drafts; and
- excessive air speed.
Both ANSI/ASHRAE Standard 55-2023 and ISO Standard 7730:2025 address these factors in detail (ANSI/ASHRAE, 2023b; ISO, 2025). While this chapter focuses on the use of these standards to establish overall thermal limits, it is important to recognize that these additional factors may also influence thermal comfort and should be addressed when applying the standards to aircraft cabins.
A critical step in applying either standard is determining the appropriate values for clothing insulation and activity level (metabolic rate) for the occupants. This can be particularly challenging in environments like aircraft cabins, where occupants have varying activity levels (flight attendants are often active, while passengers are typically sedentary) and where clothing choices vary. Passengers may wear a wide range of clothing, while flight attendants may be required to wear uniforms. Both standards provide guidance and tables for estimating clothing insulation and metabolic rate. If the specific clothing worn is known (e.g., uniforms), clothing insulation can be estimated with reasonable accuracy. For the general public, such as passengers, the diversity of clothing makes it difficult to assign a precise value for clothing insulation. Similarly, metabolic rate can be estimated accurately for sedentary activities (such as seated passengers). However, for active individuals such as flight attendants, metabolic rate may vary
significantly across flight phases and duties, making it more difficult to determine a representative value.
In summary, while thermal comfort standards provide a valuable framework for assessing environmental conditions, their application in aircraft cabins requires adaptation that involves careful consideration of the variability in clothing and activity among occupants as well as of other environmental factors that may influence thermal comfort.
HEAT STRESS GUIDELINES AND STANDARDS
American Conference of Governmental Industrial Hygienists Heat Stress and Strain Guideline
The American Conference of Governmental Industrial Hygienists (ACGIH) develops guidelines for safe levels of workplace exposure to various chemical and physical stressors, including heat and cold (ACGIH, 2022, 2026). Like ANSI/ASHRAE and ISO standards, ACGIH guidelines are not legally enforceable unless adopted by regulatory authorities such as the Occupational Safety and Health Administration (OSHA) or the Federal Aviation Administration (FAA). ACGIH has developed guidelines for threshold limiting values (TLVs) and action limits (ALs) for occupational exposure to hot environments (ACGIH, 2022). The TLVs are “based on the ability of most healthy hydrated acclimatized workers to maintain thermal equilibrium” (ACGIH, 2022). In contrast, the ALs are intended to represent “conditions where most healthy unacclimatized workers can achieve thermal equilibrium” (ACGIH, 2022). For a description of heat acclimatization, see Box 3-2 in Chapter 3.
When environmental conditions exceed the TLVs or ALs, meaning that thermal equilibrium cannot be sustained, the risk of heat exhaustion or heat stroke increases. It is important to note that TLVs and ALs pertain strictly to thermal safety. The guideline also points out that increasing heat stress may lead to “an increased likelihood of errors in judgement, acute injury, and adverse incidents” (ACGIH, 2022), but these additional risks are not considered in establishing the recommended limits.
The ACGIH heat stress and strain guideline uses the wet bulb globe temperature (WBGT) as a comprehensive measure of the thermal environment (ACGIH, 2022). The WBGT is specifically designed to assess heat stress. It incorporates the combined effects of air temperature, thermal radiation (measured by a black globe thermometer), air speed, and ambient humidity.
The WBGT is the wet bulb globe temperature for indoor applications composed of the naturally aspirated wet-bulb temperature exposed to the ambient environment (Tnwb) and the temperature of a black globe exposed
to the ambient environment (Tg) (ACGIH, 2022). For indoor applications, the WBGT is calculated as:
WBGT = 0.7 Tnwb + 0.3 Tg
where
Tnwb = naturally aspirated wet-bulb temperature (°C)
Tg = black globe temperature (°C)
To establish safe exposure limits, the ACGIH provides equations for the WBGT TLV and AL as a function of metabolic rate:
TLVWBGT = 56.7 – 11.5 log10(M)
ALWBGT = 60.0 – 14.1 log10(M)
where
TLVWBGT is the WBGT threshold limit value (°C)
ALWBGT is the WBGT action limit (°C)
M is the metabolic rate (watts)
These equations allow practitioners to determine the maximum safe WBGT for a given level of physical activity, supporting effective heat stress management in occupational and specialized environments such as aircraft cabins.
Some instruments used to measure the WBGT employ a naturally aspirated wet-bulb thermometer and a globe thermometer. However, because the naturally aspirated wet-bulb instrument can be cumbersome to use in practice, most modern WBGT instruments instead measure air temperature, air speed, relative humidity, and globe temperature and then use empirical relationships to calculate the natural wet-bulb temperature (Tnwb). For occupational heat stress assessment, 1-hour time-weighted averages of environmental conditions are required.
The TLV and AL values generated by the above WBGT equations are further adjusted for clothing insulation. For typical clothing worn in aircraft cabins, these adjustments are minimal. Example clothing adjustment values are shown in Table 4-2.
The ACGIH guideline provides recommendations for establishing heat stress management programs when the AL is exceeded. Since flight attendants and passengers are generally not expected to be heat-acclimatized, the ALs are likely the most appropriate limits for application in aircraft cabin environments.
Other Heat Stress Guidelines and Standards
The National Institute for Occupational Safety and Health (NIOSH) provides guidance for heat exposure in the workplace (Jacklitsch et al.,
TABLE 4-2 WBGT Adjustment Values for Clothing
| Clothing | Adjustment to WBGT (°C) |
|---|---|
| Short sleeves and short pants | +1 |
| Long sleeve shirt and long pants | 0 |
| Cloth (woven) coverall over underwear | 0 |
| Double layer clothing | -3 |
NOTE: Higher WBGT can be tolerated with lighter clothing, while heavier clothing decreases the tolerable WBGT.
SOURCE: Adapted from ACGIH (2022); Bernard et al., 2017. ©2017 National Institute of Occupational Safety and Health. CC BY-NC-ND.
2016), and OSHA has used this guidance to inform its proposed rulemaking for heat injury and illness prevention in both outdoor and indoor work settings,4 as discussed in Chapter 1. Similarly, ISO 7243:2017, Ergonomics of the Thermal Environment, Assessment of Heat Stress Using the WBGT (Wet Bulb Globe Temperature) Index (ISO, 2017), provides guidance on heat stress. Both the NIOSH guidance and ISO Standard 7243:2017 closely follow the ACGIH guideline (Jacklitsch et al., 2016; Parsons, 2006), so they are not reviewed separately here. All these guidelines specify exposure limits in terms of the WBGT.
The committee also considered ISO 7933:2023, Ergonomics of the Thermal Environment—Analytical Determination and Interpretation of Heat Stress Using Calculation of the Predicted Heat Strain, which provides an analytically intensive approach for estimating outcomes such as temperature and sweat rate (ISO, 2023). However, ISO 7933:2023 generally requires detailed input parameters and expert interpretation. In contrast, the ACGIH method—and by extension NIOSH and ISO 7243:2017—offers a more readily practical framework for evaluating heat stress risk using easily obtainable measurements.5 For these reasons, the committee determined that the ACGIH approach was the best method for defining heat stress boundaries, while acknowledging that ISO 7933:2023 represents a reasonable alternative.
___________________
4 89 FR 70698, Heat Injury and Illness Prevention in Outdoor and Indoor Work Settings.
5 Notably, FAA’s Aviation Safety Thermal Stress Prevention Program, applicable to FAA aviation safety employees, applies the ACGIH method to the assessment of heat hazards (FAA, 2022).
COLD STRESS STANDARDS
Cold stress guidance differs significantly from heat stress guidance. In cold environments, appropriate clothing can protect a healthy individual from cold stress, even under conditions far colder than those typically encountered in a passenger aircraft cabin. As a result, guidelines for cold conditions generally focus on determining the clothing insulation required for a given temperature exposure and on protecting exposed skin from frostbite, rather than on defining environmental temperature limits for comfort.
ISO Standard 11079:2007, Ergonomics of the Thermal Environment—Determination and Interpretation of Cold Stress when Using Required Clothing Insulation (IREQ) and Local Cooling Effects, provides a method for assessing the required clothing insulation, IREQ, as a function of environmental conditions (ISO, 2007). The standard defines two different values of IREQ:
- Neutral IREQ: The clothing insulation required to minimize body cooling during extended exposure.
- Minimum IREQ: The insulation value that allows some significant body cooling but prevents the body from cooling beyond a safe point. With minimum IREQ, excessive cooling of extremities may still occur during prolonged exposure (ISO, 2007).
ISO Standard 11079:2007 does not specifically address thermal comfort. However, it is reasonable to associate the neutral IREQ value with minimal overall thermal discomfort and the minimum IREQ value with a significant level of overall cold discomfort. The standard is intended for environments at or below 10°C (50°F). Based on available data (see Chapter 5), such cold conditions are rare in aircraft cabins and account for only a very small portion of the thermal environment complaints reviewed by this committee.
APPLICATION OF THERMAL COMFORT AND HEAT AND COLD STRESS STANDARDS AND GUIDELINES FOR AIRCRAFT CABIN SETTINGS
Thermal comfort standards, cold stress standards, and heat stress guidelines can be used to classify thermal conditions into “thermal response zones” ranging from comfort to discomfort and physiological stress. The committee’s approach had two main objectives:
- Provide a basis for comparing the limits established in the aircraft-specific standard, ANSI/ASHRAE Standard 161-2023 (discussed in
- Chapter 2), with the comfort, discomfort, and stress zones defined by other relevant standards and guidelines (ANSI/ASHRAE, 2023a). This comparison is discussed later in this chapter.
- Use these same zones to evaluate measured temperature and humidity conditions from a sampling of flights, determining whether such conditions are likely to result in thermal discomfort or thermal stress. These comparisons are presented in Chapter 5.
It is important to note that thermal response varies considerably among individuals. The standards and guidelines applied here are intended to represent average responses for healthy adults and may not reflect the experience of every individual. For the purposes of this analysis, thermal conditions were categorized into the following zones:
- Cold stress: Conditions sufficiently cold to raise health concerns.
- Cold discomfort: Conditions that some or most people will find uncomfortably cold but that typically would not pose a health risk to a healthy adult.
- Comfortable: Conditions that most people would find acceptable.
- Hot discomfort: Conditions that some or most people will find uncomfortably warm but that typically would not pose a health risk to a healthy adult.
- Heat stress: Conditions sufficiently warm to raise health concerns.
To define the boundaries between these zones, the committee used the objective criteria provided by the referenced standards and guidelines. However, it should be recognized that there is some inherent arbitrariness in setting these boundaries, and the transition from one zone to another is gradual rather than abrupt. Finally, it is also important to emphasize that thermal discomfort—even when not reaching the level of heat or cold stress—can still have physiological, cognitive, and behavioral effects that pose safety risks, as discussed in Chapter 3.
All of the standards and guidelines that the committee used to establish the boundaries are typically intended for land-based application. The question then arises as to whether it is reasonable to use them to establish boundaries for aircraft applications. From a physical environment perspective, a key difference between an aircraft cabin environment and a land-based enclosed environment is the high altitude of the aircraft during much of a typical flight. However, modern aircraft use pressurized cabins that maintain the air pressure equivalent to a surface elevation no higher than 8,000 feet (2,428 meters) elevation. The term cabin altitude is typically used to describe cabin pressure where cabin altitude is defined as the surface elevation that has an atmospheric pressure equal to the pressure in
the cabin. Typical cabin altitude during cruise ranges from 6,000 to 8,000 feet (1,828 to 2,428 meters). Neither ANSI/ASHRAE Standard 55-2023 nor ISO Standard 7730:2025 states specifically that it applies to aircraft, but neither standard has provisions that would exclude application to aircraft. ANSI/ASHRAE Standard 55 states in its scope that it is applicable to elevations up to 10,000 feet or 3,000 meters, which exceeds the range of cabin altitudes. ISO Standard 7730:2025 does not have a similar statement in its scope, and there is no mention of limits of elevation or ambient air pressure in the standard. Similarly, neither the ACGIH heat stress and strain guidelines nor ISO Standard 11079:2007 states that it is applicable to aircraft, but neither has any provisions that would exclude aircraft application. Given this lack of elevation limitation in the standards and guidelines and the fact that cabin altitudes fall within the range of elevations that the standards and guidelines would be used for with land-based applications, it is reasonable to apply them to aircraft cabins. It should be kept in mind that the purpose of the calculated boundaries is not to determine whether given cabin conditions comply with the various standards and guidelines but rather to provide an objective means to establish cabin conditions in which thermal comfort, thermal discomfort, and thermal stress may be expected.
Calculation of Comfort and Heat and Cold Stress Zones
Calculations based on ANSI/ASHRAE Standard 55-2023 or ISO Standard 7730:2025 can be used to establish a thermal comfort zone for specific activity levels and clothing insulation (ANSI/ASHRAE, 2023b; ISO, 2025). While both standards are based on the Fanger model, they implement certain aspects differently, particularly regarding the effect of body movement on effective air speed and clothing insulation (Tartarini and Schiavon, 2025). These differences can lead to variations in the PMV values for some conditions, especially at higher activity levels. However, for comfort conditions defined by PMV values between –0.5 and +0.5, the resulting temperature ranges are generally similar.
The PMV range used as the comfort criteria in ANSI/ASHRAE Standard 55-2023 is equivalent to Class B in ISO Standard 7730:2025. One distinction is that ANSI/ASHRAE Standard 55-2023 uses operative temperature (a weighted average of air and radiant temperature), while ISO Standard 7730:2025 requires separate inputs for air temperature and radiant temperature. For simplicity and consistency, the comfort ranges used in this report are based on ISO Standard 7730:2025. The committee used a thermal comfort tool developed by the Center for the Built Environment (Tartarini et al., 2020) under ASHRAE sponsorship, which calculates PMV according to both standards. For the analyses and figures presented in this
chapter, the ISO Standard 7730:2025 implementation with PMV limits of +0.5 and –0.5 was used to define the comfort zone boundaries.
The ACGIH WBGT ALs were used to establish the lower temperature boundary for the heat stress zone, based on specific activity and clothing values. To determine the combinations of relative humidity and temperature that correspond to specified WBGT values, an empirical WBGT calculator was used (Perry, 2025). Because WBGT is a measured index and there is no universally accepted mathematical formula linking WBGT to its underlying parameters, these estimates should be interpreted as approximations rather than exact values. Importantly, the ACGIH guidelines state that the ALs calculated using the formulae provided underestimate exposure at both high humidity and low humidity. The guidelines do not provide any specific guidance as to what constitutes a high or low humidity or how the ALs should be modified to account for this underestimate. The data for thermal conditions in aircraft reviewed did not include any high humidity conditions, and the temperatures at low humidity were all well below the ALs (see Chapter 5). Thus, this limitation at high and low humidity was not a factor in making assessments of the data. However, these limitations should be recognized if the boundaries calculated are applied in other settings.
For cold stress, ISO Standard 11079:2007 was used to define the cold stress zone by calculating the minimum required clothing insulation (minimum IREQ) (ISO, 2007). The air temperature value was adjusted until the minimum required insulation matched the specified clothing insulation. Since the online tool referenced in the standard is no longer available, an alternative tool developed by Lund University (Lund University, 2022) was used for these calculations (see Appendix A for details). ISO Standard 11079:2007 recommends that it not be applied for conditions warmer than 10°C (50°F), and the online tool does not allow calculations above this threshold (ISO, 2007). As a result, it was not feasible to establish cold stress boundaries for lighter clothing and lower activity levels. However, even though these boundaries could not be explicitly calculated, they do exist and would occur at temperatures above 10oC (50oF).
For all calculations, regardless of the standard used, the radiant temperature was set equal to the air temperature. Thus, the temperature input into the calculations should be considered the operative temperature. In most cases, air temperature and radiant temperature are expected to be very similar in an aircraft cabin. However, exceptions can occur under the following conditions:
- If a heat-soaked aircraft (exposed to high ambient temperatures) is boarded while still cooling, the interior surfaces may remain warmer than the cabin air, resulting in a radiant temperature higher than the air temperature.
- Conversely, in a cold-soaked aircraft (exposed to low ambient temperatures), the radiant temperature may be lower than the air temperature while the cabin is warming up.
Additionally, the close proximity of passengers in an aircraft cabin means that the radiant temperature that the passengers experience will be increased above the air temperature due to the presence of the other warm bodies, and the more crowded the aircraft, the greater the impact. No data were found to quantify this effect, however. Where applicable, solar radiation was set to zero. While solar radiation external to the aircraft may well affect the thermal conditions within the aircraft, occupants of the aircraft are exposed directly to minimal solar radiation, and it is generally not a significant factor in the heat exchange between them and their surroundings. More detailed descriptions of the calculation methods for each standard or guideline can be found in Appendix A.
The regions between the upper comfort limit and the onset of heat stress are labeled as “hot discomfort,” while regions between the lower comfort limit and the onset of cold stress are labeled as “cold discomfort.” It is important to recognize that the transitions from comfort to discomfort and from discomfort to stress are gradual and continuous, rather than abrupt. For example, the experience of discomfort just above the comfort limit can be quite different from the experience just below the threshold for heat or cold stress. These thermal response zones are intended to be broadly applicable to healthy adults. However, individual responses can vary considerably, and a given person may experience discomfort or stress at different thresholds than the average. Additionally, these zones may not be applicable for certain vulnerable populations, such as older adults, infants and young children, or individuals with health conditions that affect thermoregulation.
To determine the comfort limits and ALs, it is necessary to specify both the metabolic rate and the clothing insulation for the occupants. Anecdotal evidence suggests that many instances of hot cabin conditions occur during ground operations, particularly during and after boarding (see Chapter 5 and Appendix B). To reflect realistic conditions across different phases of flight, the committee considered six case scenarios that capture the potential variability in both clothing insulation (typical, warm, light) and activity levels (busy, light) that may be encountered by flight attendants and passengers (see Table 4-3). While passengers are primarily expected to be sedentary after boarding, the scenarios for flight attendants include both moderate and light activity levels to account for the range of duties performed during a flight. Details on the estimation of metabolic rates for these scenarios are provided in Appendix A.
| Casea | Case Scenario Description | Clothing Insulation (clo)b | Metabolic Rate (MET)c |
|---|---|---|---|
| 1 | Busy flight attendant, typical clothing | 0.6 | 2.3 |
| 2 | Seated passenger or flight attendant, typical clothing | 0.6 | 1.2 |
| 3 | Busy flight attendant, warm clothing | 1.0 | 2.3 |
| 4 | Seated passenger or flight attendant, warm clothing | 1.0 | 1.2 |
| 5 | Busy flight attendant, light clothing | 0.4 | 2.3 |
| 6 | Seated passenger or flight attendant, light clothing | 0.4 | 1.2 |
a For all cases, it is assumed that radiant temperature equals air temperature and air speed equals 0.2 m/s, representing aircraft cabin conditions without personal air outlets operating.
b Clothing insulation also includes the insulation provided by the seat for the 1.2-MET activity as it is presumed to apply to a seated individual. The contribution of aircraft seat insulation varies depending on clothing worn (Wu et al., 2016) and occupant posture but could be up to 0.2 clo for case 2. At 2.3-MET activity, the person is not likely to be seated, and seat insulation is not a factor.
c The process used by the committee for estimating different possible metabolic rates for flight attendants and passengers is described in Appendix A.
Thermal Response Zones Across Case Scenarios for the Aircraft Cabin6
Figures 4-1 and 4-2 illustrate thermal response zones—specifically, comfort, hot and cold discomfort, and heat and cold stress—based on the application of the relevant standards and guidelines for two representative cases:
- Case 1: Busy flight attendant, typical clothing (0.6 clo, 2.3 MET).
- Case 2: Seated passenger or flight attendant, typical clothing (0.6 clo, 1.2 MET).
___________________
6 The graphs included in this section of the report are intended solely to illustrate how existing standards and guidelines might be used to assess the suitability of cabin thermal environments. The cited standards and guidelines are complex and incorporate many factors. Simplifications, approximations, and assumptions were made in generating these graph templates, which are not intended for design or evaluation purposes. For detailed design or compliance assessments, readers should consult the original standards and guidelines referenced in this report.
The curvilinear boundaries of the zones in the figures reflect the influence of humidity on thermal comfort and stress. Also shown on the graphs are the target temperature ranges and upper limits from ANSI/ASHRAE Standard 161:2023 (ANSI/ASHRAE, 2023a), providing a context for how the standard aligns with human comfort and safety. This standard defines three operative temperature ranges for aircraft cabins (see Table 2-1 in Chapter 2):
- Target range: Applies both in flight and on the ground.
- Extended upper limit: Increases the allowable upper temperature limit and applies in flight regardless of in-flight entertainment (IFE) operation as well as on the ground when IFE is not operating.
- Extended ground operation upper limit (with IFE): Further increases the upper temperature limit but only for ground operations when all IFE systems are operating.
There is no extension of the allowable range to temperatures below the target range. Importantly, the temperature specifications in the standard do not account for humidity variation and are intended to apply at all humidity levels. It should be noted that there is no physiological basis for allowing higher upper temperature limits when IFE is operating. These extensions likely reflect operational constraints associated with ground operations and IFE use rather than differences in human thermal response.
For higher activity levels (e.g., Case 1, busy flight attendants), the ANSI/ASHRAE Standard 161-2023 target temperature range is generally consistent with the comfort zone calculated using established thermal comfort standards (ISO Standard 7730:2025). This means that for active flight attendants, the recommended temperatures in ANSI/ASHRAE Standard 161-2023 are likely to provide acceptable thermal comfort under most conditions. The extended allowable temperature of 26.7°C (80°F) in ANSI/ASHRAE Standard 161-2023 for both in-flight operations and ground operations without IFE aligns reasonably well with the upper comfort limit when activity levels are lower (e.g., Case 2, seated passengers or inactive flight attendants). However, at the lower end of the ANSI/ASHRAE Standard 161-2023 target range, there is potential for considerable cold discomfort among sedentary occupants. This is because the comfort zone for low-activity individuals shifts upward, making them more susceptible to feeling cold at temperatures that might be comfortable for more active individuals.
Complaint and safety data related to cabin temperatures (see Chapter 5) indicate that the vast majority of reports concern heat-related discomfort rather than cold, at least in terms of overall thermal sensation. This suggests that, in practice, hot cabins are a more frequent and pressing concern for both passengers and cabin crew, while cold discomfort—though
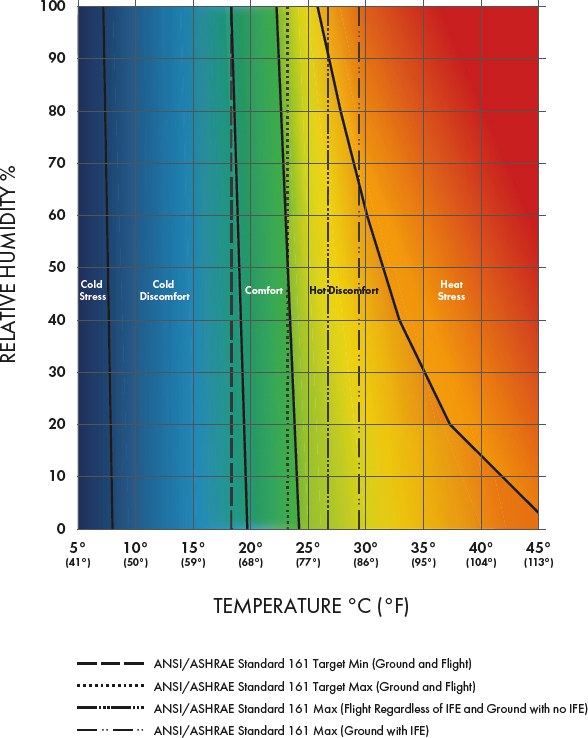
NOTES: The green comfort zone is bounded by the upper and lower limits from application of the ISO 7730:2025 thermal comfort standard. The red heat stress zone is bounded by the action limits from the ACGIH guideline. Importantly, the action limits may underestimate exposure at high and low humidity and the boundaries should not be applied outside the scope of this study. The yellow hot discomfort zone is defined as the space between the comfort and heat stress zones. Similarly, the upper limit for the dark blue cold stress zone is defined by the application of ISO Standard 11079:2007, and the light blue cold discomfort zone is defined as the space between the cold stress and comfort zones. ANSI/ASHRAE Standard 161-2023 target and extended limits are overlaid for comparison. Curvilinear zone boundaries are due to the large influence of humidity when addressing heat stress. Shading indicates that the transitions from comfort to discomfort and from discomfort to stress are gradual and continuous rather than abrupt, and it reflects the variation in individual-level tolerances. Exposure duration is not depicted, but effects are not instantaneous; the potential for negative health effects and greater severity increases with longer durations of exposure. IFE = in-flight entertainment.

NOTES: The boundary between cold stress and cold discomfort could not be precisely defined as it is above 10oC (50oF), the upper limit of ISO Standard 11079:2007. The lower range of the blue zone is in the cold stress zone, and the upper range of the blue zone is in the cold discomfort zone. The green comfort zone is bounded by the upper and lower limits from application of the thermal comfort standard. The red heat stress zone is bounded by the action limits from the ACGIH guideline. Curvilinear zone boundaries are due to the large influence of humidity when addressing heat stress. Importantly, the action limits may underestimate exposure at high and low humidity, and the boundaries should not be applied outside the scope of this study. The yellow hot discomfort zone is defined as the space between the comfort and heat stress zones. The ANSI/ASHRAE Standard 161-2023 target and extended limits are overlaid for comparison. Shading indicates that the transitions from comfort to discomfort and from discomfort to stress are gradual and continuous rather than abrupt, and it reflects the variation in individual-level tolerances. Exposure duration is not depicted, but effects are not instantaneous; the potential for negative health effects and greater severity increases with longer durations of exposure. IFE = in-flight entertainment.
possible, especially at the lower end of the standard’s range—is less commonly reported.
At lower to medium relative humidities, the calculated comfort ranges for both active and sedentary occupants are well below the ACGIH occupational ALs for heat stress. This provides a substantial safety margin: Temperatures can exceed the upper comfort limit somewhat before reaching levels associated with undue heat exposure risk for healthy unacclimatized workers.
However, as relative humidity increases, the upper comfort limit and ACGIH AL begin to converge. This convergence is concerning because the Fanger model (on which thermal comfort standards are based) is less reliable at high humidity and elevated activity. As a result, the “comfort” zone may extend to conditions that are tolerable for healthy workers but could be quite uncomfortable, or even unsafe, for aircraft cabin occupants, particularly for vulnerable groups such as infants, young children, older adults, or those with compromised health.
This issue is especially relevant for the extended upper temperature limits allowed by ANSI/ASHRAE Standard 161-2023 during ground operations with IFE operating (i.e., 29.4°C/85°F). At high humidity, these limits may fall within or near the heat stress zone for active flight attendants and approach it even at lower activity levels. It is important to note that relative humidity—which cannot be controlled on aircraft in the same manner as temperature—is typically quite low during flight (see Chapter 5), so these concerns are most acute during ground operations, especially in hot, humid climates or when ventilation systems are not fully operational.
Figures 4-1 and 4-2 illustrate that the extended temperature limits permitted by ANSI/ASHRAE Standard 161-2023 may not be appropriate if low humidity is not maintained during ground operations. At higher humidity, the safety margin narrows and the risk of heat stress increases, even at temperatures that would otherwise be considered acceptable. Real-world temperature and humidity data during aircraft boarding phases relative to the thermal response zones are presented in Chapter 5 (see Figure 5-9).
Compensatory Effects of Clothing and Local Cooling on Thermal Comfort
Figures 4-1 and 4-2 illustrate the challenge of providing cabin conditions that are comfortable for the full range of activity levels encountered in an aircraft. As shown in Figure 4-3, the comfort zones for Case 1 (high activity, such as a busy flight attendant) and Case 2 (low activity, such as a seated passenger) do not overlap. This means that only a very narrow range of temperatures is likely to be generally acceptable for both groups. Even within these designated comfort zones, individual differences—such as personal sensitivity, health status, or clothing choices—mean that some

occupants will still experience discomfort, feeling either too hot or too cold. This lack of overlap highlights the importance of compensatory strategies that enable behavioral responses, such as clothing adjustments or the use of localized cooling mechanisms (e.g., personal air outlets), to help accommodate the diverse thermal needs of both cabin crew and passengers and lessen the risk of heat or cold strain. While cabin occupants may not always have control over clothing or local air ventilation, without such measures it is nearly impossible to maintain a single cabin temperature that ensures comfort for everyone on board.
Compensatory Effects of Clothing
Clothing is an important factor to consider in the aircraft cabin environment, given the variety of garments and resulting insulation that individuals
might wear on a given flight. For example, on a flight from a cold to a warm environment, some people may dress for the originating colder climate, while others may dress for the warmer destination. Additionally, clothing choices are sometimes made for reasons other than thermal comfort. Still, the ability to individually adapt clothing is a powerful means to improve thermal comfort, as individuals can adjust their clothing—to some extent—according to their activity level and thermal preference. There are limits to how much clothing can be removed (especially in public settings), but generally there are fewer limits to how much can be added. Thus, clothing options are more effective for mitigating cold discomfort than for mitigating warm discomfort.
Figure 4-4 demonstrates both the challenge and the opportunity associated with variation in clothing. On the one hand, it is difficult to specify a single set of thermal conditions that is suitable for the wide range of clothing insulation people might wear on a given flight. On the other hand, individuals can achieve comfort across a wide range of thermal conditions
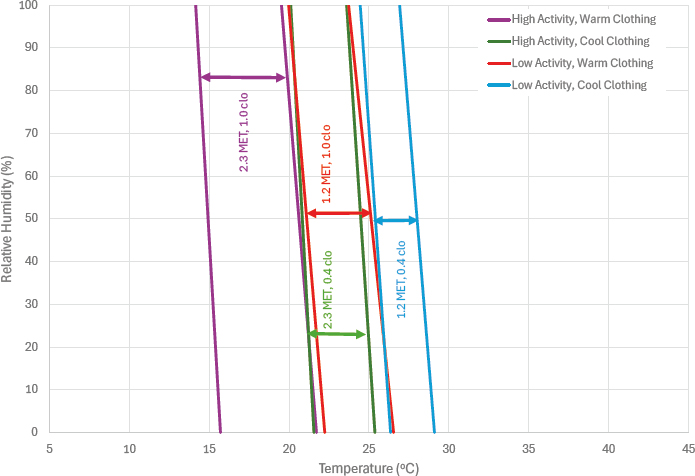
NOTES: Case scenarios are described in Table 4-3. Upper and lower limits for comfort zones were derived from applying the thermal comfort standard, ISO Standard 7730:2025, while varying activity and clothing level inputs. Comfort zone for the high activity (2.3 MET) with cool clothing case (0.4 clo) case (green lines) overlaps nearly completely with the comfort zone for the low activity (1.2 MET) with warm clothing (1 clo) case (red lines).
if they are willing and able to adapt their clothing as needed. For example, the comfort zones for Case Scenario 3 (high activity, warm clothing) and Case Scenario 6 (low activity, cool clothing) do not overlap at all, making it impossible to find a common temperature that would be widely acceptable to both groups. Conversely, Case 4 (low activity, warm clothing) and Case 5 (high activity, cool clothing) overlap almost perfectly, showing that clothing flexibility and choices can allow acceptable common thermal conditions for a wide range of activities. In summary, clothing adjustments can allow a wide range of temperatures to be acceptable for a given activity level.
Compensatory Local Cooling Effects Through Use of Personal Air Outlets
As described in Chapter 2, many aircraft are equipped with personal air outlets7 located above each passenger seat. Personal air outlets are an airline-selectable option and are more prevalent on standard-body (single-aisle) aircraft than on wide-body (dual-aisle) aircraft. Passengers can independently control both the flow rate and direction of air from their personal air outlets. This localized airflow can provide a cooling effect due to its elevated velocity. When the air from the personal air outlets is supplied from the environmental control system mix manifold, it is typically cooler than the surrounding cabin air, providing an additional cooling benefit. Personal air outlets are a required feature under ANSI/ASHRAE Standard 161-2023 for flight attendant work and seating areas (ANSI/ASHRAE, 2023a).
This localized cooling allows a degree of individual thermal control (adaptive behavioral response) and can mitigate sensations of excessive warmth as well as of hot discomfort and heat stress. Accordingly, the presence of personal air outlets in an aircraft cabin is expected to result in a modest upward adjustment of the upper limits of both the comfort zone and the hot discomfort zone depicted in Figure 4-2 for passengers who choose to use them.
Du et al. (2017) conducted experiments to quantify the effect of personal air outlets on thermal sensation at airflow rates ranging from 0.67 to 1.45 L/s (1.4 to 3.0 cfm). At the highest flow rates, the researchers observed a reduction in overall thermal sensation of approximately 0.5 to 0.65 on the same scale as used for PMV, with smaller reductions at lower flow rates. In these experiments, the temperature of the air emitted from the personal air outlet was the same as the cabin air temperature. Air supplied at a temperature lower than the cabin air would be expected to provide a greater cooling effect. Given that the ±0.5 PMV (1-vote range) comfort zone is approximately 4–5°C (7–9°F), as shown in Figure 4-3, the observed reduction in thermal sensation with personal air outlets in the study by Du et al.
___________________
7 Sometimes called gaspers or gasper vents.
could correspond to a shift of about one-half this amount, roughly 2–3°C (3.5–4.5°F) in the thermal zones depicted in Figure 4-2.
This benefit, however, is accompanied by increased localized air velocity directed toward the upper body, which may not be well tolerated by all occupants. Both ANSI/ASHRAE Standard 55-2023 and ISO Standard 7730:2025 provide guidance on acceptable limits for localized elevated air speeds to address potential discomfort.
Rankin et al. (2000) conducted a large-scale passenger comfort study which included 3,630 completed passenger surveys across six different aircraft models. One objective of the study was to assess both the perceived importance of personal air outlets and their actual use. Among respondents on aircraft equipped with personal air outlets, 72 percent (724 of 1006 respondents) reported using them during the flight, indicating that personal air outlets are widely valued by passengers. Using a 7-point importance scale (1 = not important, 7 = extremely important), respondents rated personal air outlets an average importance of 5.7 on standard-body aircraft and 4.9 on wide-body aircraft. Because personal air outlets are not installed on all aircraft, no adjustments were made in this report to the comfort and discomfort zones to explicitly account for their effects. Nevertheless, the combined findings of these studies indicate that personal air outlets can improve thermal sensation under warm cabin conditions, are frequently used when available, and are widely perceived by passengers as important. As such, personal air outlets represent a meaningful, though limited, means of improving thermal comfort and mitigating hot discomfort and heat stress.
CONCLUDING REMARKS
In summary, this chapter reviewed existing thermal comfort and heat/cold stress standards and guidelines and demonstrated an approach for applying them to the aircraft cabin environment. This analysis highlighted the significant impacts of humidity, activity level, clothing, and local cooling mechanisms on thermal comfort and risk and illustrated how these factors interact to shape the thermal experience of both passengers and flight attendants. By establishing thermal comfort and stress zones for various scenarios, the chapter provided a framework for evaluating the adequacy of existing standards, such as ANSI/ASHRAE Standard 161-2023, in protecting the health and safety of aircraft cabin occupants. The findings presented in this chapter inform the committee’s charge to assess the applicability of existing standards for ensuring occupant health and safety (discussed further in Chapter 6) and provide the foundation for the following conclusions:
Conclusion 4-1: Thermal comfort standards may not accurately reflect the impact of humidity at higher activity levels, particularly with respect to hot discomfort. This limitation may result in underestimating the risk of thermal discomfort for active occupants in humid conditions.
Conclusion 4-2: The lack of inclusion of humidity effects in ANSI/ASHRAE Standard 161-2023 may restrict its applicability to situations where humidity is low, such as during flight. The temperature criteria in the standard may not accurately reflect comfort requirements where humidity or activity levels may be elevated, such as during ground operations.
Conclusion 4-3: The lower limits of the ANSI/ASHRAE Standard 161-2023 target temperature range may result in substantial cold discomfort for sedentary occupants. Conversely, the special exemption and higher upper temperature limits in ANSI/ASHRAE Standard 161-2023, when all IFE are operating during ground operations, may result in substantial hot discomfort and, potentially, heat stress if cabin humidity is high.
Conclusion 4-4: Clothing can help mitigate discomfort associated with both cool or warm conditions, providing individual control and allowing occupants to better manage their personal thermal comfort. However, there may be limits to the compensatory effects of clothing adjustments on thermal stress.
Conclusion 4-5: Personal air outlets have the potential to improve thermal comfort, modestly expand the comfort zone, and provide some mitigation of hot discomfort. Their installation and use in aircraft provides a means for reducing the effects of excessively warm cabin temperatures.
Conclusion 4-6: Given human variability, the range of activities of aircraft occupants, and limitations on clothing selection for thermal comfort, there is no one set of thermal conditions that all cabin occupants will find comfortable regardless of the effectiveness of aircraft thermal control systems. However, guidelines can be developed that would meet the needs of the large majority of the cabin occupants and mitigate health and safety risks.
REFERENCES
ACGIH (American Conference of Governmental Industrial Hygienists). 2022. Heat and stress strain. https://www.acgih.org/heat-stress-and-strain-2/ (accessed March 6, 2026).
ACGIH. 2026. TLV/BEI guidelines. https://www.acgih.org/science/tlv-bei-guidelines/ (accessed March 6, 2026).
ANSI/ASHRAE (American National Standards Institute/American Society of Heating, Refrigerating and Air-Conditioning Engineers). 2023a. Standard 161-2023: Air quality within commercial aircraft. Peachtree Corners, GA: ANSI/ASHRAE. https://store.accuristech.com/products/preview/2577503 (accessed March 19, 2026).
ANSI/ASHRAE. 2023b. Standard 55-2023: Thermal environmental conditions for human occupancy. American Society for Heating Refrigerating and Air-Conditioning Engineers. https://webstore.ansi.org/standards/ashrae/ansiashraestandard552023 (accessed March 19, 2026).
ASHRAE (American Society of Heating, Refrigerating and Air-Conditioning Engineers). 2025. ASHRAE handbook—Fundamentals. Chapter 9: Thermal comfort. Peachtree Corners, GA: ASHRAE.
Bernard, T. E., C. D. Ashley, X. P. Garzon, J. H. Kim, and A. Coca. 2017. Prediction of WBGT-based clothing adjustment values from evaporative resistance. Industrial Health 55(6):549–554.
CEN (European Committee for Standardization). 2019. Energy performance of buildings: For non-residential buildings, European standard EN 16798-3:2017. Brussels: European Committee for Standardization.
Charles, K. E. 2003. Fanger’s thermal comfort and draught models. IRC Research Report RR-162. Ottowa, Canada, Institute for Research in Construction, National Research Council of Canada.
Cramer, M. N., D. Gagnon, O. Laitano, and C. G. Crandall. 2022. Human temperature regulation under heat stress in health, disease, and injury. Physiological Reviews 102(4):1907–1989.
Du, X., B. Li, H. Liu, Y. Wu, and T. Cheng. 2017. The appropriate airflow rate for a nozzle in commercial aircraft cabins based on thermal comfort experiments. Building and Environment 112:132–143.
FAA (Federal Aviation Administration). 2022. Aviation Safety (AVS) Thermal Stress Prevention Program (TSPP). Order VS 3900.82. https://www.faa.gov/regulations_policies/orders_notices/index.cfm/go/document.information/documentID/1040716 (accessed March 15, 2026).
Fanger, P. 1982. Thermal comfort: Analysis and applications in environmental engineering. Copenhagen, Denmark: Danish Technical Press.
ISO (International Organization for Standardization). 2007. ISO standard 11079:2007: Ergonomics of the thermal environment, Determination and interpretation of cold stress when using required clothing insulation (IREQ) and local cooling effects. Geneva: International Organization for Standardization. https://www.iso.org/standard/38900.html (accessed March 19, 2026).
ISO. 2017. ISO standard 7243: Ergonomics of the thermal environment, assessment of heat stress using the WBGT (wet bulb globe temperature) index. Geneva: International Organization for Standardization. https://www.iso.org/standard/67188.html (accessed March 19, 2026).
ISO. 2023. ISO standard 7933:2023: Ergonomics of the thermal environment—Analytical determination and interpretation of heat stress using calculation of the predicted heat strain. https://www.iso.org/standard/78240.html (accessed May 18, 2026).
ISO. 2025. ISO standard 7730: Ergonomics of the thermal environment. Geneva: International Organization for Standardization. https://webstore.ansi.org/standards/iso/ISO77302025 (accessed March 19, 2026).
Jacklitsch, B., J. Williams, K. Musolin, A. Coca, J. H. Kim, and N. Turner. 2016. NIOSH criteria for a recommended standard: Occupational exposure to heat and hot environments. NIOSH publication no. 2016-106. Washington, DC: U.S. Department of Health and Human Services, Centers for Disease Control and Prevention, National Institute for Occupational Safety and Health. https://www.cdc.gov/niosh/docs/2016-106/ (accessed March 18, 2026).
Lund University. 2022. Calculations for IREA and WCT. https://www.design.lth.se/english/thedepartment/research-laboratories/aerosol-climate-laboratory/climate/tools/calculations-for-ireq-and-wct/ (accessed October 20, 2025).
Parsons, K. 2006. Heat stress standard ISO 7243 and its global application. Industrial Health 44(3):368–379.
Perry, C. 2025. Calculate wet bulb globe temperature: Outdoor WBGT calculator. https://perryweather.com/resources/what-is-wbgt-and-how-do-you-calculate-it/ (accessed October 20, 2025).
Rankin, W. L., D. R. Space, and N. L. Nagda. 2000. Passenger comfort and the effect of air quality. In N. L. Nagda (ed.), Air quality and comfort in airliner cabins. West Conshohocken, PA: ASTM International. Pp. 269–290.
Rohles, F. H. 1971. Thermal sensations of sedentary man in moderate temperatures. Human Factors 13(6):553–560.
Tartarini, F., and S. Schiavon. 2025. Comparative analysis of PMV models accuracy implemented in the ISO 7730:2005 and ASHRAE 55:2023. Building and Environment 275:112766.
Tartarini, F., S. Schiavon, T. Cheung, and T. Hoyt. 2020. CBE thermal comfort tool: Online tool for thermal comfort calculations and visualizations. SoftwareX 12:100563.
Van Hoof, J. 2008. Forty years of Fanger’s model of thermal comfort: Comfort for all. Indoor Air 18(3):182–201.
Wu, T., W. Cui, B. Cao, Y. Zhu, and Q. Ouyang. 2016. Measurements of the additional thermal insulation of aircraft seat with clothing ensembles of different seasons. Building and Environment 108:23–29.


