American Hazardscapes: The Regionalization of Hazards and Disasters (2001)
Chapter: 5 Trends in Disaster Losses
CHAPTER 5
Trends in Disaster Losses
Jerry T. Mitchell and Deborah S. K. Thomas
Fatalities and economic losses from disasters are rising. Although a worldwide phenomena, these losses are not uniformly distributed geographically or through time. The juxtaposition of hazard events and vulnerable populations varies spatially and, consequently, so do losses. A direct relationship exists between the level of development and the type of losses that predominately occur. In developing nations, the death toll from disasters is much higher than in more developed countries (IFRCRCS 1998, CRED 2000). In the United States and other parts of the developed world, the escalation in losses is most profound in economic terms (van der Wink et al. 1998, Munich Re 2000). What is driving this upward course of losses? If this nation is indeed becoming more disastrous, is a rise in physically damaging events responsible? Are the trends a mere artifact of better reporting of loss data? Is it a symptom of ill-regarded choices made through our social, political, and economic systems? Or, is it some combination of all of these?
As we mentioned in the previous chapter, the compilation of loss data is fraught with difficulties. The most significant is that the data we have only report a portion of the true losses (damages from the events as well as costs
associated with relief and recovery operations) from natural hazards. The hidden costs (indirect costs, beneficial uses of hazardous areas that might ameliorate losses, and intangible losses) are rarely included in official tallies of what disasters cost this nation. Thus, the empirical support for understanding economic losses due to disasters, at this point in time, is based solely on directly measurable damages, and sometimes relief and recovery costs associated with specific hazard events. Oftentimes, if we cannot put a dollar figure on the impact, then it is not included in damage estimates or response costs associated with natural disasters. Therefore, any database on disaster losses, out of necessity, underestimates the total economic and social impact of natural hazards to communities, individual states, and the nation.
This chapter presents an empirical analysis of losses from natural disasters (and a few technological ones where possible). Hazard events, economic losses, and human casualties were compiled for the period 1975-1998 to assess changes in trends in losses over time (this chapter) and then geographically (Chapter 6). Many of the caveats enumerated above and in the previous chapter also apply to our data as well. As we have cautioned in the previous chapter, the dollar losses we report may not be consistent with losses reported from other sources, especially for some of the large, singular events. Nevertheless, the database used in this analysis is the most comprehensive and complete assessment of natural hazard losses in the nation at this time. The next section describes the natural hazard events loss database. The rest of the chapter describes the trends in events and losses from 1975 through 1998 based on these data.
BUILDING THE HAZARD EVENTS AND LOSSES DATABASE
In conjunction with the Natural Hazards Research and Applications Information Center at the University of Colorado, we compiled a subset of the National Weather Service’s (NWS) Storm Data and Unusual Weather Phenomena as part of the second assessment of natural hazards in the United States (Mileti 1999). Only those single events with at least $50,000 in damages for 1975-1994 were included. Although not ideal for the analyses of events, this initial data set at least provides additional loss information on a wide variety of hazards. The sections on floods, thunderstorm winds, tornadoes, hail, drought, winter hazards, wildfire, and lightning draw on this database. The remaining hazards and updates to 1998 are based on the data sources described in Chapter 4.
In some data sets, damage was reported as an actual dollar amount, whereas in other databases damage was given as a category. All data that were reported as damage categories in any of the databases were conservatively assigned an actual dollar value based on the lowest dollar figure in the range provided. For example, in the National Climatic Data Center’s pre-1990 Storm Data, a damage category of 5 represented damage ranging from $50,001 to $500,000. For our purposes, a figure of $50,001 was assigned to that event. Consequently, all damage summaries presented in the following two chapters are extremely conservative, representing the lowest damage scenario rather than the highest. In all likelihood, overall damages are much more extreme than presented here. All damages were also adjusted to 1999 U.S. dollars to account for inflation and to allow for comparisons over time (American Institute for Economic Research 1999).
No attempt was made to independently verify economic loss data, death or injury statistics. We assumed that the databases used were fundamentally correct. We know, however, that in many instances they represent underreporting in all categories and should be considered an extremely conservative estimate of the nature of losses resulting from environmental hazards in this country.
HISTORICAL LOSSES FROM HAZARDS
According to our conservative estimates, environmental hazards caused over $300 billion in property and crop damage and nearly 9,000 deaths during the 1975-1998 study period. The historic impact of individual hazards is shown in Table 5-1. Floods—coastal, riverine, and flash—were the most damaging and deadly threat with a total of $106 billion in damages and over 2,400 deaths during our study period. Although not producing nearly as much damage, lightning proved to be the second leading cause of disaster-related deaths during this time period. Tornadoes and severe winter storms also caused significant loss of life, with over 1,300 and 1,000 fatalities, respectively—or roughly 100 people per year. Regarding damages, hurricanes had the second highest economic impact at over $75 billion. Perhaps somewhat surprising, tornado damages surpassed earthquake damages ($36 billion vs. $31 billion) during the past 24 years. Severe winter storms also caused a notable amount of damage, around $20 billion.
Loss of life averaged 375 people per year for this study period. The deadliest year was 1980, attributable in part to nearly 400 deaths result-
TABLE 5-1 Summary of Hazard Impacts, 1975-1998 (Damages Adjusted to U.S. $1999)
Hazard | Events | Deaths | Injuries | Damage (millions of dollars) | Average Annual Losses (millions of dollars) |
Drought | naa | 0 | 0 | 14,693.7 | 612.2 |
Earthquakesb | 784,439 | 149 | na | 31,454.4 | 1,310.6 |
Extreme cold | na | 228 | 406 | 2,847.7 | 118.7 |
Extreme heat | na | 566 | 1,328 | 1,048.1 | 43.7 |
Floods | na | 2,495 | na | 105,868.0 | 4,411.2 |
Hail | 103,243 | 15 | 569 | 4,863.7 | 202.7 |
Hazardous materials | 259,384 | 580 | 12,897 | 775.5 | 32.3 |
Hurricanesc | 82 | 394 | 4,026 | 75,717.7 | 3,154.9 |
Lightning | na | 1,667 | 7,566 | 604.1 | 25.2 |
Tornadoes | 22,409 | 1,344 | 29,437 | 36,627.3 | 1,526.1 |
Volcanod | na | 32 | na | 2,221.0 | 92.5 |
Wildfires | na | 10 | 278 | 1,532.6 | 63.9 |
Wind | 126,667 | 470 | 5,628 | 4,002.7 | 166.8 |
Winter hazards | na | 1,049 | 11,364 | 19,931.3 | 830.5 |
TOTAL | na | 8,999 | 73,499 | 302,187.8 | 12,591.3 |
ana = not available bEarthquake epicenters falling within state boundaries; there were 45 considered “significant” (see text for definition). cIncludes any storm tract collected by the National Hurricane Center that made landfall in the United States 1975-1998; injuries were derived from Storm Data. dThis only includes eruptions of Mt. St. Helens, Washington, Kilauea, Hawaii, and Redoubt, Alaska. | |||||
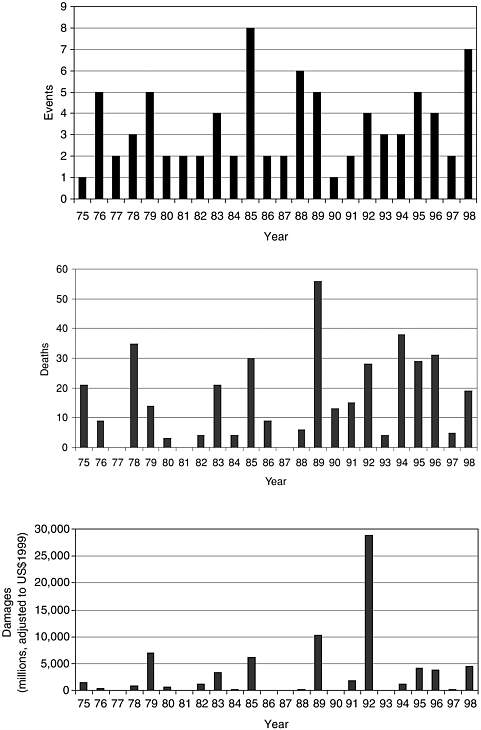
ing from extreme heat during the summer months (Figure 5-1a). Another peak year, 1983, saw multiple hazards, such as floods and extreme heat and cold, contributing to relatively high death tolls. In terms of damages, losses have climbed over time as a direct result of large-scale events, with new loss records set in 1989 and 1992 and with the 1989 record exceeded in 1993 and 1994 as well (Figure 5-1b). During the 1980s, the costliest disaster year in 1989 closed out the decade when both Hurricane Hugo and the Loma Prieta earthquake struck. Three years later, Hurricane Andrew raced over Florida, helping 1992 to become the costliest disaster year ever. The Midwest floods (a 500-year event) and a severe blizzard followed in 1993. The Northridge earthquake struck in 1994, ranking among the most costly single disaster events in U.S. history, according to our data (Table 5-2). As can be seen, however, the
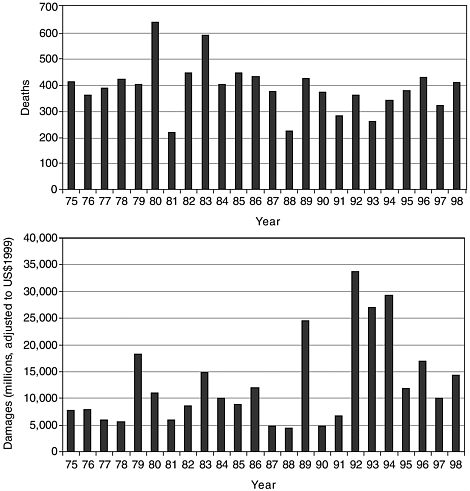
FIGURE 5-1 Trends in losses from all hazards, 1975-1998: (a) deaths and (b) damages (in 1999 dollars).
ranking of “most disastrous” or “costliest” depends on the source of the data and the definition of cost—issues discussed in the previous chapter.
Clearly, individual disasters can have a huge impact on overall losses. In fact, six events caused approximately one-quarter of all damages during this period. Although not falling within our study period, Hurricane Floyd, 1999’s major entry, continues this trend. Passing relatively close to the entire U.S. East Coast, the hurricane brought high rainfall totals that produced an inland flood disaster, with damage estimates around $6 billion and 77 deaths in the United States (NCDC 2000). Hurricane Floyd was the deadliest U.S. hurricane since Agnes in 1972. Although these types of events grab our attention, we must still recognize that
TABLE 5-2 Rankings of Costliest Disasters by Different Sources
Billion Dollar Weather Disasters (1980-1999)a | Presidential Disaster Declarations (1988-1995)b | ||||
Date | Loss (billions of dollars) | Event | Date | Loss (billions of dollars) | Event |
Summer 1988 | 40.0 | Drought/ heat wave | Jan. 1994 | 3.3 | Northridge earthquake |
Aug. 1992 | 27.0 | Hurricane Andrew | Aug. 1992 | 1.64 | Hurricane Andrew |
Summer 1993 | 21.0 | Midwest floods | Sept. 1989 | 1.26 | Hurricane Hugo |
Summer 1980 | 20.0 | Drought/ heat wave | Summer 1993 | 0.87 | Midwest floods |
Sept. 1989 | 9.0 | Hurricane Hugo | Oct. 1989 | 0.76 | Loma Prieta earthquake |
Summer 1998 | 6.0 | Drought/ heat wave | Sept. 1992 | 0.24 | Hurricane Iniki |
Sept. 1999 | 6.0 | Hurricane Floyd | July 1994 | 0.24 | Southern severe storms |
May 1995 | 5.0-6.0 | Southern severe weather/flood | Feb. 1993 | 0.20 | California floods |
Fall 1995Summer 1996 | 5.0 | Southern Great Plains drought | Jan. 1995 | 0.18 | California severe storms |
Sept. 1996 | 5.0 | Hurricane Fran | Oct. 1994 | 0.15 | Texas floods |
Sept. 1998 | 5.0 | Hurricane Georges |
| ||
aNCDC (2000), http://www.ncdc.noaa.gov/ol/reports/billionz.html. bGodschalk et al. (1999). cFEMA (2000), http://www.fema.gov/library/df_2.html. dInsurance Services Office, Inc. 2000. http://www.iso.com/hurricane_experience/index.html. | |||||
FEMA Relief Costs (1989-1999)c | Insurance Services Office Hurricane Losses (Adjusted $)d | ||||
Date | Loss (billions of dollars) | Event | Date | Loss (billions of dollars) | Event |
Jan. 1994 | 6.9 | Northridge earthquake | 1992 | 22.9 | Hurricane Andrew |
Sept. 1998 | 2.5 | Hurricane Georges | 1965 | 7.4 | Hurricane Betsy |
Aug. 1992 | 1.8 | Hurricane Andrew | 1989 | 7.4 | Hurricane Hugo |
Sept. 1989 | 1.3 | Hurricane Hugo | 1970 | 4.2 | Hurricane Cecilia |
Summer 1993 | 1.2 | Midwest floods | 1998 | 3.1 | Hurricane Georges |
Oct. 1989 | 0.87 | Loma Prieta earthquake | 1954 | 3.0 | Hurricane Hazel |
April-May 1997 | 0.73 | Red River Valley floods | 1979 | 2.8 | Hurricane Frederick |
Sept. 1999 | 0.73 | Hurricane Floyd | 1954 | 2.7 | Hurricane Carol |
Sept. 1996 | 0.62 | Hurricane Fran | 1960 | 2.7 | Hurricane Donna |
June-July 1994 | 0.54 | Tropical Storm Alberto | 1995 | 2.6 | Hurricane Opal |
approximately 75 percent of all losses were not caused by a singular “big event.” Smaller events are important as well, because they often occur more frequently, and, along with the large-impact disasters, cumulatively define the various hazardscapes of the United States.
TRENDS IN SPECIFIC HAZARDS
Floods
Floodplains have long been attractive places for human occupancy. Some provide exceptionally rich soils for agriculture and most have relatively flat slopes suitable for easy building construction. Perhaps more important for the development of the United States was the need for cities to locate along the ocean, lakefronts, and rivers to facilitate trade and commerce. Waterborne transport was the least costly, and the benefits of hydroelectric power generation were well understood. Several early American cities not only had accessible harbors, but were also located along the Fall Line, the farthest point a river is navigable and a prime site for hydropower. Examples include Philadelphia, Pennsylvania, Baltimore, Maryland, and Raleigh, North Carolina. Prior to the introduction of railroads (a stimulus for cities such as Atlanta, Georgia), most inland settlements likewise were established near water bodies of all types.
The end result of the human-use system dependence upon water and the historic evolution of American cities is that, today, very few urban settlements are completely immune from floods. Since people have placed themselves in harm’s way, and flooding to some degree is a fairly frequent occurrence, there is a high likelihood for loss from this natural hazard. Although flooding may not receive as much coverage in the media as the more explosive and dramatic events like hurricanes or earthquakes, floods are the number-one hazard in terms of property losses and human fatalities in the United States.
The total number of deaths from floods over our study period was 2,495. Unfortunately, the NWS data used for flood hazards does not include injury statistics. Figure 5-2a displays the trends in flood fatalities. The number of deaths averaged slightly more than 100 per year nationally during the 1975-1998 time frame. Two fatality troughs are evident in 1980 and 1988 (the only year with fewer than 50 deaths). Both years coincide with strong drought years, but one must be careful in trying to correlate the two hazards, especially over a large area such as
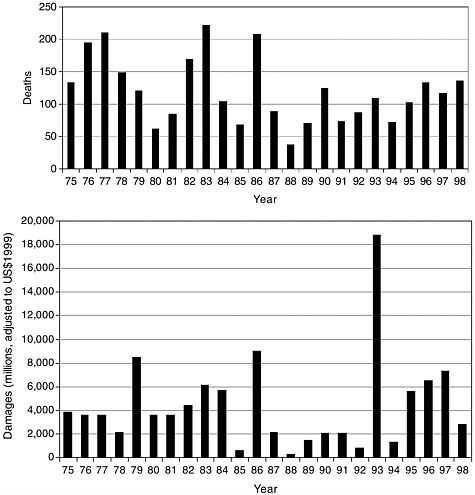
FIGURE 5-2 Trends in losses from flooding, 1975-1998: (a) deaths and (b) damages (in 1999 dollars).
the United States. For example, 1976 was a disastrous year nationally for both flood fatalities and drought losses.
Four years—1976, 1977, 1983, and 1986—closely met or exceeded 200 annual fatalities. Colorado’s Big Thompson flood recorded at least 139 fatalities in 1976, comprising the majority of that year’s total (Gruntfest 1996). A similar event in Rapid City, South Dakota, claimed over 230 lives just 4 years earlier. The ability of so few to survive these flash floods is indicative of the event’s rapid rate of onset.
The recurrence of flooding in Johnstown, Pennsylvania, explains 1977’s loss of life. Seventy-eight more deaths were added to that community’s tragic flood history total, which began with the failure of the
Conemaugh River’s South Fork Dam in 1889, when more than 2,200 lives were lost (McCullough 1968). A smaller flood event in the same area claimed another 25 lives in 1936 (Foote 1997). Many of 1977’s remaining fatalities were a result of dam failures. Forty-three more lives were lost in Pennsylvania when the Laurel Run Dam failed and 39 people died when the Kelly Barnes Dam in Georgia failed later that year (FEMA 2000c). Multiple smaller-scale flood events cumulatively raised the death tolls for 1983 and 1986. Floods in Texas and California took the most lives in 1983 (45 and 28, respectively). West Virginia added another 38 people to the tally in 1986. Overall, our review of flood fatality data concurs with other research that found flood-related deaths were highly variable from year to year, showing neither an increasing nor a decreasing trend (L. R. Johnson Associates 1992).
Flooding is the major source of monetary loss in the United States from natural hazards. Losses averaged slightly more than $4.4 billion dollars annually between 1975 and 1998. This estimate is nearly double the figure reported by FEMA (1997a), which attributed an annual average of $2.15 billion for flood events during the 1951-1985 period. The three costliest years were 1979, 1986, and, of course, 1993 (Figure 5-2b).
The 1993 Midwest floods in the Upper Mississippi River basin rank as one of the most damaging natural disasters in United States history (Changnon 1996) (Figure 5-3), but certainly not the first catastrophic flood to affect America’s great watercourse (Barry 1997). Although not unusual compared to annual death totals (only 38-47 flood-related deaths), these floods caused damages between $12 billion and $16 billion over a large portion of the central United States (IFMRC 1994). The relatively low loss of life for an event of this size may be attributed to its duration (from June to August), its rate of onset, and the ability to track floodwater movement successfully. Indeed, in the absence of these factors, the methodic evacuation of over 50,000 people may not have been possible (NOAA 1994). The lessons learned from this experience are enduring—future flooding is inevitable and thus we need to restrict development in floodplains and develop sustainable approaches to flood hazard mitigation (Changnon 1996).
Tornadoes
Whether single funnel clouds or a part of a larger outbreak, tornadoes are the most violent and damaging of the multiple weather hazards generated by thunderstorms. During the entire 24-year study period,

FIGURE 5-3 View of 1993 Midwest floods from bridges crossing the Mississippi River at Quincy, Illinois. Source: FEMA; photograph by Andrea Booher.
approximately 22,000 tornado events (Figure 5-4a) caused 1,300 deaths, 29,000 injuries, and over $36 billion in damage. From 1975 to 1998, there was an average of 58 deaths, 1,300 injuries, and $1.5 billion in damage per year. Although other sources provide higher death statistics—234 deaths per year between 1916 and 1950 (Bryant 1991) and 96 per year between 1953 and 1989 (Golden and Snow 1991), our frequency and mortality data are consistent with records of the more recent period (Fujita 1987, Grazulis 1993).
Casualties (deaths and injuries) reached their highest peaks in 1979, 1984, 1985, and again in 1998 (Figure 5-4b). A twister—at times as large as a mile wide—caused more than 40 deaths and 1,700 injuries in 1979 as it made its way through Wichita Falls, Texas (NWS 2000). Several causalities occurred when the storm hit a shopping mall. “Super” outbreak events, smaller than the major 1974 Midwest event of the same name that claimed 315 lives, were responsible for the fatalities and injuries in 1984 and 1985. Collectively, both North Carolina and South Carolina were hit by 22 tornadoes, resulting in 57 deaths in late March 1984. In May 1985, 41 tornadoes struck Pennsylvania and Ohio, adding 75 more fatalities to the yearly total (FEMA 1997a).

The spring of 1998 also was devastating, with six southeastern states suffering greatly. Relatively speaking, North Carolina, Kentucky, and Georgia fared better than most in the region, with 18 fatalities. Alabama had almost twice as many (34) fatalities and more than 700 injuries when tornadoes struck areas near Birmingham and Tuscaloosa. Another 42 persons died and nearly 300 more were injured when seven tornadoes plowed through the Kissimmee, Florida, area in late February. A dramatic event that crossed downtown Nashville, Tennessee, left at least 8 dead and 155 injured. One of the more tragic outcomes of that violent spring was the decimation of Spencer, South Dakota (Figure 5-5). A late May tornado destroyed 187 homes and all of the town’s businesses; out of a small-town population of only 300 people, 6 were killed and over 150 were injured. This event mirrored the complete loss of the small town Jarrell, Texas, the previous May. Of the 400 residents 28 perished and nearly all homes were destroyed.
Damage losses closely mirror the tornadic outbreaks already discussed. Recorded damages peaked in 1984 at nearly $4 billion, but appeared to decline in the 1990s, prior to the 1998 and later storms (Figure 5-4c ). The disastrous end of the decade (major events in Clarksville, Ten-
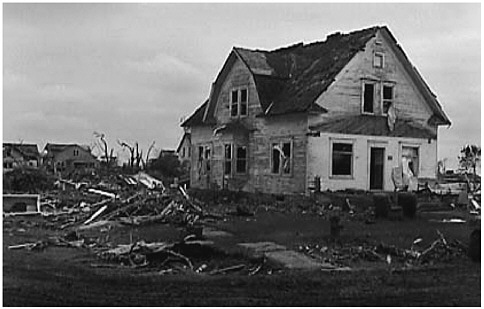
FIGURE 5-5 Damage to farmhouse and surroundings from 1998 Spencer, South Dakota, tornado. Source: FEMA; photograph by Andrea Booher and Brian Hvinden, OPA.
nessee, and Oklahoma City and Moore, Oklahoma) suggests that any perceived downward loss trend is not here to stay. Throughout the study period, the overall frequency of tornadoes remained fairly constant, although there was a slight upward trend during the 1990s.
One likely explanation is that prior to Doppler detection technology, tornadoes in uninhabited areas went largely unnoticed. Another explanation centers on localized risk factors such as time of day (television and radio warning systems are less effective at night when residents are asleep), type of dwelling (mobile homes) or shelter, and age of residents (Schmidlin and King 1995, 1997; Lillibridge 1997).
Hail
Most hail develops from thunderstorms in which strong vertical motions drive water droplets cyclically through the clouds. Eventually, the frozen droplets enlarge to the point that they fall from the clouds to reach the ground. The damage associated with hail depends largely upon the number and size of the hailstones and the speed at which they are driven. Few deaths have been attributed to hail, but significant damage has occurred to property (primarily automobiles) (Figure 5-6) and crops (especially long-stemmed ones such as corn). Within the United States, damaging hail events occur most often between the months of April and October.
The frequency of recorded hail events has steadily increased over the entire study period, with peaks in 1992, 1996, and 1998 (Figure 5-7a). It is unclear whether there are actually more hail events occurring, or if these figures represent artifacts of better monitoring and reporting systems. For example, the specific point location data for hail (e.g., longitude/latitude) only go back to 1983 for death and injury statistics, and to 1987 for estimated dollar damages. The earlier time periods (1975-1982) report events as county totals. Thus, we have a combination of specific and general data that were compiled into a statewide total by year.
Compared to other natural hazards, the threat to life from hail events is fairly benign. Hail accounted for only 15 fatalities over the 15-year period (Figure 5-7b). The relative number of injuries was also low—just 569 in over 103,000 events. Injuries from hail have rarely exceeded more than 30 persons per year, with the only exceptions coming in three peak years—1979, 1992, and 1996. Monetary losses were much more significant, however, averaging $203 million per year—or a total of $4.9 billion between 1975 and 1998 (Figure 5-7c). Another estimate places the

FIGURE 5-6 Severe wind driven hail damage to a house in St. Nazianz, Wisconsin, from a supercell thunderstorm on May 12, 2000. Source: http://www.crh.noaa.gov/grb/may1200svr.html .
annual loss figure at nearly $1 billion (NWS 1994). Unlike other environmental threats, there are rarely large-scale hail disasters. Losses from hail tend to be cumulative, adding up from thousands of events as each year goes by. Large-scale, damaging events have been noted, however, with the most recent occurring in Denver, Colorado (1994), and eastern Oklahoma and Texas (1995) (FEMA 1997a).
Wind
Damaging wind events other than tornadoes occur in all areas of the United States. More localized wind events also transpire in areas with unique climatic patterns influenced by mountainous terrain or the moderating influence of large bodies of water. Coastal areas exposed to tropical cyclones are among the most vulnerable to wind damage. Damages, injuries, and the loss of life typically result from building collapse or wind-driven debris. Wind events are defined in the event loss databases as thunderstorm winds at or near 50 knots, and thus do not represent damages from all known wind events.


The total number of thunderstorm wind events gradually increased between 1975 and 1998. The rise in events is partially due to the increased recognition and detection of this hazard and the oscillations in El Niño/La Niña cycles that contribute to severe weather in the United States. Both the greatest number of wind events (13,517; Figure 5-8a) and largest number of casualties (38 deaths and 815 injuries; Figure 5-8b) occurred in 1998, an especially strong El Niño year. The greatest amount of damage, approximately $1.2 billion, also occurred during 1998 (Figure 5-8c), a year that saw severe El Niño storms in Southern California, strong warm chinook winds in Boulder, Colorado, numerous blizzards and ice storms in the East, and severe weather in the Southeast. During the 24-year period, 20 fatalities and 235 injuries occurred annually, with yearly losses averaging approximately $167 million. With the lack of uniform building codes, the construction of housing with substandard materials, and burgeoning population growth in vulnerable areas, wind damages and casualties will continue to occur and increase in the years ahead.
Lightning
Lightning, another hazard associated with thunderstorms, is a visible flash in the atmosphere, an electrical charge that typically lasts less than a second, which can generate up to 100 million volts of electricity. Direct lightning strikes suffered by people are often fatal. The intense heat from lightning can also ignite fires that damage structures, forests, and cropland.
In contrast to other hazards, lightning fatalities tend to be individual occurrences. Exceptions, such as the loss of 38 people in a lightning-struck plane in 1963 near Elkton, Maryland, are rare. The average number of 69 fatalities and 315 injuries per year (Figure 5-9a) varies slightly from an estimate of approximately 89 fatalities and 300 injuries per year from 1963 to 1993 (NWS 1994). The number of lightning strikes that caused injury or death remained fairly consistent during the 24-year period, with peaks in 1994 and 1995. The majority of deaths and injuries occur when people become vulnerable in unsheltered areas such as parks, playgrounds, or golf courses.
It is estimated that there are more than 300,000 lightning claims filed per year in the United States with more than $33 million in estimated damages (Holle et al. 1996). Based on our data, total lightning

FIGURE 5-9 Trends in losses from lightning, 1975-1998: (a) deaths and injuries, and (b) damages (in 1999 dollars).
damages between 1975 and 1998 were approximately $604 million (Figure 5-9b). Although the damage impacts of lightning are not as great as some of the other hazards, the mortality statistics from lightning strikes (1,667 fatalities), makes this hazard the second most deadly after flooding. The peak in damages in 1987 is due to lightning-caused fires.
Wildfires
Wildfires have multiple causes: lightning strikes, arson, human carelessness with lit objects, and intentional burns gone awry. An example of
the first cause of wildfires is the catastrophic western forest fires during the summer of 2000 (Kirn 2000). An example of the last causal mechanism for wildfires is the prescribed burn that went out of control and torched much of Los Alamos, New Mexico, in the spring of 2000. Wildfires have long been part of our cultural history and landscape (Pyne 1997), but long-term data for wildfires are much less complete than for other hazards. Some data are available for major events, but a comprehensive compilation does not exist at this time, although the National Interagency Fire Center does provide limited historical statistics on frequency of wildland fires and acres burned (NIFC 2000). For example, from 1988 to1999, there were, on average, 62,000 wildland fires that burned a total of 2.9 million acres per year (NIFC 2000). Three years stand out as high-burn years—1990, 1996, and 1999—with more than 5 million acres burned (Figure 5-10a).
In U.S. history, the most damaging wildfire event in terms of lives lost was the 1871 Peshtigo Fire in Wisconsin, in which nearly 1,200 people perished (Nash 1976). Contemporary events have been less fatal, but damages continue to increase. From 1975 to 1998, wildfire losses totaled $1.5 billion (Figure 5-10b). Other estimates—even for single events—are much higher. Substantial losses, for example, occurred as a result of the 1991 Oakland, California, fire. Damages have been calculated at more than $1.5 billion; 25 people were killed and an additional 150 were injured (COES 1994). Another $1 billion in losses (and three more fatalities) were added to the state’s burden with the Southern California fires in late 1994 (FEMA 1997a).
The fact that wildfires can occur in virtually every state was demonstrated by the Florida wildfires of 1998. Wildfires were reported in more than 30 Florida counties, with Duval and Flagler near Jacksonville being among the most threatened (Figure 5-11). Portions of Interstate 95 (the main north/south route on the East Coast) had to be closed because of poor visibility from the smoke. Nearly 2,300 fires burned 500,000 acres, damaged or destroyed over 300 homes, and ruined timber valued at over $300 million (GWRMRC 1998). Major urban/wildland interface events such as those in Florida, and the rapidly developing West, appear to be increasing as people choose to live in areas with high wildfire risk.
Drought
There are several types of drought. Meteorological drought, an extended deficiency from normal precipitation levels, is the type usually
considered by the public, but socioeconomic droughts (greater demand for water than supply) occur as well. Drought is intensified by high temperatures but it does not occur only in hot weather, and a heat spell does not signify a drought. Because it is a chronic and slow-onset hazard, drought is perhaps the most underrated hazard in terms of the strains it puts on the people and the economy of the United States (Wilhite 1993, 1996, 1997). One comparison of annual monetary losses from drought even ranks this threat ahead of floods and hurricanes. In a comparison of

FIGURE 5-10 Trends in losses from wildfires, 1975-1998: (a) acres burned, and (b) damages (in 1999 dollars).

FIGURE 5-11 A damaged home in Flagler County, one of the hardest-hit regions during the 1998 Florida wildfires. Source: FEMA; photograph by Liz Roll, OPA.
drought, flood, and hurricane losses made by the National Drought Mitigation Center (Knutson 1997), annual losses were summed as follows: drought, $6 billion-$8 billion; floods, $2.41 billion; and hurricanes, $1.2 billion-$4.8 billion.
Loss of life from droughts in the United States is virtually nonexistent, although earlier accounts of this nation’s history point to malnutrition deaths during some severe droughts (Warrick 1975). Contemporary drought losses are seen in withered crops, poorly hydrated livestock, and other human-use systems, such as recreation or water transport, that depend upon water.
Over the 1975-1998 study period, 5 years stand out as high-loss years (Figure 5-12). Note that the damage estimates reported in Figure 5-12 are much lower than those reported elsewhere, a consequence of our use of the estimates reported in Storm Data. According to these conservative estimates, droughts are responsible for a minimum of $612 million in damages each year. Droughts in the Great Plains and western
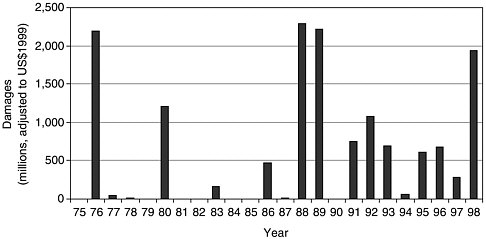
FIGURE 5-12 Trends in drought damages, 1975-1998 (in 1999 dollars).
United States in 1976 were responsible for a minimum of $2 billion in damages, although some estimates are as high as $15 billion (Riebsame et al. 1991). The National Climatic Data Center (NCDC 2000) reports $20 billion in damage from the 1980 droughts in the central and eastern portions of the country and another $40 billion from the 1987-1989 droughts, an estimate that makes it the costliest natural disaster during our study period. A southern drought stretching from the Carolinas to Texas generated an additional $6 billion-$9 billion in losses in 1998. Using these figures over our more conservative estimate would catapult drought into the top three hazards for economic losses, whereas our data place drought sixth. The greatest natural hazard loss collectively in the United States appears to revolve around water—either too much in the case of floods or not enough in the case of drought.
Extreme Heat
Drought and extreme heat are not synonymous. Irrespective of drought, approximately 200 deaths per year are attributable to heat stress in the United States (Kilbourne 1989). Linking deaths to heat stress as opposed to another cause, however, can be difficult. The 3 years with higher than normal casualties were 1980, 1986, and 1995 (Figure 5-13a). The 1980 fatalities numbered around 400 and may have been as high as 1,700 (FEMA 1997a) or possibly higher, depending on the data source (NCDC 2000). The 1995 heat wave in the Midwest contributed to the deaths of 670 people, mostly in urban areas such as Chicago, Illinois,

FIGURE 5-13 Trends in losses from extreme heat events, 1975-1998: (a) deaths and injuries, and (b) damages (in 1999 dollars).
and Milwaukee, Wisconsin. Extreme heat can also be responsible for other damages (Figure 5-13b). Livestock are sapped of their strength just as people are, while transportation infrastructure such as roads and railroads may warp under the intense heat. Most significantly, power failures, water shortages, and crop losses all contribute to calculation of losses from this hazard. The most damaging year (almost $455 million) for extreme heat was in 1985, which was an abnormally hot and lengthy summer for most of the nation.
Extreme Cold
As with drought and extreme heat, severe winter storms and extreme cold are related, yet distinct phenomena. A cold spell can occur without
a severe winter storm and severe winter storms can plow through portions of the United States without the weather being severely cold. A cold snap at the wrong time in the growing season can ruin crops, even though not a flake of frozen precipitation falls. For instance, two freeze events hitting Florida in 1983 and 1985 together inflicted over $3 billion in losses to the citrus industry alone (NCDC 2000).
Cold weather caused a relatively large number of casualties in 1983, 1985, and in 1994 (Figure 5-14a) with more than 100 people reportedly dying as a result of exposure or hypothermia. Over the study period, annual fatalities and injuries averaged 10 and 17, respectively. Damages from severe cold peaked in 1989 and again in 1998 (Figure 5-14b). The annual damage average was about $119 million. The expansive power of frozen moisture contributes greatly to this total through the cracking of

FIGURE 5-14 Trends in losses from extreme cold weather events, 1975-1998: (a) deaths and injuries, and (b) damages (in 1999 dollars).
roadways and building foundations, frozen power lines, and water-main breaks.
Severe Winter Storms
A large, concentrated amount of snowfall or ice can be very disruptive, particularly if the storm is long in duration. Communication and other lifeline infrastructure, such as transportation, are among the most heavily affected. Driving conditions often are unsafe and vast amounts of snowfall can cause roofs to collapse. Between 1975 and 1998, the annual number of winter hazard fatalities was 44 and injuries averaged 474 (Figure 5-15a). The peak years for fatalities were 1982 and 1983 with

FIGURE 5-15 Trends in losses from winter hazards, 1975-1998: (a) deaths and injuries, and (b) damages (in 1999 dollars).
104 and 103 fatalities, respectively. The peak number of injuries (2,092) occurred in 1978, and is largely attributable to a blizzard that affected states from the Mid-Atlantic to New England. The death tolls vary for individual events, depending upon how the data compiler classified the death. Thus, the casualty figures reported here more than likely include incidences related to extreme cold, a category we have treated separately.
By far the three most damaging years for winter hazards were 1993, 1994, and 1996 (Figure 5-15b). With snowfall rates of 2 to 3 inches per hour, 1993’s so-called “Storm of the Century” (March 12-14) paralyzed most of the eastern United States and inflicted between $3 billion and $6 billion in direct damages. Approximately 270 lives were lost and another 48 were reported missing at sea during this 3-day event (Lott 1993). The unusual Southeast Ice Storm of 1994 affected 11 states from Texas to Virginia (a large areal extent for an ice storm). At least nine deaths and $3 billion in damage was attributed to this event alone (Lott and Sittel ND). The Blizzard of 1996 dropped snowfalls ranging from 17 to 30 inches from Washington, D.C. to Boston, Massachusetts, as eastern seaboard commerce came to a standstill. Mail could not be delivered and federal government employees had an unexpected holiday. Approximately 187 deaths were attributed to the 1996 storm, with about $3 billion in damage/costs (NCDC 2000). Based on our data, the average damage total from 1975 to 1998 was $830 million per year. Despite the occasional big-event storm, winter hazards are a fairly pervasive threat and remain among the most difficult in terms of preparation and mitigation.
Hurricanes
Although not occurring as frequently as some hazards, hurricanes are among the most damaging—especially when making landfall in a heavily populated, unprepared place. Losses are caused by a number of factors including high winds, pounding rains, storm surge, inland flooding, and even tornadoes. Improved warning systems, building codes, and construction techniques have substantially decreased the number of deaths resulting from hurricanes in the United States compared to other parts of the world. Still, the continued development of vulnerable coastal areas puts more and more people and property at risk (Pielke and Landsea 1998).
The number and intensity of hurricanes during any single season is highly variable but does coincide with El Niño-Southern Oscillation
(ENSO) cycle, with large damage periods also associated with La Niña years (Pielke and Landsea 1999). Where one hurricane season sees relatively few, yet more intense, hurricanes (e.g. category 3 or higher on the Saffir-Simpson scale), the next season may have a greater frequency yet lower magnitude of storms (Figure 5-16a). The former pattern poses more danger because 83 percent of all damages are attributed to the 21 percent of landfalling tropical cyclones classified as intense (Categories 3-5) (Pielke and Landsea 1998).
Historically, the largest loss of life from any single hazard event in the United States resulted when a hurricane made landfall in Galveston, Texas, in 1900 (Larson 1999, Pielke and Pielke 1997). More than 8,000 people perished (Hebert et al. 1996). From 1975 to 1998 the average annual number of deaths caused by hurricanes was 16. Death tolls for individual storms may vary by source due to the timing of the fatality. For example, a death while repairing one’s roof may not be attributed to the hurricane event, but a heart attack fatality during an evacuation might be. In terms of direct casualties (drowning, lightning, wind-driven events), the majority of hurricane fatalities during the past 25 years were people who drowned in freshwater floods caused by the excessive rainfall from the storm (Rappaport 2000). Interestingly, these are listed under hurricanes rather than floods, highlighting some of the classification difficulties with the loss data.
Five years—1978, 1985, 1989, 1994, and 1996—recorded at least 30 hurricane fatalities (Figure 5-16b). By far the greatest loss of life occurred in 1989 from Hurricane Hugo. Hugo, a category 4 hurricane, crossed the Virgin Islands and Puerto Rico before making landfall in South Carolina near the port city of Charleston. Fifty-seven lives were lost on the U.S. mainland; many more perished on the islands (NCDC 2000). Despite the 1989 peak, the loss of life from hurricanes in the United States has generally decreased over the past century.
Chronicling damage estimates tells another story. Annual losses average $3.1 billion for our study period. Four years exceed $5 billion in losses—1979, 1985, 1989, and 1992 (Figure 5-16c). The largest of these, 1992, exceeded $25 billion as a result of Hurricanes Andrew and Iniki. Ripping across Florida just south of Miami at the very beginning of the hurricane season, Andrew currently holds the record for causing the greatest amount of property damage ($27 billion) of any single natural event in the United States. Iniki added another $2.2 billion in losses. Surpassed only by Andrew, 1989’s Hurricane Hugo wrought $9 billion in damage. The other loss peaks are attributable mainly to Hurricane
Frederic (1979) and 1985’s string of hurricane events that included Elena, Gloria, Juan, and Kate.
Hurricane damages will likely increase for two main reasons. First, the population growth along America’s coasts is increasing. Second, it appears that the past 20 to 30 years have experienced a lull in “normal” hurricane activity. The number of annual events is expected to climb. Coupled with greater coastal development, damages will rise as well. Hurricane Floyd (1999) may be a harbinger of losses in the future. Insured losses already (in 2000) are in excess of $6 billion and climbing (Anonymous 2000, ISO 2000, NCDC 2000).
Earthquakes
Earthquakes result from the sudden release of accumulated stress within the Earth’s crust. Usually occurring with little or no warning and with a rapid rate of onset, earthquakes have the ability to quickly cause extensive devastation and loss of life. Unlike weather-related events, there is no seasonality or periodicity to earthquakes. They vary considerably in their magnitude, and occur worldwide, with an average of more than 8,000 per day (NEIC 1999). Granted, most of these earthquakes are quite small and of minor consequence, being recorded by sensitive instruments, but not actually felt by people. Of foremost concern, however, are those few strong to great earthquakes that occur each year in areas where there are vulnerable human populations. Earthquakes also may trigger secondary threats such as landslides, tsunamis, and technological failure—threats to human settlements as well.
From 1975 to 1998, the number of earthquake epicenters within a state boundary ranged from a low of 7,800 (in 1975) to more than 70,000 (1992) (Figure 5-17a). Clearly, not all of these were felt earthquakes, let alone significant ones. The number of significant earthquakes (more than $1 million in damages, or ten or more deaths, or magnitude 7.5 or greater, or intensity X or greater), was quite varied as well, with a total of 45 during the 24-year study period. The greatest number of fatalities occurred in 1989 (Figure 5-17b), a year with only two significant events. One of these events was the devastating Loma Prieta earthquake that affected the San Francisco Bay/Santa Cruz area of California. With an epicenter located under a mountain of the same name near Santa Cruz, the Loma Prieta quake killed 62 people; many of these perished on the interstate highways (Figure 5-18). Striking near the height of a normal day’s evening rush hour, the earthquake’s death toll might have been
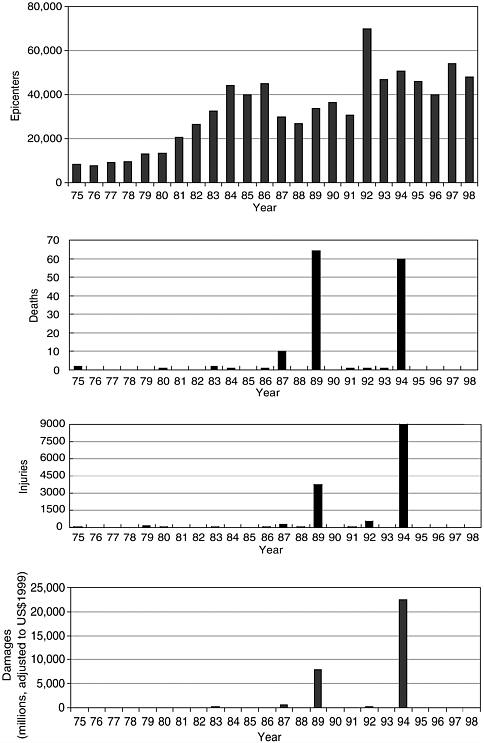
even higher if not for a large number of people at home watching the locally played baseball World Series. Another 57 perished in 1994’s Northridge quake to the northwest of Los Angeles, California, which recorded more injuries than the Loma Prieta earthquake (Figure 5-17c). A Richter magnitude earthquake of 6.7, the Northridge event occurred at 4:30 a.m. and killed many as they slept. Smaller losses were also seen in 1983’s Coalinga and 1987’s Whittier Narrows events.
Earthquake losses appear to escalate with each new major event (Figure 5-17d). Annual losses average approximately $1.3 billion. Loma Prieta’s losses exceeded $5 billion, only to be topped by Northridge at over $20 billion, the costliest earthquake event in the continental United States. Other estimates attribute $358 million to Whittier Narrows and $6 billion to Loma Prieta (Palm 1995). In the absence of reliable earthquake prediction and warning systems, structural mitigation, land-use zoning, and insurance remain the best courses of action to limit or reduce the impact of future earthquake losses.

FIGURE 5-18 Damage to the Cypress Street Freeway extension in Oakland, California, from the 1989 Loma Prieta earthquake. Source: Photograph by Susan L. Cutter.
Volcanoes
Although the Hollywood imaginations that brought us films such as 1997’s Volcano would have us believe otherwise, volcanic activity is geographically confined to a few select areas in the United States. However, no continuous loss database exists for this hazard. The primary threats from this hazard include lava and mudflows, floods from melted snow pack, super-heated gases, and airborne projectiles. Some data are available for the few major events that transpired between 1975 and 1998. The continuing eruption of Kilauea (Figure 5-19) in Hawaii (1983 and recurring episodes) has resulted in over $61 million in damages. Damage and loss of revenue from ash and debris flows from the Redoubt, Alaska volcano totaled about $160 million, making that 1989-1990 eruption the second costliest in U.S. history (NODAK 2000).
The most damaging volcanic event in our study period was the 1980 eruption of Mount St. Helens in the State of Washington. Losses to forestry, property, agriculture, income, transportation infrastructure, and the cost of cleanup from the eruption exceeded $1.5 billion (FEMA 1997a). More than 60 lives were lost. Many of these fatalities were backwoods campers and hikers and permanent residents who failed to heed

FIGURE 5-19 The Pu‘u ‘O‘o cone in September 1983, early in the Pu‘u ‘O‘o-Kupaianaha eruption of Kilauea volcano 1983-1986. Source: USGS Hawaiian Volcano Observatory Photo Gallery. http://www.hvo.wr.usgs.gov/gallery .
evacuation warnings. As with earthquakes, the most effective way to reduce losses from volcanic eruptions lies in land-use planning. Development of monitoring systems that detect physical changes within the environment may also provide crucial lead time for warnings and evacuations in response to an impending eruption.
Hazardous Material Spills
Up to now, this chapter has focused largely on “natural” hazards. Yet, the interaction between society, its technology, and natural systems also gives rise to a range of other hazards. Acute events, such as industrial accidents and oil or hazardous material spills, fall under this category, as do more chronic hazards, such as pollution. Dam failures can be considered as technological failures, but the effects of those failures (i.e., a flash flood) were treated earlier.
This section focuses on the losses caused by hazardous material accidents, although they represent only one of the many potential technological risks that face communities. These include releases by air, water, rail, and road carriers. Over the study period, hazardous material events peaked in the late 1970s, declined significantly through the 1980s, and had climbed again by the mid-1990s (Figure 5-20a). The decline in the number of events during the 1980s was a reflection of changes in reporting requirements in 1981 (spills of less than 5 gallons were no longer included) as well as improved safety (Cutter and Ji 1997). Although the occurrence of fatalities is more evenly distributed over time (Figure 5-20b), the temporal pattern for injuries mirrors that of the overall occurrences (Figure 5-20a). The average annual human loss was 24 deaths and 537 injuries, with the majority of fatalities from highway accidents.
Two peak years stand out for fatalities and injuries—1992 and 1996. Sixty-one deaths occurred in Wisconsin in 1992 and 111 occurred in Florida in 1996. The injuries in 1992 are the result of multiple events in several states, whereas a single event accounts for the large number of fatalities and injuries in 1996. A major railroad spill occurred near Alberton, Montana, in April 1996 when several cars went off the tracks, spilling chlorine and other materials and forcing hundreds of residents from their homes. Interstate 90 was closed for several days and 792 people were injured. During the study period, damages have clearly increased (from $20 million in 1975 to close to $50 million in 1998), with an average of $32 million per year (Figure 5-20c).

CONCLUSION
Natural hazards conservatively cost this nation $12.5 billion annually during the past 24 years. Damages from natural hazards are highly variable from year to year and from decade to decade. However, steady increases in losses were found during the 1990s, the most disastrous decade ever. Fatalities remained relatively steady during the past 24 years.
Floods are the most costly natural hazard to this nation, in terms of both dollar losses and human fatalities. Hurricanes and tornadoes round out the top three hazards in overall economic losses according to our data. In fact, weather-related phenomena (floods, hurricanes, tornadoes, etc.) account for 89 percent of the total losses from natural hazards and 92 percent of the human fatalities. Geophysical events (earthquakes and volcanoes) account for 10.8 percent of the economic losses and 2 percent of the fatalities during this study period, whereas hazardous materials incidents account for less than 1 percent of the economic losses, but 6 percent of the total fatalities. Cumulatively, hazardous material incidents account for greater losses of life than earthquakes and volcanoes combined!
The hazard loss story for the United States over the past three decades is a mix of good and bad news. Save for those few major disaster events, injuries and fatalities for most threats have either declined in number or leveled out. Much of this can be attributed to the investments made in structural reinforcement of dwellings, warning systems, land-use planning, and education. A few singular disaster events contribute to the overall loss totals (Hurricanes Hugo, Andrew, and Iniki; the Northridge and Loma Prieta earthquakes; the Midwest floods). It is the cumulative impact of less catastrophic, yet more frequent, natural hazard events, however, that contributes to the escalator-like (up and down) trends in hazards events, losses, and casualties.
A burgeoning population and a desire to congregate in attractive, yet hazard-prone areas may alter these trends in the future, especially if we base our projections on the decade of the 1990s. For example, the population of all coastal counties has outpaced the total U.S. population growth by 15 percent in the past two decades (Ullmann 2000). Not only does this increase the level of exposure to enormous amounts of real property, but it increases the potential to erase the gains made in reducing hurricane fatalities and injuries during the past 24 years. Similar observations can be made regarding earthquakes and wildfires, or about a
lifestyle and an economy that demands the production of hazardous materials.
This chapter has reported fatality, injury, and damage losses for 14 threats. It does not purport to be exhaustive; clearly, many other environmental threats exist and, more importantly, new threats and new losses continue to appear. Emotional, cultural, and ecological losses— although important and unignorable—have not been addressed in the data reported here. The loss estimates were derived from a variety of sources, are very conservative, and likely understate the severity of disaster losses to the nation. Without a centralized, national data collection effort focused on gathering identical physical, social, and spatial loss variables, loss reduction efforts will continue to be plagued by hazard incomparability, difficulty in conducting vulnerability assessments, and a poor understanding of the geographic dimensions of disaster.