American Hazardscapes: The Regionalization of Hazards and Disasters (2001)
Chapter: Figure 2.2Figure 2.3Figure 3.3Figure 3.4
Visit
NAP.edu/10766
to get more information about this book, to buy it in print, or to
download it as a free PDF.
Previous Chapter:
Index
Suggested Citation:
"Figure 2.2Figure 2.3Figure 3.3Figure 3.4." Susan L. Cutter. 2001. American Hazardscapes: The Regionalization of Hazards and Disasters. Washington, DC: Joseph Henry Press.
doi: 10.17226/10132.
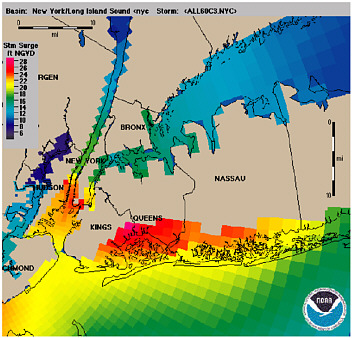
FIGURE 2-2 SLOSH model output for a Category 3 hurricane along Long Island, New York. Source: http://hurricane.noaa.gov/prepare/longislandc3.htm.
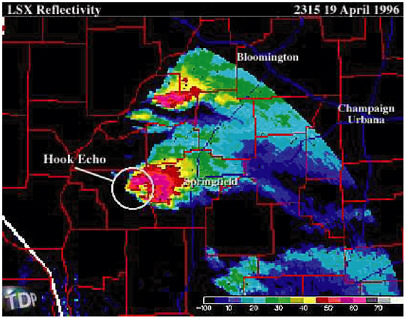
FIGURE 2-3 Doppler radar image of the April 1996 Jacksonville, Illinois, tornado, illustrating the diagnostic hook echo. Source: http://ww2010.atmos.uiuc.edu/(Gh)/arch/cases/960419/nxrd/jack.rxml.
Suggested Citation:
"Figure 2.2Figure 2.3Figure 3.3Figure 3.4." Susan L. Cutter. 2001. American Hazardscapes: The Regionalization of Hazards and Disasters. Washington, DC: Joseph Henry Press.
doi: 10.17226/10132.
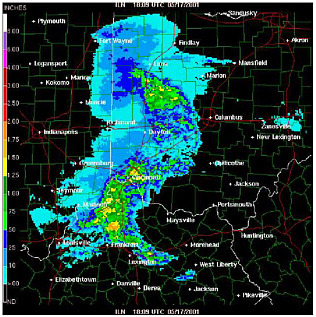
FIGURE 3-3 Rainfall estimates from Doppler radar for severe thunderstorms in southwestern Ohio and northern Kentucky, May 17, 2001. Source: http://weather.noaa.gov/radar/latest/DS.78ohp/si.kiln.shtml.
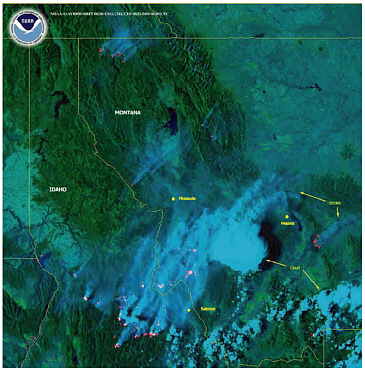
FIGURE 3-4 A remotely sensed image of heat signatures (red) and smoke (blue) from fires burning in the western United States on August 23, 2000. Source: http://www.osei.noaa.gov/Events/Current.
Subscribe to Emails from the National Academies
Stay up to date on activities, publications, and events by subscribing to email updates.