Improving Information for Social Policy Decisions -- The Uses of Microsimulation Modeling: Volume II, Technical Papers (1991)
Chapter: Economic Studies of Industry Performance
parts of a task in parallel, much as the above scenario described multiple processors in the same system unit performing independent threads into which a task had been decomposed.42
Computer architectures other than SISD have been rare in part because of the difficulty of expressing algorithms in a form capable of effectively exploiting the other architectures. However, this situation is changing. As Gordon Bell (1989:1100)43 notes:
The good news is that a vast array of new, highly parallel machines are becoming available and that autotasking compilers are evolving to take advantage of this in a transparent fashion to a limited degree. The bad news is that not all applications can be converted automatically. Users are not being trained to use such machines in an explicit fashion. No concerted effort is in place covering the spectrum from training to research. This will require a redirection of resources.
It seems evident that microanalytic simulation modeling activities are likely to be able to exploit, perhaps quite substantially, at least some of these new architectures. The extent to which their productivity will increase is difficult to determine because such an architectural shift implies a structural change in the way in which tasks are performed. The present authors believe that the beneficial effect of such new architectures will be quite substantial, even though we cannot predict with certainty how they will be realized.
Economic Studies of Industry Performance
Two studies of the cost of computer components are of interest. One, performed
| to store its files in a manner that is essentially transparent. Depending on the pattern of the data flow between the two computers, such an arrangement may be cost-effective for both systems. |
by Kenneth Flamm,44 using methodology developed by David Kuck45 and data collected by Montgomery Phister,46 analyzes data for the period 1957–1978. The second, by Jack Triplett and colleagues at the Bureau of Economic Analysis (BEA) of the U.S. Department of Commerce, arose from the recognition that computers and information technology are becoming an important component of the gross national product, and that classical methods of computing price indices for this class of goods are inadequate because of the very high rate of quality and productivity improvement over time.
Phister’s data, which are used in Flamm’s study, cover what is fast becoming a historical period in computing. All of the data are 12 years old, which is approximately two computer generations ago. Both sets of data were gathered for all sizes of computers available at the time; Pfister used characteristics of mainframe and minicomputer systems, and Triplett also included desktop systems.
Flamm notes three ways of measuring differences in performance between computer systems:47
Benchmarks Executing the same program or set of programs on different computing systems provides the best immediate comparison of systems and is often done by system purchasers to assist in determining which of several systems to purchase for a specific job mix. However, within a broader scope of inquiry the method has severe drawbacks. Job mixes are often specific to needs; any job mix represents a specific manner in which resources are combined to produce outputs. Second, the method is impossible to use over time; most computers from the 1960s are no longer available for benchmarking. Finally, the market basket of outputs that computer purchasers want changes over time; last decade’s computers are relatively ineffective in meeting today’s distribution of computer-related demand and conversely.
Characteristic weighting One can select indices of performance on specific machines and extend that measure over a broader class of machines. This measure may be easier to generate but suffers from changes in the underlying job mix. Furthermore a weighted index of component productivity suffers from changes in the weights, including the creation of new types of components.
Prices An approach based on prices rests on the hypothesis that, over time, prices are related to the underlying technical characteristics of the
TABLE 7 Declining Cost of Computer Hardware, 1957–1978
System Component | Percent Decline in Real Quality Corrected Cost per Year | ||
1 Year | 6 Years | 10 Years | |
CPU | 32 | 90.1 | 97.9 |
Primary memory | 37 | 93.7 | 99.0 |
Disk storage | 28 | 86.1 | 96.3 |
Tape storage | 28 | 86.1 | 96.3 |
Printers | 16 | 64.9 | 82.5 |
Card readers and punches | 12 | 53.6 | 72.1 |
Complete computer system | 28 | 86.1 | 96.3 |
SOURCE: Flamm (1987: Table 2–1). | |||
computers. To the extent that component prices and technical characteristics can be isolated, the resulting data can be analyzed statistically to determine the rate of increase in productivity or capacity of the components. Such an approach is labeled hedonic analysis; it is the basis of Flamm’s analysis and is used extensively by Triplett in his study.
Using Phister’s and Keck’s measures of performance and price, Flamm regressed the logarithm of these price indices over time. His results, given in Table 7, are extrapolated for periods of 6 years (1990–1995) and 10 years (one decade).
The work of Triplett and his colleagues at BEA was performed to support the creation of a new price index for computers. The new index was incorporated into the revised estimates of the national income and product accounts released in December 1985.48 Such indices are important in estimating product accounts in order to assist in dealing with the problem of rapid quality change and producing quality adjusted indices. In deriving the initial indices on which the BEA indices were primarily based, Cole and her colleagues at IBM (Cole et al., 1986) restricted the input data to mainframes of the IBM 360/370/308×/43×1/3090 class, including those manufactured by plug-compatible suppliers. Deficiencies in the original IBM study include the absence of personal computers and small disk drives and the use of list prices rather than transaction prices.
An update of the price index using data through fiscal year 1988 (Cartwright and Smith, 1988) remedies one of these deficiencies by introducing a separate price index for personal computers.49 However, the index for disk drives is
TABLE 8 Implicit Price Deflator and Fixed Weight Price Indices for Computers and Peripheral Equipment, 1982–1988 (index numbers, 1982=100)
Year and Quarter | Implicit Price Deflator | Fixed-Weight Price Index | |
1982: | I | 105.9 | 105.0 |
| II | 103.0 | 101.2 |
| III | 98.5 | 98.3 |
| IV | 91.9 | 95.5 |
1983: | I | 84.0 | 93.5 |
| II | 78.3 | 87.0 |
| III | 73.6 | 83.0 |
| IV | 72.1 | 72.1 |
1984: | I | 68.5 | 72.1 |
| II | 65.6 | 70.9 |
| III | 62.9 | 69.4 |
| IV | 60.6 | 67.6 |
1985: | I | 56.2 | 61.9 |
| II | 52.3 | 57.1 |
| III | 49.5 | 53.6 |
| IV | 46.8 | 50.2 |
1986: | I | 45.5 | 48.5 |
| II | 45.4 | 48.1 |
| III | 45.2 | 47.7 |
| IV | 44.7 | 47.3 |
1987: | I | 42.9 | 45.7 |
| II | 40.0 | 42.8 |
| III | 37.7 | 40.5 |
| IV | 35.8 | 38.6 |
1988: | I | 34.7 | 37.4 |
| II | 34.2 | 36.8 |
| III | 33.7 | 36.2 |
SOURCE: Cartwright and Smith (1988: Table 2). | |||
limited to large and intermediate drives, which accounted for less than 20 percent of total disk drives in 1984. Other deficiencies in the index are acknowledged, and work to address them continues.
Table 8 displays the quarterly observations that currently make up the existing U.S. Department of Commerce series for the implicit price deflator for computers and peripheral equipment.
Figure 1 depicts a logarithm of implicit price deflator data, with the regression line over time. The regression equation is
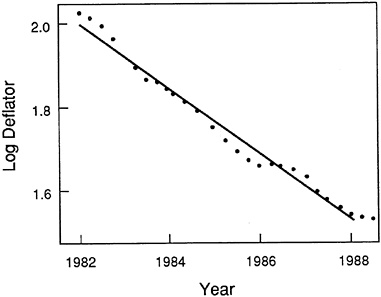
FIGURE 1 Implicit computer price deflator. SOURCE: Triplett (1986).
Both coefficients have t-ratios over 37, and the regression equation explains 98.2 percent of the variance. The annual rate of change of the logarithm translates into an annual rate of decrease of the price deflator index of 16.4 percent.
The 16.4 percent rate of decrease of Triplett’s index is significantly smaller than Phister’s result of 28 percent per year as reported by Flamm. The result also seems counterintuitive based on work by the present authors in the computer industry. Several factors could account for the discrepancy:
Triplett’s index is historically rooted in work performed by IBM using its models and list prices; the original IBM study did not include microcomputers. The effect of excluding them would tend to bias the rate of productivity improvement downward, since much of the improvement has resulted from highly elastic demand and a mass market in microcomputer technology.
The index includes more traditional computers and may not include emerging workstation technology. Improvements in quality and productivity are more likely to be associated with small firms on the technical frontier rather than larger, more established firms whose sales levels make them more likely candidates for inclusion in a price index.
Most components included in the index are more likely to affect more traditional forms of computing than innovative applications using the newest systems. For example, the present authors suspect that any productivity increase resulting from the introduction and evolution of parallel or network architectures is unlikely to be included in the index until such architectures are more broadly accepted.


