Improving Information for Social Policy Decisions -- The Uses of Microsimulation Modeling: Volume II, Technical Papers (1991)
Chapter: Sensitivity Analysis
migration. They might also incorporate evaluations of the internal logic of the projection model itself. External validations are concerned with the extent of agreement between projected population figures and subsequent realized outcomes. As already noted, conditional population forecasts must be correct unless some computational error has been made. But these projections are usually treated by the user community as unconditional forecasts, so it is reasonable to ask how close the projections come to what actually occurred. Estimation of variance is related to a discussion of confidence intervals and is reserved for the following section.
Sensitivity Analysis
At one level of understanding, population projections are necessarily valid. For example, projections by the Census Bureau or the SSA cannot be wrong, assuming no computational errors have been made, because agency analysts simply lay out the necessary outcomes of a series of hypothetical inputs. Nevertheless, because inputs to a population projection model are relatively simple, it is generally of interest to carry out sensitivity analyses on each component, given reasonable bounds on each. Different aspects of a projection are affected to a lesser or greater degree by each of the components. For example, if the potential demand for day care is of interest, fertility inputs will be of primary importance. On the other hand, if future outlays for old-age security benefits are at issue, mortality inputs will prove to be much more crucial, at least for the next 65 years. When population projections are made, alternative assumptions are typically offered in the form of high, middle, and low assumptions for fertility, mortality, and immigration. It is possible to observe the variability of a certain population output to each of these inputs. By taking each of the three high assumptions and each of the three low assumptions as equally likely, it becomes apparent which component matters most to the final outcome.4
In 1989 the Census Bureau published 27 projections of the U.S. population, one for each combination of the three inputs (fertility, mortality, and immigration) at three levels (high, middle, and low).5 Table 1 shows the projected population in the year 2010 that results from varying only one component at a time, while holding the other two constant at their middle levels. The first panel gives the population under age 5, the relevant population for most day care centers. Variation is clearly driven by the fertility component. In the second panel, projections are presented for the population age 75 and over. Sometimes
TABLE 1 Projected U.S. Population Size in 2010 Under Varying Assumptions of Fertility, Mortality, and Immigration
designated the old-old, this is the population group of interest in determining the demand for nursing care. Because the entire population over age 75 in the year 2010 has already been born, alternative assumptions of fertility are irrelevant here.6 Migration matters to some extent, but alternative assumptions of mortality are the predominant driving force in determining the size of this population. The final panel of Table 1 presents the total population figures. No single component is as clearly dominant as in the projections of the very young and the very old. Alternative assumptions regarding fertility are more important than those regarding mortality or immigration, but the difference is not large.7
It has become common practice in presenting population projections to focus on three series, representing a “best guess” scenario and a high and a low alternative. This is the approach taken by the Census Bureau, the SSA, and the United Nations (1989). The high and low alternatives are taken to be outer bounds within which the final outcome is expected to fall. The Census Bureau’s projections, for example, combine high (low) fertility, low (high) mortality, and high (low) net immigration to maximize (minimize) the expected population size. The SSA is less interested in the total population size than it is in the
6 | Slight variations exist in the projections because the handling of census undercount and overcount is slightly different in each. |
7 | Alho and Spencer (1985) indicate that the high and low fertility assumptions are considerably more narrow than those regarding mortality and migration. If so, the fertility component is in fact more important for population size than Table 1 indicates. |
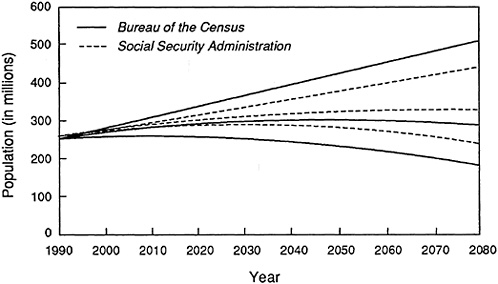
FIGURE 1 U.S. population projections by the Bureau of the Census and the Social Security Administration. NOTE: The three lines for each agency represent high, middle, and low scenarios; see text for discussion. SOURCES: Data for the Census Bureau from Spencer (1989); data for SSA from Wade (1988).
financial well-being of the Old-Age Survivors and Disability Insurance (OASDI) program. As a result, the outer bounds presented are those that minimize (or maximize) the ratio of the old-age population to the working-age population. These figures are derived by combining high (low) fertility, high (low) mortality, and high (low) immigration. These projections are referred to as optimistic and pessimistic, respectively.
Figures 1 and 2 demonstrate these points by examining the projection fans of the population through 2080. Projections of the total population are shown in Figure 1. The fans for the Census Bureau’s projections are considerably wider (i.e., the difference between the low series and the high series of projections is far greater) than those for the SSA.8 The SSA is no more certain than the Census Bureau about future trends, but it is interested in placing bounds on different aspects of growth. The eventual size of the population is relatively unimportant for the financial well-being of the OASDI program. Figure 2 shows projections of the old-age dependency ratio through 2080. In this case the SSA fans are considerably wider.
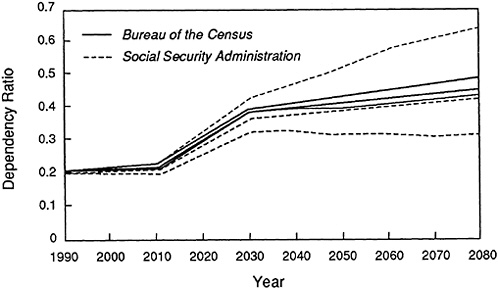
FIGURE 2 Old-age dependency ratios projected by the Bureau of the Census and the Social Security Administration. NOTES: The dependency ratio is the population aged 65 and older divided by the population aged 20–64. The three lines for each agency represent high, middle, and low scenarios; see text for discussion. SOURCES: Data for the Census Bureau from Spencer (1989); data for the Social Security Administration from Wade (1988).
Model validation typically includes consideration of the appropriateness of the model. In the present case there is little reason to doubt the cohort component model. If fertility, mortality, and immigration are correctly predicted, there will be no error in the resulting population projection; persons can enter and leave the population in only three ways—being born, dying, or migrating. This is not the case, for example, with projections of future GNP, which may depend on many unknown factors. But alternatives to the cohort component model do exist—some more complicated, requiring detailed economic inputs, others quite simplistic. More complicated models, including various economic-demographic models, explicitly generate values for fertility, mortality, and migration on the basis of projected economic circumstances. In contrast, these inputs are chosen on a more subjective basis in the official SSA and Census Bureau projections. The appropriateness of these more elaborate models is largely an empirical question; do they in fact produce more accurate predictions than those based on subjective assessments? At the other end of the spectrum, simple extrapolation models may produce reasonable results, even though they do not take into account the basic demographic events responsible for population change.


