Nutrient Requirements of Fish (1993)
Chapter: 4. Digestibility and Absorption
4
Digestibility and Absorption
The nutritional value of a feedstuff is based not solely on its chemical composition but also on the amount of the nutrients or energy the fish can absorb and use. The bioavailability of nutrients or energy in feedstuffs for fish may be defined mainly in terms of digestibility or, in the case of energy, metabolizability. Digestibility describes the fraction of the nutrient or energy in the ingested feedstuff that is not excreted in the feces. Metabolizability describes the fraction of the digested energy that is not excreted in the urine and through the gills. Both digestible energy (DE) and metabolizable energy (ME) have been used to express feedstuff values for fish (National Research Council, 1981, 1983), but many researchers use and report only DE values because of difficulties in obtaining ME values for fish. This subject has been discussed in greater detail in Chapter 1.
METHODS OF DIGESTIBILITY DETERMINATION
Methods for determining digestibility coefficients involve either a direct or an indirect measurement of the amount of nutrient ingested and subsequently excreted. The test feedstuffs have been fed singly or in combination with other ingredients.
Indirect Method
This method involves the use of a nondigestible marker, such as chromic oxide (Cr2O3), which is included in the diet at a concentration of 0.5 to 1.0 percent. It is assumed that the amount of the marker in the feed and feces remains constant throughout the experimental period and that all of the ingested marker will appear in the feces. The digestibility of the nutrient in question can be determined by assessing the difference between the feed and fecal concentrations of the marker and the nutrient or energy. The percent nutrient digestibility can be estimated by use of the following formula:
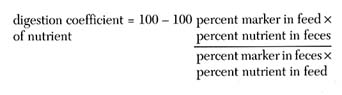
This method has been used to determine the digestion coefficients for energy, crude protein, carbohydrates, lipids, and dry matter for several fish species (Nose, 1960a,b; Hastings 1966, 1969; Smith and Lovell, 1971, 1973; Windell et al., 1978a,b; Wilson et al., 1981; Cho et al., 1982). The indirect method has the advantages that it eliminates the need to quantitatively collect all of the excreta, and the test fish can eat voluntarily.
Proper fecal collection to prevent loss of soluble nutrients into the water is critical in digestion trials, whether the direct or indirect method is used. Data from Smith et al. (1980) indicate that a significant amount of the fecal nitrogen from rainbow trout is in liquid form and can leach out of the feces into the water prior to collection. The calculation of digestibility when a significant amount of soluble nutrients have leached from the feces gives digestion coefficients that are erroneously high (Smith and Lovell, 1971; Windell et al., 1978b). Some investigators have therefore chosen to collect the feces directly from the rectum using anal aspiration (Windell et al., 1978b), surgical excision (Smith and Lovell, 1971), or stripping (Nose, 1960a,b) to minimize the problem of nutrient leaching. Austreng (1978) cautioned that if stripping was used to remove the feces from the rectum, care should be taken not to obtain partially digested feed or biological fluids from the gut. Choubert et al. (1979) and Cho and Slinger (1979) have shown, however, that if excretions are removed from the fish tank soon after expulsion, the collection of passively excreted feces can give good digestibility data. Digestion coefficients determined
by the indirect method have been useful and feeding regimens based on these data have been successful (Takeuchi et al., 1979; Cho and Kaushik, 1985; Wilson and Poe, 1985; Mangalik, 1986; Satoh et al., 1992).
Direct Method
This method involves measuring all the feed consumed by the fish and all of the resulting excreta. Smith (1971, 1976) and Smith et al. (1980) used an aquatic modification of the metabolism chamber designed for terrestrial animal studies; it allowed for the separate quantitative collection of gill, urine, and fecal excretions of rainbow trout. The fish were force-fed a measured amount of feed, and the various excrements were subsequently collected and analyzed for their nutrient content. The amounts of the nutrients in the excrements were then subtracted directly from those in the feed to determine the amounts retained. This method allows for determining carbon and nitrogen balances as well as DE and ME values. Also, the problem of fecal leaching is eliminated because all of the water in the chamber is included in the analyses. The method is open to criticism, however, because the fish are immobilized and force-fed and so stressed that the utilization of the feed may be compromised. Use of this method has been restricted to rainbow trout and attempts to adapt it to other species have so far been unsuccessful.
Neither the direct nor indirect method accounts for the inclusion of materials of endogenous or metabolic origin in the excreta. Therefore, the data obtained are actually apparent rather than true digestibility values. Nose (1967) found that 3.1 percent of the fecal nitrogen collected from rainbow trout came from endogenous sources, and Foltz (1978) found that the endogenous protein content of the feces rose from 3.1 to 8.4 percent as water temperature increased from 7° to 19°C. This distinction between apparent and true digestibility probably has little practical impact on feeding practices, however, and thus, the reported apparent digestibility values are quite adequate.
Assay Diets
Very few feedstuffs are fed as the sole component of a fish diet; therefore, some researchers evaluate the digestibility of a feedstuff in combination with other ingredients in the assay diet. Cho et al. (1982) determined digestible energy and digestible protein coefficients for feed ingredients by comparing the digestibility of a reference diet with that of an assay diet that contained a mixture of the reference diet (70 percent) and the test ingredient (30 percent). The reference diet was composed of natural ingredients similar to a commercial diet. Digestion coefficients were determined for the reference and assay diets by the indirect method described above, and these coefficients were used to calculate the digestibility of the test ingredient according to the following expression:
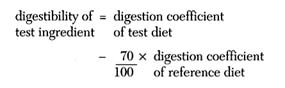
Wilson and Poe (1985) also used this procedure to determine digestion coefficients for energy and protein in diets and diet ingredients for channel catfish. This method has advantages over testing ingredients singly in that any synergistic effect of feeding the ingredient in combination with other diet components may be realized. Also, the test ingredient may be more acceptable to the fish when fed in combination with other ingredients, which leads to a normal level of intake so that the difference between apparent and true digestibility is minimized and negative nitrogen balance is avoided.
FACTORS AFFECTING DIGESTIBILITY
No differences were found in protein and energy digestibility coefficients for rainbow trout as water temperature ranged from 7° to 18°C (Windell et al., 1978a; Cho and Slinger, 1979; Cho and Kaushik, 1990). The apparent lack of response to temperature change has also been found in common carp (National Research Council, 1977). Cho and Kaushik (1990) reported a small increase in crude fat digestibility at 18° versus 9°C when highly saturated animal fats were fed. The rate of movement of ingesta through the digestive tract of channel catfish was found to increase at temperatures above 26°C, but no increase in digestibility coefficients was noted (Shrable et al., 1969). It may be concluded, therefore, that nutrient digestibility is little affected by water temperature within the species' range of normal growth.
It has been found in a number of species that as meal size increases, digestive and absorptive efficiencies decrease (Kinne, 1960; Pandian, 1967; Solomon and Brafield, 1972; Elliot, 1976; Windell et al., 1978a; Andres, 1979). Wilson and Poe (1985) found that extrusion processing increased the digestibility of energy, but had no effect on the digestibility of protein as compared with pellet processing for catfish diets. Cruz (1975) found similar results with diet ingredients for catfish.
NUTRIENT DIGESTIBILITY
Table 4-1 presents digestibility coefficients for protein, lipids, and carbohydrates in various feedstuffs for chinook
TABLE 4-1 Apparent Digestibility of Protein, Fat, and Carbohydrate in Selected Diet Ingredients for Chinook Salmon, Rainbow Trout, Channel Catfish, and Blue Tilapia
| International Feed Number | Protein (%) | Lipid (%) | Carbohydrate (%) | |||||||
Ingredient | Chinook Salmon | Rainbow Trout | Channel Catfish | Blue Tilapia | Rainbow Trout | Channel Catfish | Blue Tilapia | Rainbow Trout | Channel Catfish | Blue Tilapia | |
Alfalfa meal | 1-00-023 | — | 61a | — | 66b | 71c | 51d | — | — | 12d | 27b |
Blood meal | 5-00-381 | 30e | 69a | 74 | — | — | — | — | — | — | — |
Casein | 5-01-162 | — | 95c | 97f | — | — | — | — | — | — | — |
Canola meal | 5-06-145 | 79e | — | — | — | — | — | — | — | — | — |
Corn, grain cooked | 4-02-935 | — | 95c | 60d | 84b | — | 76d | 90b | — | 66d | 45b |
|
| — | — | 66d | 79b | — | 96d | — | — | 78d | 72b |
Corn gluten meal | 5-28-242 | — | 87a | — | — | — | — | — | — | — | — |
Cottonseed meal | 5-01-621 | — | 76a | 83g | — | — | 88d |
| 84a | 17d | — |
Fish, anchovy meal | 5-0-985 | 92e | — | — | — | — | — | — | — | — | — |
Fish, herring meal | 5-02-000 | 91e | 87a | — | — | 97c | — | — | — | — | — |
Fish, manhaden meal | 5-02-009 | 83e | — | 88g | 85b | — | 97d | 98b | — | — | — |
Meat and bone meal | 5-00-388 | 85c | 82g | 78b | — | 77c |
|
|
|
|
|
Poultry by-product meal | 5-03-798 | 74c | 68c | — | — | — | — | — | — | — | — |
Poultry, feathers, hydrolyzed | 5-03-795 | 71e | 58c | 74d | — | 68c | 83d | — | — | — | — |
Soybean meal, 44 percent | 5-04-604 | — | — | — | 94b | — | — | — | — | — | 54b |
Soybean meal, 48 percent | 5-04-612 | 77e | 83a | 93g | — | — | 81d | — | — | — | — |
Starch, corn (uncooked) | |||||||||||
50 percent |
| — | — | — | — | — | — | — | 24a | — | 55f |
25 percent |
| — | — | — | — | — | — | — | — | — | 61f |
Starch, corn (cooked) | |||||||||||
50 percent |
| — | — | — | — | — | — | — | 52a | — | 66f |
25 percent |
| — | — | — | — | — | — | — | — | — | 78f |
Wheat middlings | 4-05-205 | 85e | 76a | 72d | — | — | — | — |
|
|
|
Wheat grain | 4-05-268 | — | — | 92g | 90b | — | 96d | 85b | — | 59d | 61b |
extruded |
| 84e | — | — | — | — | — | — | — | — | — |
NOTE: Dashes indicate data were not available. a Smith (1977) and Smith et al. (1980) determined by metabolism chamber, single ingredient fed. b Popma (1982) determined by indicator method, feces collected by frequent removal from water, ingredient fed in mixed diet. c Cho et al. (1982) determined by indicator method, feces collected from a settling column outside the fish tank, ingredient fed in mixed diet. d Cruz (1975) determined by indicator method, feces collected by surgical excision, single ingredient fed. e Hajen et al. (1992) determined by indicator method, feces collected from water, ingredient fed in mixed diet. f Saad (1989) determined by indicator method, feces collected by surgical excision, ingredient fed in mixed diet. g Wilson and Poe (1985) determined by indicator method, feces collected by surgical excision, ingredient fed in mixed diet. | |||||||||||
salmon, rainbow trout, channel catfish, and blue tilapia. The DE and ME values for feed ingredients are given in Table 8-1. Amino acid availability and protein digestibility values for certain feed ingredients are given in Table 4-2 for Atlantic salmon and channel catfish.
Protein
Proteins in most feedstuffs that have been properly processed are highly digestible to fish. The digestion coefficients for protein in protein-rich feedstuffs are usually in the range of 75 to 95 percent. Protein digestibility tends to be depressed as the concentration of dietary carbohydrate increases (Inaba et al., 1963; Kitamikado et al., 1964a,b; Nose, 1967; Page and Andrews, 1973; Smith and Lovell, 1973; Austreng et al., 1977; Rychly and Spannhof, 1979). Dabrowski et al. (1986) found no difference in protein utilization by rainbow trout held in either freshwater or sea water, and they concluded that salinity does not have an impact on protein digestibility. Overheating fishmeal during the drying process can greatly reduce its nutritive value (Finley, 1989). By contrast, insufficient heating of soybean meal decreases the availability of protein. Smith (1976) showed that increasing the heating temperature from 127° to 204°C increased protein digestibility in soybean meal from 45 to 75 percent.
TABLE 4-2 True Amino Acid Availability and Protein Digestibility Values for Certain Feed Ingredients for Atlantic Salmona and Channel Catfishb
Lipids
Fat when administered either alone or in a mixed diet routinely gives digestibility values of 85 to 95 percent for fish (Cho et al., 1974; Windell et al., 1974; Cruz, 1975; Austreng, 1978, 1979; Cho and Slinger, 1979; Takeuchi et al., 1979; Cho and Kaushik, 1990). The digestibility estimates for fats, however, often vary markedly when dietary concentrations are low (Smith et al., 1980). Takeuchi et al. (1979) reported that for common carp the digestibility coefficients for soybean, coconut, and pollack oils were about 90 percent, but that of beef tallow was only 76 percent.
The ability of channel catfish to digest beef tallow increased from 70 to 94 percent when the water temperature was raised from 23° to 28°C (Andrews et al., 1978). Similar results for rainbow trout were found when the temperature was raised from 9° to 18°C (Cho and Kaushik, 1990). Austreng (1979) showed that the ability of rainbow trout to digest fatty acids of the same chain length increased as the degree of unsaturation increased and decreased with increasing chain length up to a chain length of 22 carbons.
Carbohydrates
Salmonids absorb glucose well, but they are less efficient at utilizing dextrin or starch (Phillips et al., 1948; Buhler and Halver, 1961; Singh and Nose, 1967; McCartney, 1971; Cho and Slinger, 1979; Kaushik and Olivia-Teles, 1985). Cho and
Slinger (1979) showed that noncooked starch was only 49 percent digestible to rainbow trout. However, channel catfish (Wilson and Poe, 1985) and Nile tilapia (Popma, 1982) digested over 70 percent of the energy in noncooked starch. Cooked starch was more readily digested by trout (Smith, 1976; Smith et al., 1980) and channel catfish (Wilson and Poe, 1985). Falge et al. (1978) and McCartney (1971) showed that trout amylase activity was affected by the type and the amount of carbohydrate in the diet and that increasing carbohydrate load in the diet generally resulted in a decrease in enzyme activity. Saad (1989) showed that the digestibility of cooked corn starch decreased from 83 to 78 and 66 percent as the concentration of starch in the diet increased from 12.5 to 25 and 50 percent. Austreng et al. (1977) also showed a reduction in the ME value of the diet as carbohydrate increased.
TABLE 4-3 Net Absorption of Phosphorus from Various Sources by Channel Catfish, Common Carp, and Rainbow Trout
Source | International Feed Number | Channel Catfish (%) | Common Carp (%) | Rainbow Trout (%) |
Animal products | ||||
Casein | 5-01-162 | 90a | 97b | 90b |
Egg albumin | — | — | 71b | — |
Anchovy fishmeals | 5-01-985 | — | — | — |
Brown fishmeals | — | — | 24b | 74b |
Menhaden fishmeals | 5-02-009 | 60c | — | — |
White fishmeals | — | — | 66b | |
Inorganic phosphates | ||||
Calcium, monobasic | 6-01-082 | 94c | 94b | 94b |
Calcium, dibasic | 6-01-080 | 65c | 46b | 71b |
Calcium, tribasic | 6-01-084 | — | 13b | 64b |
Potassium, monobasic | — | — | -94b | -98b |
Sodium, monobasic | 6-04-288 | 90c | -94b | -98b |
Plant products | ||||
Corn, ground | 4-26-023 | 25c | — | — |
Phytate | — | 1c | 8–38b | — |
Rice bran | 4-03-928 | — | 25b | 19b |
Soybean meal, dehulled | 5-04-612 | 29a | — | — |
Wheat germ | 5-05-218 | — | 57b | 58b |
Wheat middlings | 4-05-205 | 28c | — | — |
Yeast, brewers | 7-05-527 | — | 93b | — |
a Data from Wilson, R. P., E. H. Robinson, D. M. Gatlin, III, and W. E. Poe. 1982. Dietary phosphorus requirement of channel catfish. J. Nutr. 112:1197–1202. Values are expressed as percent apparent absorption. b Data from Ogino, C., T. Takeuchi, H. Takeda and T. Watanabe. 1979. Availability of dietary phosphorus in carp and rainbow trout. Bull. Jpn. Soc. Sci. Fish. 45:1527–1532. c Data from Lovell, R. T. 1978. Dietary phosphorus requirement of channel catfish (Ictalurus punctatus). Trans. Am. Fish. Soc. 107:617–621. Values are expressed as percent apparent absorption. d Data from Yone, Y., and N. Toshima. 1979. The utilization of phosphorus in fishmeal by carp and black sea bream. Bull. Jpn. Soc. Sci. Fish. 45:753–756. | ||||
MINERALS
The relative availability of dietary phosphorus is affected by both chemical form and fish species. Table 4-3 presents the net absorption of various sources of phosphorus for four species of fish. Generally, phosphorus absorption by channel catfish and rainbow trout is higher than that of the stomachless carp. Monobasic phosphates of sodium, potassium, and calcium appear to be highly available sources to all of the species noted. Dibasic and tribasic calcium phosphates vary in their availabilities but are generally less available than the monobasic form. The availability of phosphorus from fishmeal, which is primarily of bone origin, is generally lower than that of certain other high-protein feedstuffs, such as casein and yeast. The availability of phosphorus from fishmeals with high ash (bone) content (above 16
percent) varies among species, but it is generally lower than that of low-ash fishmeals (Yone and Toshima, 1979).
The bioavailability of phosphorus in fish diets is an important consideration because of the effect of phosphorus from the discharge of fish culture operations on stream eutrophication. Thus, highly available forms of phosphorus should be used and at minimum concentrations to meet dietary requirements. Phytate is the primary form of phosphorus in grains, and its availability to fish is very low. For this reason, most of the phosphorus from grain sources is excreted in the feces and may contribute to effluent pollution problems caused by hatcheries (Ketola, 1985).
Differential absorption of different forms of other minerals has also been noted in several fish species. Examples of this include the superior absorption by common carp of calcium in the lactate form as compared with the carbonate form (Nakamura and Yamada, 1980) and the higher availability in Atlantic salmon of selenomethionine as compared with other sources of selenium (Bell and Cowey, 1989).
The bioavailability of zinc from fishmeals appears to be inversely correlated with the ash content. White fishmeal is a by-product meal made from fish processing waste and, because of its high bone content, usually has ash values in excess of 16 percent. Rainbow trout that had been fed diets containing white fishmeal exhibited signs of zinc deficiency (Ketola, 1978, 1979; Ogino and Yang, 1978) even though it was calculated that the zinc content of the diets was adequate. The deficiency signs were alleviated by the addition of supplemental zinc to the diet. Ogino and Yang (1979) also reported that a similar condition developed in carp fed diets containing high-ash fishmeal. Satoh et al. (1987) reported a negative correlation between tricalcium phosphate content of the diet and zinc availability to rainbow trout. Gatlin and Wilson (1984) found that zinc bioavailability in channel catfish was reduced by dietary phytate, and recommended that the zinc allowance in commercial feeds be increased to five times the requirement established with purified diets. Satoh et al. (1983a,b) have shown that a similar pattern of nonavailability exists for magnesium in carp and trout fed diets containing high-ash fishmeals.