Predicting High-Risk Drivers: Skills Examination and Scoring Guidelines (2025)
Chapter: 3 Results

CHAPTER 3
Results
The results section is divided into eight sections, each corresponding to different aspects of the project. The sections present findings related to the projectʼs eight tasks. The first five tasks focus on insights gained from a document review and expert panel (see the appendix), while the next three tasks highlight findings from the experimental study. Chapter 4 offers a high-level summary, synthesizing key takeaways across the project.
Task 1: Document and Critique the Current Driving Skills Examination and Scoring Methodologies Used by States
Driving Exam Parameters
Three elements related to the driving exam were abstracted, including requirements for:
- The types of roads on which testing is conducted
- The time of day when testing is conducted
- Maneuvers and behaviors included on the driving exam
Twelve states included requirements for all three driving exam parameters (California, Colorado, Georgia, Illinois, Louisiana, New Mexico, North Carolina, South Carolina, Tennessee, Vermont, Virginia, and West Virginia). Thirty-five jurisdictions included requirements for only two driving exam parameters. The requirements for 30 of these jurisdictions applied to the types of roads on which testing is conducted and the maneuvers and behaviors included on the driving exam (Arizona, Arkansas, Connecticut, Delaware, the District of Columbia, Florida, Hawaii, Idaho, Indiana, Kansas, Kentucky, Maine, Maryland, Massachusetts, Michigan, Minnesota, Missouri, Montana, Nebraska, Nevada, New Hampshire, New York, North Dakota, Ohio, Oklahoma, Oregon, Rhode Island, Utah, Washington, and Wisconsin). The other five of these jurisdictions held requirements for the time of day when testing is conducted and the maneuvers and behaviors included on the driving exam (Alabama, Alaska, Mississippi, New Jersey, and Texas). Finally, four states (Iowa, Pennsylvania, South Dakota, and Wyoming) included requirements only for one of the three driving exam parameters, which differed among each state.
Of the 43 jurisdictions that included requirements for the types of roads on which testing is conducted, only two states (Rhode Island and Virginia) specified that the driving exam must be conducted on a closed road. Thirty-eight jurisdictions specified that driving exams must be conducted on open roads, with 32 of these jurisdictions explicitly requiring that there be traffic on the test route. The remaining three states had more nuanced requirements, allowing both open and closed roads:
- Maryland described that their driving exam consists of a mixture of closed and open roads.
- Michigan stated their driving exam is usually conducted on open roads but may also consist of a mixture of closed and open roads.
- Kansas indicated that their driving exam may be conducted on closed roads, open roads, or both.
Requirements for the time of day when testing is conducted were less commonly specified, as only 19 states listed any requirement. Often, this information was found by navigating to the stateʼs official scheduling website and trying to book a driving exam appointment to determine the times offered by the stateʼs licensing agency. Fourteen states (Alabama, Alaska, California, Mississippi, New Jersey, New Mexico, North Carolina, South Carolina, South Dakota, Texas, Vermont, Virginia, West Virginia, and Wyoming) provided a consistent range of hours when tests could be conducted, which usually aligned with normal business hours. Of these states, testing begins between 8:00 a.m. and 9:30 a.m. and ends between 3:00 p.m. and 5:00 p.m. Three states (Colorado, Georgia, and Tennessee) did not provide a range of hours but instead specified that testing may only occur during daylight hours. Illinois described that driving exams are available up to 30 minutes before the testing site closes, and Louisiana specified that third-party testers set the time at which they conduct their driving exams. All jurisdictions (except Iowa, South Dakota, and Wyoming) provided requirements for the maneuvers and behaviors included on the driving exam. Each jurisdiction varied in the amount of detail supplied about the maneuvers and behaviors that are tested. These largely fell into five distinct categories:
- Understanding of vehicle controls and instruments
- Proper driving posture (e.g., driver looks over their shoulder while backing up, does not put both feet onto pedals)
- Maneuvering the vehicle
- Comprehending and complying with traffic signs and signals
- Driving on public roads and interacting with other road users (i.e., motorists, pedestrians, and bicyclists)
Of the 49 jurisdictions that provided requirements for the maneuvers and behaviors included on the driving exam, the requirements from 17 states (Alabama, Alaska, California, Colorado, Florida, Georgia, Illinois, Maryland, Massachusetts, Missouri, New York, North Carolina, Tennessee, Texas, Washington, West Virginia, and Wisconsin) explicitly covered all the categories previously listed. Nineteen states (Alaska, Arizona, Connecticut, Delaware, Hawaii, Idaho, Indiana, Kentucky, Michigan, Minnesota, Mississippi, Montana, Nebraska, Nevada, Ohio, Oklahoma, Oregon, Pennsylvania, and South Carolina) had requirements that clearly covered all five categories except for proper driving posture, while the requirements in two other states (North Dakota and Virginia) covered all categories besides driving on public roads and interacting with other road users. Four states (Louisiana, Maine, New Hampshire, and New Mexico) included requirements for all five categories except understanding of vehicle controls and instruments and proper driving posture. The remaining states varied in their coverage of the categories previously listed:
- New Jersey and Utah both provided requirements that span all categories except understanding of vehicle controls and instruments.
- The only category that Vermontʼs driving exam did not cover is comprehending and complying with traffic signs and signals.
- The District of Columbiaʼs driving exam covered understanding of vehicle controls and instruments, maneuvering the vehicle, and driving on public roads and interacting with other road users.
- Rhode Islandʼs driving exam pertained only to an understanding of vehicle controls and instruments and maneuvering the vehicle.
- Kansas tested drivers on maneuvering the vehicle and driving on public roads and interacting with other road users.
- South Dakotaʼs driving exam pertained simply to maneuvering the vehicle.
Driving Exam Scoring Method
States took several approaches to scoring for driving exams. For example, some states used deductive scoring, when the applicant cannot earn more than a certain amount of penalty points to pass the test, while others used additive scoring and required that the applicant cannot lose more than a certain number of points. This review examined three features of driving exam scoring methods: (1) use of additive or deductive scoring, (2) whether points are assigned for repeat driving errors, and (3) how closely the scoring method aligns with the maneuvers and behaviors included in the driving exam.
Only 24 states provided any information to the public about their driving exam scoring method. The remainder of states did not make this available, possibly so that novice drivers could not strategically practice only the maneuvers that will be scored on the test. Of these 24, 18 had a deductive scoring method (Arizona, California, Florida, Idaho, Kansas, Michigan, Missouri, Montana, Nebraska, New Mexico, New York, Ohio, Oklahoma, Pennsylvania, Tennessee, Texas, Washington, and West Virginia), while the remaining six states specified an additive scoring method (Georgia, Hawaii, Kentucky, Louisiana, South Dakota, and Wisconsin). Only six states clearly indicated whether points are assigned for repeat driving errors. Five states (California, Montana, Nebraska, Texas, and West Virginia) described that each repeat driving error would add points to the applicantʼs score, while Washington stipulated that making the same error more than once would not count more than once toward the applicantʼs score. No state with an additive scoring method allowed for driving errors to count more than once toward the applicantʼs score, likely due to this scoring methodʼs structure (i.e., additive scoring measures how many successful maneuvers are completed, instead of counting the number of driving errors committed).
It is important for states to develop a scoring method that matches the maneuvers and behaviors performed during the driving exam so that each driving task is properly counted in the overall score. Of the 24 states that provided the public information about their scoring methods, 11 developed scoring methods that matched the driving maneuvers and behaviors they cited as being included on the driving exam. For four of these states (Arkansas, California, Kansas, and Washington), a difference was exhibited between the level of detail provided by the state about the tested maneuvers and behaviors and the maneuvers and behaviors listed on the scoring method. The remaining seven states (Hawaii, Idaho, Kentucky, New York, Ohio, South Dakota, and West Virginia) had a near-exact match between the detail on their scoring method and the included maneuvers and behaviors. This information matched up by default for some states because they provided details about the scoring method and the maneuvers and behaviors in the same place. For example, New York included a summary of the driving exam scoring method on their state website, which contained a list of errors that may be made during the driving exam. This summary was also the only source of driving exam maneuvers and behaviors found for New York, so by default the scoring method and the maneuvers and behaviors matched exactly.
Nine of the 24 states provided scoring methods that did not match the maneuvers and behaviors included on the exam (Florida, Georgia, Louisiana, Michigan, Missouri, New Mexico, Oklahoma, Tennessee, and Wisconsin) simply because their scoring methods did not specifically discuss any maneuver or behavior at all. One example is Oklahoma, whose state driverʼs manual provides a list of maneuvers and behaviors that will be tested on the driving exam but did not appear to have any information on if or how these specific maneuvers were scored, instead focusing on more general topics like the maximum number of deductions that can be earned before failing and reasons for automatic failure.
Finally, four states (Montana, Nebraska, Pennsylvania, and Texas) had scoring methods that directly conflicted with the provided list of tested maneuvers and behaviors. In the case of Texas, the state driverʼs handbook informed novice drivers that they should be prepared to demonstrate
appropriate use of clutch and turn signals during their driving exam, but these skills were not listed on Texasʼ scoring methods. Conversely, Texas listed approach to corner as a maneuver on their scoring method, but this maneuver did not appear on the list provided to novice drivers in the state driverʼs handbook. Other states, like Nebraska, had some scored maneuvers missing from the list of maneuvers provided to novice drivers in the driverʼs handbook, but the handbook specified that the list of maneuvers provided was not complete.
Evidence for How Driving Exam Information Is Shared with the Driver Training Community
As evident from the review of scoring methods, states differed in their approaches to sharing information about their driving exams. Some states shared this information with the public while others did not. Forty-eight states shared some details about their driving exam through frequently used resources like state websites or driverʼs manuals. Of these states, 21 (Alabama, Alaska, Colorado, Connecticut, Delaware, the District of Columbia, Georgia, Louisiana, Maine, Montana, Nebraska, Nevada, New Hampshire, New Jersey, North Carolina, North Dakota, Oregon, South Carolina, Utah, Vermont, and Washington) shared only information about the maneuvers and behaviors included on the driving exam, while 16 states shared information about both the included maneuvers and behaviors and the reasons an applicant may fail the driving exam (Arkansas, Idaho, Illinois, Indiana, Kentucky, Maryland, Massachusetts, Michigan, Minnesota, Missouri, Oklahoma, Pennsylvania, Rhode Island, Texas, Virginia, and Wisconsin). Five other states shared information about the scoring method used for the driving exam, as well as the included maneuvers and behaviors (Arizona, Florida, Kansas, New Mexico, and New York), and four states (California, Ohio, Tennessee, and West Virginia) shared information about reasons an applicant may fail the driving exam, as well as the test-scoring methods, and included maneuvers and behaviors. Mississippi shared only a list of behaviors and attitudes that will be observed during the driving exam, making no mention of specific maneuvers applicants will be tested on, while South Dakota shared only a limited amount of information regarding the scoring method used for the driving exam.
Three states did not share any information about their driving exam through frequently used resources. Hawaii listed information about the maneuvers and behaviors included on their driving exam as well as the testʼs scoring method, but this information was only found by reading Hawaiiʼs regulations. Iowa and Wyoming did not appear to share any information about their driving exams online.
Required Examiner Qualifications and Certifications to Conduct the Driving Exam
Twenty-three jurisdictions specified requirements that driving examiners must meet to conduct driving exams. States may choose to allow third-party test examiners, or they may require testing to be conducted only by government employees. Of these 23 jurisdictions, 19 (Alabama, Alaska, Arizona, Colorado, the District of Columbia, Florida, Georgia, Louisiana, Michigan, Missouri, Ohio, Oklahoma, Oregon, Pennsylvania, South Carolina, Texas, Utah, Vermont, and Washington) allowed third-party test examiners to conduct driving exams, while the remaining four states (Arkansas, Kentucky, Maryland, and Mississippi) allowed only internal agency or government employees to conduct driving exams. Each state may describe additional examiner requirements:
- Minimum age
- Driverʼs license
- Minimum time driverʼs license has been held or minimum amount of driving experience
- Clean driving record
- Clean criminal record
- Affiliation with a driving school or high school
- Examiner training
- Examiner evaluation
- Examiner certification
- Minimum number of driving exams conducted each year
Arizona and Michigan did not provide any requirements for driving examiners beyond a requirement that these examiners comply with testing requirements established by the state. Of the remaining 21 jurisdictions, three states (Alaska, Colorado, and Utah) required driving examiners to be older than a minimum age ranging from 21 to 25 years old. Six states (Alaska, Florida, Georgia, South Carolina, Texas, and Utah) required driving examiners to hold a valid driverʼs license, and three of these states required that the license be held for a minimum amount of time or that the examiner have a minimum amount of driving experience, ranging from 2 to 3 years (Alaska, South Carolina, and Utah).
Seven states (Alaska, Colorado, Florida, Georgia, South Carolina, Texas, and Utah) specified that driving examiners must have a clean driving record, or at least a driving record free of serious traffic offenses. Five states (Florida, Georgia, South Carolina, Texas, and Washington) required that driving examiners have a clean criminal record or a record clear of serious offenses.
Eight states (Alabama, Alaska, Georgia, Oklahoma, South Carolina, Texas, Vermont, and Washington) mandated that driving examiners belong to a driving school or a high school, 10 jurisdictions (Alabama, Alaska, Colorado, the District of Columbia, Florida, Georgia, South Carolina, Texas, Utah, and Washington) required driving examiners to complete training, and five states (Alaska, Colorado, Georgia, South Carolina, and Washington) stipulated that driving examiners must pass an examination before being allowed to conduct a driving exam. In addition to requirements for driving examiner training and evaluation, five states (Louisiana, Missouri, Oregon, Pennsylvania, and Utah) made it necessary for driving examiners to obtain a certification, though the certification requirements for most states were not found.
Four states (Colorado, Ohio, South Carolina, and Utah) required driving examiners to complete a minimum number of driving exams each year to maintain their ability to conduct driving exams; this ranged from 10 to 60 tests completed each year. The District of Columbia required third-party driving examiners to conduct driving exams at DC Department of Motor Vehicles locations and mandated that driving examiners carry insurance for bodily injury and property damage liability; these requirements were not found in any other jurisdictions.
Driving Exam Failure Policy
As previously discussed, states differ in their approaches to differentiating a passing score from a failing score on their driving exams. While applicants may fail the driving exam by making too many mistakes or not performing enough maneuvers correctly, they can also automatically fail the driving exam by making egregious errors that require the test to end immediately. The causes for automatic failure fell into the following categories:
- Being involved in a crash with another vehicle, object, or pedestrian
- Reckless driving
- Traffic law violation
- Failure to cooperate with driving examiner
- Inability to perform a maneuver required by driving examiner
- Dangerously insufficient driving skills
- Failure to use seat belt
- Loss of vehicle control
- Driving the vehicle off road (e.g., onto the curb)
- Any error that requires the driving examiner or other road users to take action to avoid a crash or other serious incident
- Attempting to bribe the examiner or cheat during the driving exam
Twenty-five states specified reasons an applicant will automatically fail the driving exam, and three-quarters of these states described that being involved in a crash will cause an automatic failure (Alabama, Alaska, California, Florida, Georgia, Kentucky, Louisiana, Maryland, Massachusetts, Michigan, Minnesota, Missouri, Montana, Oklahoma, Pennsylvania, Rhode Island, Washington, West Virginia, and Wisconsin). Reckless driving was another common reason for automatic failure, cited by 14 states (Alabama, Alaska, Arizona, California, Florida, Illinois, Kentucky, Louisiana, Minnesota, Missouri, Montana, Pennsylvania, West Virginia, and Wisconsin). Violations of traffic law were included as a reason for automatic failure in 21 states (Alabama, Alaska, Arkansas, California, Florida, Idaho, Illinois, Indiana, Kentucky, Louisiana, Maryland, Massachusetts, Michigan, Minnesota, Missouri, Montana, Oklahoma, Virginia, Washington, West Virginia, and Wisconsin).
Eighteen states described that failing to cooperate with the driving examiner was a reason for automatic failure (Alabama, Alaska, Arizona, Florida, Idaho, Indiana, Kentucky, Louisiana, Maryland, Massachusetts, Michigan, Minnesota, Missouri, Montana, Oklahoma, Rhode Island, Virginia, and Washington) and three states (Alaska, Minnesota, and Washington) specified that an applicant will automatically fail if they are unable to perform a maneuver required by the driving examiner. Six states (Alabama, Alaska, Arkansas, Michigan, Pennsylvania, and Wisconsin) indicated that they automatically fail applicants who appear to have dangerously insufficient driving skills, which may be due to unsafe driving habits or not enough driving practice, while failure to wear a seat belt will cause an automatic test failure in five states (Indiana, Maryland, Michigan, Virginia, and West Virginia). Two states (Florida and Wisconsin) stipulated that losing control of the vehicle during the driving exam will result in an automatic failure, and nine states (Florida, Georgia, Idaho, Indiana, Michigan, Rhode Island, Virginia, Washington, and West Virginia) described that driving the vehicle off road will cause an automatic failure.
Committing a driving error severe enough to require the driving examiner or other road users to intervene to avoid a crash or other serious incident (e.g., the driving examiner needs to use the dual brake to prevent the driver from going through a red light, a pedestrian needs to jump out of the way to avoid being struck) caused an automatic failure in seven states (California, Georgia, Louisiana, Michigan, Minnesota, Washington, and West Virginia). Michigan and Oklahoma specified that attempting to bribe the driving examiner or otherwise cheat during the driving exam results in an automatic failure. California automatically failed driving exam applicants for improper use of auxiliary equipment, which was not found in any other state.
If an applicant fails the driving exam, some states may require a minimum wait time before they are allowed to retest. Twelve states (Alabama, Colorado, Kansas, Maryland, Michigan, Missouri, Nebraska, New York, North Dakota, Oregon, South Dakota, and Utah) specified that, after failing the driving exam, applicants must wait until the next day to retest. Among these states, Kansas stipulated that applicants must wait 6 months to retest if they fail the driving exam four times, Maryland required that applicants wait at least 1 week before retesting after their second or subsequent failure, Missouri stated that applicants who fail the driving exam three times will be allowed to retest only after obtaining permission from the state department of revenue, and Nebraska described that applicants who fail three times will be required to complete a driver training course or hold a learnerʼs permit for 90 days before being allowed to retest. Eight states (Alaska, Arizona, Kentucky, Montana, New Mexico, Ohio, Vermont, and West Virginia) required applicants to wait 1 week before retesting, and two states (Delaware and New Hampshire)
mandated that applicants must wait 10 days before retaking the driving exam. Of these states, Vermont required applicants to wait at least 1 month before they can take their next driving exam if they have failed three or more times. Five states (California, Connecticut, Indiana, Massachusetts, and New Jersey) required applicants to wait 2 weeks before being allowed to retest. Massachusetts allowed applicants to take only six driving exams per year, Indiana required applicants to wait 2 months before retesting if they fail the driving exam three times, and New Jersey required an applicant to wait 6 months to retest if they fail several times without showing improvement. The remaining states each had different requirements:
- Rhode Island mandated that applicants who fail must wait at least 30 days to retest.
- In Idaho, applicants were required to wait at least 3 days before retesting.
- Arkansas required those who fail the driving exam to wait 14 to 30 days before retesting.
- Hawaii required applicants to wait 7 to 30 days before reattempting the test.
- Wyoming specified that their applicants must wait 1 to 3 days before retesting.
- Tennessee applicants were mandated to wait anywhere between 1 and 30 days before being able to retest, depending on how many errors they made during their last test attempt.
- Georgia described that applicants who crash or commit a traffic violation during the driving exam must wait 30 days before retesting. All other applicants who fail for the first time must wait only 1 day, and applicants failing for their second or subsequent time are required to wait 1 week to retest.
- South Carolina required new drivers to wait for 2 weeks before retesting, but applicants who previously held a driverʼs license were mandated to wait only 1 week between driving exams. All drivers were required to wait 60 days before retesting after their third or subsequent test failure.
- Florida did not specify a mandatory waiting period but did describe that failing the driving exam five times in 1 year would result in the suspension of driving privileges for 1 year.
- Louisiana was the most lenient state when it came to minimum waiting periods for retesting; applicants could take the driver test in Louisiana up to twice a day until they passed.
Other states had more detailed requirements for drivers who fail the driving exam, including tiered waiting periods depending on how many times the applicant failed the driving exam and mandatory driver education for those who failed:
- Mississippi required applicants who failed the driving exam to wait 1 week to retest, but after the second failure applicants were required to wait for 1 to 3 weeks. The waiting period increased further to 30 days after the third or subsequent failure.
- The District of Columbia delineated that applicants who failed the driving exam must wait 72 hours before retesting. However, if they failed six times within a 12-month period, they were mandated to wait 12 months from the date of their first failure before being allowed to retest.
- Virginia stipulated that drivers who failed the driving exam may retake the test after 2 days, but if they failed three times, they were required to complete the in-vehicle portion of a driver education course before being allowed to retest.
- Minnesota described that applicants who failed the driving exam were assigned practice driving time that had to be completed before their next test attempt. Failing the test four times required the applicant to complete 6 hours of behind-the-wheel training with a driving instructor before retesting.
- In Pennsylvania, applicants younger than 18 were required to wait 1 week to retest, and any applicant who failed three times must extend their learnerʼs permit before retesting.
- Oklahoma did not specify how long applicants must wait to retest but instead let driving examiners decide when each applicant would be allowed to retest. Oklahoma also described that applicants found cheating on the exam must wait one week to retest, and any applicant who failed three or more times must wait 30 days before retesting.
Evidence or Rationale for Existing Driving Exam and Scoring Methodologies
States may choose to provide evidence or rationale to justify their driving exam and the various steps applicants must complete to obtain a driverʼs license. To evaluate the justifications provided by each state, the research team used the Goals for Driver Education (GDE) framework, first described by Hatakka et al. (2002), which categorizes the aims of driver education programs into four hierarchies: (1) vehicle maneuvering, the most basic of the four levels, corresponding with knowledge of essential vehicle controls; (2) mastery of traffic situations to include complying with traffic rules and interacting with other drivers; (3) goals and context of driving, requiring the driver to consider the effect of the trip route and its purpose; and (4) goals for life and skills for living, whereby the driver understands how their habits and lifestyle affect their driving.
Twenty-eight states provided evidence or rationale for their driving exam and scoring methodologies. Ten of these states (California, Idaho, Iowa, Massachusetts, Nevada, New Hampshire, South Dakota, Tennessee, West Virginia, and Wyoming) explained that their driving exam exists to ensure drivers understand how to maneuver a vehicle, which meets only the first level of the GDE framework. The remaining 18 states (Alaska, Arkansas, Colorado, Delaware, Kansas, Kentucky, Louisiana, Maine, Maryland, Minnesota, Mississippi, Nebraska, New Jersey, North Carolina, Oklahoma, Oregon, Vermont, and Washington) described the importance of understanding how to drive alongside other road users in traffic as well as how to maneuver a vehicle, meeting the second level of the GDE framework. No state provided any evidence or rationale that met the third or fourth level of the GDE framework.
Exceptions to Policies to Accommodate Those with Medical Conditions or Physical Disabilities
Few states specified exceptions to their driving examination policies for those with medical conditions or physical disabilities. Seven states provided American Sign Language (ASL) interpreters for applicants who are deaf or hard of hearing (California, Colorado, Illinois, Maryland, Michigan, Vermont, and Washington). Colorado did not allow ASL interpreters to ride along with the applicant during the driving exam.
Post-Licensure Testing
Post-licensure testing requires drivers who are already licensed to complete another driving exam to maintain their driving privileges. This was a rare requirement described by only nine jurisdictions. Five of these jurisdictions (the District of Columbia, Maine, Maryland, Montana, and Nebraska) mandated that drivers be retested if they are deemed incompetent or unsafe drivers. Maine specified that drivers who are crash prone (defined as being in three or more crashes within a 3-year period) must retest, and Montana stipulated that drivers who have had their license expired for more than 1 year must also retest. Illinois required all drivers to retake the driving exam when they renew their license every 8 years unless they have not committed any traffic violations; every driver older than 75 must retest when renewing their license, regardless of prior traffic violations. Drivers in Mississippi who have a restricted license due to a disability must be reexamined each time they renew their license, while Colorado and New Mexico required drivers to be reexamined only in special cases.
Policies for Driverʼs License Suspension and Revocation
Most states described violations that may result in the suspension or revocation of a driverʼs license. Thirty jurisdictions used a point system to track each driverʼs violations and suspended
or revoked the driverʼs license after a certain number of points were accumulated (Alabama, Alaska, Arizona, Colorado, the District of Columbia, Florida, Georgia, Idaho, Indiana, Kentucky, Maine, Michigan, Missouri, Nebraska, Nevada, New Hampshire, New Mexico, New York, North Carolina, North Dakota, Oklahoma, Pennsylvania, South Carolina, South Dakota, Tennessee, Utah, Vermont, Virginia, West Virginia, and Wisconsin). Eleven other states (California, Illinois, Iowa, Kansas, Massachusetts, Minnesota, Mississippi, Montana, Texas, Washington, and Wyoming) did not appear to use a point system but still tracked repeat violations committed by drivers and stipulated that habitual traffic offenders (e.g., those who committed three reckless driving violations within one year) would have their licenses suspended or revoked.
Some states may choose to impose harder penalties on novice drivers who acquire points or commit traffic violations due to their relative inexperience and higher risk of crashing. Twelve states (Colorado, Florida, Georgia, Kentucky, Nebraska, New Hampshire, Pennsylvania, South Carolina, Tennessee, Utah, Virginia, and Wisconsin) defined their point system to be stricter for novice or young drivers (e.g., young drivers can only obtain six points in one year before having their license suspended, while all other drivers will have their license suspended only after accumulating 12 points). Six states (Connecticut, Iowa, New Hampshire, Pennsylvania, Texas, and Virginia) provided more stringent penalties for young drivers who commit traffic violations (e.g., young drivers who speed more than 26 mph over the posted speed limit may have their license suspended, while other drivers may only receive a ticket). Eight jurisdictions mandated that drivers who violate restrictions on their license would have their license suspended or revoked; only two of these states (Connecticut and Maine) clearly referred to restrictions on a young driverʼs license, which is often part of a stateʼs graduated driver licensing (GDL) requirements. The remaining six jurisdictions (Alaska, the District of Columbia, Florida, Idaho, Iowa, and Montana) referred to license restrictions generally, which can include GDL restrictions along with license suspension, revocation, and other restrictions (e.g., a license that is restricted to being used for business purposes only).
Driver Education Requirements
Driver education is often viewed as a crucial intervention to help novice drivers learn safe driving habits. Forty-eight jurisdictions provided information on whether driver education is required and, if so, what kind of instruction is required. Seven jurisdictions (Alabama, Arkansas, the District of Columbia, Indiana, South Dakota, Tennessee, and Wyoming) did not require driver education, although three of these states (Indiana, South Dakota, and Wyoming) described that completing driver education would allow drivers to obtain their driverʼs license at a younger age. Four states (Florida, Louisiana, Maryland, and New York) required all new drivers, regardless of age, to complete some form of driver education. Texas mandated drivers younger than 25 to complete a driver education course, while the driver education requirement in Utah only extended to teens younger than 19.
Twenty-six other states (Arizona, California, Connecticut, Delaware, Georgia, Hawaii, Iowa, Kentucky, Maine, Massachusetts, Michigan, Minnesota, Nevada, New Hampshire, New Jersey, New Mexico, North Carolina, Ohio, Oregon, Pennsylvania, Rhode Island, Vermont, Virginia, Washington, West Virginia, and Wisconsin) stipulated that drivers younger than 18 must finish driver education. Some of these states had additional features to their driver education requirements:
- Arizona allowed teens to bypass the driver education requirement if they completed at least 30 hours of supervised practice driving.
- Oregon and West Virginia did not require drivers younger than 18 to complete driver education if they completed an additional 50 supervised practice driving hours.
- Nevada described that if a teen is not within 30 miles of a state-approved driver education school and the teen does not have access to the internet, that teen would be allowed to circumvent the driver education requirement by completing 50 hours of supervised practice driving.
- Virginia required driver education only for those younger than 18, but drivers aged 18 years or older who completed driver education and held a learnerʼs permit were able to obtain their driverʼs license without needing to hold their permit for 60 days, as required for all other drivers.
- Kentucky specified that drivers who obtained their learnerʼs permit before they turned 18 were required to complete driver education before obtaining their license.
Idaho and South Carolina required teens younger than 17 to finish a driver education course, four states (Colorado, Montana, North Dakota, and Oklahoma) mandated that teens younger than 16 must complete driver education, and Mississippi described that teens under the age of 15 are required to complete driver education. Illinois stipulated that any driver aged 17 years and 3 months or younger must be enrolled in driver education to obtain their permit; drivers older than 17 years and 3 months were not subject to this requirement. Any driver younger than 18 who completed driver education with an A or a B grade and who passed the driving exam included as part of the driver education course was not required to take a driving exam at the Illinois Department of Motor Vehicles. Separately, any Illinois driver 18 through 20 years old obtaining their license for the first time was required to complete an adult driver education course. Nebraska required driver education only for drivers who would like to reinstate their license after having it suspended for point violations, for any driver younger than 21 years old who accumulated six or more points on their driving record, or for any driver who failed the driving exam three times.
A few states allowed drivers to bypass the driving exam requirement after completing an approved driver education course. Iowa described that drivers who complete driver education may have their driving exam requirement waived, unless the driver is younger than 18 and their parent or guardian requests that they complete the driving exam. Mississippi stipulated that completing driver education may waive the teenʼs driving exam requirement and allowed teens to bypass the driving exam requirement if their parent or guardian verifies that the teen has completed 50 hours of supervised practice driving. In Oregon, drivers who took a specialized driver education course were exempted from the driving exam. Wyoming allowed driving examiners to waive the driving exam requirement if the applicant showed certification that they completed an approved driver education program. (Wyoming applicants who previously failed the driving exam were not permitted to have their driving exam waived.)
States that required driver education usually also described the parameters of these courses, including the required amount of classroom instruction time, behind-the-wheel training time, and time spent observing other drivers. Of the 41 states that required driver education, 37 included specifications for the minimum amount of instruction time needed to complete a driver education program. The most common requirement was for 30 hours of classroom instruction and 6 hours of behind-the-wheel training time, as mandated by 10 states (California, Georgia, Maryland, Mississippi, North Carolina North Dakota, Oklahoma, Pennsylvania, Virginia, and West Virginia). Three states (Idaho, Vermont, and Wisconsin) also followed this model, requiring 30 hours of classroom instruction and 6 hours of behind-the-wheel training, but added a requirement for 6 hours of time spent observing other drivers as they drove supervised by a driving instructor. In addition to the classroom instruction and behind-the-wheel training requirements, Georgia required drivers to complete a 4-hour drug and alcohol course. North Dakota allowed drivers to bypass the classroom instruction requirement if they took driver education at a third-party school.
Other states had similar requirements with variations in the amount of instruction hours required:
- Delaware required 30 hours of classroom instruction, 7 hours of behind-the-wheel training, and 7 hours of observation time.
- New Hampshire drivers were required to complete 30 hours of classroom instruction, 10 hours of behind-the-wheel training, and 6 hours of observation.
- New York mandated drivers to spend 24 hours in classroom instruction, 6 hours training behind the wheel, and 18 hours observing other drivers.
- Iowa stipulated that drivers must complete 30 hours of classroom instruction and 6 hours of laboratory training, 3 of which must be spent behind the wheel.
- Washington described that their drivers must complete 30 hours of classroom instruction, 6 hours of behind-the-wheel training, and 1 hour of observation.
- Kentucky mandated drivers to complete only 4 hours of classroom instruction.
- Maine required 30 hours of classroom instruction and 10 hours of behind-the-wheel training.
- Massachusetts required 30 hours of classroom instruction, 12 hours of behind-the-wheel training, and 6 hours of observation time.
- Michiganʼs driver education standards required 30 hours of classroom instruction, 6 hours of behind-the-wheel training, and 4 hours of observation.
- Montana specified that drivers must complete 25 hours of classroom instruction and 6 hours of behind-the-wheel training.
- Ohio required 24 hours of classroom instruction alongside 8 hours of behind-the-wheel training.
- Texas mandated 32 hours of classroom instruction alongside 7 hours of behind-the-wheel training and 7 hours of observation.
- Rhode Island stipulated that drivers must complete 33 hours of classroom instruction.
- Nebraska required driver education students to complete 6 hours of classroom instruction and 6 hours of behind-the-wheel training.
- New Jersey directed students to complete 6 hours of behind-the-wheel training.
- South Carolina mandated a minimum of 8 hours spent receiving instruction in the classroom and 6 hours spent training behind the wheel.
The remaining states had varying or more detailed requirements. Colorado required 30 hours of classroom instruction for drivers younger than 15 and a half years old, but any driver aged 15 and a half up until 16 years old was allowed to complete either 30 hours of classroom instruction or a 4-hour classroom-based driver awareness program. Connecticut required drivers to complete 30 hours of classroom instruction but also stipulated that parents of teen drivers must attend a 2-hour segment of the driver education course that covers laws applying to teen drivers and the dangers of teen driving. Connecticut allowed parent-taught driver education, but drivers who complete this form of driver education must still complete an 8-hour course that covers the impact of alcohol and drugs on driving. In Louisiana, drivers younger than 18 were required to complete 30 hours of classroom instruction and 8 hours of behind-the-wheel training, while those aged 18 or older had the option of completing either a 30-hour classroom-based course or a 6-hour classroom-based course alongside 8 hours of behind-the-wheel training. New Mexico drivers had the option of either completing 30 hours of classroom instruction and 7 hours of behind-the-wheel training or completing 56 hours of classroom instruction. In Utah, the classroom instruction requirement varied between 18 and 30 hours depending on instruction method (i.e., high school, private driving school, or online), but all drivers were required to complete 6 hours of behind-the-wheel training. The adult driver education course in Illinois was 6 hours long, but Illinois did not specify how much instruction time was required for their teen driver education course. Hawaii did not describe how many instruction hours were required to complete driver
education, but Hawaii public schools offered 38 hours of classroom instruction alongside 6 hours of behind-the-wheel training.
Learning how to drive usually requires some hands-on instruction, so it makes sense that some states may require driver education programs, or at least a portion of them, to be conducted in person only. Of the 41 states that required driver education, 33 states (California, Colorado, Connecticut, Delaware, Georgia, Hawaii, Idaho, Illinois, Iowa, Louisiana, Maine, Maryland, Massachusetts, Michigan, Minnesota, Mississippi, Montana, Nebraska, New Hampshire, New Jersey, New York, North Carolina, North Dakota, Ohio, Oklahoma, Pennsylvania, Rhode Island, South Carolina, Vermont, Virginia, Washington, West Virginia, and Wisconsin) appeared to mandate that the course be completed in person. Connecticut and Oklahoma allowed parent-taught driver education to fulfill their requirements, which presumably would take place in person at the driverʼs home or in the driverʼs neighborhood. As previously described, Illinois had a separate adult driver education requirement for new drivers aged 18 through 20 years old; drivers could complete this course online, while drivers aged 17 and 3 months or younger had to complete driver education in person. Seven states (Arizona, Florida, Kentucky, Nevada, New Mexico, Texas, and Utah) allowed for online driver education, but Utah and Texas still required drivers to complete the behind-the-wheel portion of driver education in person. Oregon allowed drivers to complete a hybrid version of driver education, with some online and some in-person components, and specified that approved driver education schools could use a driving simulator to replace the state requirement for 6 hours of behind-the-wheel driving instruction. Delaware and Wyoming also allowed driver education schools to use driving simulators to replace their behind-the-wheel driving instruction requirement, but stipulated that every 4 hours spent in a driving simulator counts as 1 hour of behind-the-wheel training and that a driving simulator may substitute only 3 of the total behind-the-wheel training hours required.
Summary, Critique, and Implications
While all 50 states and the District of Columbia had requirements related to the driver licensing process, these requirements varied widely between jurisdictions. A high-level summary of existing testing policies and procedures is as follows:
- Most jurisdictions conduct driving exams on open roads during daylight hours. Deductive scoring is widely used during the driving test. A subset of states used a scoring method whereby each repeat driving error will add points to the applicantʼs score.
- Half of all states had criteria for automatically failing the driving exam, which included being involved in a crash, reckless driving, traffic law violations, failure to cooperate with the driving examiner, and a range of other serious violations.
- Driving examiners could be state employees or private third-party test examiners, and many states stipulated the qualifications and credentials required to be a driving test examiner.
- Most states required the lapse of at least 1 day after an applicant failed the driving test before allowing them to take the test again.
- Post-licensure testing was a rare requirement described by only nine jurisdictions. Five of these jurisdictions mandated that drivers must be retested if they are deemed incompetent or unsafe.
- Most jurisdictions used a point system for licenses to track each driverʼs violations and would suspend or revoke the driverʼs license after a certain number of points have been accumulated. Twelve states defined their point system to be stricter for novice or young drivers.
- Forty-one states required driver education, and 33 states mandated that the course be completed in person.
- The majority of states stipulated that drivers younger than 18 must finish driver education.
- Four states required all new drivers, regardless of age, to complete some form of driver education.
- A small number of states allowed drivers to bypass the driving exam requirement after completing an approved driver education course.
An important observation, which has implications for the project, is that few jurisdictions have undertaken evaluations of their driving tests and policies (or perhaps not published them for public review or in peer-reviewed scientific journals). Jurisdictions provide little or no scientific justification for their testing procedures. Rather, the state of practice related to driver testing policies in the United States appears to be the face validity of their current approaches and the legacy of having always conducted the tests in this way. In other words, the justification for the status quo is that this is how it has always been done, and the public expects the test to be conducted in this manner. This is not incorrect, but a reflection of the lack of an evidence base to justify certain procedures in driving exams. Other than computer-based hazard perception testing, which has shown to be positively correlated with safety outcomes, no specific set of maneuvers or procedures is associated with improved safety outcomes.
This review indicates that while requirements vary from state to state, there is an absence of scientific evidence to inform the development of a model driving examination process. To identify the core driving skills for safe driving and distinguish between high- and low-risk drivers, there will be a need for expert opinion, conceptual frameworks that are supported by learning theories, and approaches that have face validity. Further insights could also be gained from looking to other countriesʼ experiences in developing and refining their driving exams.
Task 2: Review and Summarize the Driving Skills Examination and Scoring Methodologies Used by Countries in the OECD
This section outlines the findings from the review of OECD countries (see the appendix). Information is provided under each of the categories of information outlined in Table 1.
Types of Roads on Which Testing Is Conducted
Most tests that were reviewed were conducted solely on public roads. However, the review highlighted countries where off-road facilities were used as part of the testing process. A brief description of these countries is provided in Table 2.
Off-road environments are used in some countries to prepare young and novice drivers for driving in poor weather conditions. The research team did not find evidence that off-road driving is included in the testing process, but it is a part of test preparation. Examples of this approach
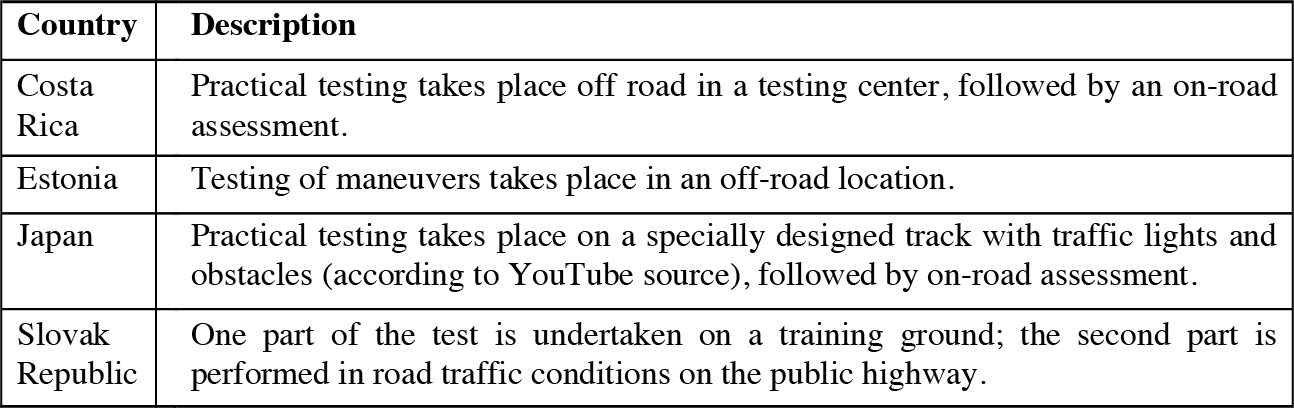
Long Description.
The table comprises two columns from left to right titled Country and Description. The entries across the first row for both columns are Costa Rica and Practical testing takes place off road in a testing center, followed by an on-road assessment. The entries across the second row are Estonia and Testing of maneuvers takes place in an off-road location. The entries across the third row are Japan and Practical testing takes place on a specially designed track with traffic lights and obstacles (according to YouTube source), followed by on-road assessment. The entries across the fourth row are Slovak Republic and One part of the test is undertaken on a training ground; the second part is performed in road traffic conditions on the public highway.
were found in Scandinavian countries. The evidence around the use of off-road environments is not clear, although specific training in skid recovery and similar maneuvers has been shown to increase risk in some circumstances (Glad, 1988). However, the inclusion of this part of training could be down to public expectations of what should be taught, not necessarily what leads to safety outcomes. One example is Denmark, where mandatory components of driver training include four practical maneuvers lessons on a track, four lessons on an advanced slippery track, and 16 driving lessons in traffic. The test is then conducted on the public highway.
Some countries use a multiple testing approach that requires candidates to demonstrate their driving skills through an initial practical test followed by a later test to obtain a full driverʼs license. Initial tests can examine the candidatesʼ ability to drive in specific road conditions that may not be included in the final practical test. Multiple skills tests can also be used as a way of providing younger drivers with the ability to drive safely with their parentsʼ permission before reaching the age at which they are eligible for a full, unconditional license. A brief description of countries using multiple testing approaches is provided in Table 3.
The addition of an off-road testing environment could provide a controlled environment in which to test practical aspects of driving skill (i.e., maneuvers such as parking, reversing around a corner). The downside is that such an environment lacks the presence of other traffic. In the case of Japan, congested road environments might dictate the need for a safe off-road setting. However, the driving test is typically designed to assess the ability of participants in real-world environments and to ensure they are capable of driving independently.
The inclusion of an off-road component of the driving test has practical implications for a licensing body. An off-road facility needs to be within reasonable range of a testing center for it to be incorporated into a practical driving test. Adding an off-road assessment creates a further step in the testing process, adding administrative effort for the licensing body and logistical considerations for the test participants.
Route Selection
The stated aim of most countries is to examine drivers across as many different road types as possible. However, this is typically defined as urban and rural roads. The evidence suggests that
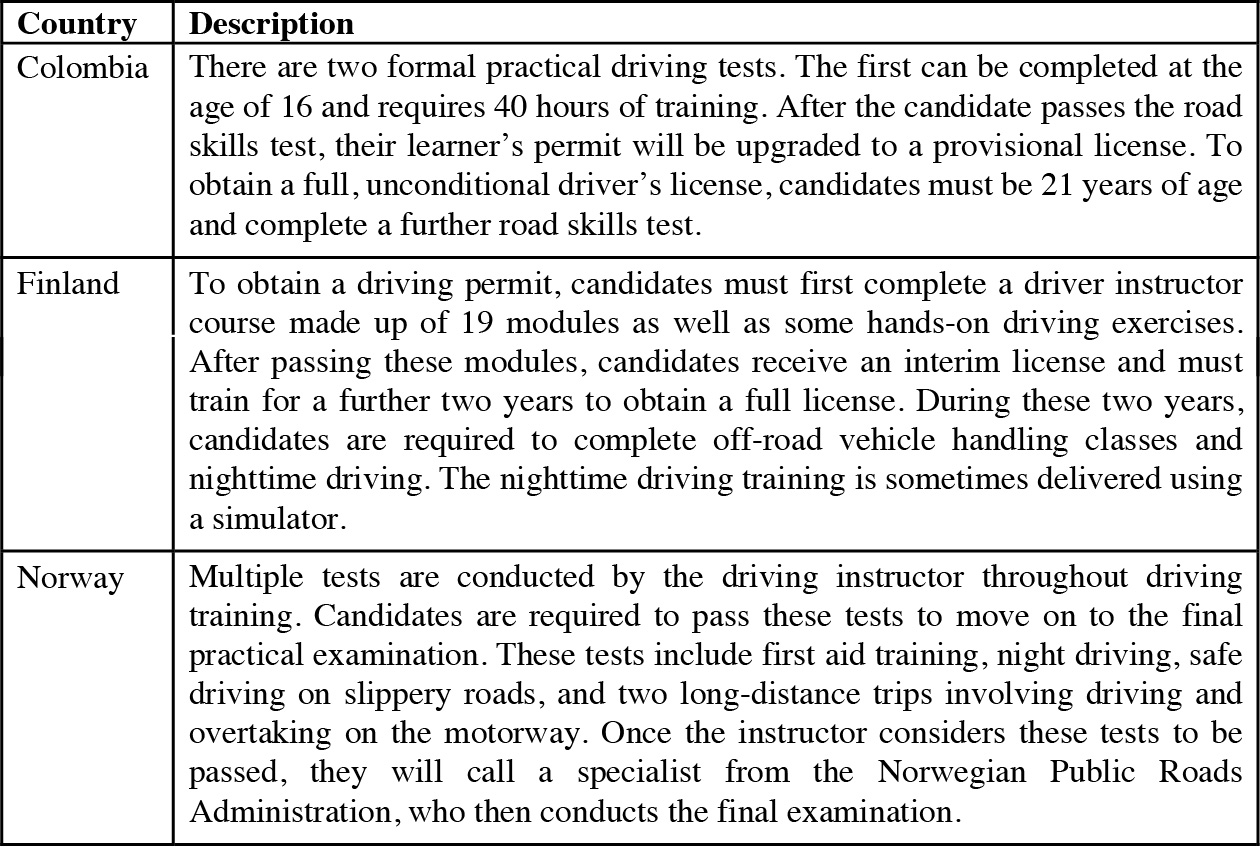
Long Description.
The table comprises two columns from left to right titled Country and Description. The entries across the first row for both columns are Colombia and There are two formal practical driving tests. The first can be completed at the age of 16 and requires 40 hours of training. After the candidate passes the road skills test, their learnerʼs permit will be upgraded to a provisional license. To obtain a full, unconditional driverʼs license, candidates must be 21 years of age and complete a further road skills test. The entries across the second row are Finland and To obtain a driving permit, candidates must first complete a driver instructor course made up of 19 modules as well as some hands-on driving exercises. After passing these modules, candidates receive an interim license and must train for a further two years to obtain a full license. During these two years, candidates are required to complete off-road vehicle handling classes and nighttime driving. The nighttime driving training is sometimes delivered using a simulator. The entries across the third row are Norway and Multiple tests are conducted by the driving instructor throughout driving training. Candidates are required to pass these tests to move on to the final practical examination. These tests include first aid training, night driving, safe driving on slippery roads, and two long-distance trips involving driving and overtaking on the motorway. Once the instructor considers these tests to be passed, they will call a specialist from the Norwegian Public Roads Administration, who then conducts the final examination.
urban environments are prioritized when there is flexibility in the testing route (i.e., a defined length of the test is the main factor defining the route taken).
Some countries specify which types of roads must be included in the test. This study assumes that this is achieved via pre-designed test routes.
It would be logical to assume that the outcomes of a test would be more positive if routes were pre-defined to achieve a variety of road environments rather than taking an ad hoc approach to testing routes. However, no evidence was found to directly address this, and it needs to be borne in mind that with set routes, instruction can focus on the specifics rather than the more general competencies that a range of road types should, in theory, provide.
Where pre-defined routes are used for the test, the selection tends to be random. Israel and Korea appear to use a tablet held by the instructor to select a route at random, for example. It seems to be standard practice that candidates and instructors will be aware of the routes in advance of the test, which allows pre-practice of the route. The downside is that this could encourage practice aimed toward passing the test, instead of practice on a variety of roads.
Independent Driving
Some countries have adopted an independent driving component (e.g., the Netherlands and the United Kingdom). This involves the use of a range of approaches (e.g., a satnav device or following road signs) to enable the pupil to drive without examiner input. In one case (Chile), it appears that pupils are expected to be able to navigate to five or six destinations from memory during the independent driving part of the test.
Time Taken to Complete the Test
A consistently applied minimum or maximum time was not reported for the test. There are a few factors to consider, but the first point is the main factor in relation to safety outcomes:
- The length of time taken to complete an assessment of a driver across a range of driving situations and road environments (this has a logical correlation with safety outcomes post-test).
- The importance of perception (i.e., face validity) in determining what the licensing authority deems to be an acceptable test duration. This is likely to be influenced by a range of stakeholders and the public.
- The administrative or infrastructure factors that affect the number of tests that can be completed in a day by a finite number of driving examiners.
It is logical that a longer test duration would be more challenging for a test participant. However, there will be a point at which a driver is being tested on their ability to manage fatigue. A driving test can be a stressful experience. Driving performance is likely to deteriorate if tiredness becomes a factor, which could result in errors that would not have occurred in normal situations.
As an overarching philosophy, the test duration should, ideally, be as short as possible to give the examiner an understanding of the ability of the driver and to make a pass/fail assessment.
Driving Maneuvers and Behaviors Included in the Driving Examination
A range of driving maneuvers was tested across the countries studied. A brief description of examples is provided in Table 4.
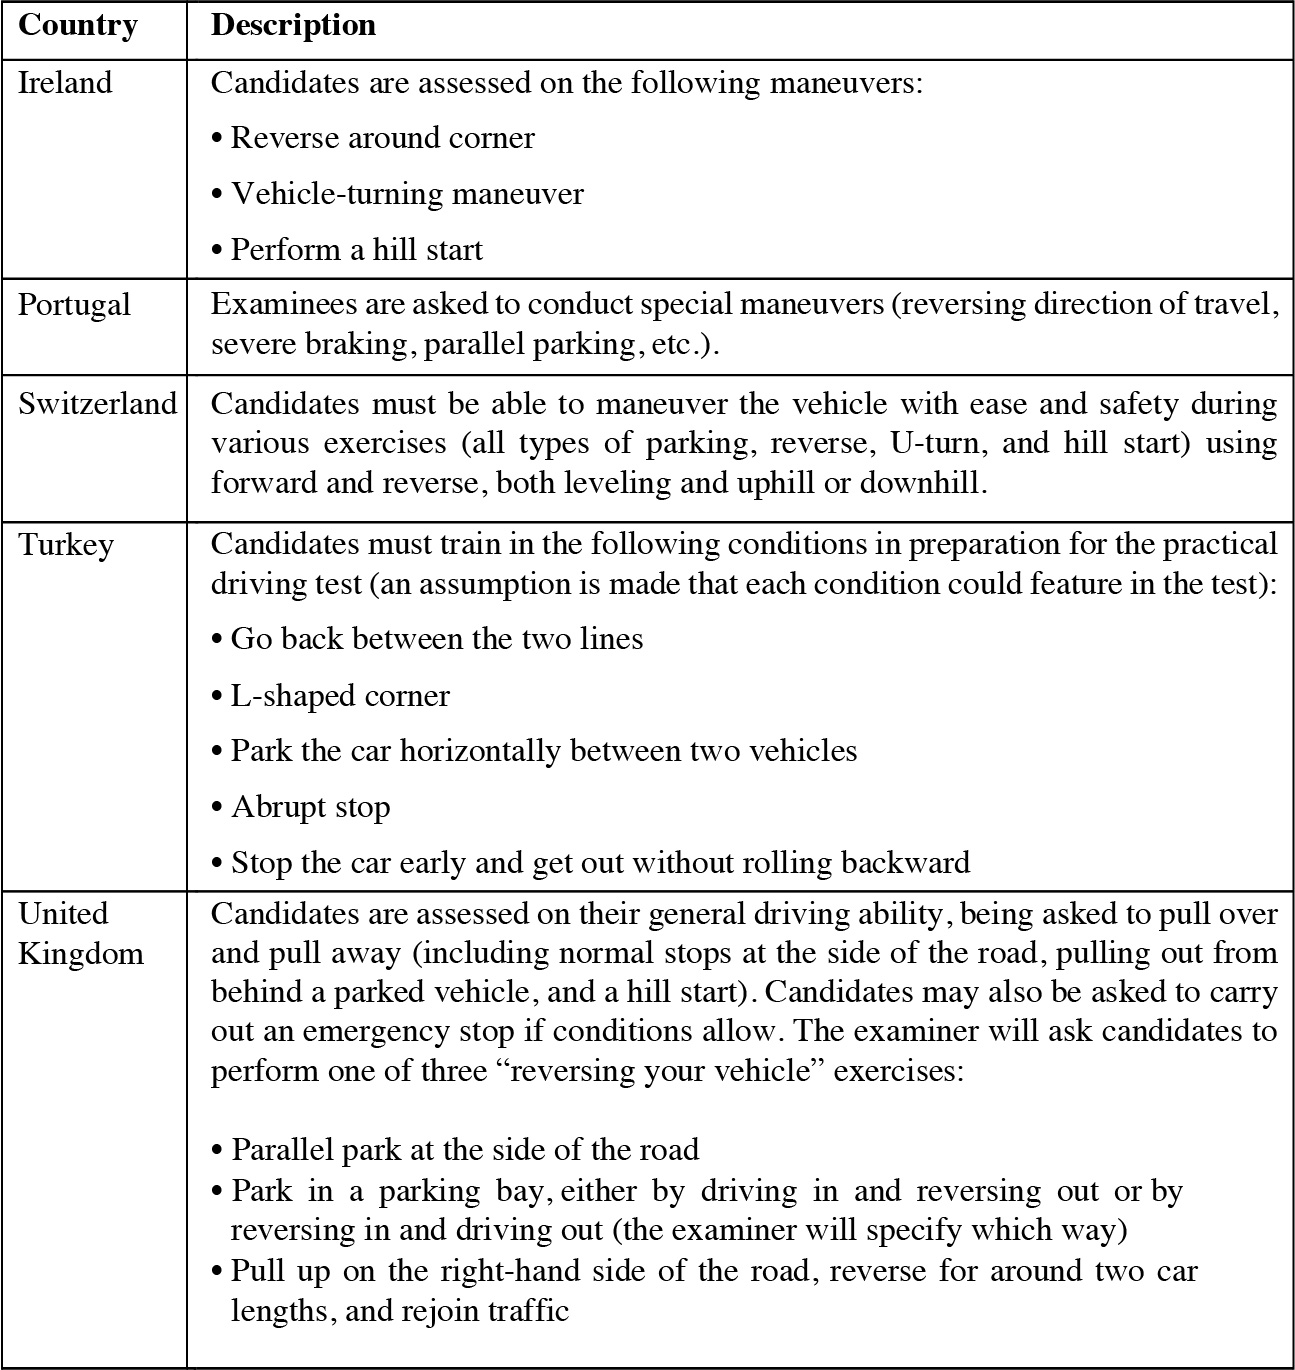
Long Description.
The table comprises two columns from left to right titled Country and Description. The entries across the first row for both columns are Ireland and candidates are assessed on the following maneuvers: reverse around corner, vehicle-turning maneuver, and perform a hill start. The entries across the second row are Portugal and examinees are asked to conduct special maneuvers (reversing direction of travel, severe braking, parallel parking, etc.). The entries across the third row are Switzerland and candidates must be able to maneuver the vehicle with ease and safety during various exercises (all types of parking, reverse, U-turn, and hill start) using forward and reverse, both leveling and uphill or downhill. The entries across the fourth row are Turkey and candidates must train in the following conditions in preparation for the practical driving test (an assumption is made that each condition could feature in the test): go back between the two lines, L-shaped corner, park the car horizontally between two vehicles, abrupt stop, and stop the car early and get out without rolling backward. The entries across the fifth row are United Kingdom and candidates are assessed on their general driving ability, being asked to pull over and pull away (including normal stops at the side of the road, pulling out from behind a parked vehicle, and a hill start). Candidates may also be asked to carry out an emergency stop if conditions allow. The examiner will ask candidates to perform one of three “reversing your vehicle” exercises: Parallel park at the side of the road; Park in a parking bay, either by driving in and reversing out or by reversing in and driving out (the examiner will specify which way); or Pull up on the right-hand side of the road, reverse for around two car lengths, and rejoin traffic.
Vehicle Checks and Knowledge
Some countries include vehicle checks as part of the test. This can be measured through static tests and tests conducted while driving the vehicle.
The United Kingdom is one such example where “show me, tell me” questions are included. Test participants are asked one “tell me” question (the driver explains how to carry out a safety task) at the start of the test before the participant starts driving, and one “show me” question (the driver shows how to carry out a safety task) while driving.
The rationale for “show me” is to test the pupil on vehicle knowledge. The “tell me” components assess whether a driver can safely divide their attention between the driving task and providing an answer to the question. In the UK driving test, drivers get one driving fault (sometimes called a minor) if they get one or both questions wrong. Importantly, a driver could also fail the test if their driving is dangerous or potentially dangerous while the driver answers the “show me” question.
Denmark, France, Germany, and Hungary have vehicle knowledge checks. In some countries, such as the Netherlands and Japan, this part of the test is called safety checks, which is likely to focus on ensuring the vehicle is safe to drive, rather than demonstrating knowledge of the functions of the vehicle while driving. It was not possible to identify how this component was scored in these countries.
Evidence demonstrating the correlation between vehicle checks could not be identified. Based on experience from the UK, vehicle checks were included following a consultation of what
stakeholders would like—or expect—to see in the test. A correlation with safety can be assumed (although no specific evidence can be identified). In other words, a driver who can drive safely while dividing their attention between tasks is likely to meet the minimum standard of driving independently on the road. In this way, there is potential value in including questions that are answered while driving to assess the capability of the driver to manage minor distractions related to driving and continue to drive safely. Care should be taken to make sure that distractions not related to driving (e.g., mobile phone calls) are not inadvertently normalized through such procedures.
Scoring Method Corresponding to Required Driving Maneuvers and Behaviors
Some countries score performance on a practical driving test by measuring competencies, while others measure faults. The study did not uncover detailed information on whether one of these scoring approaches is more effective than the other. One general approach appears to be consistent across the countries reviewed.
The standard approach taken seems to match that used in the United Kingdom. Scoring uses minor and major classes of fault. The United Kingdom uses driving fault and serious/dangerous fault, respectively. As explained, a serious or dangerous fault would result in an immediate failure of the test. Types of faults are defined in Box 1.
In Greece, driving maneuvers and behaviors are clustered into three groups, but the principle is underpinned by the major versus minor fault distinction:
- Group A (maneuvers): uphill start, on-the-spot turn, reversing with turning point, parking left or right on a road with an incline, safety measures
- Group B (serious errors): entry into oncoming traffic, ascent to pavement, causing an accident, violations
- Group C (good behavior): braking at various speeds, right and left turns, changing lanes correctly, directional indicators, changing gear on existing conditions, distance with other vehicles, correct speed, etc.
The candidate will succeed if they pass all tests in Group A, do not commit serious errors in Group B, and do not commit two errors in the same Group C test or more than four different simple errors.
Evidence for How Test Information Is Shared with the Driver Training Community
Within the United Kingdom, test routes were once shared with driving instructors, though this is no longer the case. It is sensible that this information not be shared with instructors, as it may lead to learners focusing too much on practicing test routes rather than applying their skills in a range of traffic and road situations, limiting their exposure to other environments and scenarios. Though information on test routes is no longer formally shared with instructors, in practice, they do get to know the test routes typically chosen by examiners.
No information relating to this topic was found for other OECD countries.
Examiners Qualified to Conduct the Driver Skills Test
Across the OECD countries review, it appears that driving examiners are typically state employees. Driving examiner testing and regulation tend to be overseen by the transport authority in the country in question. For the purpose of the study, either route seems to be acceptable, provided the way the test is administered is consistent.
The review did not uncover examples of, or a rationale for, the use of private contractors. Several interesting observations were made on the criteria for examiner training that have implications for the current study:
- Required assessment: It appears to be standard practice that an examiner would pass an assessment to examine young drivers and that regular refresher courses would be an expected component of the role.
- Defined minimum age for an examiner: For example, in Latvia, this is set at 24. The presumed rationale is that age is a proxy for driving experience, and that some maturation comes with age.
- Number of yearsʼ experience using the vehicle that the examiner is going to test others using: In Lithuania, this is set at 3 years. In the Netherlands, this is set at 8 years.
- Minimum educational attainment: For example, in Turkey, an examiner must be a college graduate to undertake the training.
Test Failure Policy
The minimum duration of time before a retest varies. Some countries have a mandated period, while some increase the period allowed between test failure and the retest in line with the number of test failures.
The rationale for extending the time between test failure and a retest should be to provide sufficient time to allow the pupil to reprepare to meet the standard and practice elements of the test that were failed. In practice, the shortest durations could be due to administrative preferences rather than safety benefits.
However, in practice, there is a perception that passing the driving test is in part down to chance or random events outside the pupilʼs control.
In Denmark, a minimum duration before a retest is not specified (but it is assumed that this is subject to availability). In the Czech Republic, a driving test can be retaken after 5 days. In Belgium, failure of the practical test on two occasions means a compulsory session of 6 hoursʼ training with a driving school before the test can be taken again. In Estonia, after each third failed driving test, a candidate must undergo further training with a driving instructor. In France, a minimum period of 28 days is imposed before the resumption of the practical examination. It appears that in Japan the test can be taken on the next day.
In Canada, the following rules apply:
- Waiting time after a first failed attempt: 14 days
- Waiting time after a second failed attempt: 30 days
- Waiting time after three or more failed attempts: 60 days
The potential safety benefits of longer wait times are:
- Encouraging more practice before repeating the test
- Increasing the time between multiple tests so that each successive test requires more lessons and supervised practice
For this study, the key considerations are:
- What is the minimum retest time needed for administrative purposes (which offer no theoretical safety benefit)?
- Is it preferable to have a uniform time after a failure, regardless of the number of times a pupil fails the test?
- Can a system be used to record the number of lessons taken before a retest?
Evidence of Rationale for Existing Driving Skills Examination and Scoring Methodologies
A few items of literature were identified to provide evidence on all items listed in Table 1. Alger (2019) notes a similar lack of evidence on the rationale for driver testing methods in her thesis focused on the Swedish driverʼs license test.
It is likely that some elements of driving skills testing are based more on common-sense practices than evidence. For instance, it is sensible for the practical element to be undertaken on public roads as opposed to a closed-circuit test track, as public roads will reflect real-world driving environments. Furthermore, it would appear sensible to cover many different road types and maneuvers during the practical test so that the learner driver can be assessed on their ability to manage the various situations and scenarios that they are likely to encounter during independent driving. This is a point of good practice raised in Helman et al.ʼs (2016) study on driver training and testing.
It was apparent from the search for academic literature that research in this area gives far greater focus to new driver training rather than demonstrating the rationale for the design details of specific driving skills tests. However, as the test acts as a barrier new drivers must pass through to be able to drive independently, it shapes what they will practice. Therefore, there is worth in considering the evidence around driver training and pre-test practice, and how these affect post-test safety outcomes. Another large area of evidence within this realm of research relates to hazard perception skills and testing. With regard to evidence relevant to the items in Table 1, one study relating to test failure policies was identified.
Boufous et al. (2011) examined the impact of outcomes on the practical driving test and a hazard perception test on the likelihood of being involved in a traffic collision among a cohort of young new drivers. Specifically, it was found that individuals who failed the practical test at least four times and those who failed the hazard perception test at least twice were at a greater risk of being involved in a collision compared with those who passed on their first attempt. For the practical test, the effect was found to be greater in females, while the effect was greater for males with regard to the hazard perception test. The number of test failures would appear to be an indicator of some drivers who are less safe. The Boufous et al. study was conducted in New South Wales, so it is possible that the exact number of test failures may differ by location and test design. However, this evidence presents a case for providing greater support to learner drivers
who fail their practical and hazard perception tests. An argument could therefore be made for increasing the length of time—or more specifically, the amount of time spent taking driving lessons—between test attempts.
This finding by Boufous et al. (2011) supports earlier evidence provided by Sexton and Grayson (2009), who demonstrated from a sample of nearly 43,000 learner drivers that those who pass their practical test on their first attempt have a lower risk of accident involvement.
The absence of evidence demonstrating the rationale for specific design details of driving skills testing (e.g., scoring based on errors versus competencies) is a notable gap in this research area. There is, therefore, reasonable argument for further investigation to understand what can be described as best practice with regard to driving skills tests.
Any Exceptions to Policies, Such as Accommodations for Medical Conditions or Physical Disabilities
Adaptation of Vehicles and Examiner Factors During the Test
This is normally arranged by a test center or facilitated by the transport authority in the countries.
- In Iceland, a vehicle equipped for a disabled driver may be used in teaching with the consent of the Icelandic transport authority.
- In Ireland, for drivers with disabilities, the test is conducted by a testing supervisor familiar with the techniques of disabled driving.
- Good practice includes specific support routes and advice channels to allow questions to be answered.
Requirement of a Medical Examination
This assessment documents the specific conditions or physical disabilities that determine the type of license that can be granted.
- In the Netherlands, a driver has two options: apply for temporary eligibility that is tied to a specific condition or permanent eligibility that is tied to having a permanent medical condition.
- In Colombia, drivers can have a vehicle equipped with orthopedic elements or auxiliary mechanisms and demonstrate through medical certification that they are authorized and trained to drive with the disability.
- In Germany, drivers are encouraged to look for schools that specialize in training people with physical disabilities. The driverʼs license authority will check whether existing illnesses and physical impairments exclude or impair driving. In this context, the authority may require a medical or technical opinion.
- In Greece, the test process will begin with a medical examination done by the doctors of state hospitals or a private doctor. The doctor must issue a medical certificate for the ability, driving style, adaptions, and limitations of the candidate. The driving tests are then the same.
Specific License Codes
These license codes relate to a disability and allow a driver to drive a specific type of vehicle.
- Some countries have specific codes of license that have restrictions.
- In some cases, license codes could pertain solely to the use of an automatic vehicle for the test, which would be matched to the driverʼs license.
- In Italy, driverʼs license categories give permission for the person to drive a vehicle with specific features related to the disability.
Other Relevant Factors
- In Poland, disabled persons are exempt from paying the fee for the practical part of the state examination.
- In Costa Rica, the transport authority provides extra services to support candidates with learning difficulties.
- In Norway, assistance is provided for people who need support on the theory test.
Policies for Driverʼs License Suspension and Revocation
It appears to be standard practice that recent test passers are subject to stricter rules than more experienced drivers, even outside full graduated licensing systems. In general, this is referred to as the probationary period after passing the test. This is a common-sense approach to identifying drivers who break the law after passing their test.
In some countries, new drivers have lower blood alcohol level limits and must not exceed a specified speed limit (e.g., in Spain, the alcohol limit is lower and drivers must not exceed 80 km/h).
In the United Kingdom, a license can be canceled (i.e., revoked) if a driver gets six or more points within 2 years of passing the test (rather than the usual 12). Different driving behaviors attract different penalty points. A driver must retake the theory and practical parts of the driving test to get a full license.
According to a UK government source, the European Community and European Economic Area countries that apply these rules include Austria, Belgium, Bulgaria, Croatia, Republic of Cyprus, Czech Republic, Denmark, Estonia, Finland, France, Germany, Greece, Hungary, Iceland, Ireland, Italy, Latvia, Liechtenstein, Lithuania, Luxembourg, Malta, the Netherlands, Norway, Poland, Portugal, Romania, Slovenia, Slovakia, Spain, and Sweden.
A slightly different approach is taken in New Zealand and Australia, where certain driving offenses incur demerit points. If a driver accumulates 100 or more demerit points in any 2-year period, the license can be suspended for 3 months. It appears that this policy is not specific to new drivers.
Theory Test
A common feature of the driving test across the OECD countries is a theory test component. This appears to have become a standard feature of driver testing. The theory test ensures a minimum standard of knowledge is achieved by a novice or learner driver. The standard theory test does not test skill in the same way as the practical test but, like other practical elements of a test, can perform the role of a barrier to entry.
Elements of the theory test include questions on signage, road rules, speed limits, and driverʼs license requirements. Questions are posed in a manner whereby there can be only a right or wrong answer, which leads to a pass/fail outcome. It appears to be standard practice that successful completion of the theory test is a prerequisite for progressing to the practical driving test.
The research team noted examples of hazard awareness questions, for example, in Finland. This type of question tests a candidateʼs ability to spot a potential hazard. The question format is, “What risk situation may develop in a situation when a larger vehicle turns in the same direction in a lane parallel to your own vehicle?” This form of static hazard perception test has a theoretical relationship with safety outcomes, but the team is not aware of any empirical evidence supporting this specific type of hazard perception testing.
Hazard Perception Testing
The United Kingdom implemented hazard perception testing in 2002 as part of the car and motorcycle theory test. Hazard perception testing is designed to test learner driversʼ awareness of hazards on the road through their response to short video clips that depict developing hazards. A well-designed hazard perception test should be able to discriminate between high- and low-risk road user groups (Horswill, 2016). Failing the test will therefore restrict an individual who is a higher-risk road user from independent driving and reduce the likelihood of being involved in a collision on the road. Hazard perception training has been shown to improve novicesʼ performance (Grayson and Sexton, 2002; Cao et al., 2022) and should be encouraged not only to practice for passing the hazard perception test but also to improve safety outcomes. The hazard perception test has been well recognized for its contribution to road safety through its demonstrable effect on reducing road traffic collisions (Wells et al., 2008; Horswill, 2016) and has been supported by the driver training and examiner community in the United Kingdom.
Hazard perception training and testing continue to be explored in the research. Cao et al. (2022) conducted a systematic review of hazard perception skills, identifying factors that influence hazard perception, such as age, fatigue, and distraction, and effective training methods. This review included support for different mediums, including through the use of pictures, videos, and computer-generated and simulator-based scenarios, which can improve anticipation times and eye-scanning patterns (McDonald et al., 2015). Recent research has also demonstrated the effectiveness of using real-world crash footage as a means of improving hazard perception skills (Horswill et al., 2021). Hazard perception skills training has also been associated with improvements in driver behavior, such as fewer instances of speeding, heavy braking, and over-revving (Horswill et al., 2022), as well as increases in more cautious driving behaviors (Zhang et al., 2022).
Given the evidence presented here, it is logical and therefore recommended to include hazard perception skills testing as part of any redesigned driving test. This recommendation is based in large part on hazard perception skillsʼ close correlation to improved safety outcomes. Including hazard perception as part of the testing process will also encourage learner drivers to practice these skills to pass the test, which should have demonstrable effects on improving their driving behavior and collision risk.
Pre-Test Practice, Driver Test Performance, and Post-Test Safety Outcomes
Helman, Grayson, and Parkes (2010) conducted a review of existing evidence on how driver education and training affects the collision risk of new drivers. One of the primary findings from this review is the wealth of literature, which demonstrates that traditional driver education and training have little to no effect on the collision risk of new drivers. Such training largely supports only the learning of basic vehicle control skills and can also be useful for promoting safer attitudes toward driving. Helman, Grayson, and Parkes (2010) conclude that driver training should give greater focus to the training of cognitive driving skills, such as hazard perception.
Hazard perception test performance is closely linked with improvements in collision risk and driving behaviors. Furthermore, hazard perception skills can be trained, presenting justification for learners to actively engage in practicing these skills during their pre-test phase. In addition, it has been shown that the number of failed attempts at the practical driving test and hazard perception test is linked with more negative post-test safety outcomes, such as increased collision risk (Sexton and Grayson, 2009; Boufous et al., 2011).
Considering GDL, the effectiveness of applying GDL components during the learner period in reducing road collisions and injuries is unequivocal. Evidence supports having a minimum
learner period (Ehsani, Raymond Bingham, and Shope, 2013) and phased exposure to certain driving scenarios, such as nighttime driving and carrying peer-age passengers (Williams, 2017). Conceptually the logic of gaining more hours of practice during the learning phase is also sound, although there is little evidence supporting the implementation of a minimum number of hours of supervised driving practice as part of the licensing system (Ehsani, Raymond Bingham, and Shope, 2013; OʼBrien et al., 2013).
One benefit of having a minimum learner period is that it gives greater opportunity for a learner driver to practice a greater number of different environments and scenarios (e.g., different weather and light conditions). This will allow a learner driver to gain a greater variety of experience under supervision and, ideally, make them less likely to encounter new situations in which they are unsure of how to appropriately react during solo driving. Having a range of road and traffic conditions represented on the test does seem to be sensible, as those drivers who have more practice on a range of road types (e.g., busy city centers and country roads) may have lower crash risk when they begin driving solo (see, e.g., Sexton and Grayson, 2009).
In sum, there is a link between elements of pre-test practice, performance on the practical driving test, and post-test safety outcomes. Taken together, the evidence supports the training of hazard perception skills and the application of GDL components for improving post-test safety outcomes. Furthermore, there is evidence that covering a wide range of road and traffic types in the test is a sensible approach. The demonstrable link between the number of failed test attempts and increased collision risk suggests that high-risk drivers need greater support to reduce this risk.
Conclusions and Recommendations
The overall purpose of this study and the companion study in the United States is to review the driving skills examination and scoring methodologies used by countries in the OECD. The two main factors of interest are:
- Driving skills examination: Skills and behaviors that are measured during the test and can ultimately lead to a pass or fail for the examination
- Scoring methodologies: Approaches that are used to score (i.e., quantify skills and behaviors), including the practical method (e.g., paper and pen, online system)
An important observation, which has implications for the project, is that the availability of information on both topics was limited. It was challenging to identify comprehensive summaries of driving tests in OECD countries, and few countries have undertaken evaluations of their driving test (or perhaps not published it externally). The research team understands that similar challenges have been experienced in the U.S. context. It was particularly challenging to identify scoring methodologies.
Throughout this report, the research team has referred to an important distinction between evidence validity and face validity. The former refers to inclusion of driver test components supported by evidence that links to positive safety outcomes. The latter refers to a more subjective interpretation of what should be in the test because the test is a statement of how the authorities and the public view the driving test and its role in keeping individuals and the public safe on the roads. There are overlaps between the two goals. For example, the correlation between knowledge of signs and road markings has an assumed (although not demonstrated) correlation with safety and is an expected part of the driving test.
Despite the practical challenges, the project has uncovered a number of insights that can be taken forward for consideration during the next stage of the project. Specific recommendations are presented in Table 5.
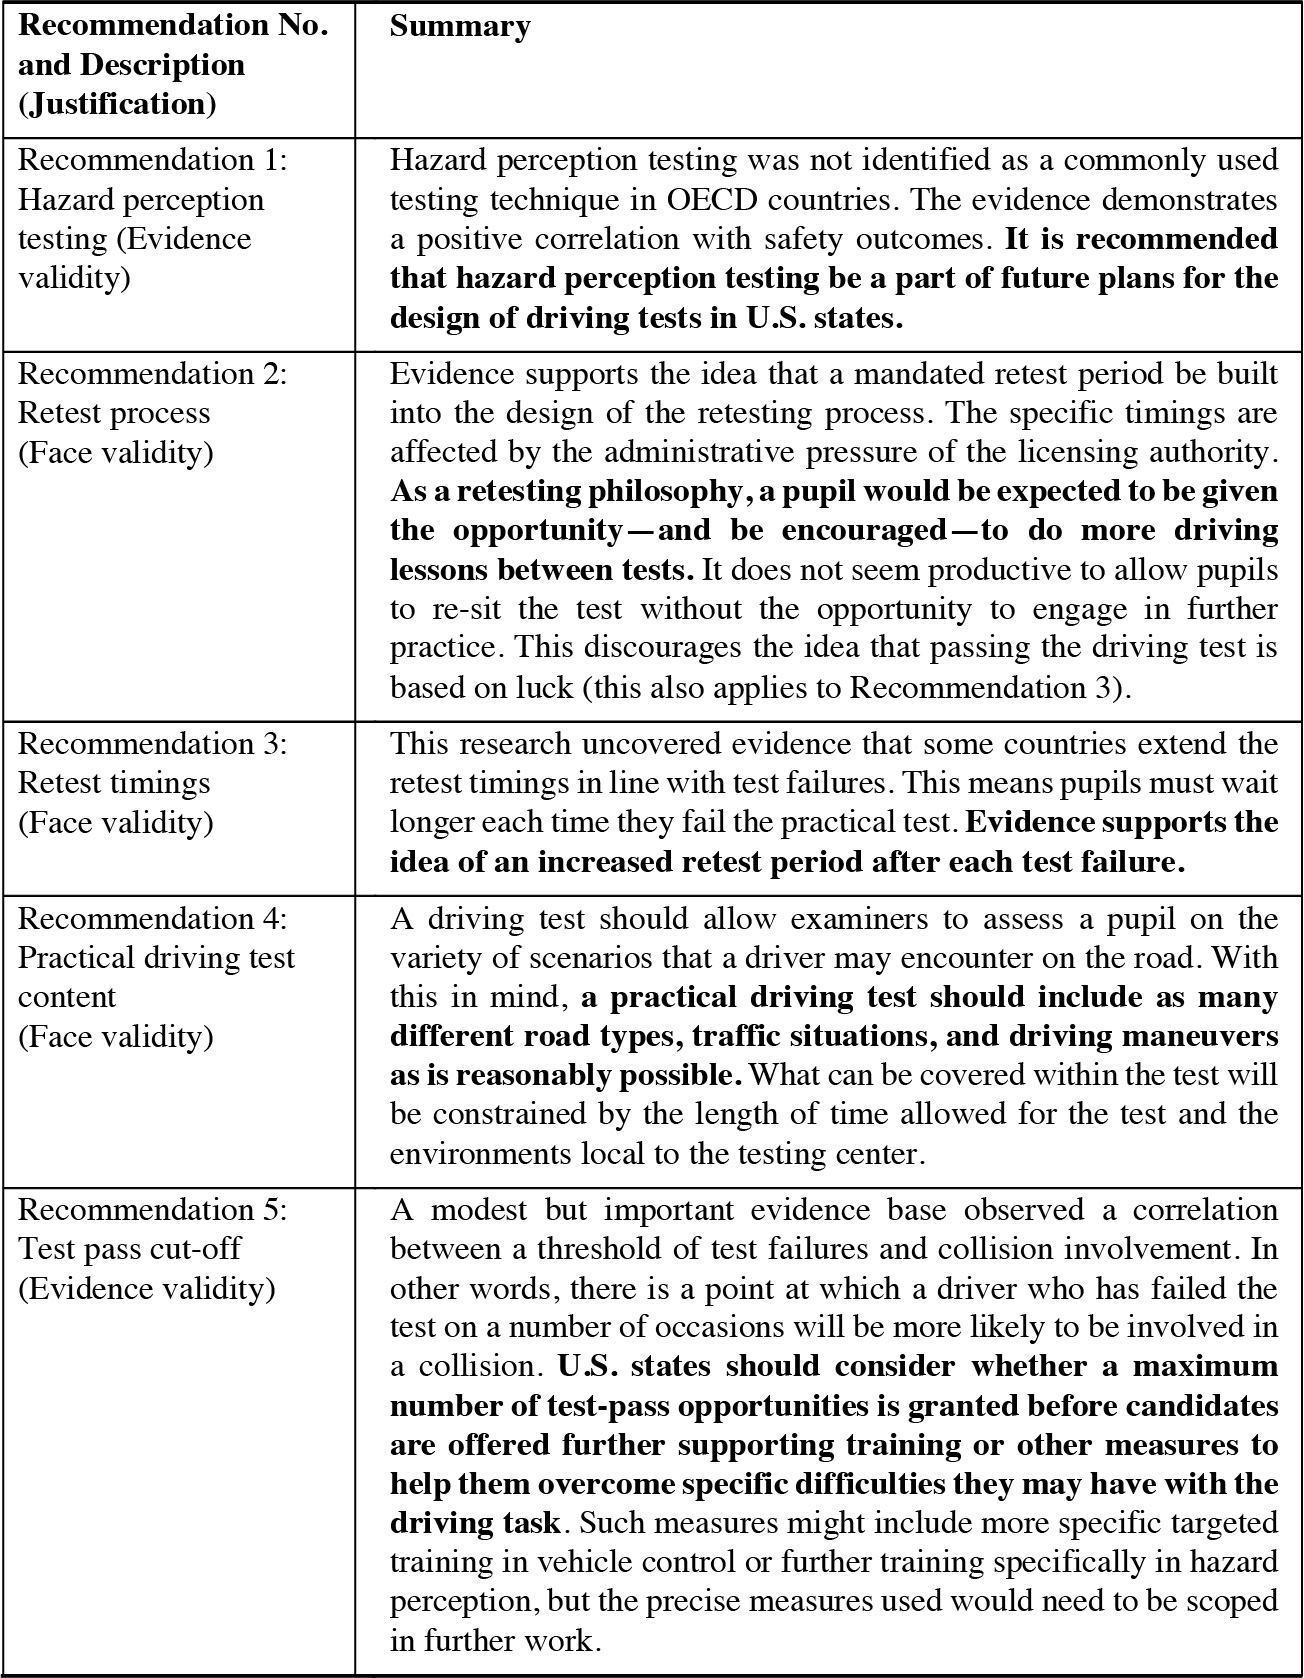
Long Description.
The table comprises two columns titled Recommendation number, Description (Justification) and Summary. The following are the entries from both columns from left to right: Recommendation 1: Hazard Perception Testing (Evidence validity); Summary: Hazard perception testing was not identified as a commonly used testing technique in OECD countries. The evidence demonstrates a positive correlation with safety outcomes. It is recommended that hazard perception testing be a part of future plans for the design of driving tests in U.S. states. Recommendation 2: Retest process (Face validity); Summary: Evidence supports the idea that a mandated retest period be built into the design of the retesting process. The specific timings are affected by the administrative pressure of the licensing authority. As a retesting philosophy, a pupil would be expected to be given the opportunity—and be encouraged—to do more driving lessons between tests. It does not seem productive to allow pupils to re-sit the test without the opportunity to engage in further practice. This discourages the idea that passing the driving test is based on luck (this also applies to Recommendation 3). Recommendation 3: Retest timings (Face validity); Summary: This research uncovered evidence that some countries extend the retest timings in line with test failures. This means pupils must wait longer each time they fail the practical test. Evidence supports the idea of an increased retest period after each test failure. Recommendation 4: Practical driving test content (Face validity); Summary: A driving test should allow examiners to assess a pupil on the variety of scenarios that a driver may encounter on the road. With this in mind, a practical driving test should include as many different road types, traffic situations, and driving maneuvers as is reasonably possible. What can be covered within the test will be constrained by the length of time allowed for the test and the environments local to the testing center. Recommendation number 5: Test pass cut‐off (Evidence validity); A modest but important evidence base observed a correlation between a threshold of test failures and collision involvement. In other words, there is a point at which a driver who has failed the test on a number of occasions will be more likely to be involved in a collision. U.S. states should consider whether a maximum number of test-pass opportunities is granted before candidates are offered further supporting training or other measures to help them overcome specific difficulties they may have with the driving task. Such measures might include more specific targeted training in vehicle control or further training specifically in hazard perception, but the precise measures used would need to be scoped in further work.
Task 3: Identify a Range of Fundamental Driving Skill Sets (e.g., Situational and Self-Awareness, Space and Speed Management, Vehicle Control, Decision Making) Regardless of Automobile Technology and in All Geographies
To advance Tasks 3, 4, and 5, an expert panel was convened (see the appendix) to offer their perspectives about what should be included in a new driving test. The panelists were requested to review the findings of Tasks 1 and 2 and provide the perspectives necessary for broad relevance, effectiveness, and acceptability for developing a model driving examination. The following information summarizes the key findings from the expert panel discussion.
The purpose of the driving test could be two-fold: While most panelists implied or directly stated that the purpose of the test was to determine the safe driving ability of an individual, one panelist who is a former state licensing official argued that the purpose was to determine whether individuals have the necessary skills to operate a motor vehicle but not necessarily in a safe
way. The idea of using the driving test as a gateway to determine “safe” or “unsafe” drivers was sensitive and not necessarily aligned with the goals of the licensing agency, which is focused on customer service and minimizing barriers to accessing a license. The premise of this argument was that driving skills tests are seen by community members and legislators as enabling access to mobility, rather than setting a threshold for safe driving ability. This is reflected in the model driverʼs license manual developed by the American Association of Motor Vehicle Administrators (AAMVA, 2022), which has 11 sections, of which only one is dedicated to safe driving. The panel agreed that the driving test could serve to both establish standards for safety and enable mobility. However, where the threshold for safety should be set in the driving test is a policy choice and not necessarily the highest priority.
There was a lack of consensus about what constitutes safe driving. Some panelists described safe driving as the absence of crashes, but others pointed out that the absence of a crash does not necessarily mean safe driving. The use of crashes as an indicator of safety reflects that crashes are observable and, more importantly, measurable. Nevertheless, crashes are an imperfect outcome to use when defining safety because crashes are relatively infrequent and are not a real-time indicator of driving behavior. Crash reports are unable to document the actual precipitating causes of a crash, only what is observable after a crash has occurred. Until recently, real-time measurement of driving behavior was not practical at a population scale. The use of telematics might represent an opportunity to measure safe driving behavior in real time. Using this approach could strengthen the scientific basis for developing a driving skills exam.
Hazard perception was discussed as having a scientific basis for inclusion in the driving examination process. Intersection scanning behavior, lane change eyeglance behavior (e.g., mirror-signal-maneuver routine), and driversʼ self-awareness and attitudes were discussed as skills that have face validity, meaning that they made sense to include but are not supported by scientific evidence of promoting safety.
The driving test is a tool for signaling how novice drivers are to prepare for independent, unsupervised driving. This is true even if the desired behaviors and outcomes cannot be measured or assessed. For example, asking about the driversʼ self-awareness of their emotional state is important because it signals that emotional self-awareness is a valuable characteristic to have, even though it is not easily assessed or objectively measurable.
Task 4: Map the Relationship Between the Fundamental Driving Skill Sets and the Identification of Low versus High Safety Risk Drivers and Provide a Rationale That Identifies How the Skill Sets Are Necessary for Safe Driving
Identifying the fundamental driving skill sets for safe driving is a challenge for several reasons. The absence of a clear consensus from the expert panel meeting (see the appendix) about the specific driving maneuvers to include in an examination reflects the findings of the national and international scan of the literature that showed no scientific evidence to support the inclusion of certain driving maneuvers.
As stated in the previous section, there is also no clear definition of safe driving. While crashes are likely to be an outcome of unsafe behaviors, such as excessive speed or inattention, the absence of a crash is not a demonstration of safe driving, and some crashes may be unavoidable even for the safest driver. Nevertheless, crashes are widely used as an outcome measure.
In the absence of a strong evidence base linking specific driving maneuvers to safety outcomes, conceptual frameworks can be used to determine the fundamental driving skill sets and safe
driving (Table 6). For example, the GDE framework is a useful tool to show different goals that could form part of driver education and testing activities.
The driving test is best suited to focus on the areas highlighted in items A1 through A10, B1 through B9, and C1 through C8 in Table 6. These components are measurable, observable, repeatable, and scorable at a large scale. They either have a known correlation with collision risk or are deemed to be a requirement of a test due to common sense or, in other words, face validity. Items A11 through A17, B10 through B16, and C9 through C12 can also be covered by the knowledge or on-road examinations, but many of these cannot reliably be measured or scored despite their importance.
Previous work (deliverables for BTSCRP Project BTS-16, Tasks 2a and 2b) has noted the lack of evidence supporting the inclusion of certain stand-alone maneuvers in a driving test; there is no evidence to suggest that the inclusion of one maneuver or a suite of maneuvers leads to guaranteed safety outcomes. Nevertheless, the analysis of the existing driving maneuvers suggests room for improvement. The following section will provide a three-phase process that defines a pathway toward an evidence-based driving examination system with near-term and long-term goals.
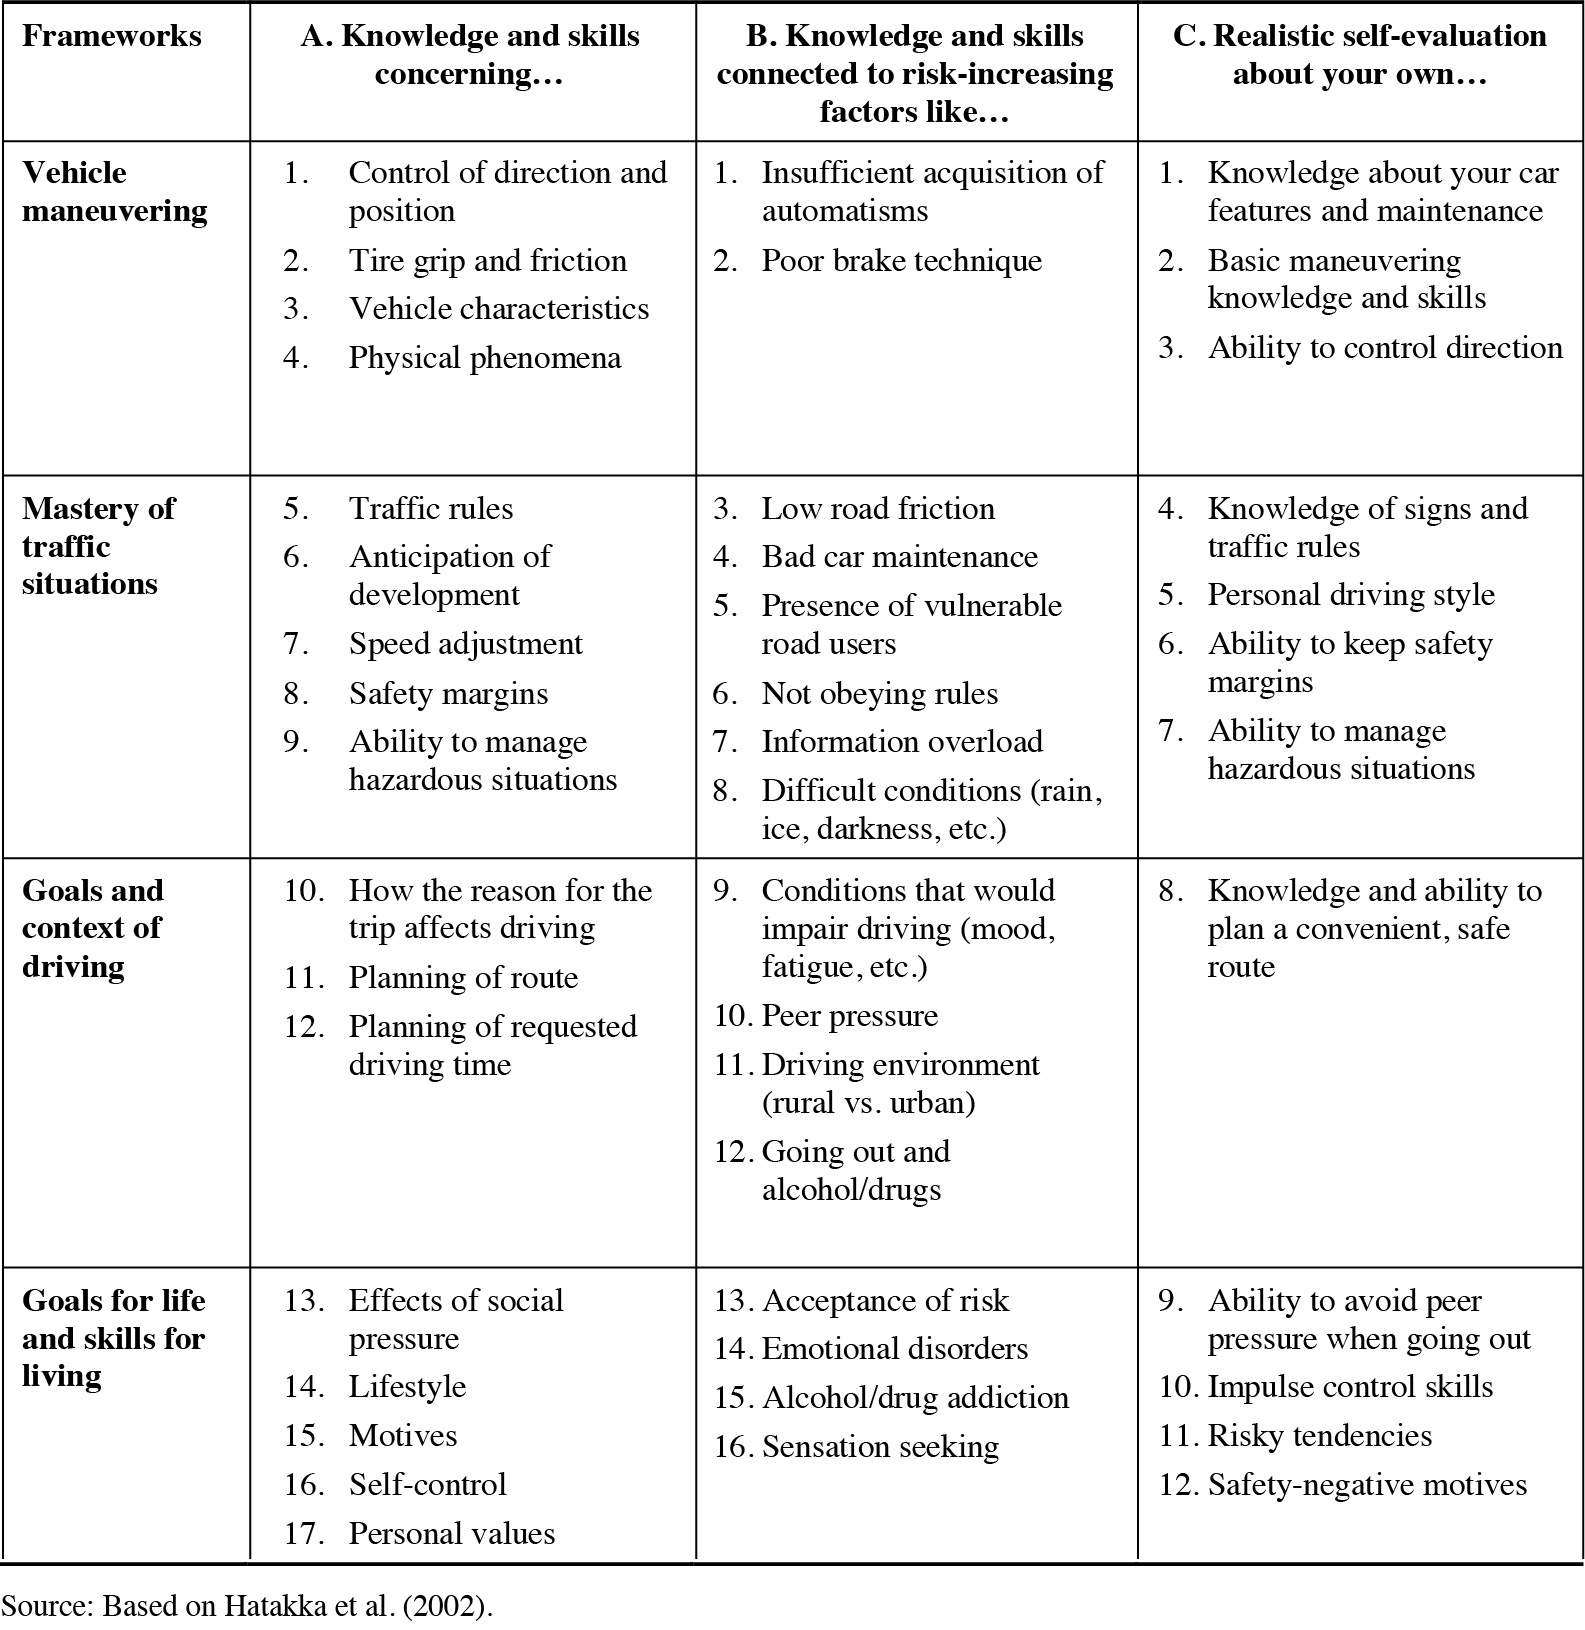
Long Description.
The table comprises four columns from left to right: (1) Frameworks; (2) A. Knowledge and skills concerning…; (3) B. Knowledge and skills connected to risk-increasing factors like…; and (4) C. Realistic self-evaluation about your own….The first framework under the first column is Vehicle Maneuvering. Under the second column, this framework contains knowledge and skills concerning 1. Control of direction and position, 2. Tire grip and friction, 3. Vehicle characteristics, and 4. Physical phenomena. Under the third column, this framework contains knowledge and skills connected to risk-increasing factors like 1. Insufficient acquisition of automatisms and 2. Poor brake technique. Under the fourth column, this framework contains realistic self-evaluation about your own 1. Knowledge about your car features and maintenance, 2. Basic maneuvering knowledge and skills, and 3. Ability to control direction. The second framework under the first column is Mastery of traffic situations. Under the second column, this framework contains knowledge and skills concerning 5. Traffic rules, 6. Anticipation of development, 7. Speed adjustment, 8. Safety margins, and 9. Ability to manage hazardous situations. Under the third column, this framework contains knowledge and skills connected to risk-increasing factors like 3. Low road friction, 4. Bad car maintenance, 5. Presence of vulnerable road users, 6. Not obeying rules, 7. Information overload, and 8. Difficult conditions (rain, ice, darkness, etc.). Under the fourth column, this framework contains realistic self-evaluation about your own 4. Knowledge of signs and traffic rules, 5. Personal driving style, 6. Ability to keep safety margins, and 7. Ability to manage hazardous situations. The third framework under the first column is Goals and context of driving. Under the second column, this framework contains knowledge and skills concerning 10. How the reason for the trip affects driving, 11. Planning of route, and 12. Planning of requested driving time. Under the third column, this framework contains knowledge and skills connected to risk-increasing factors like 9. Conditions that would impair driving (mood, fatigue, etc.), 10. Peer pressure, 11. Driving environment (rural vs. urban), and 12. Going out and alcohol/drugs. Under the fourth column, this framework contains realistic self-evaluation about your own 8. Knowledge and ability to plan a convenient, safe route. The fourth framework under the first column is Goals for life and skills for living. Under the second column, this framework contains knowledge and skills concerning 13. Effects of social pressure, 14. Lifestyle, 15. Motives, 16. Self-control, and 17. Personal values. Under the third column, this framework contains knowledge and skills connected to risk-increasing factors like 13. Acceptance of risk, 14. Emotional disorders, 15. Alcohol/drug addiction, and 16. Sensation seeking. Under the fourth column, this framework contains realistic self-evaluation about your own 9. Ability to avoid peer pressure when going out, 10. Impulse control skills, 11. Risky tendencies, and 12. Safety-negative motives.
Task 5: Develop a Model Driving Skills Examination Process That Includes Evaluation of Fundamental Driving Skill Sets, Scoring Criteria and Protocols, Examiner Scoring Methodology, Route Selection Criteria, and Procedures for Examination Administration
Changing the driving examination and licensing process in any state has far-reaching implications. There are a wide range of stakeholders with differing priorities. The absence of evidence demonstrating the rationale for specific design details of driving skills testing (e.g., scoring based on errors versus competencies) is a notable gap in the scientific literature. There is, therefore, reasonable argument for further investigation to advance what can be described as an evidence-based driving examination process in the United States.
An evidence-based driving examination process can be advanced in three phases: From the outset, licensing officials will need to articulate the desired balance between road safety and access to mobility. Ideally, safety would be the highest priority, but this is likely to vary across jurisdictions, depending on the priorities and values of the driving population. This balance will then define the desired outcomes of the driving exam (e.g., the duration of the examination, the rigor of the scoring protocol, an acceptable minimum pass rate, the retest procedure in the event of a failure).
Based on the literature scan and practice review, along with input from the expert panel (see the appendix), the research team recommended the incorporation of hazard perception testing into the driving examination process in Washington. Specifically, the team recommended that an online hazard perception test be required before the practical test is undertaken, as a supplement to the knowledge test, and additional questions to supplement the behind-the-wheel exam.
Online Hazard Perception Testing
An additional recommendation was to develop hazard perception training materials for learners. The motivation for including hazard perception testing in the driving examination process was to motivate the completion of hazard perception training (also called Risk Awareness Perception Training, or RAPT), which has been shown to reduce crash risk. An online version of RAPT would be developed, coupled with training to guide learners through the materials. The online hazard perception test would be designed to be taken on participantsʼ personal computers.
An online platform was developed to train and test students on hazard perception. The hazard perception test and RAPT-based training modules were delivered via a web application accessible through supported browsers (e.g., Google Chrome, Microsoft Edge, Apple Safari). Built using Java, SQL, JavaScript, HTML, and CSS, the platform ensured secure access through user-specific login credentials. Data collection and storage, managed by Johns Hopkins University, included usersʼ responses, time spent on each question, and completion of training modules.
The hazard perception test was designed for multiple assessment points throughout the driver education course. It included 18 questions covering three driving scenarios: intersections, curves, and rear-end collisions. The test followed a structured sequence:
- Pre-test: Administered during the second driver education course session.
- Post-test 1: Conducted near the courseʼs conclusion. For the intervention group, access was restricted until all training modules were completed.
- Post-test 2: Available after course completion to evaluate knowledge retention.
An online self-guided hazard perception training program was developed, consisting of three modules delivered progressively across the driver education course. Each module included six driving scenarios, totaling 36 interactive activities. The training, adapted from RAPT, provided
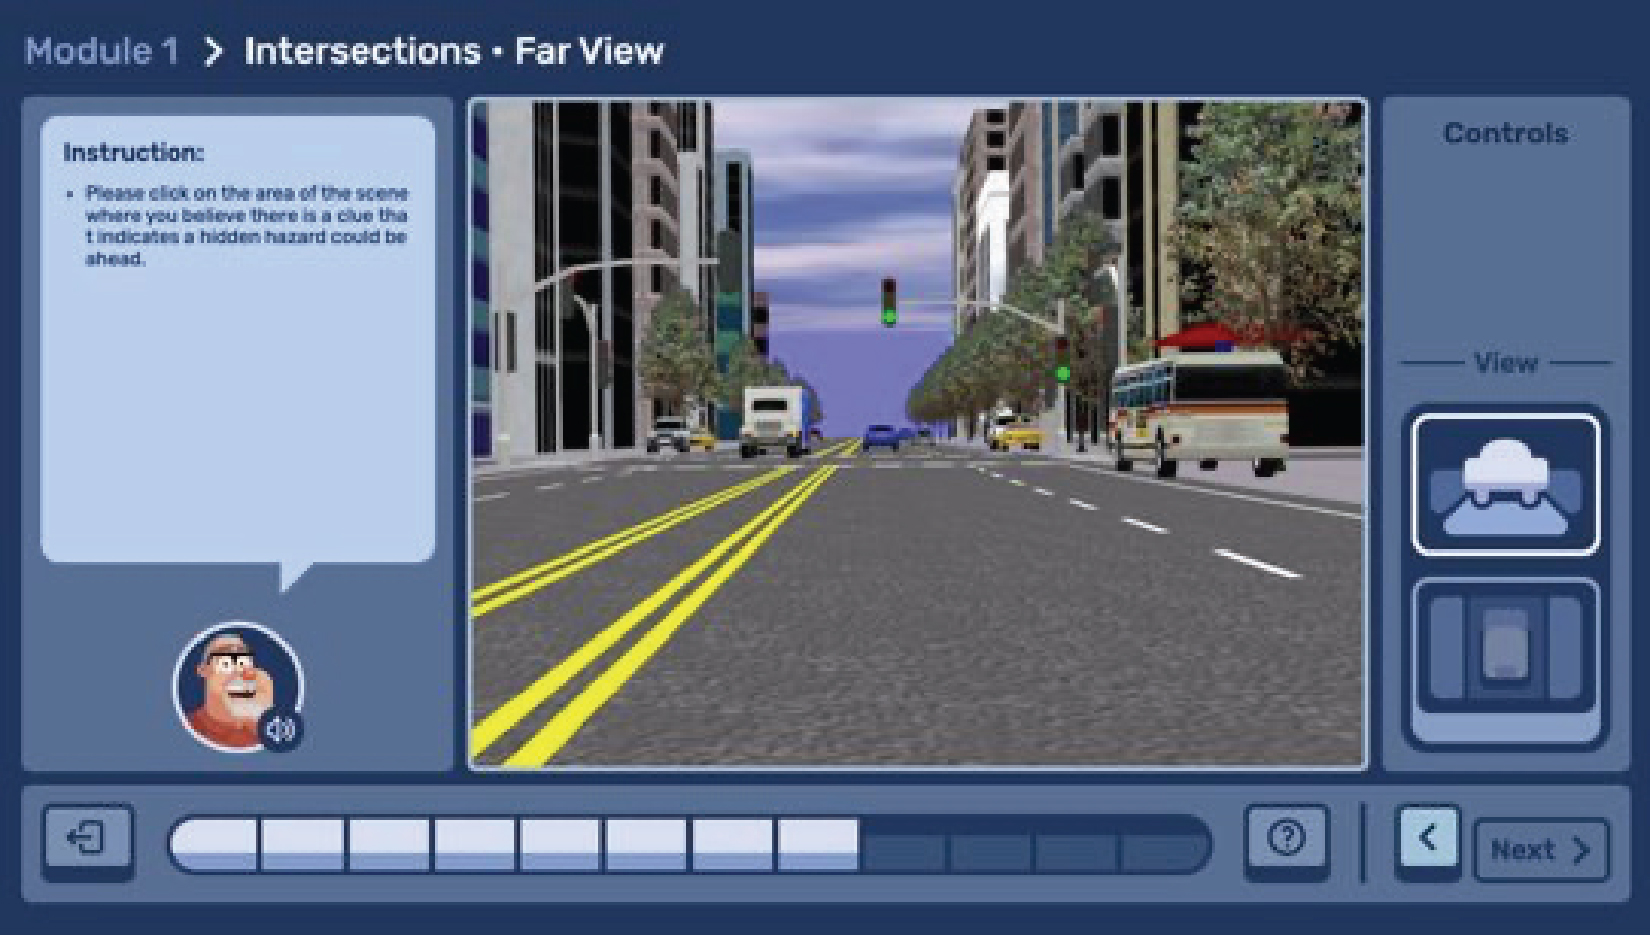
Long Description.
The interface includes a far view of an urban intersection with multiple vehicles and a bus. A left turn lane is marked with yellow lines. The interface also features a control panel on the right with various buttons for navigation and interaction. An instruction box on the left side guides on identifying hidden hazards by clicking on the scene.
structured exercises to enhance studentsʼ ability to identify and respond to potential hazards. Figure 2 displays an example of one of the training scenarios.
Behind-the-Wheel Exam
For the behind-the-wheel practical driving test, the study team developed two items for inclusion in the skills exam based on input from an expert working group. These items did not affect the scoring of the test or the passing or failing assessment of the driver and were collected alongside the existing items.
The first addition was conducted during the drive itself. Instructors were asked to observe when the driver began a lane change to identify the sequence in which the driver conducted the mirror check, signaled to change lanes, and executed the lane change. The rationale for this first addition was to identify whether the driver went through the process of making a change in a safe manner. The safe process is for the driver to gather their situational awareness first (mirror checks), then inform others what they intend to do (signal), then do a final check (over-shoulder check), and then change lanes (maneuver).
The second addition was administered at the end of the exam. Drivers were asked to reflect on their driving, with prompts including whether anything unexpected or surprising happened on the drive. Following this, they were asked to articulate some areas where they still needed to improve their driving skills. The rationale for this second addition was to test for self-evaluation. The three questions probed three essential aspects of their safe driving: Was the driver aware, predictable, and smooth? All information was collected on an electronic tablet during the behind-the-wheel test.
Task 6: Pilot Test the Model Driving Skills Examination Process and Scoring Protocols in at Least One State
The research team enrolled teenage drivers into a pilot study to evaluate the effectiveness of a change in driver education. These teens were enrolled into the study upon entering a driver education course in preparation for obtaining their licenses. In total, seven driving school locations
across the state of Washington participated in the study. The study primarily comprised participants between 15 and 16 years of age. Teens in the study were enrolled between July 15 and September 30, 2024. Primary study activities included a baseline survey, a hazard perception pre-test, a hazard perception post-test, and a hazard perception training for those in the intervention group. The final sample included 712 participants in the control group and 800 participants in the intervention group. Table 7 presents demographic characteristics for the full sample as well as by study group.
Overall, 97 percent of participants completed the baseline survey, 95 percent completed Quiz 1, 90 percent completed Quiz 2, and 72 percent installed the smartphone application to measure their driving behavior. Approximately 86 percent of the intervention group completed all modules of the hazard perception training; all participants in the control group completed the intervention, as the control intervention was watching a series of vehicle maintenance videos during their driver education course. Completion of training and installation of the driving app were the two activities with the greatest divergence between groups.
Figure 3 presents completion rates for the full 1,512 participants by study arm.
From the telematics data component of the study, the research team collected a total of 2.2 million miles of driving data across 1,089 unique participants. This data corresponds to 326,158 trips from July 16, 2024, to March 3, 2025, and 78,293 hours driven by the over 1,000 students—with 468 of those in the control group and 621 in the intervention group. Table 8 provides additional detail on the number of trips, miles traveled, and hours traveled by study arm and for each month since enrollment in driver education. One key consideration is that the study is still progressing, with not all participants having reached 8 months or more of driving. Therefore, the number of participants with data starts to decline at this point as fewer participants have reached that number of months since starting their driverʼs education course.
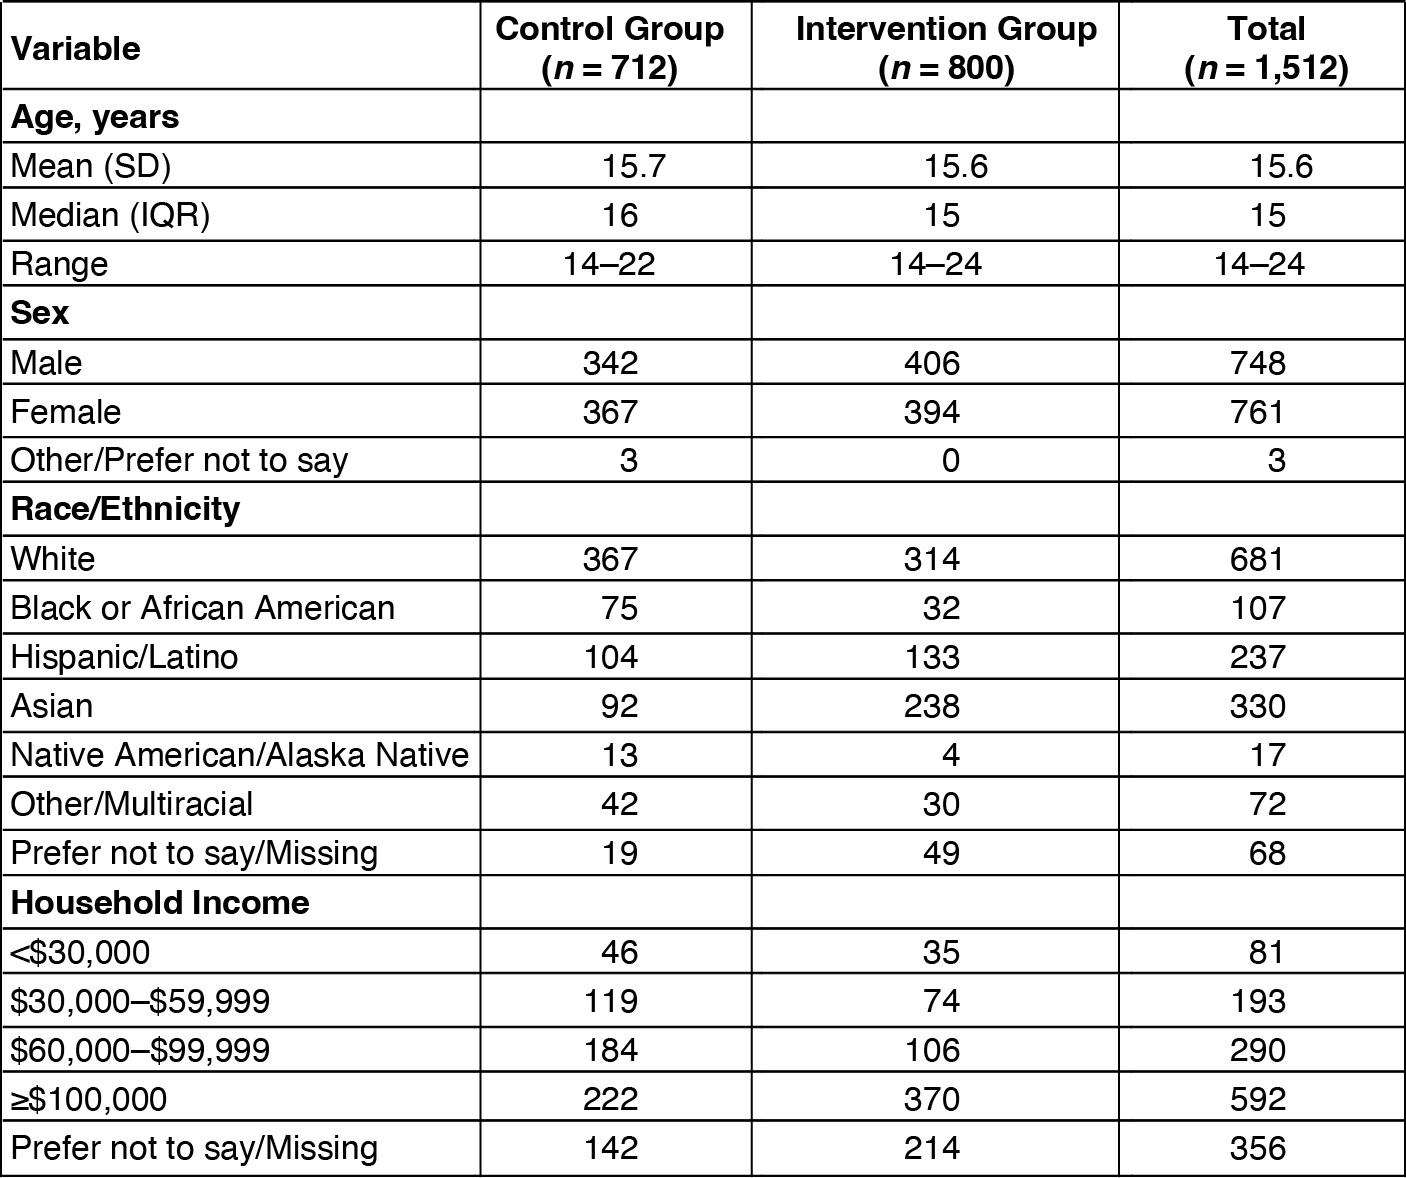
Long Description.
The table comprises four columns left to right titled Variable, Control Group (n = 712), Intervention Group (n = 800), and Total (n = 1,512). The first entry under the Variable column is Age, years, under which are three entries top to bottom: Mean (SD), Median (IQR), and Range. The Mean (SD) values for Control Group, Intervention Group, and Total are 15.7, 15.6, and 15.6, respectively. The Median (IQR) values for Control, Intervention, and Total are 16, 15, and 15, respectively. The Range values for Control, Intervention, and Total are 14–22, 14–24, and 14–24, respectively. The second entry under the Variable column is Sex, under which are three entries from top to bottom: Male, Female, and Other or Prefer not to say. The values for Male for Control, Intervention, and Total are 342, 406, and 748, respectively. The values for Female for Control, Intervention, and Total are 367, 394, and 761. The values for Other or Prefer not to say for Control, Intervention, and Total are 3, 0, and 3, respectively. The third entry under the Variable column is Race or Ethnicity, under which are seven entries top to bottom: White, Black or African American, Hispanic or Latino, Asian, Native American or Alaska Native, Other or Multiracial, and Prefer not to say or Missing. The values for White for Control, Intervention, and Total are 367, 314, and 681, respectively. The values for Black or African American for Control, Intervention, and Total are 75, 32, and 107, respectively. The values for Hispanic or Latino for Control, Intervention, and Total are 104, 133, and 237, respectively. The values for Asian for Control, Intervention, and Total are 92, 238, and 330, respectively. The values for Native American or Alaska Native for Control, Intervention, and Total are 13, 4, and 17, respectively. The values for Other or Multiracial for Control, Intervention, and Total are 42, 30, and 72, respectively. The values for Prefer not to say or Missing for Control, Intervention, and Total are 19, 49, and 68, respectively. The fourth and final entry under the Variable column is Household Income, under which are five entries top to bottom: less than 30,000 dollars; 30,000 dollars to 59,999 dollars; 60,000 dollars to 99,999 dollars; greater than or equal to 100,000 dollars; and Prefer not to say or Missing. The values for less than 30,000 dollars for Control, Intervention, and Total are 46, 35, and 81, respectively. The values for 30,000 dollars to 59,999 dollars for Control, Intervention, and Total are 119, 74, and 193, respectively. The values for 60,000 dollars to 99,999 dollars for Control, Intervention, and Total are 184, 106, and 290, respectively. The values for greater than or equal to 100,000 dollars for Control, Intervention, and Total are 222, 370, and 592, respectively. The values for Prefer not to say or Missing for Control, Intervention, and Total are 142, 214, and 356, respectively
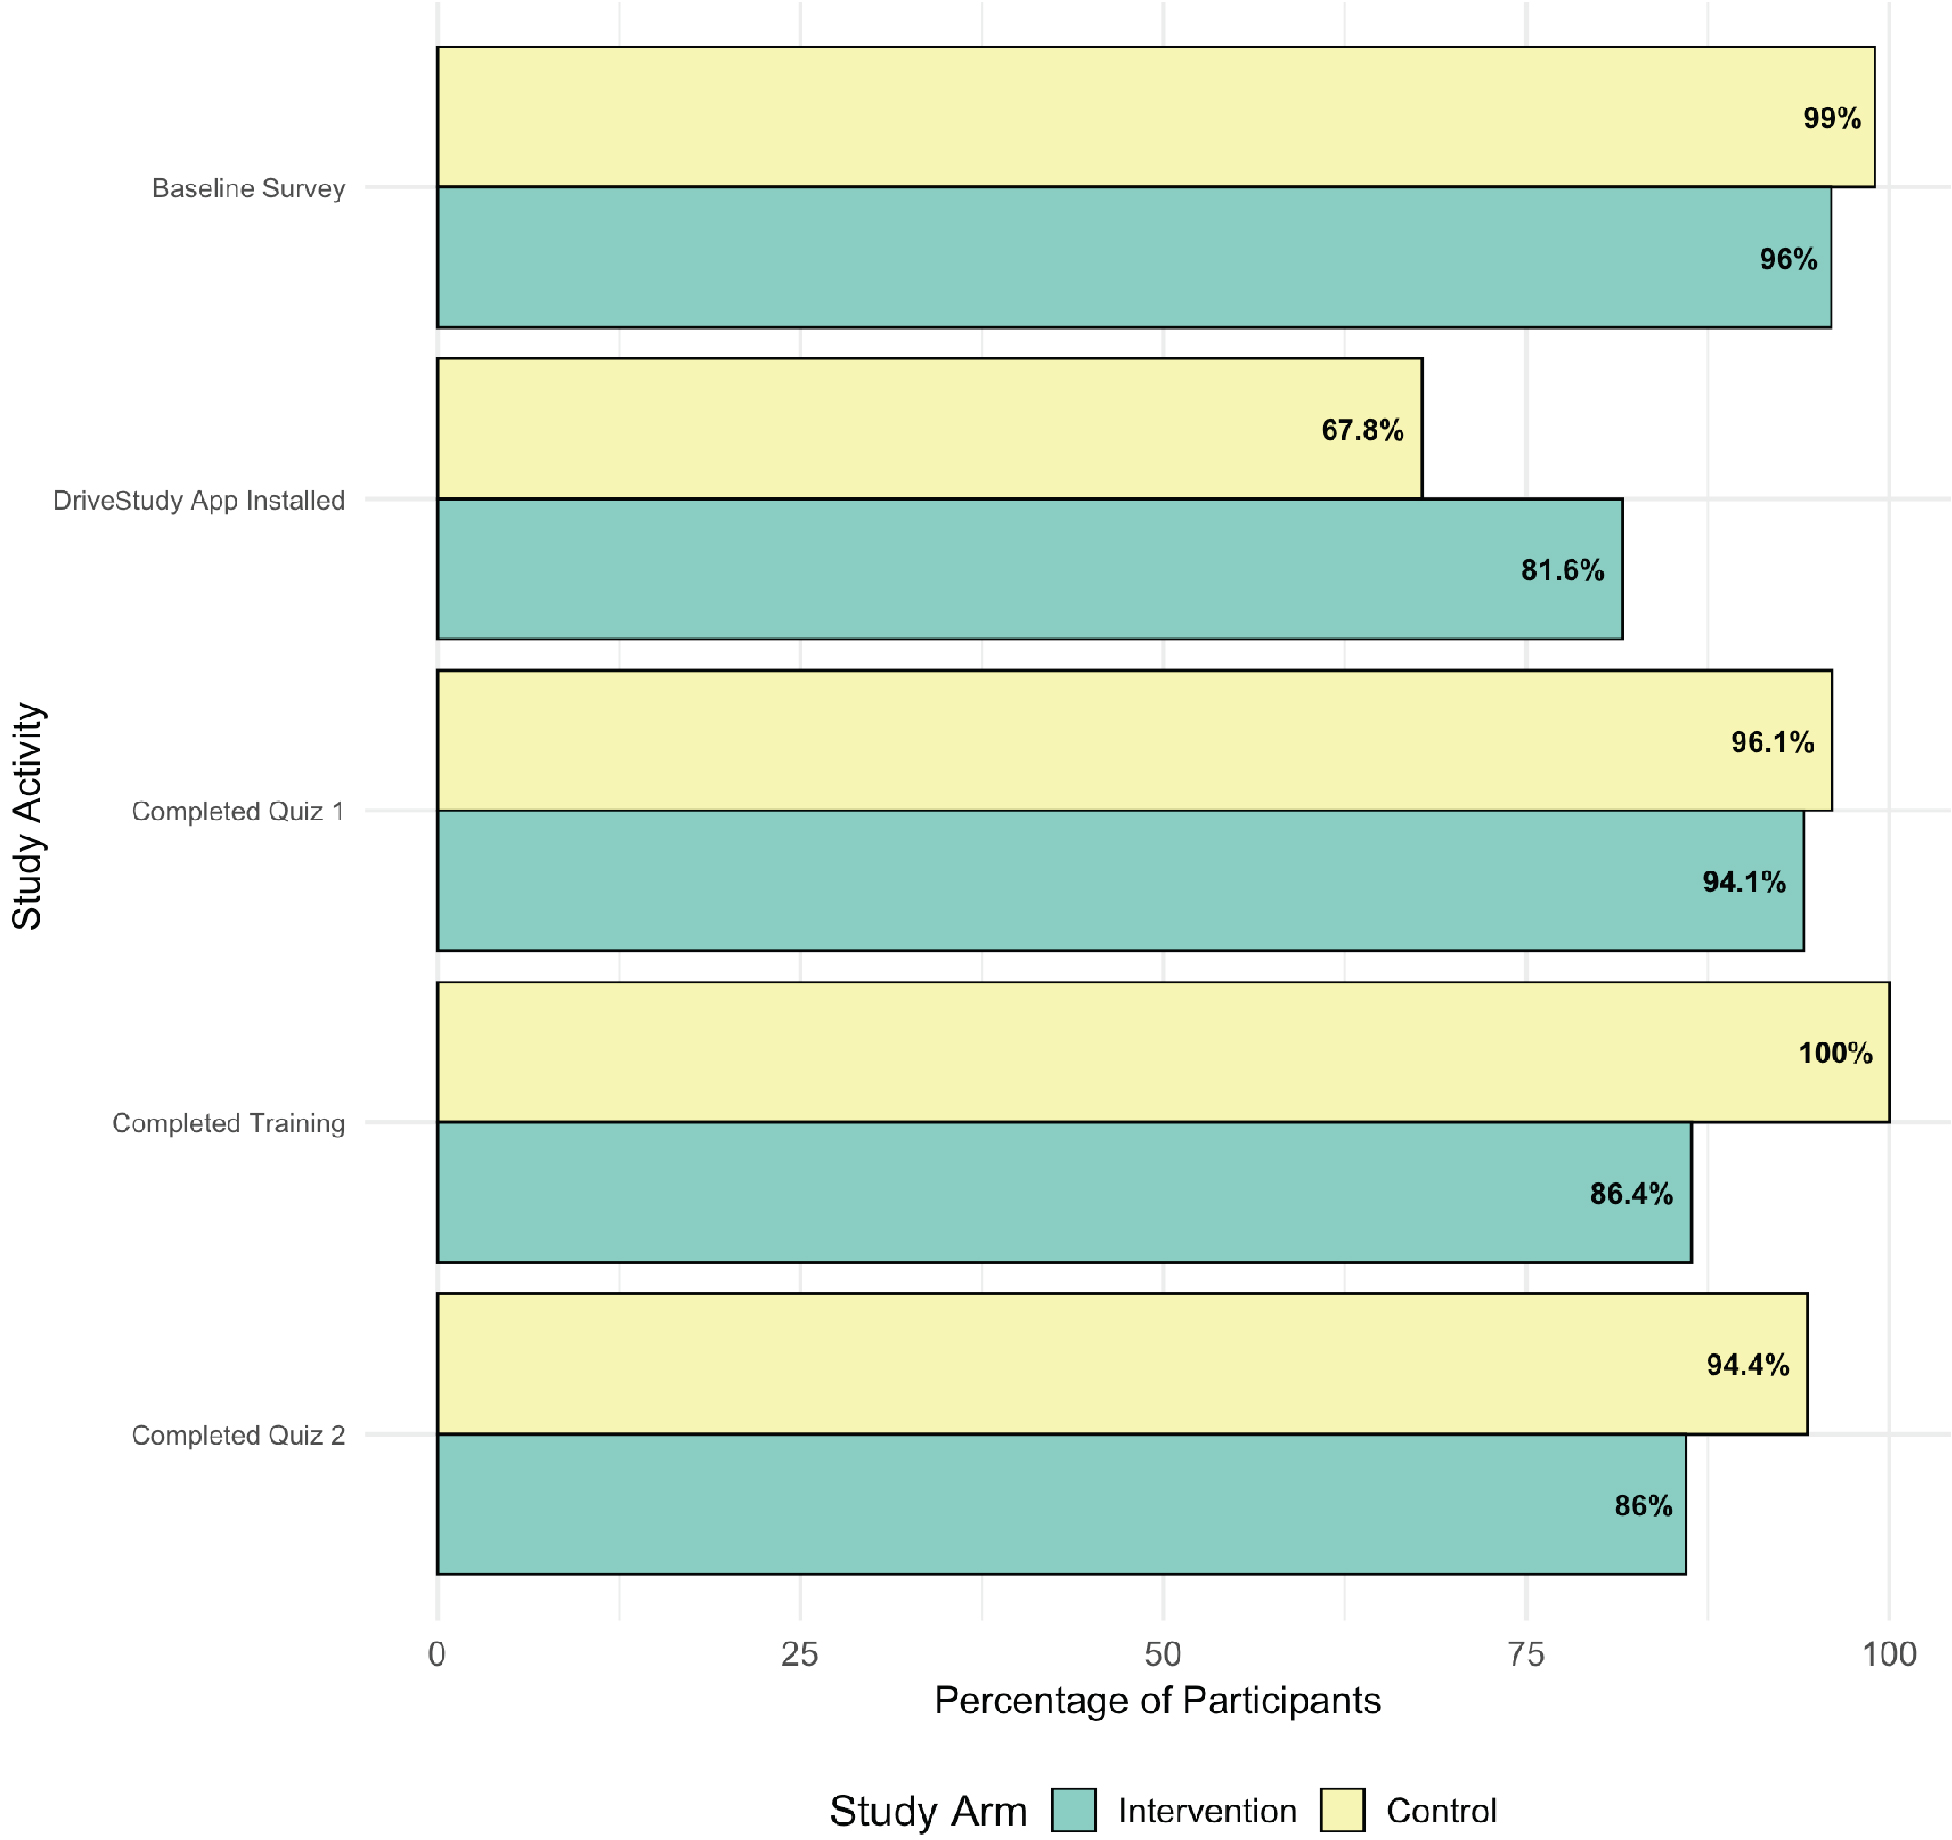
Long Description.
The vertical axis is labeled Study Activity and lists five activities: Completed Quiz 2; Completed Training; Completed Quiz 1; Drive Study App Installed; Baseline Survey. The horizontal axis Percentage of Participants ranges from 0 to 100 in increments of 25. The data mentioned in the bar graph are as follows: Completed Quiz 2: Intervention, 86 percent, Control, 94.4 percent; Completed Training: Intervention, 86.4 percent, Control, 100 percent; Completed Quiz 1: Intervention, 94.1 percent; Control, 96.1 percent; Drive Study App Installed: Intervention, 81.6 percent, Control, 67.8 percent; Baseline Survey: Intervention, 96 percent, Control, 99 percent.
The research team further explored travel behavior over time by examining the average number of trips, miles traveled, and hours traveled (Table 9). As months progressed, trends in trip frequency, travel distance, and duration varied between groups. Notably, while the intervention group exhibited a general increase in the average number of trips, the control groupʼs travel patterns remained relatively stable. Similarly, the average miles traveled showed a comparable trend, with intervention participants covering greater distances over time than those in the control group. However, changes in average hours traveled suggest that differences in travel behavior may not be solely attributable to increased mobility but could also reflect variations in travel efficiency or route choices. These findings can begin to offer insight into practice driving trends for novice teenage drivers.
An independent t-test was conducted to compare travel behavior between the control and intervention groups across average number of trips, miles traveled, and hours traveled. While the intervention group consistently showed higher averages across all three measures, these
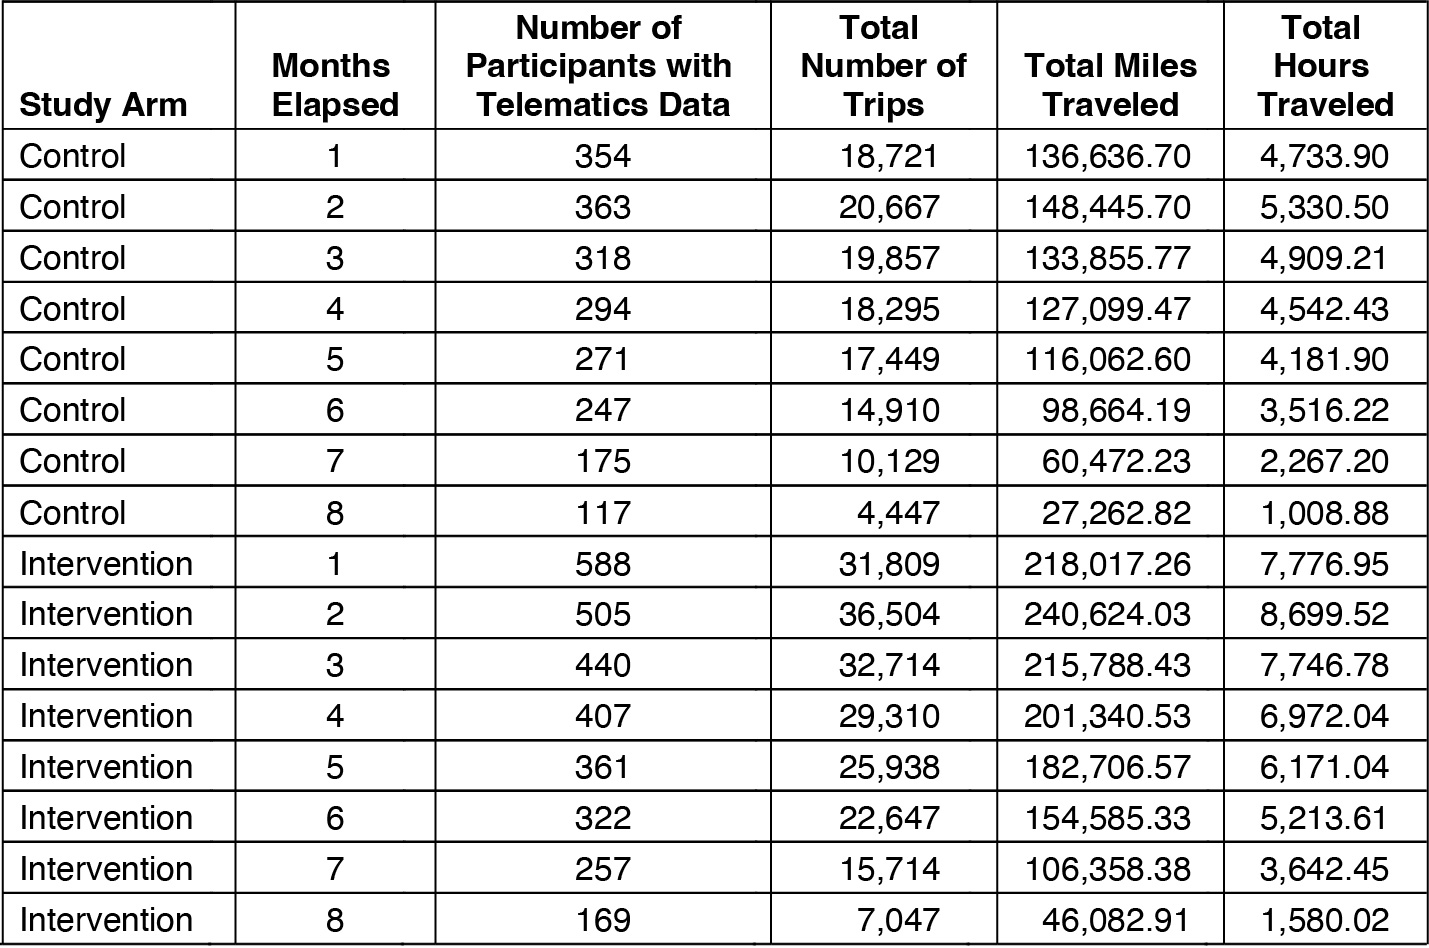
Long Description.
The table comprises six columns left to right titled Study Arm, Months Elapsed, Number of Participants with Telematics Data, Total Number of Trips, Total Miles Traveled, and Total Hours Traveled. The entries across the first row for each column are Control; 1; 354; 18,721; 136,636.70; and 4,733.90. The entries across the second row are Control; 2; 363; 20,667; 148,445.70; and 5,330.50. The entries across the third row are Control; 3; 318; 19,857; 133,855.77; and 4,909.21. The entries across the fourth row are Control; 4; 294; 18,295; 127,099.47; and 4,542.43. The entries across the fifth row are Control; 5; 271; 17,449; 116,062.60; and 4,181.90. The entries across the sixth row are Control; 6; 247; 14,910; 98,664.19; and 3,516.22. The entries across the seventh row are Control; 7; 175; 10,129; 60,472.23; and 2,267.20. The entries across the eighth row are Control; 8; 117; 4,447; 27,262.82; and 1,008.88. The entries across the ninth row are Intervention; 1; 588; 31,809; 218,017.26; and 7,776.95. The entries across the tenth row are Intervention; 2; 505; 36,504; 240,624.03; and 8,699.52. The entries across the eleventh row are Intervention; 3; 440; 32,714; 215,788.43; and 7,746.78. The entries across the twelfth row are Intervention; 4; 407; 29,310; 201,340.53; and 6,972.04. The entries across the thirteenth row are Intervention; 5; 361; 25,938; 182,706.57; and 6,171.04. The entries across the fourteenth row are Intervention; 6; 322; 22,647; 154,585.33; and 5,213.61. The entries across the fifteenth row are Intervention; 7; 257; 15,714; 106,358.38; and 3,642.45. The entries across the sixteenth row are Intervention; 8; 169; 7,047; 46,082.91; and 1,580.02.
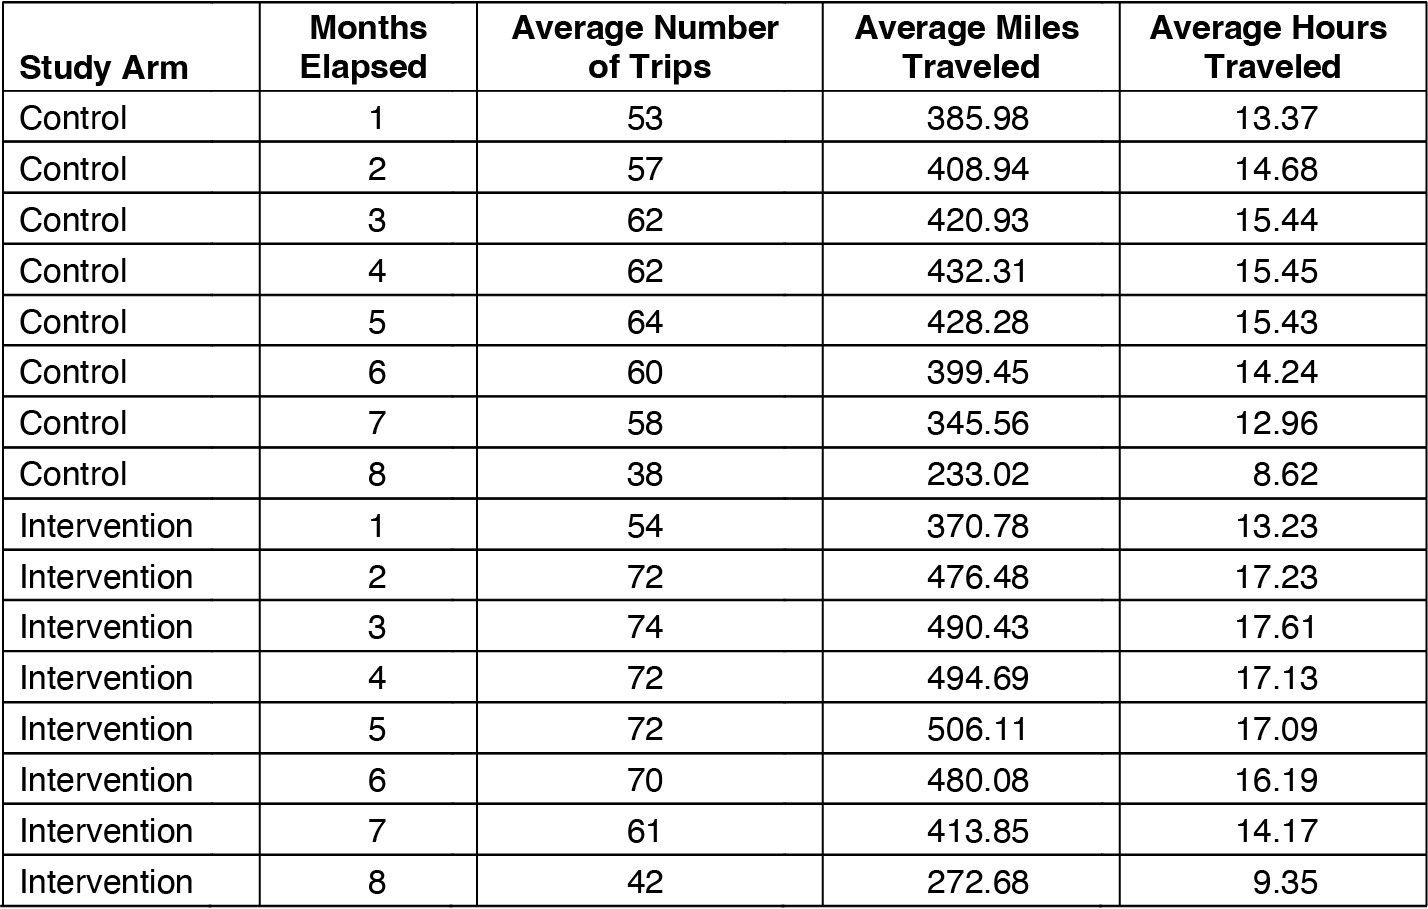
Long Description.
The table comprises five columns left to right titled Study Arm, Months Elapsed, Average Number of Trips, Average Miles Traveled, and Average Hours Traveled. The entries across the first row for each column are Control; 1; 53; 385.98; and 13.37. The entries across the second row are Control; 2; 57; 408.94; and 14.68. The entries across the third row are Control; 3; 62; 420.93; and 15.44. The entries across the fourth row are Control; 4; 62; 432.31; and 15.45. The entries across the fifth row are Control; 5; 64; 428.28; and 15.43. The entries across the sixth row are Control; 6; 60; 399.45; and 14.24. The entries across the seventh row are Control; 7; 58; 345.56; and 12.96. The entries across the eighth row are Control; 8; 38; 233.02; and 8.62. The entries across the ninth row are Intervention; 1; 54; 370.78; and 13.23. The entries across the tenth row are Intervention; 2; 72; 476.48; and 17.23. The entries across the eleventh row are Intervention; 3; 74; 490.43; and 17.61. The entries across the twelfth row are Intervention; 4; 72; 494.69; and 17.13. The entries across the thirteenth row are Intervention; 5; 72; 506.11; and 17.09. The entries across the fourteenth row are Intervention; 6; 70; 480.08; and 16.19. The entries across the fifteenth row are Intervention; 7; 61; 413.85; and 14.17. The entries across the sixteenth row are Intervention; 8; 42; 272.68; and 9.35.
differences were not statistically significant (p > 0.05). This suggests that, although the intervention group exhibited a trend toward increased travel activity, the observed differences could be due to random variation rather than the effect of the intervention.
Across study participants, there was a clear hierarchy in the types of events committed while driving. These event rates remained relatively constant during the first 8 months of driving. When averaged across both study participants and months since starting driver education, the data shows an average of 114 phone use events per 100 miles driven—the most frequent event type recorded. The next most frequent event was speeding (8 events per 100 miles), followed by hard braking (6 events per 100 miles). The remaining event types were hard acceleration (5 events per 100 miles) and hard cornering (three events per 100 miles). Figure 4 displays these average event counts for each month since enrollment. Both changes in confidence in driving and seasonality are factors that could affect the trends presented in Figure 4. Phone use events are not included in Figure 4 because of the significant difference in magnitude relative to the other event types.
Considering distracted driving, the study found that the enrolled teen drivers averaged nearly 6 and a half minutes of distracted driving per hour driven (Figure 5). When averaged by driver and by month of driving experience, the study found a generally increasing trend, with distracted driving averaging closer to 6 minutes in the first 2 months of driving following the start of driver education and reaching 6 minutes and 20 seconds in the third and fourth months. The trend in the duration of distracted driving appears to peak in the first 3 months and remain relatively constant, although the amount of data in later months is reduced because not all students have reached that point since enrollment.
Considering speeding, the study found that duration averaged around 41 seconds of speeding per hour driven (Figure 6). Over the course of acquiring more driving experience and driver education, the average duration of speeding decreased, ending closer to half a minute in the most recent data from students in the initial cohorts of the study. The trend in speeding duration appears to be inversely related to the trend in distracted driving.
From the sample of 1,512 study participants, approximately one-third have passed a behind-the-wheel exam as of May 6, 2025. Specifically, 276 participants from the control group and 284 participants from the intervention group completed a skills exam. Of the 560 completed exams, 520 have passed and obtained their driverʼs license to date. Table 10 presents the percentages of participants who passed their skills exam, passed on the first attempt, or failed at least once by study arm. There was no statistically significant difference by study arm for these elements of the skills exam.
Skills exam data was drawn from two primary sources. The first is the Washington State Department of Licensing, which provided records on the date and outcome (pass or fail) of each skills exam, current as of March 19, 2025. The second source was participating driving school locations, which submitted data on exams conducted by their instructors for study participants, current as of May 6, 2025. The driving school records included detailed information on the specific maneuvers for which points were deducted. This maneuver-level data is available for 470 study participants. For the participants with complete exam data, the study used the first exam taken in cases when participants completed the skills exam multiple times. This approach was used to ensure comparability across the data.
The Washington State driving exam contains 15 driving categories (e.g., backing, right turns) with 120 specific driving maneuver scoring elements. Each driving category contains three deduction categories—one denoting a potentially dangerous action, one denoting action that indicates a lack of skill, and a final one that denotes action that would potentially inhibit normal traffic flow. An example of a backing scoring element under the danger potential category is
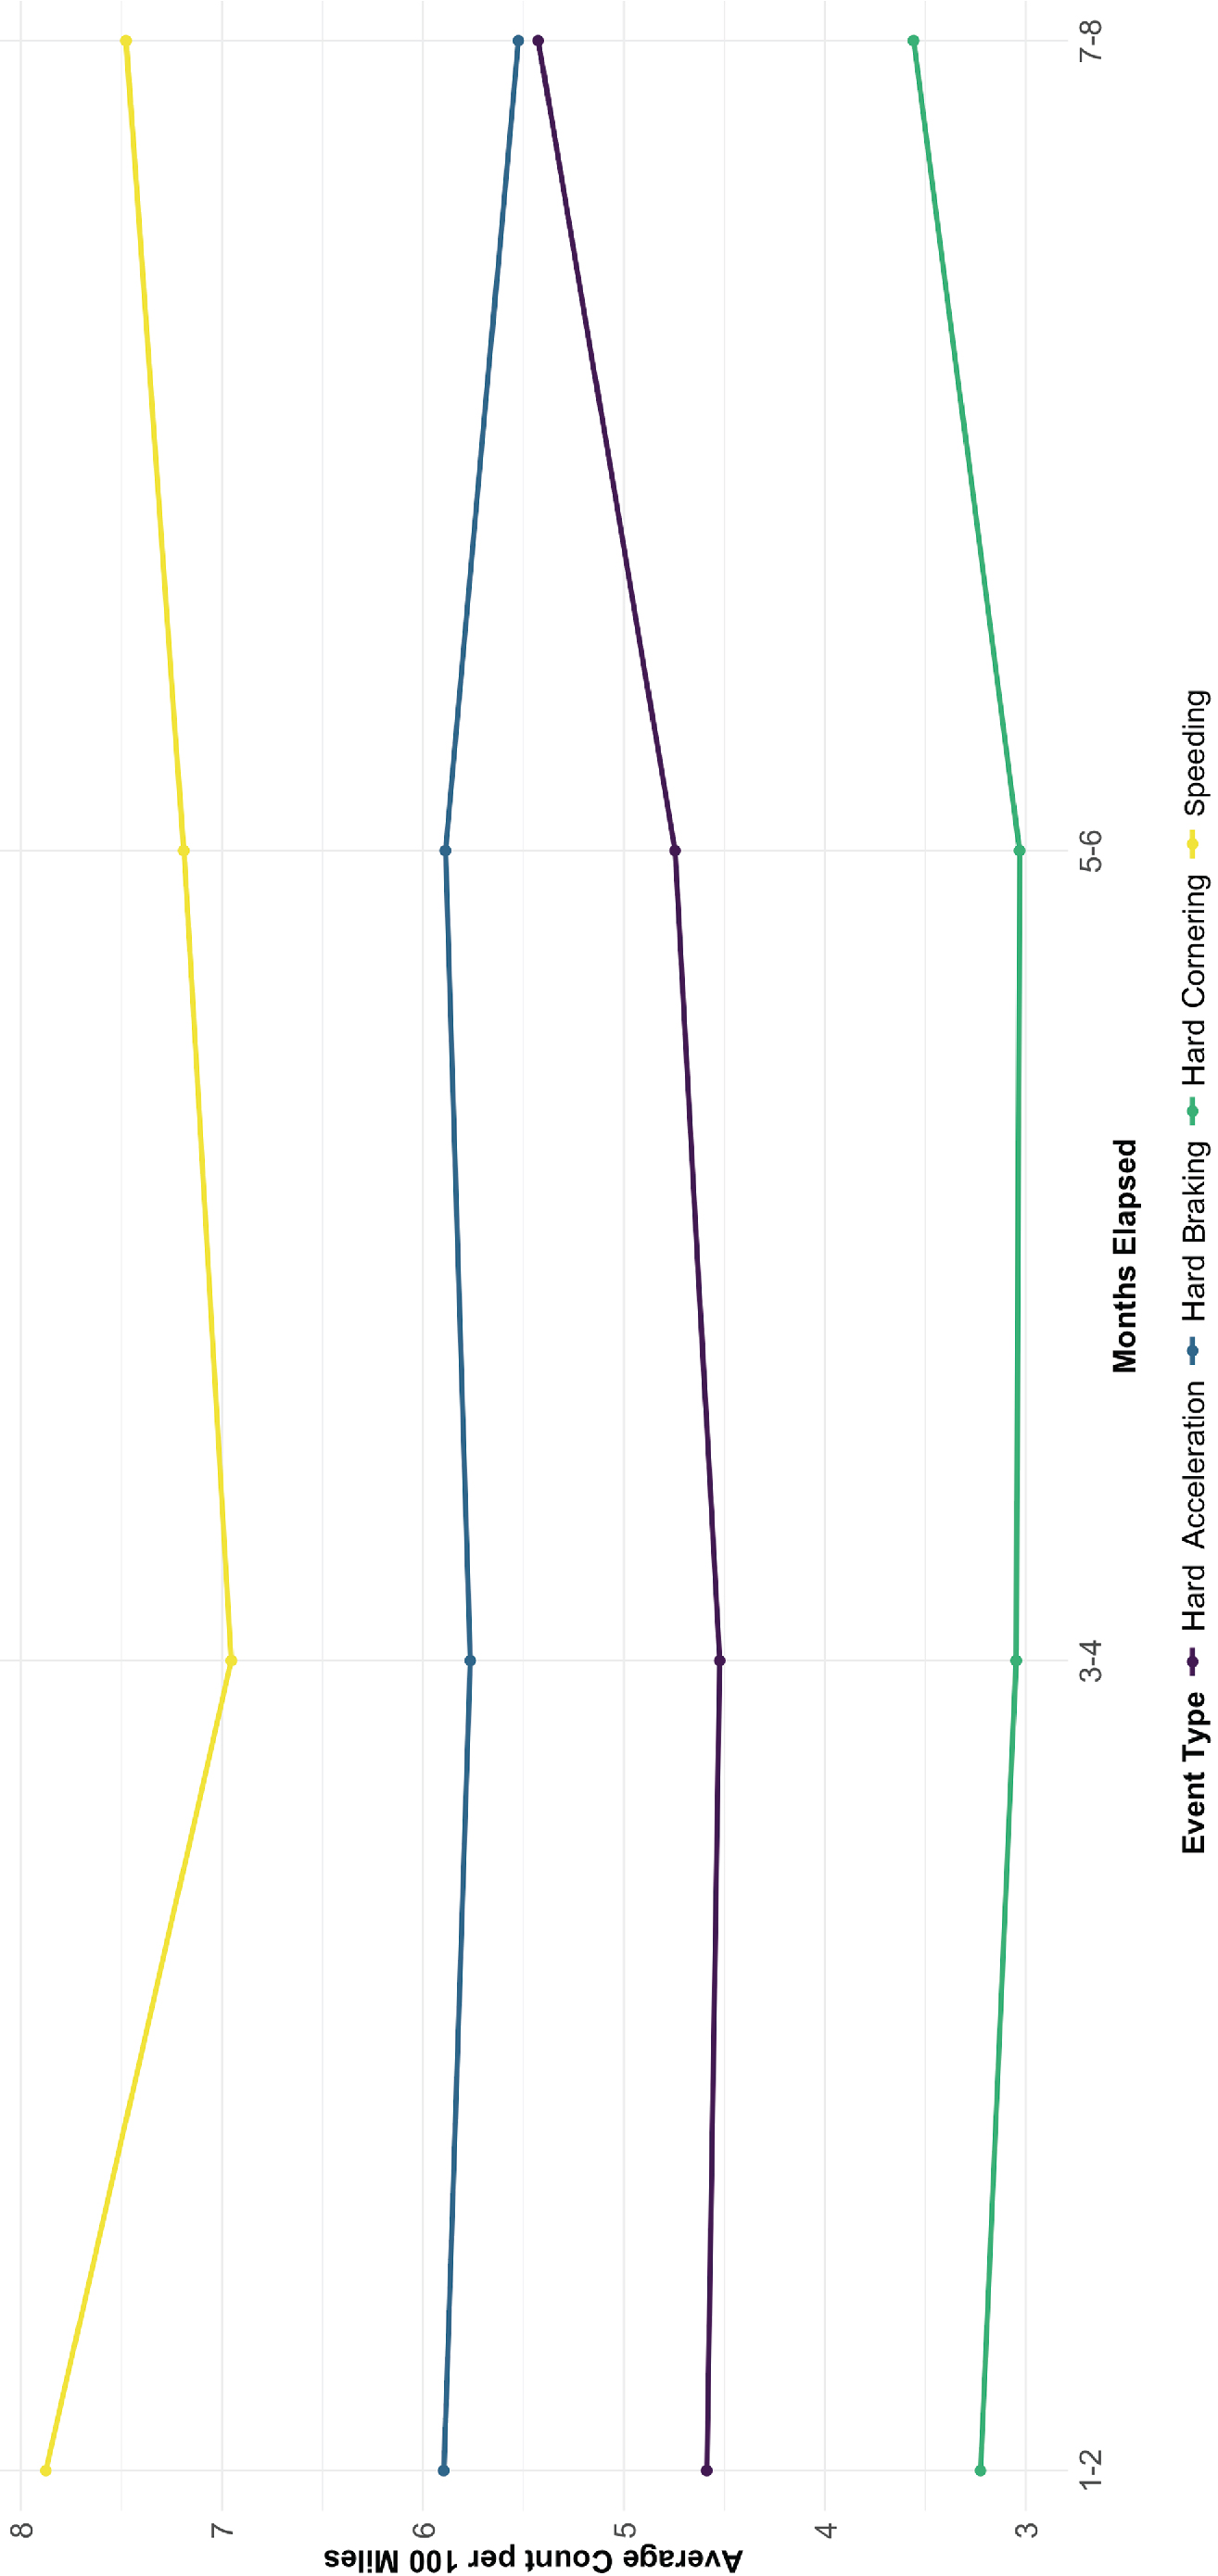
Long Description.
The vertical axis is labeled Average Count per 100 Miles, and it ranges from 3 to 8 in increments of 1. The horizontal axis shows Months Elapsed and is divided into intervals of 1-2, 3-4, 5-6, and 7-8 months. The yellow line (speeding) starts near 8, declines to 7, then rises to 7.5. The blue line (hard acceleration) stays at 5.5. The purple line (hard braking) starts at 4.5. The green line (hard cornering) starts at 3.5, declines to 3.2, then rises to 3.7.
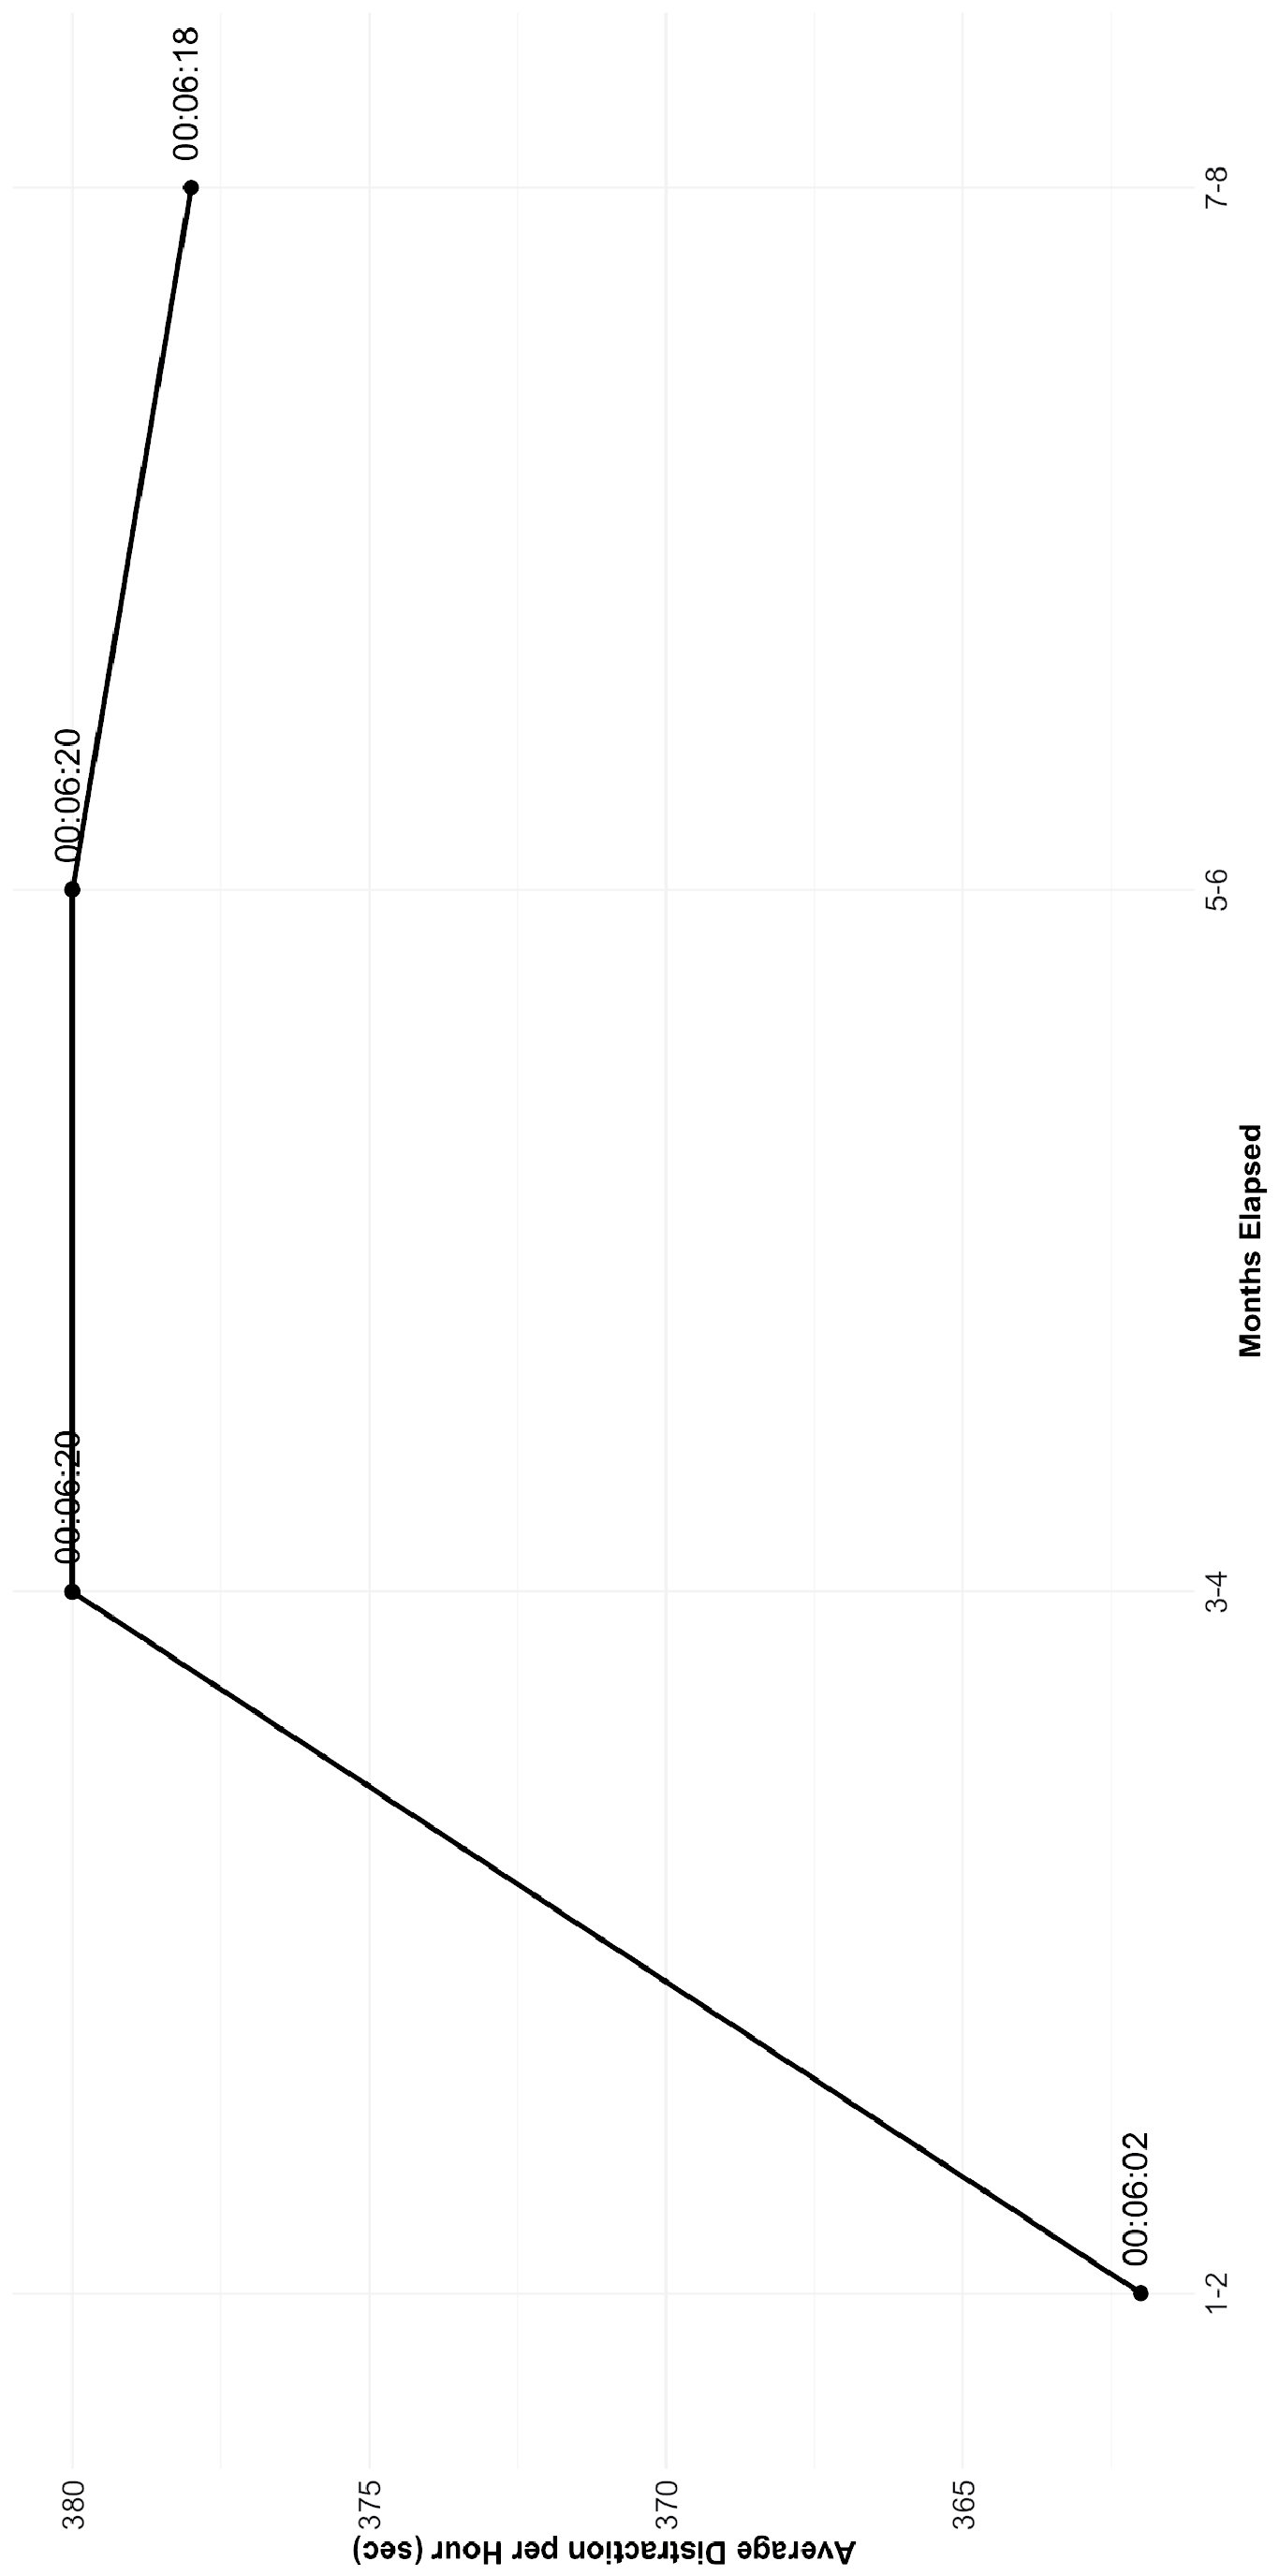
Long Description.
The vertical axis indicates the average distraction per hour in seconds, ranging from 350 to 380 seconds in increments of 5. The horizontal axis represents months elapsed and is divided into intervals of 1-2, 3-4, 5-6, and 7-8 months. Data points are marked with specific times: 00:06:02 for the 1-2 months interval, 00:06:20 for the 3-4 and 5-6 months intervals, and 00:06:18 for the 7-8 months interval. The graph shows an initial increase in average distraction per hour, which peaks at 00:06:20 and remains constant for the next interval, followed by a slight decrease at 00:06:18 in the final interval.
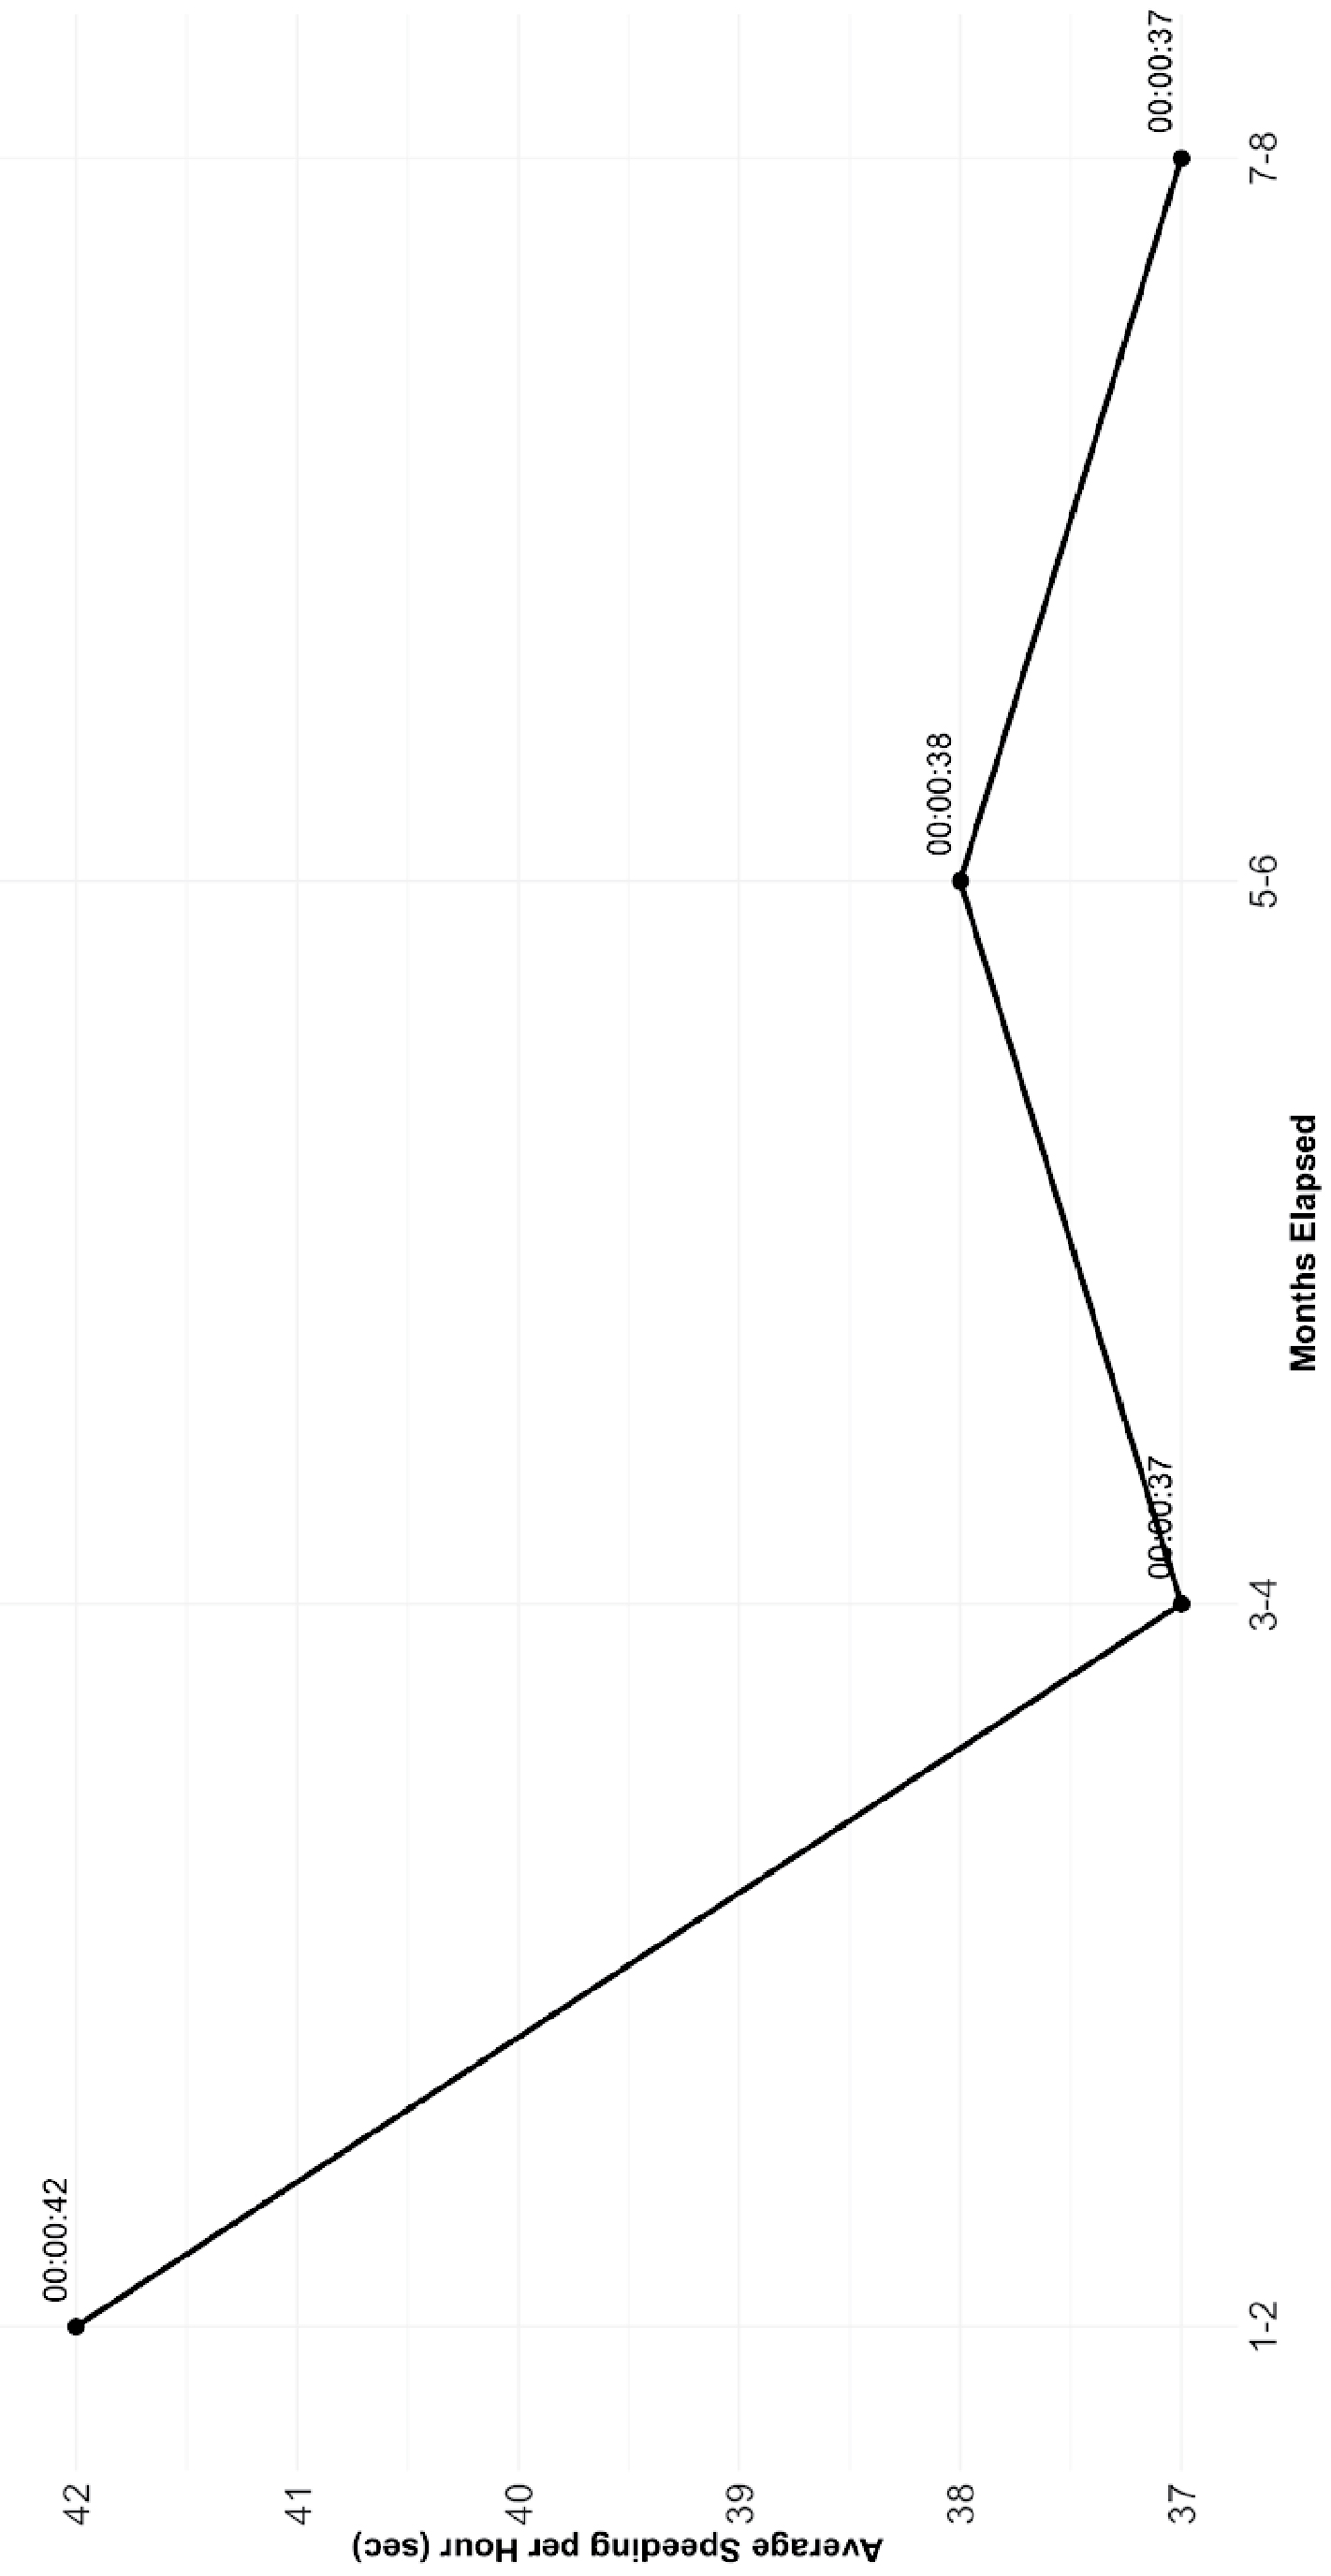
Long Description.
The vertical axis represents the average number of seconds spent speeding per hour of driving, ranging from 37 to 42 in increments of 1. The horizontal axis represents months elapsed and is divided into four intervals: 1-2 months, 3-4 months, 5-6 months, and 7-8 months. The data points indicate the following average speeds: 42 seconds for 1‐2 months, 37 seconds for 3‐4 months, 38 seconds for 5‐6 months, and 37 seconds for 7‐8 months. The. The graph shows a decline in average time spent speeding from 1-2 months to 3-4 months, a slight increase from 3-4 months to 5-6 months, and a subsequent decline from 5-6 months to 7-8 months.
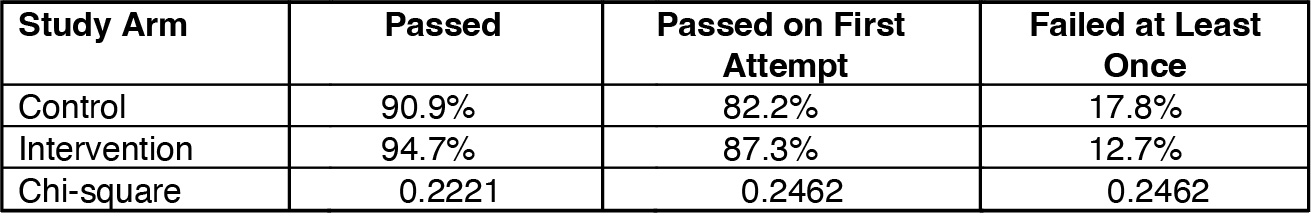
Long Description.
The table comprises four columns from left to right titled Study Arm, Passed, Passed on First Attempt, and Failed at Least Once. The entries across the first row for each column are Control, 90.9 percent, 82.2 percent, and 17.8 percent. The entries across the second row for each column are Intervention, 94.7 percent, 87.3 percent, and 12.7 percent. The entries across the third row for each column are Chi-square, 0.2221, 0.2462, and 0.2462.
identified as Backing DP Vis on the scoring sheet, which indicates that the applicant failed to use their best possible vision to check traffic in all vulnerable areas when backing their vehicle. For the purposes of this report, the skills exam data were analyzed at three levels: (1) driving categories, (2) point deduction category types, and (3) the specific scoring elements. As noted under Task 5, two items were added to the skills exam for the purposes of this exam without being factored into the scoring: hazard perception testing and supplementary questions in the behind-the-wheel exam. Both items were grouped under the label driver awareness. Addition of these items and the driver awareness category brings the count of driving categories to 16 and the number of specific elements to 122.
Figure 7 presents the percentage of study participants who had none, one, or two or more points by driving category, among the 470 participants for whom complete exam information was obtained. All scored driving categories are included in Figure 7. Driver awareness is the unique category, wherein points were not factored into the final score and a point is a positive attribute, denoting successful completion of one or both of those tasks. As such, driver awareness is the one category not included in the figure. The majority of test takers (76 percent) successfully completed both pilot test items, with 5 percent successfully completing only one of the items
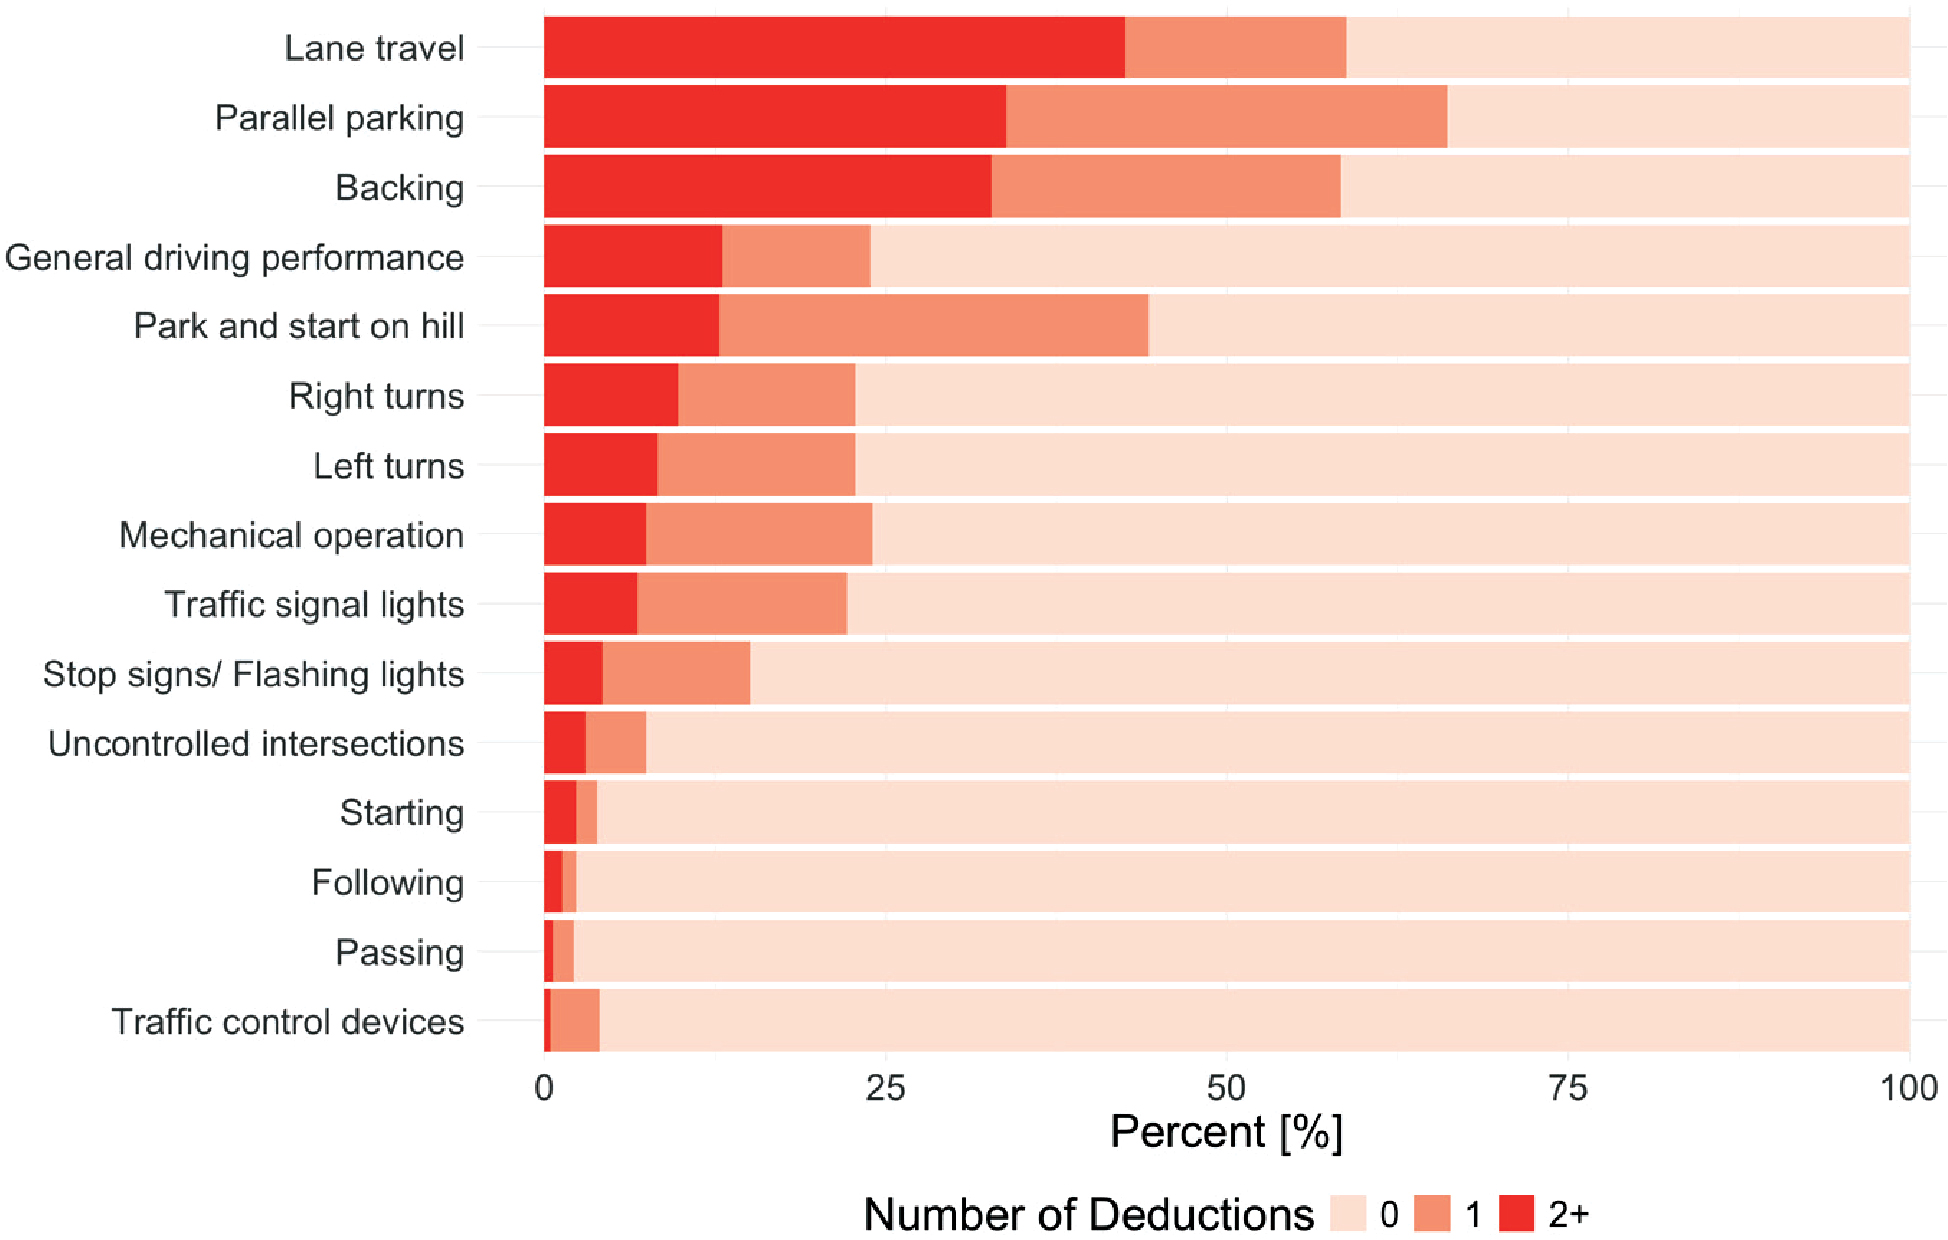
Long Description.
The vertical axis shows a list of tasks on a driving exam. The horizontal axis show the percentage of students receiving point deductions on the task. Students are grouped into those receiving no point deductions, those receiving one point deduction, and those receiving two or more point deductions. On traffic control devices, 95 percent received 0 points, 4 percent received 1 point, and 1 percent received 2 or more. On passing, 97 percent received 0 points, 2 percent received 1 point, and 1 percent received 2 or more. On following, 95 percent received 0 points, 2 percent received 1 point, and 3 percent received 2 or more. On starting, 95 percent received 0 points, 2 percent received 1 point, and 3 percent received 2 or more. On uncontrolled intersections, 90 percent received 0 points, 6 percent received 1 point, and 4 percent received 2 or more. On stop signs or flashing lights, 85 percent received 0 points, 10 percent received 1 point, and 5 percent received 2 or more. On traffic signal lights, 77 percent received 0 points, 17 percent received 1 point, and 6 percent received 2 or more. On mechanical operation, 75 percent received 0 points, 18 percent received 1 point, and 7 percent received 2 or more. On left turns, 76 percent received 0 points, 15 percent received 1 point, and 9 percent received 2 or more. On right turns, 76 percent received 0 points, 16 percent received 1 point, and 8 percent received 2 or more. On park and start on hill, 55 percent received 0 points, 30 percent received 1 point, and 15 percent received 2 or more. On general driving performance, 75 percent received 0 points, 10 percent received 1 point, and 15 percent received 2 or more. On backing, 40 percent received 0 points, 25 percent received 1 point, and 35 percent received 2 or more. On parallel parking, 35 percent received 0 points, 30 percent received 1 point, and 35 percent received 2 or more. On lane travel, 40 percent received 0 points, 20 percent received 1 point, and 40 percent received 2 or more.
and about one-fifth of test takers (19 percent) failing both items. Considering the scored driving categories, the majority of test takers received one or more point deductions related to lane travel (59 percent), parallel parking (66 percent), and backing (58 percent). Points were also commonly given for the maneuver of parking and starting on a hill (44 percent). Around one-quarter of test takers received points in the following categories: right turns, left turns, traffic signal lights, general driving performance, and mechanical operation. The remaining categories had relatively few points given, with 15 percent or fewer of test takers receiving points in these categories.
Considering next the three types of point deductions—danger potential, lack of skill, and congestion potential—danger potential was the most common type. Over half of all points recorded were danger potential points (55 percent), followed by congestion potential (25 percent) and lack of skill points (20 percent). Of the 470 participants for whom complete test information was obtained, 429 (91 percent) had at least one danger potential point recorded, with an average of four danger potential points recorded on driversʼ first attempt at the skills exam. The most common driving categories with danger potential points include lane travel, followed by backing and parking and starting on a hill. Congestion potential points were most common in parallel parking and general driving performance. Points for lack of skills was most common in backing and parallel parking.
Task 7: Propose Approaches to Measure the Effectiveness of the Model Driving Skills Examination and Scoring Protocols for Identifying High Safety Risk Drivers
In the following section, the research team considered intervention points associated with high-risk drivers. As noted previously, hazard perception testing is one of the few evidence-based measures shown to be positively correlated with safety outcomes. First, the effect of a hazard perception training was evaluated and found successful in improving participantsʼ test scores. Second, the association between the hazard perception training and driving behavior was then assessed. Results suggested that following hazard perception training, students in the intervention group exhibited a smaller reduction in speeding and a smaller rise in distracted driving compared with students in the control group. Third, the association between hazard perception testing and driving risk was assessed. Results suggest that the hazard perception test questions related to rear-end situations have the most discriminatory ability for identifying high-risk driving.
Effect of Hazard Perception Training on Hazard Perception Assessment
Over the course of the study, the research team administered three hazard perception assessments. The first assessment (i.e., pre-test) was made available to students at the start of their driver education course. As of March 3, 2025, 1,437 students have completed the first hazard perception assessment. The intervention group had a slightly higher mean pre-test score than the control group—by just 1 percentage point—indicating a negligible difference. Specifically, the control group answered approximately 38 percent of the questions correctly and the intervention group answered 39 percent of questions correctly, on average.
The second assessment (post-test 1) was made available after students in the intervention group had completed the hazard perception training and the control group had completed a similar course session. As of March 3, 2025, 1,360 students have completed the second assessment (i.e., post-training test), with the intervention group having significantly higher test results, on average, compared with the control group. Specifically, on average, the intervention group
earned a score of 63 percent compared with only 40 percent in the control group—a shift of nearly 25 percentage points in the mean test score for those in the intervention group.
After completing the driver education course, students were available to complete post-test 2, which mirrored the previous assessments. As of March 3, 2025, 210 students have completed post-test 2. The average test result for the post-test among the control group was higher than the previous assessments—3 percentage points higher on average—reaching 43 percent correct. The intervention group declined slightly from the first post-test to 58 percent on average but remained significantly higher than the pre-test for the intervention and significantly higher than the control groupʼs result for the second post-test (Table 11).
The hazard perception assessments and training consisted of three types of scenarios: intersections, rear-ends, and curves. Figure 8 displays the test performance by question type and by assessment, averaged across all participants. Intersections were the most challenging question type for participants, followed by rear-ends and then curves. This hierarchy was consistent across assessments.
Test result information by study arm is provided in Table 12. Across the three question types for the pre-test, there were no significant differences between the control and intervention
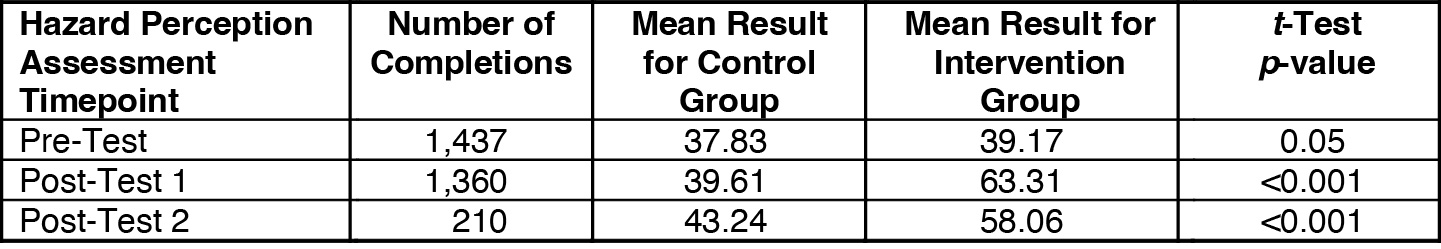
Long Description.
The table comprises five columns from left to right titled Hazard Perception Assessment Timepoint, Number of Completions, Mean Result for Control Group, Mean Result for Intervention Group, and t-Test p-value. The entries across the first row for each column are Pre-Test; 1,437; 37.83; 39.17; and 0.05, respectively. The entries across the second row for each column are Post-Test 1; 1,360; 39.61; 63.31; and less than 0.001, respectively. The entries across the third row for each column are Post-Test 2; 210, 43.24, 58.06, and less than 0.001, respectively.
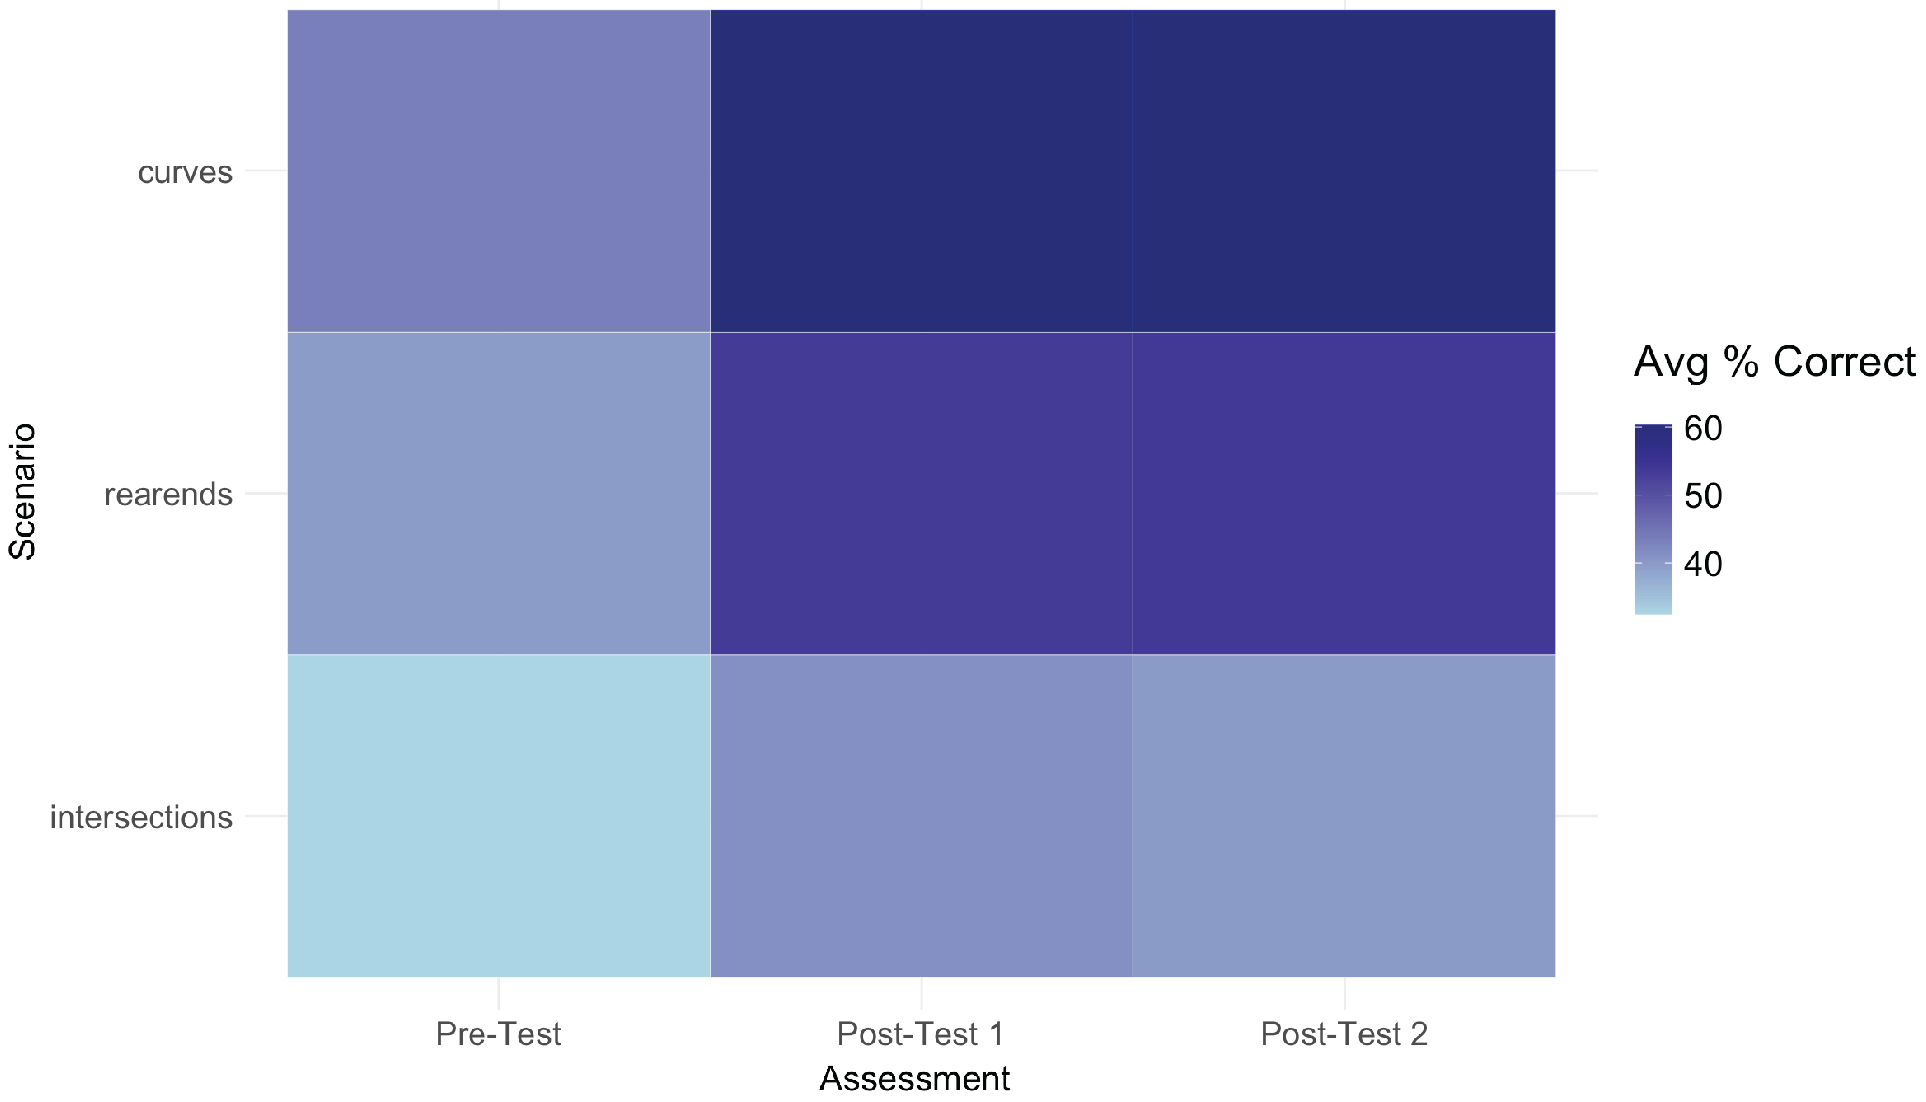
Long Description.
A heat map illustrating the average percentage of correct responses across three assessments: Pre-Test, Post-Test 1, and Post-Test 2. The assessments are categorized by three different scenarios: curves, rear ends, and intersections. The color gradient represents the average percentage correct, ranging from light blue (40 percent) to dark blue (60 percent). Across all scenarios, the average percentage of correct responses increased from pre-test to post-test 1 to post-test 2.
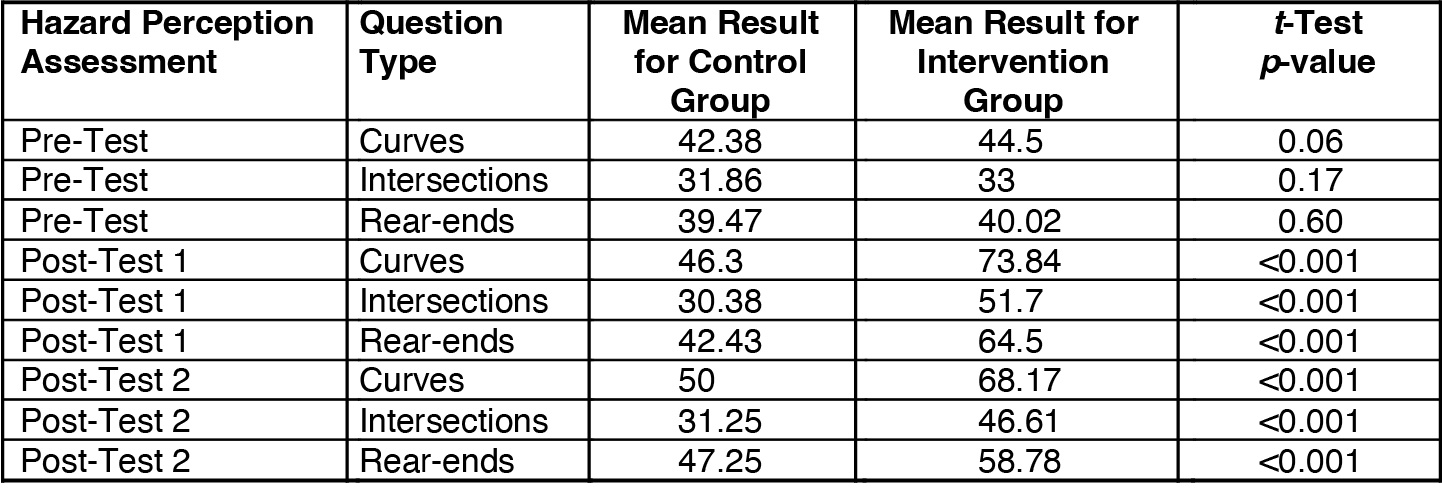
Long Description.
The table comprises five columns from left to right titled Hazard Perception Assessment, Question Type, Mean Result for Control Group, Mean Result for Intervention Group, and t-Test p-value. The entries across the first row for each column are Pre-Test, Curves, 42.38, 44.5, and 0.06. The entries across the second row are Pre-Test, Intersections, 31.86, 33, and 0.17. The entries across the third row are Pre-Test, Rear-ends, 39.47, 40.02, and 0.60. The entries across the fourth row are Post-Test 1, Curves, 46.3, 73.84, and less than 0.001. The entries across the fifth row are Post-Test 1, Intersections, 30.38, 51.7, and less than 0.001. The entries across the sixth row are Post-Test 1, Rear-ends, 42.43, 64.5, and less than 0.001. The entries across the seventh row are Post-Test 2, Curves, 50, 68.17, and less than 0.001. The entries across the eighth row are Post-Test 2, Intersections, 31.25, 46.61, and less than 0.001. The entries across the ninth row are Post-Test 2, Rear-ends, 47.25, 58.78, and less than 0.001.
groups. This follows expectations that the groups had no significant differences at baseline. For both post-tests 1 and 2, the intervention groups did better across all question types. The intervention group, on average, answered between 12 and 28 percent more questions correctly than the control group. These findings demonstrate that the training was successful across all training modules in improving hazard perception assessment results; this training effect remained for the second hazard perception assessment.
Figure 9 illustrates the same information on test results by study arm, assessment timing, and question type. The patterns identified between study arms are consistent across question types, with the control group experiencing marginal improvements at each iteration and with the intervention group experiencing a significant boost in performance on the second assessment following training. There is a slight tapering off at the third time point for the intervention group, but their performance remains significantly higher than the control group performance level.
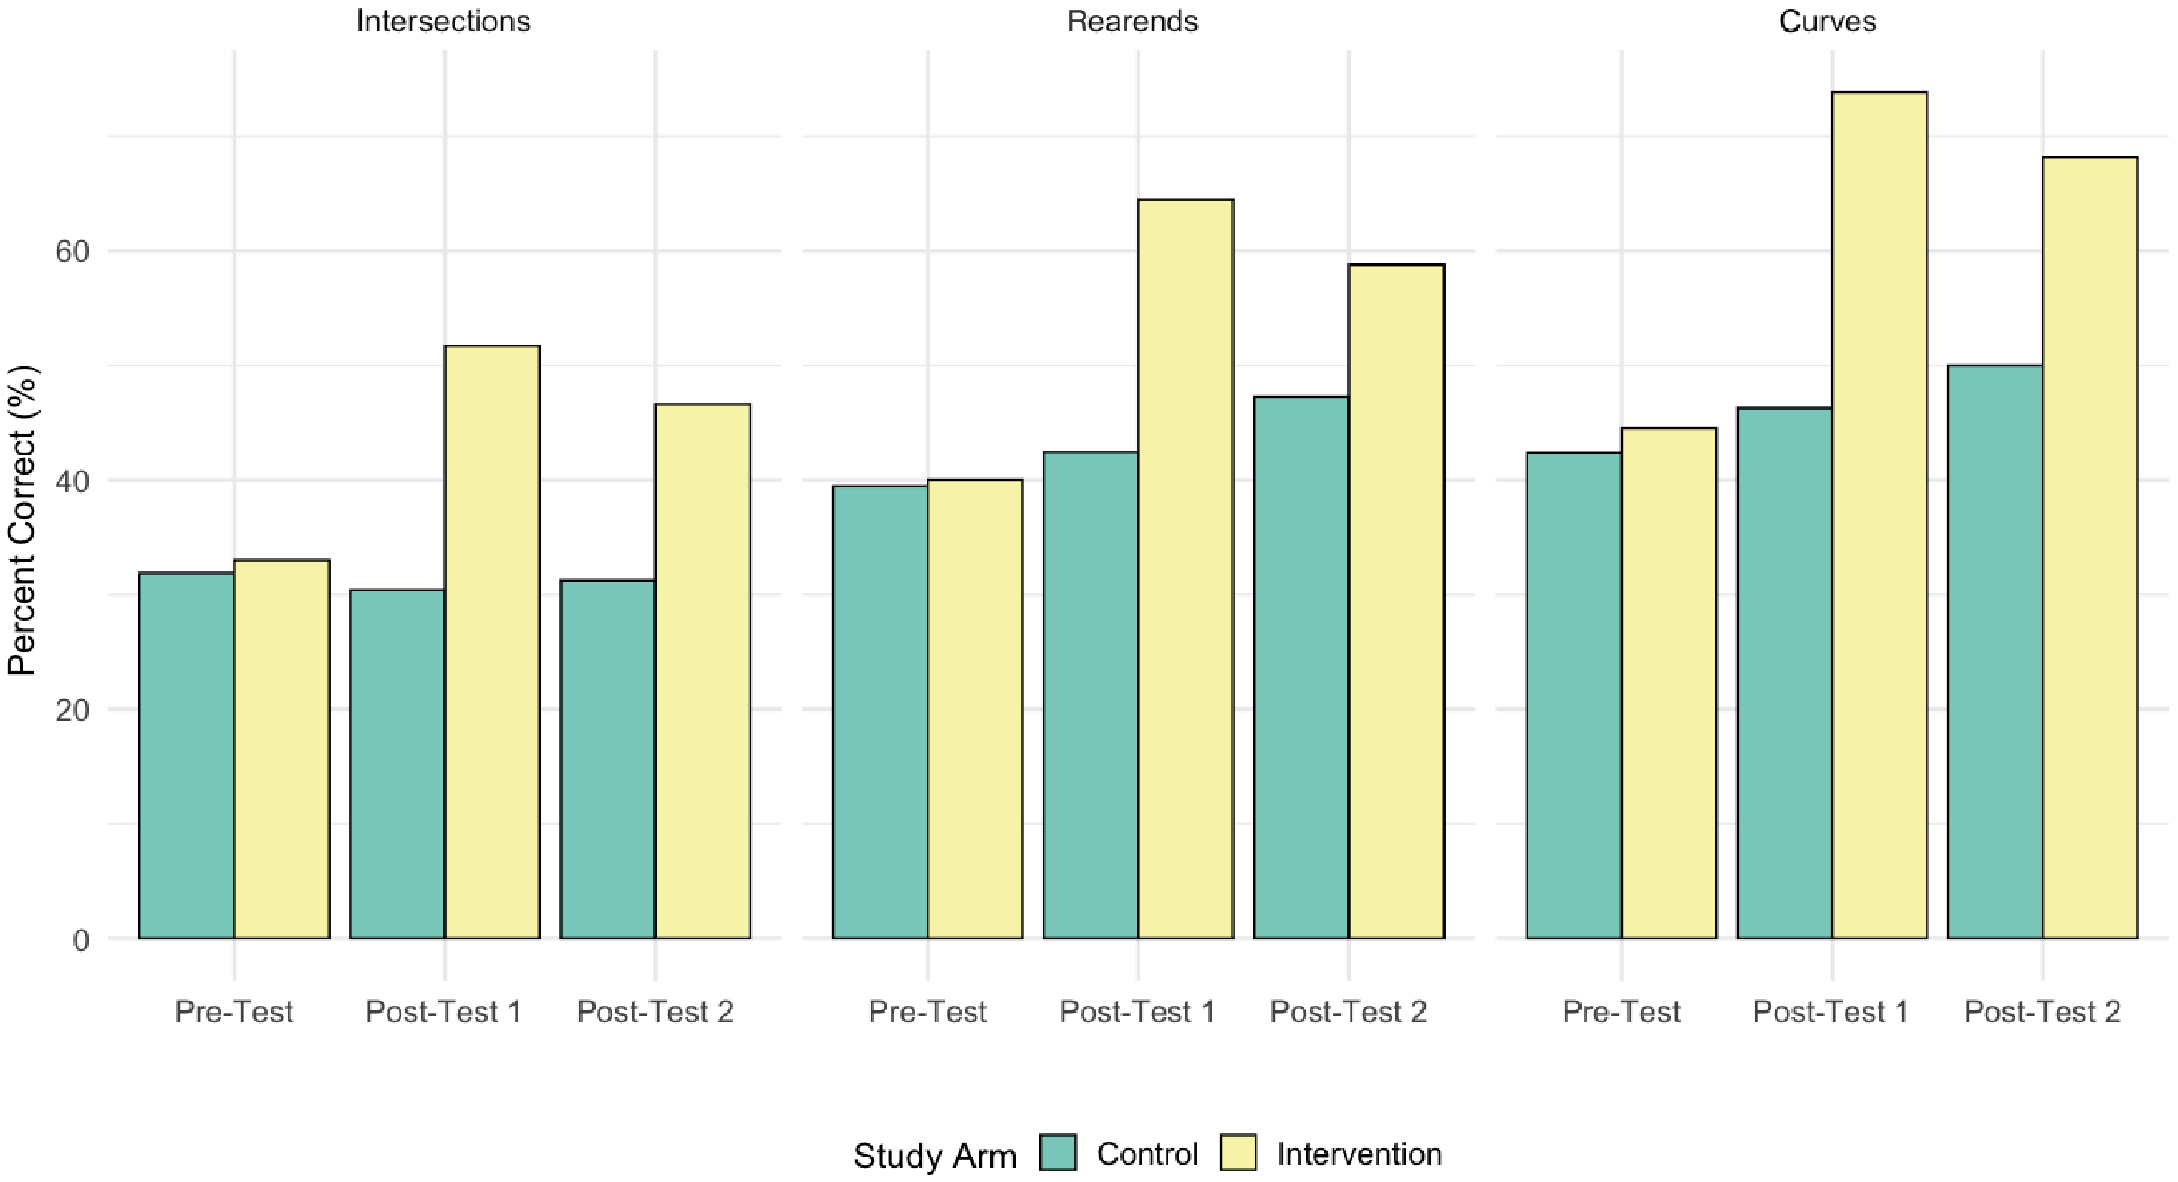
Long Description.
The vertical axis labeled Percent correct (percent) ranges from 0 to 100 in increments of 20. The horizontal axis labeled Study arm shows Pre-Test, Post-Test 1, and Post-Test 2 scores for three hazard scenarios: Intersections, rear ends, and curves. The data are as follows: Intersections: Pre-Test: Control, 33, Intervention, 34; Post-Test 1: Control, 31, Intervention, 51; Post-Test 2: Control, 32, Intervention, 47. Rear ends: Pre-Test: Control, 39, Intervention, 40; Post-Test 1: Control, 42, Intervention, 64; Post-Test 2: Control, 48, Intervention, 58. Curves: Pre-Test: Control, 42, Intervention, 45; Post-Test 1: Control, 47, Intervention, 74; Post-Test 2: Control, 50, Intervention, 68. All values are approximated.
When considering how a hazard perception assessment should be administered as part of a driver education requirement, it is essential to establish minimum performance standards. Figure 10 shows the distribution of test scores on the first post-training assessment for participants in both the control and the intervention groups. As noted earlier, training led to a significant improvement in test performance for the intervention group, with average scores increasing from 39 percent on the pre-training test to 63 percent on the first post-training test. In contrast, the control groupʼs performance remained relatively stable, rising only slightly from 38 percent to 40 percent on average.
Using the intervention groupʼs post-training test performance as a benchmark allows the requirement to reflect the learning that occurs through training completion. Setting a passing threshold at 63 percent would mean that approximately 50 percent of students passed the hazard perception test. Additionally, it is important to note that these assessments and trainings were conducted in a setting where student performance was not tied to any formal requirement; the only obligation was to complete the assessments. Given this context, it is likely that students who were more focused on excelling in the training and assessments could achieve even higher post-test performance.
Effect of Hazard Perception Training on Driving Behavior
In comparing the intervention group with the control group, three significant differences were observed. Before hazard perception training, the intervention group exhibited fewer speeding events but more distraction events compared to the control group. Specifically, for every 100 miles driven, the intervention group had an average of 1 fewer speeding event and 12 more distraction events than the control group. Additionally, the duration of speeding events was lower in
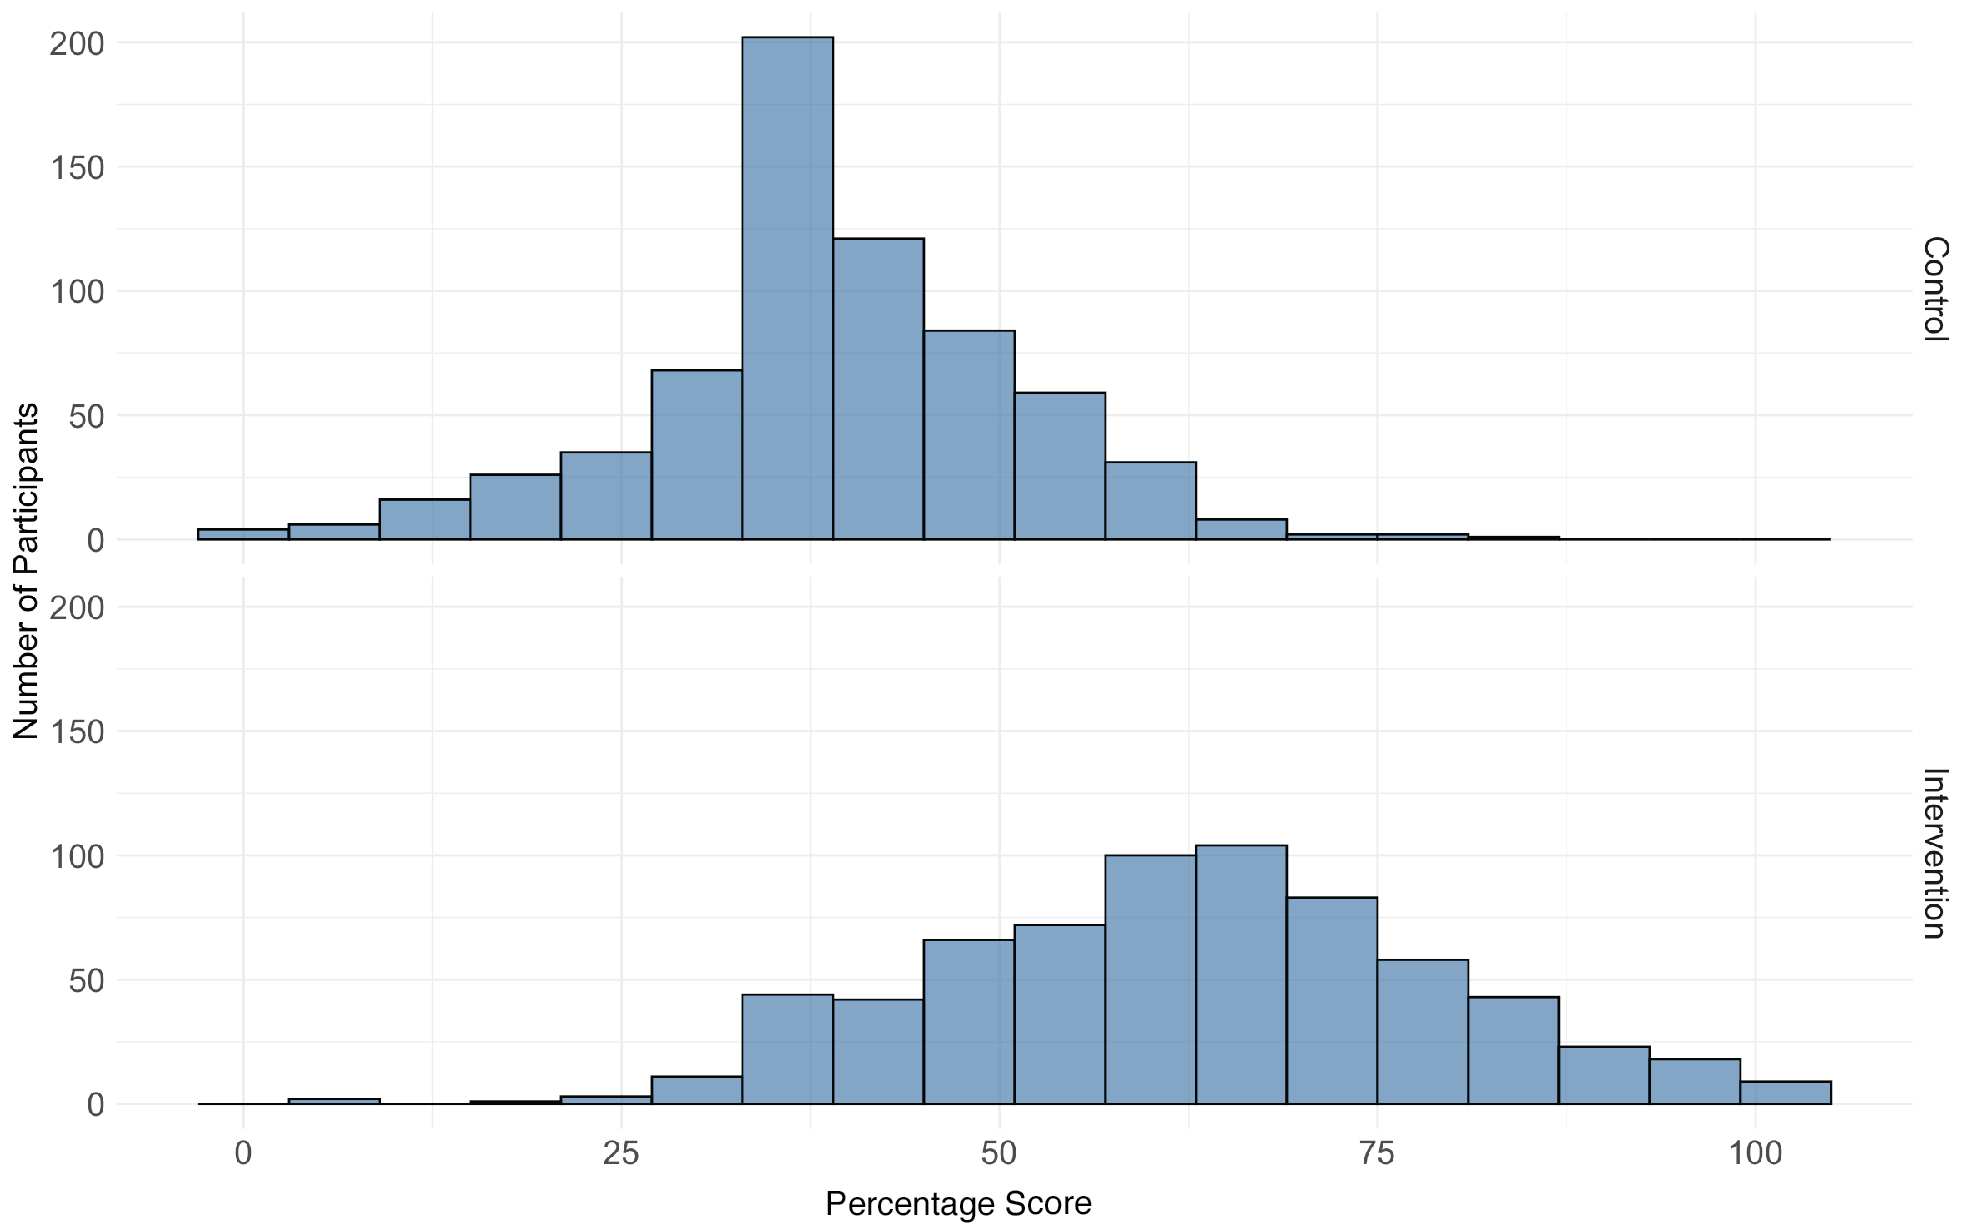
Long Description.
The vertical axis represents the number of student drivers ranging from 0 to 200 in increments of 50, and the horizontal axis represents scores on a hazard perception exam ranging from negative 20 to 120 percent in increments of 25. Separate bar graphs are given for the intervention and the control groups. The group of students who received the intervention of hazard perception training had higher scores, with half scoring 63 percent or higher. Both groups have fewer participants at the extreme ends of the score range.
the intervention group, which averaged 20 fewer seconds of speeding per driving hour compared with the control group. These findings account for the overall change in outcomes across time. The findings are included for all driving behaviors in the first column of Table 13; note, the unit for the duration results is minutes, while the event results are in terms of number of events.
When comparing the post-intervention period with the pre-intervention period, there were notable changes in event rates across all participants. Speeding events and their associated durations were lower in the post-intervention period. Specifically, participants had an average of two fewer speeding events per 100 miles driven and spent 17 fewer seconds speeding per hour of driving. However, phone use was higher in the post-intervention period, with an average of 16 more phone use events per 100 miles driven. The findings comparing the intervention periods by study arm are included in the second column of Table 13.
The comparison of the change in outcomes for the intervention group relative to the control group revealed that speeding and distraction were the only event types with significant differences. While the intervention group generally experienced fewer speeding events, the reduction in speeding was less pronounced compared with the control group. Although speeding decreased across all participants in the post-intervention period, the intervention group showed a smaller decrease than the control group. As a result, while the intervention group continued to have lower speeding frequency and duration, the difference between the two groups narrowed over time.
In terms of distraction, although the intervention group had higher rates at baseline, the post-intervention period saw a general increase in distraction across all participants. However, the hazard perception training appeared to mitigate the increase in distraction, with the intervention group experiencing a smaller rise in distraction compared with the control group. Despite ending with higher rates of distraction, the intervention groupʼs rates were closer to those of the control group than they would have been without the training. These results also provide further support for the inverse relationship between speeding and distraction, whereby speeding tends to increase as distraction decreases, and vice versa. Findings on the comparison of change in outcomes for the intervention group relative to the control group are listed in the last column in Table 13.
Effect of Hazard Perception Testing on Driving Risk
A k-means clustering algorithm was employed to group drivers based on their driving behavior patterns. The clustering variables included the standardized event counts and event durations for the driving behaviors listed in the previous section. Multiple clusters were explored to capture
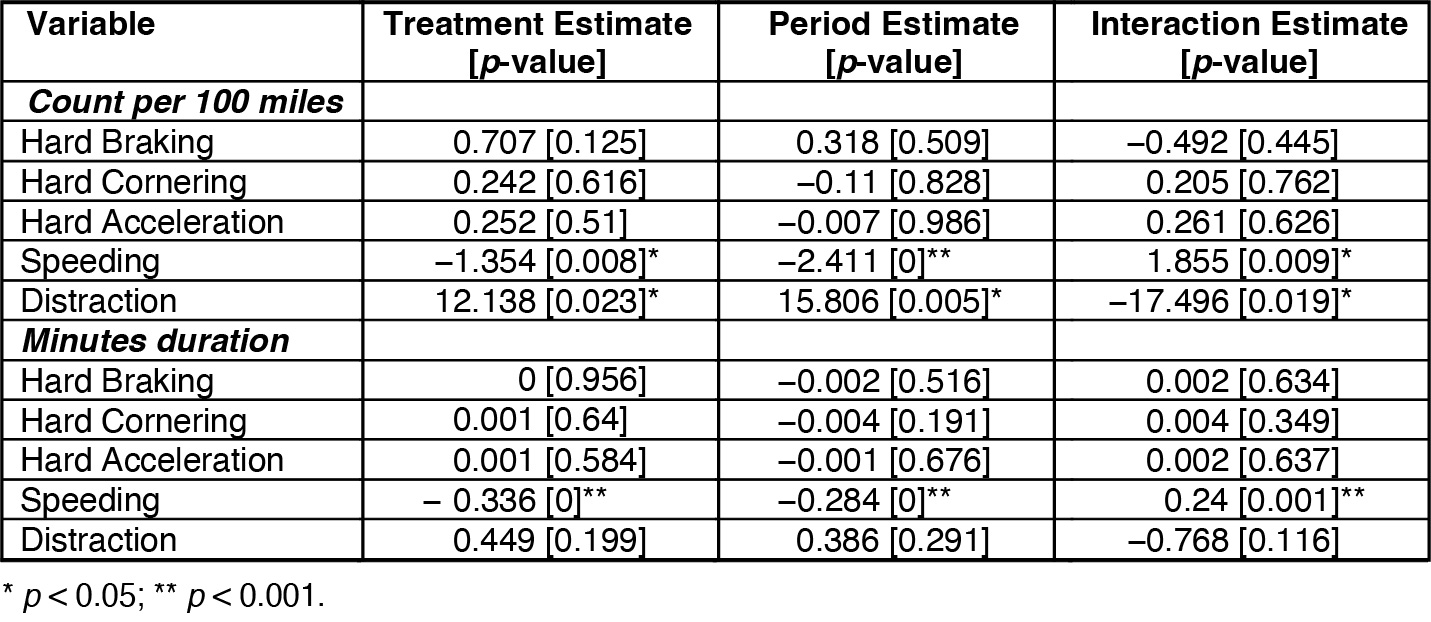
Long Description.
The table comprises four columns left to right titled Variable, Treatment Estimate [p-value], Period Estimate [p-value], and Interaction Estimate [p-value]. The first entry under the Variable column is Count per 100 miles, under which are five entries top to bottom: Hard Braking, Hard Cornering, Hard Acceleration, Speeding, and Distraction. The Hard Braking values for the Treatment Estimate, Period Estimate, and Interaction Estimate are 0.707 [0.125], 0.318 [0.509], and −0.492 [0.445], respectively. The Hard Cornering values for Treatment Estimate, Period Estimate, and Interaction Estimate are 0.242 [0.616], −0.11 [0.828], and 0.205 [0.762], respectively. The Hard Acceleration values for Treatment Estimate, Period Estimate, and Interaction Estimate are 0.252 [0.51], −0.007 [0.986], and 0.261 [0.626], respectively. The Speeding values for Treatment Estimate, Period Estimate, and Interaction Estimate are −1.354 [0.008]*, −2.411 [0]**, and 1.855 [0.009]*, respectively. The Distraction values for Treatment Estimate, Period Estimate, and Interaction Estimate are 12.138 [0.023]*, 15.806 [0.005]*, and −17.496 [0.019]*, respectively. The second entry under Variable column is Minutes duration, under which are the same previous five entries. The Hard Braking values for Treatment Estimate, Period Estimate, and Interaction Estimate are 0 [0.956], −0.002 [0.516], and 0.002 [0.634], respectively. The Hard Cornering values for the Treatment Estimate, Period Estimate, and Interaction Estimate are 0.001 [0.64], −0.004 [0.191], and 0.004 [0.349], respectively. The Hard Acceleration values for Treatment Estimate, Period Estimate, and Interaction Estimate are 0.001 [0.584], −0.001 [0.676], and 0.002 [0.637], respectively. The Speeding values for Treatment Estimate, Period Estimate, and Interaction Estimate are −0.336 [0]**, −0.284 [0]**, and 0.24 [0.001]**, respectively. The Distraction values for Treatment Estimate, Period Estimate, and Interaction Estimate are 0.449 [0.199], 0.386 [0.291], and −0.768 [0.116], respectively. The single asterisk denotes the p-value is less than 0.05 and the double asterisk denotes the p-value is less than 0.001.
different driving profiles, with each cluster representing a group of drivers exhibiting similar event patterns. The optimal number of clusters was selected based on the elbow method, which identifies the point at which the addition of more clusters no longer significantly reduces within-cluster variance. As shown in Figure 11, four clusters corresponded to this point of diminishing returns of reduced within-cluster variance.
After segmenting the driver-level telematics data into the four clusters, each cluster was compared on the basis of the average count and duration of risky driving behaviors. A clear stepwise pattern between clusters was found, with the lowest-risk cluster averaging 10 risky driving events per 100 miles to an average of 71 in the highest-risk cluster. Similarly, the lowest-risk cluster averaged less than 1 minute of risky driving events per hour driven, while this duration increased to an average of 4 minutes in the highest-risk cluster. Table 14 provides these statistics and the number of participants corresponding to each.
Two models were estimated to examine the impact of key predictors on risk classifications. The first model was a logistic regression in which the outcome variable was a binary indicator of whether a participant belonged to the highest-risk cluster. The second model was an ordinal regression, with the cluster ID from Table 14 as the dependent variable. In both models, the primary predictors included the number of trips during the pre-intervention period and performance on the hazard assessment post-test, disaggregated by module. Additionally, the study controlled for location, sex, race, age, and household income to account for demographic and contextual influences.
The logistic regression model revealed that among all predictors, performance on the Quiz 2 module related to rear-end collisions was the only significant factor influencing high-risk classification. This suggests that participants who performed better on this specific hazard recognition task were less likely to be classified as high risk. Specifically, the model results suggest that for a 10 percent increase in performance on the rear-end module, the odds of being classified as a high-risk driver decrease by approximately 20 percent.
The results of the ordinal regression model suggest that performance on the rear-end assessment section and the number of practice driving trips significantly influence the likelihood of being classified into a higher-risk group. Specifically, a 10 percent increase in assessment performance on this module leads to an 11 percent decrease in the odds of being classified as a higher-risk driver. On the other hand, the number of trips taken during the pre-intervention period has a positive effect on risk classification. For each additional trip, the odds of being in a higher-risk group increase by approximately 0.5 percent (Table 15).
Association Between Behind-the-Wheel Test Performance and Driving Risk
Gradient-boosting machines (GBMs), a classification tree–based method, was used to create a predictive model for driving risk. With GBMs, many decision trees are fitted sequentially to the residuals (errors) of the previous model, gradually improving performance. We selected this method to accommodate the high-dimensional data and an imbalanced outcome variable. More specifically, the set of predictors for this model included 122 driving maneuver elements, while the outcome comprised four driving risk classifications, with the lowest-risk classification corresponding to the largest subset of participants and the highest-risk classification corresponding to the smallest subset. Given that this model combines the detailed exam data and the telematics data, the model is limited to participants for whom both sets of data were available. The final sample size for this analysis was 312 participants.
To assess the resulting modelʼs accuracy, data were segmented into test and training data. Specifically, the most recent 20 percent of the sample was reserved as test data. All driving exams
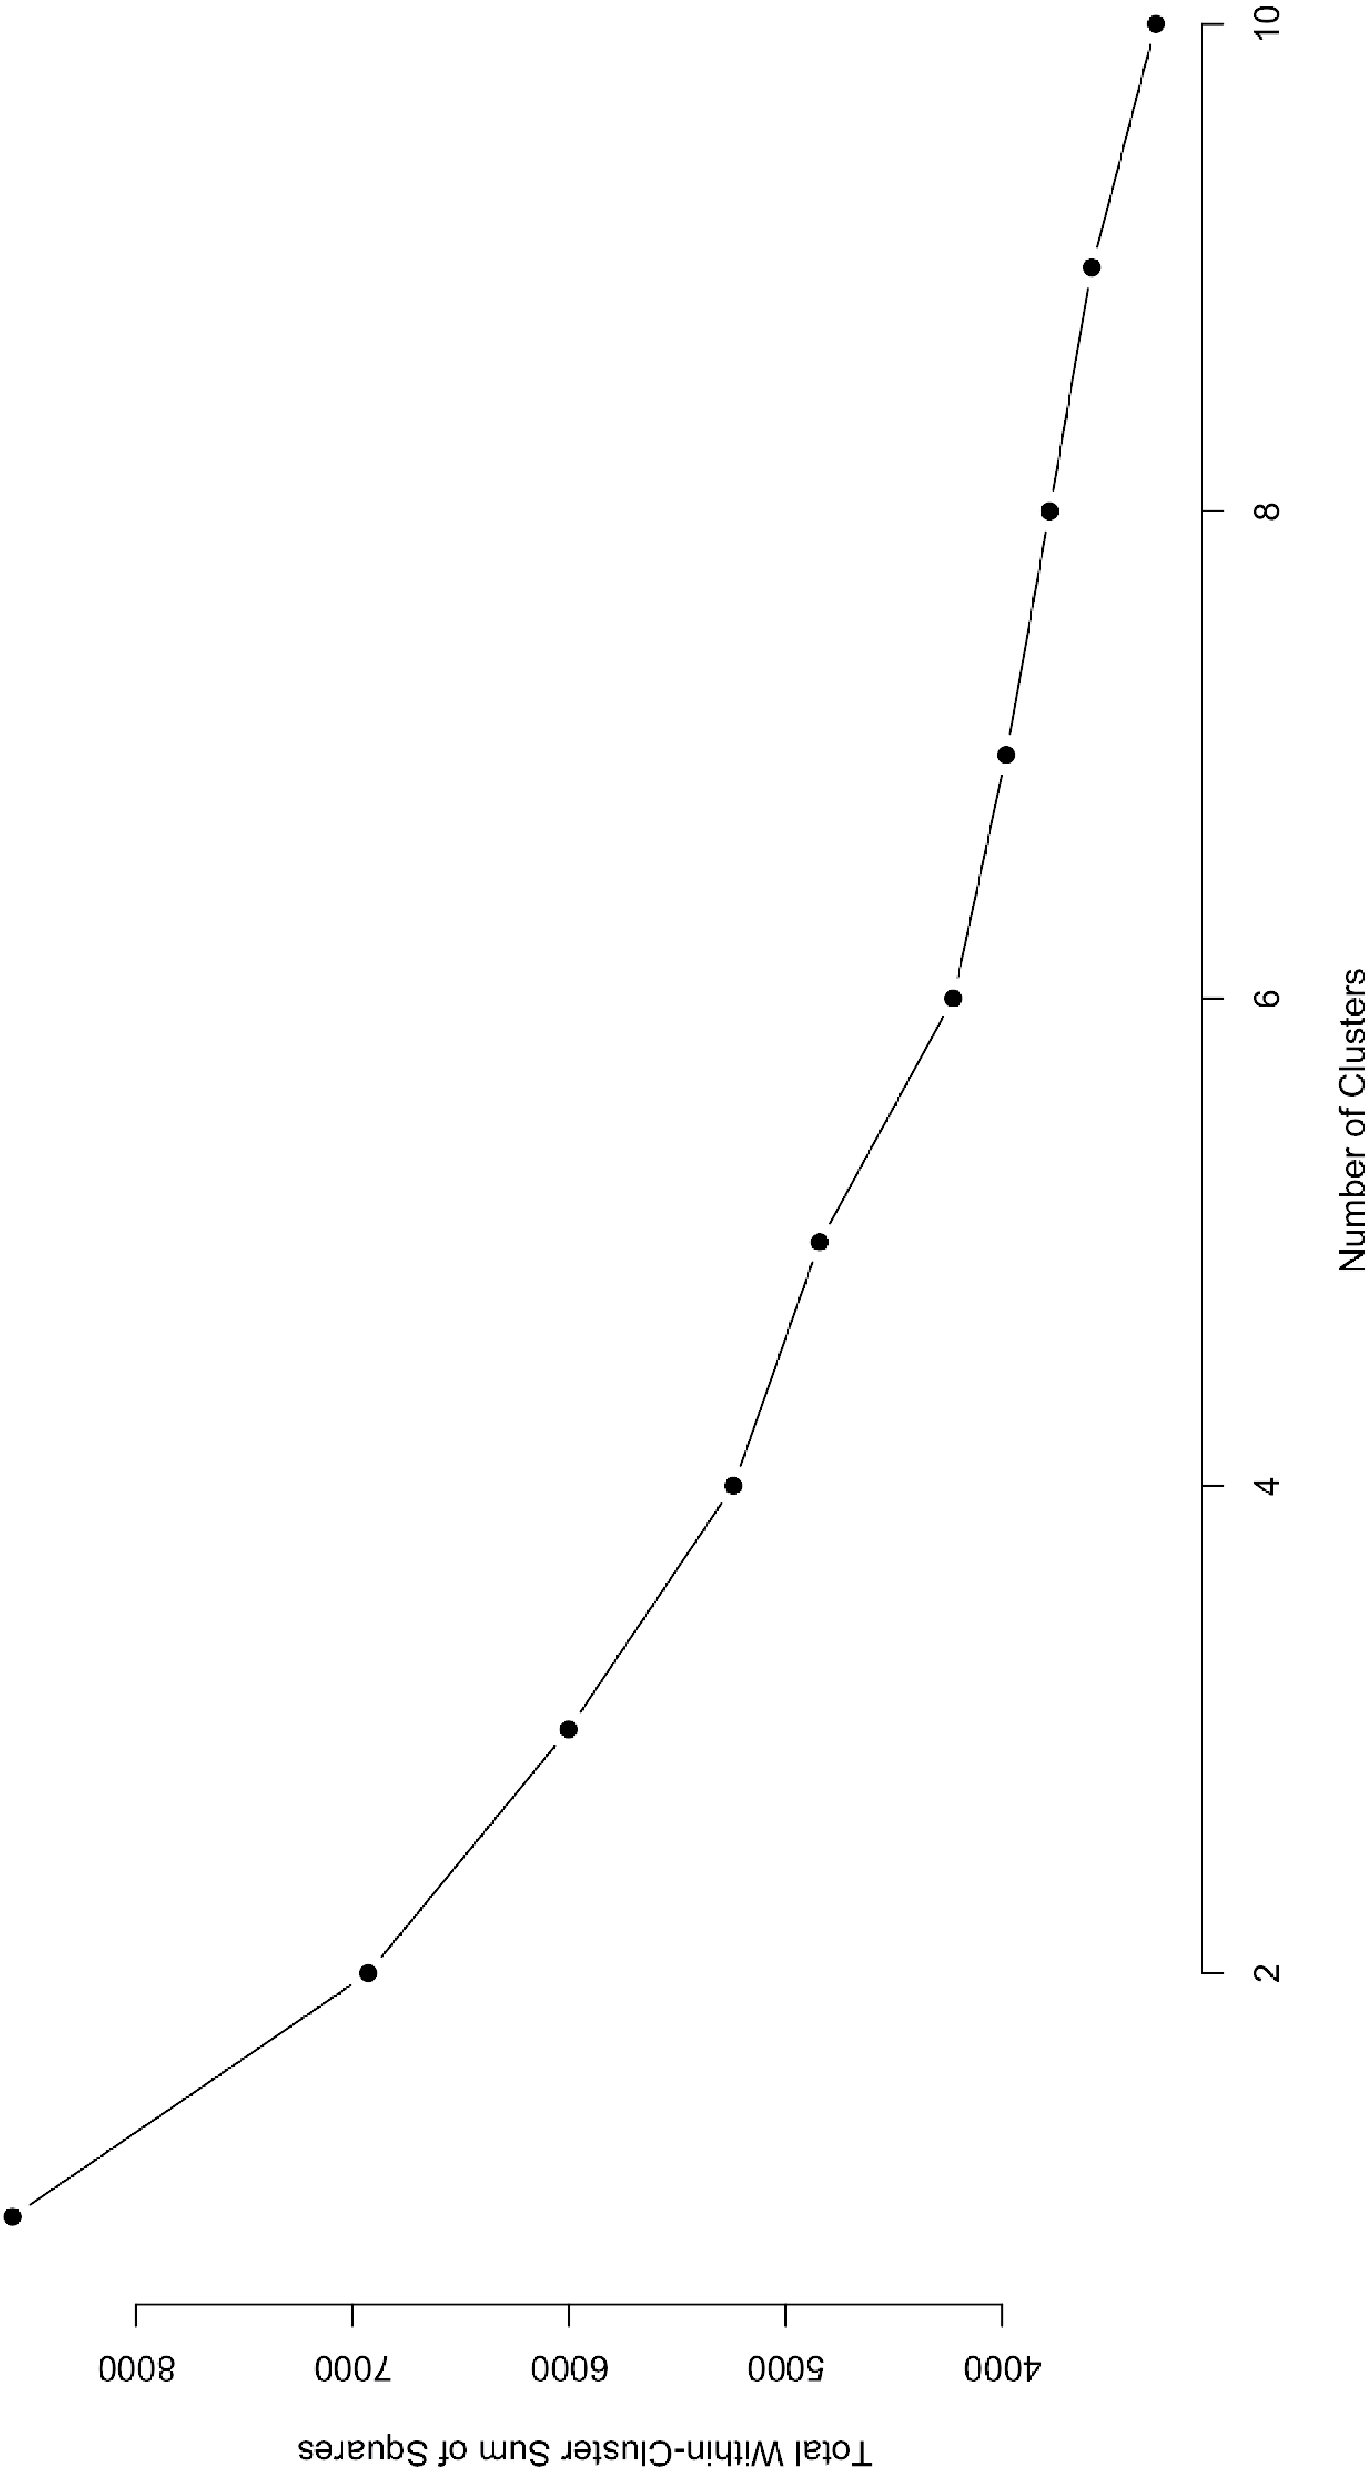
Long Description.
The vertical axis shows the total within-cluster sum of squares ranging from 4000 to 8000 in increments of 1000. The horizontal axis represents the number of clusters, with each cluster representing a group of drivers exhibiting similar event patterns, ranging from 2 to 10 in increments of 2. The graph shows a downward trend, indicating that as the number of clusters increases, the total within-cluster sum of squares decreases. The data are as follows: (2, 7000 0); (4, 5100); (6, 4300). Each data point on the graph represents the sum of squares for a specific number of clusters, with the line connecting these points showing a continuous decline.
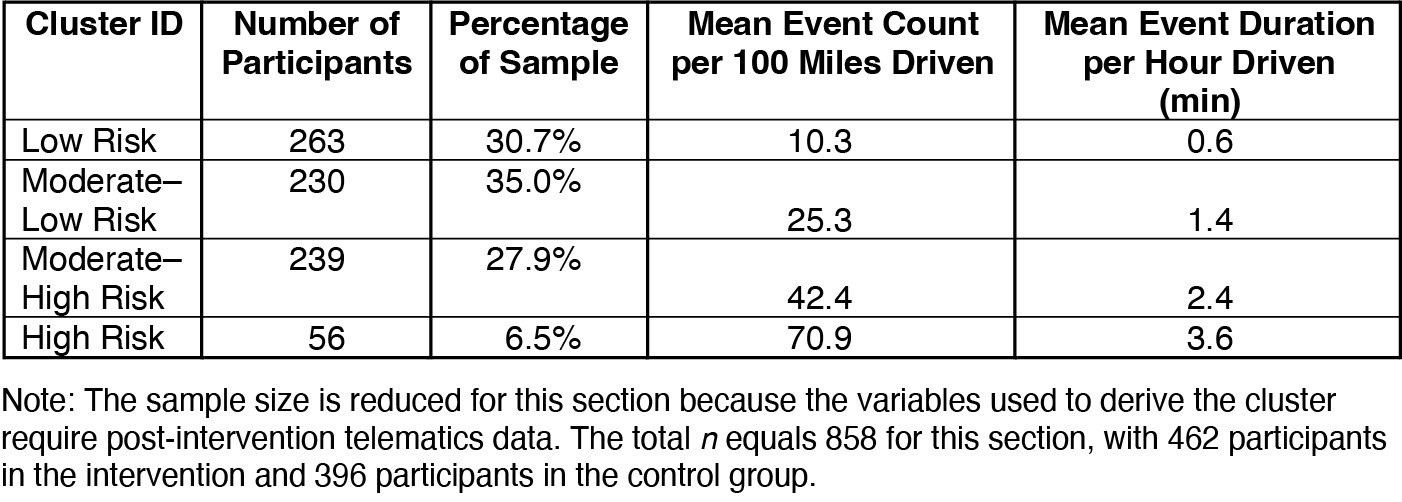
Long Description.
The table comprises five columns left to right titled Cluster ID, Number of Participants, Percentage of Sample, Mean Event Count per 100 Miles Driven, and Mean Event Duration per Hour Driven (min). The entries across the first row for each column are Low Risk, 263, 30.7 percent, 10.3, and 0.6. The entries across the second row are Moderate–Low Risk, 230, 35.0 percent, 25.3, and 1.4. The entries across the third row are Moderate–High Risk, 239, 27.9 percent, 42.4, and 2.4. The entries across the fourth row are High Risk, 56, 6.5 percent, 70.9, and 3.6. The text below the table reads the following: Note: The sample size is reduced for this section since the variables used to derive the cluster require post‐intervention telemarks data. The total n equals 858 for this section, with 462 participants in the intervention and 396 participants in the control group.
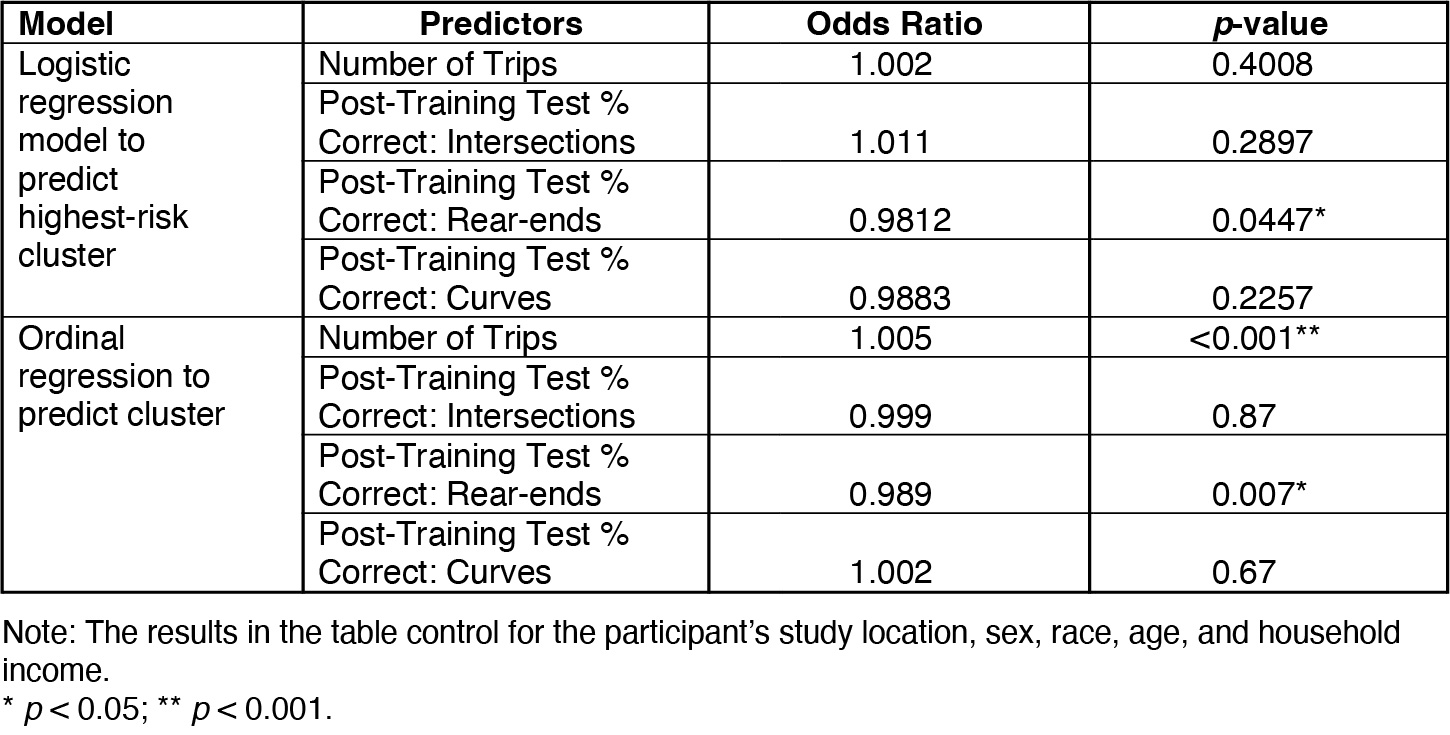
Long Description.
The table comprises four columns from left to right titled Model, Predictors, Odds ratio, and p-value. The first entry under the Model column is Logistic regression model to predict highest-risk cluster. To the right of this first entry are four entries under the Predictors column top to bottom in one cell block: Number of trips; Post-training test % Correct: Intersections; Post-training test % Correct: Rear-ends; and Post-training test % Correct: Curves. The corresponding values for the Number of trips under the Odds ratio and p-value columns are 1.002 and 0.4008, respectively. The corresponding values for the Post-training test % Correct: Intersections under the Odds ratio and p-value columns are 1.011 and 0.2897, respectively. The corresponding values for the Post-training test % Correct: Rear-ends under the Odds ratio and p-value columns are 0.9812 and 0.0477*, respectively. The corresponding values for the Post-training test % Correct: Curves under the Odds ratio and p-value columns are 0.9883 and 0.2257, respectively. The second entry under the Model column is Ordinal regression to predict cluster. To the right of this entry are the same four previous entries. The corresponding values for the Number of trips under the Odds ratio and p-value columns are 1.005 and less than 0.001***, respectively. The corresponding values for the Post-training test % Correct: Intersections under the Odds ratio and p-value columns are 0.999 and 0.87, respectively. The corresponding values for the Post-training test % Correct: Rear-ends under the Odds ratio and p-value columns are 0.989 and 0.007*, respectively. The corresponding values for the Post-training test % Correct: Curves under the Odds ratio and p-value columns are 1.002 and 0.67, respectively. The notes below state that the results in the table control for the participantʼs study location, sex, race, age, and household income. A single asterisk indicates significance when the p-value is less than 0.05. A double asterisk indicates significance when the p-value is less than 0.001.
conducted before April 15, 2025, were included in the model development. Table 16 gives the number of participants by driving risk cluster as well as showing the distribution among the training and testing datasets.
The final GBM model retained 82 of the original 122 skills exam items, each contributing some predictive value, though to varying extents. The 40 excluded items did not enhance the modelʼs ability to predict driving risk and were therefore omitted. A complete list of included and excluded items is provided in the appendix. The model demonstrated high accuracy when classifying driving risk in the training dataset, correctly identifying 94.0 percent of participantsʼ cluster classifications. However, performance declined substantially when applied to the test dataset of newly licensed drivers, with an accuracy of 35.9 percent. While this exceeds the 25 percent baseline accuracy expected by chance, it indicates only modest predictive utility.
These results suggest that while the model captures some elements of driving risk, additional or alternative predictors are needed to characterize risk profiles more fully. To better understand the structure of the 82 skills exam items retained in the GBM, an exploratory factor analysis was conducted to uncover underlying patterns among these items. This analysis yielded 12 distinct factor groupings. Figure 12 presents a heatmap illustrating the factor loadings, with color intensity indicating the strength of each itemʼs contribution to a given factor. Items shaded in red represent higher loadings, signaling stronger associations with the respective factor.
To characterize the factors identified through exploratory factor analysis, the research team reviewed the skills exam items with the highest loadings for each factor. These items were used
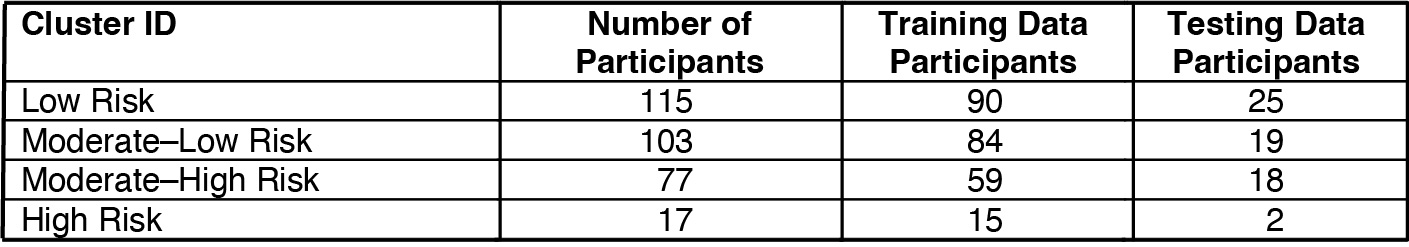
Long Description.
The table comprises four columns from left to right titled Cluster ID, Number of Participants, Training Data Participants, and Testing Data Participants. The entries across the first row for each column are Low Risk, 115, 90, and 25, respectively. The entries across the second row for each column are Moderate–Low Risk is 103, 84, and 19, respectively. The entries across the third row for each column are Moderate–High Risk is 77, 59, and 18, respectively. The entries across the fourth row for each column are High Risk, 17, 15, and 2, respectively.
to interpret and label the underlying behavioral themes represented by each factor. Table 17 presents each factor alongside its assigned label and a description of the skills exam items that contributed most strongly to the composite. Each factor was also aligned with the most relevant level of the GDE matrix (Hatakka et al., 2002). As shown in Table 17, the majority of factors (7 of 12) align with the first level of the GDE matrix, which emphasizes vehicle control. The remaining five factors correspond to the second level, which focuses on driving in traffic situations. None of the items relate to the higher levels of the GDE matrix, which includes goals and context of driving, and goals for life and skills for living.
The 12 identified factors from the Washington State skills exam can be further interpreted in relation to learning theories, such as Fitts and Posnerʼs three-stage model of motor learning (1967). Fitts and Posner describe three distinct stages that learners pass through as they are developing a new skill: an initial stage focused on the basic mechanics, a secondary stage focused on making refinements and increasing efficiency, and a final stage in which the basic mechanics are accomplished with limited conscious effort, enabling the learner to have greater situational awareness.
Certain driving skills, like those in the start-up and turn lane positioning category, are associated with the fundamental mechanics of driving and fall securely within the first stage of learning. The secondary stage can encompass many of the driving test items, whereby an individual may be able to complete the maneuver but may fail to position the vehicle correctly within the lane or appropriately calibrate their speed, such as with the lane control and intersection speed category. Finally, the post-drive reflection item encompassed in the first factor suggests a broader situational awareness that could align with the final stage of learning. Few factors in the Washington driving exam relate to this higher-level category; this category could be an area to consider when developing new items or revising existing test items.
Figure 13 offers a conceptual framework to relate learning theory to driving skill development. This framework can guide driving skills education and testing by recentering both around increasing competency in core skills. Figure 13 offers some suggested core skills, including hazard perception, but does not attempt to provide a comprehensive list. For a given skill, as an individual learns the mechanics behind the skills, they are able to complete it successfully and can then complete it comfortably while being cognizant of their environment, including other drivers and road users—meaning it can then reduce the risks associated with driving.
The 12 factors were then included as predictors in a proportional odds logistic regression model to examine their association with driving risk classification. Table 18 presents the label and description for each factor, along with its corresponding odds ratio and 95 percent confidence interval from the regression analysis. Statistically significant factors associated with driving risk are noted in the table.
Regression results using the factor groups highlight two factors as significantly increasing the odds of being in a higher-risk driving classification. These two significant factors include (1) lane control and intersection speed and (2) parallel parking and hill parking failures. Drivers who made these types of errors were about 30 percent more likely to fall into a higher-risk driving
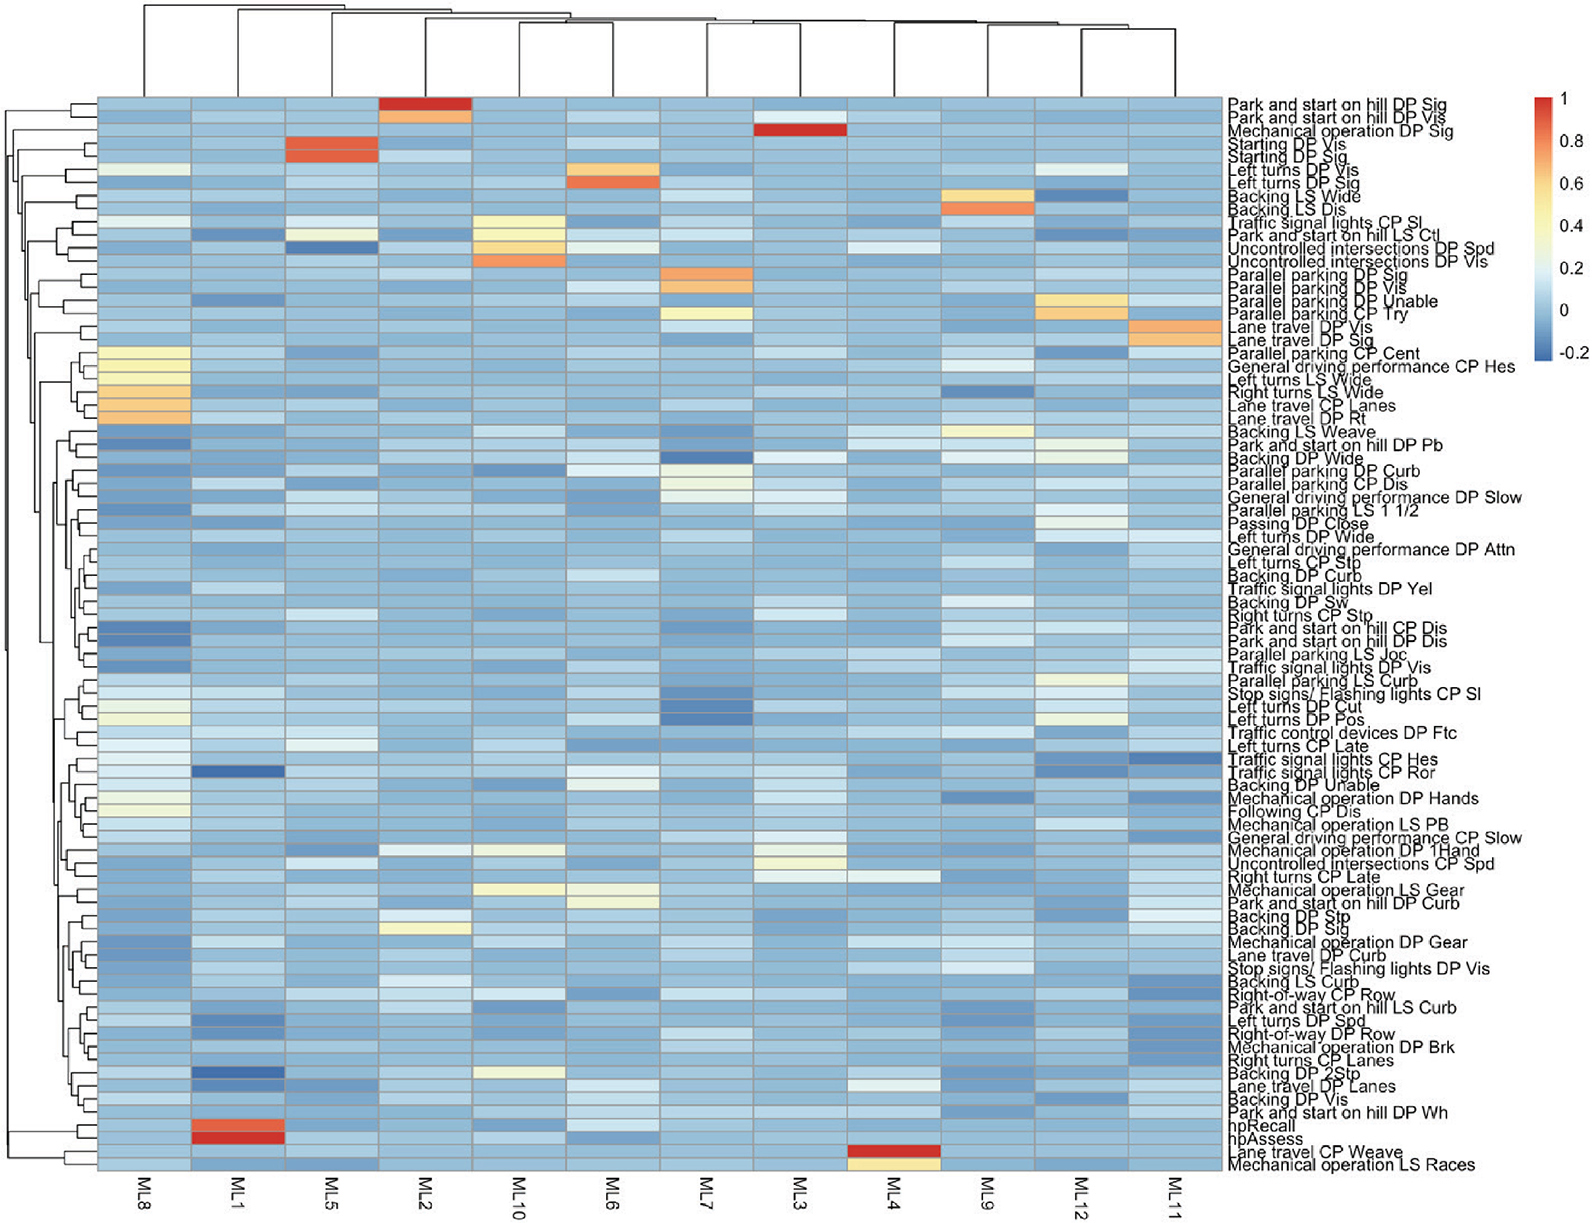
Long Description.
The heatmap includes multiple rows and columns, with each cell representing the loading value for a specific exam item and factor. Colors range from blue to red, indicating the magnitude of the loadings, with blue representing lower values and red representing higher values. The heatmap also includes hierarchical clustering dendrograms on the top and left sides, showing the relationships between the factors and exam items. Labels on the right side list specific skills exam items, and labels at the bottom denote different factors.
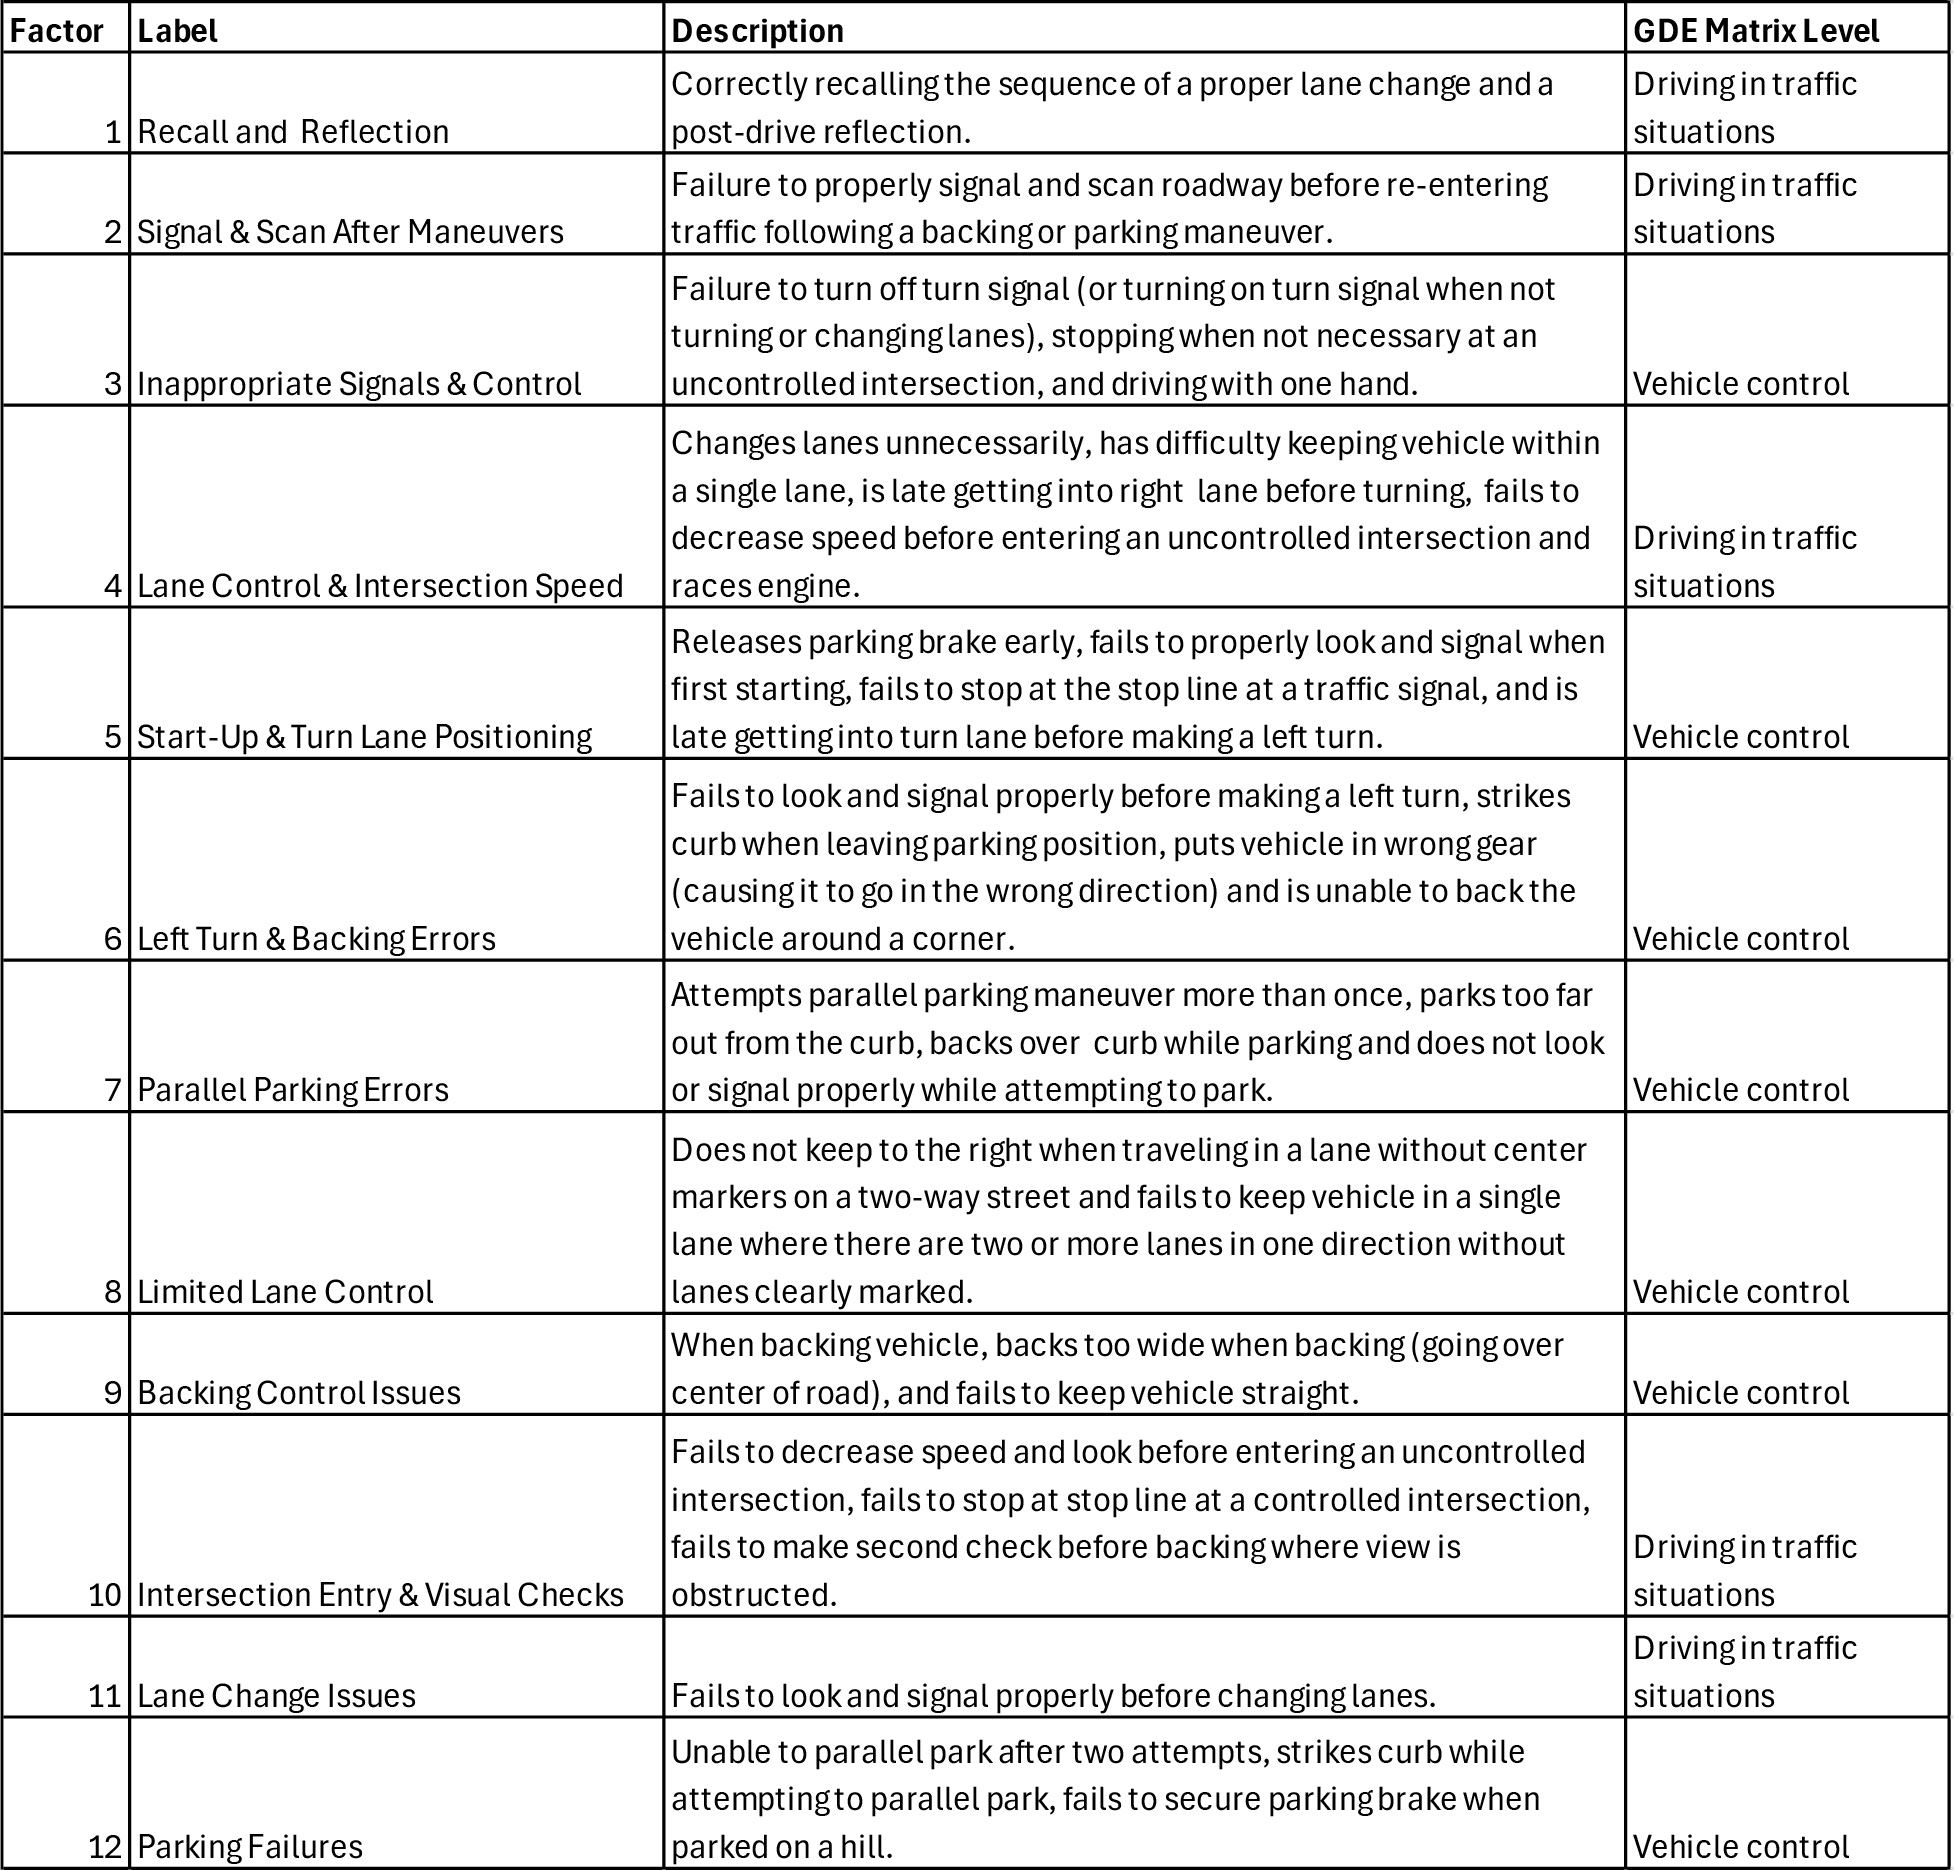
Long Description.
The table comprises four columns from left to right titled Factor, Label, Description, and GDE Matrix Level. The entries across the first row corresponding to each column are 1; Recall and Reflection; Correctly recalling the sequence of a proper lane change and a post-drive reflection; and Driving in traffic situations. The entries across the second row are 2; Signal and Scan After Maneuvers; Failure to properly signal and scan roadway before re-entering traffic following a backing or parking maneuver; and Driving in traffic situations. The entries across the third row are 3; Inappropriate Signals and Control; Failure to turn off turn signal (or turning on turn signal when not turning or changing lanes), stopping when not necessary at an uncontrolled intersection, and driving with one hand; and Vehicle control. The entries across the fourth row are 4; Lane Control and Intersection Speed; Changes lanes unnecessarily, has difficulty keeping vehicle within a single lane, is late getting into right lane before turning, fails to decrease speed before entering an uncontrolled intersection and races engine; and Driving in traffic situations. The entries across the fifth row are 5; Start-Up and Turn Lane Positioning; Releases parking brake early, fails to properly look and signal when first starting, fails to stop at the stop line at a traffic signal, and is late getting into turn lane before making a left turn; and Vehicle control. The entries across the sixth row are 6; Left Turn and Backing Errors; Fails to look and signal properly before making a left turn, strikes curb when leaving parking position, puts vehicle in wrong gear (causing it to go in the wrong direction) and is unable to back the vehicle around a corner; and Vehicle control. The entries across the seventh row are 7; Parallel Parking Errors; Attempts parallel parking maneuver more than once, parks too far out from the curb, backs over curb while parking and does not look or signal properly while attempting to park; and Vehicle control. The entries across the eighth row are 8; Limited Lane Control; Does not keep to the right when traveling in a lane without center markers on a two-way street and fails to keep vehicle in a single lane where there are two or more lanes in one direction without lanes clearly marked; and Vehicle control. The entries across the ninth row are 9; Backing Control Issues; When backing vehicle, backs too wide when backing (going over center of road), and fails to keep vehicle straight; and Vehicle Control. The entries across the tenth row are 10; Intersection Entry and Visual Checks; Fails to decrease speed and look before entering an uncontrolled intersection, fails to stop at stop line at a controlled intersection, fails to make second check before backing where view is obstructed; and Driving in traffic situations. The entries across the eleventh row are 11; Lane Change Issues; Fails to look and signal properly before changing lanes; and Driving in traffic situations. The entries across the twelfth row are 12; Parking Failures; Unable to parallel park after two attempts, strikes curb while attempting to parallel park, fails to secure parking brake when parked on a hill; and Vehicle control.
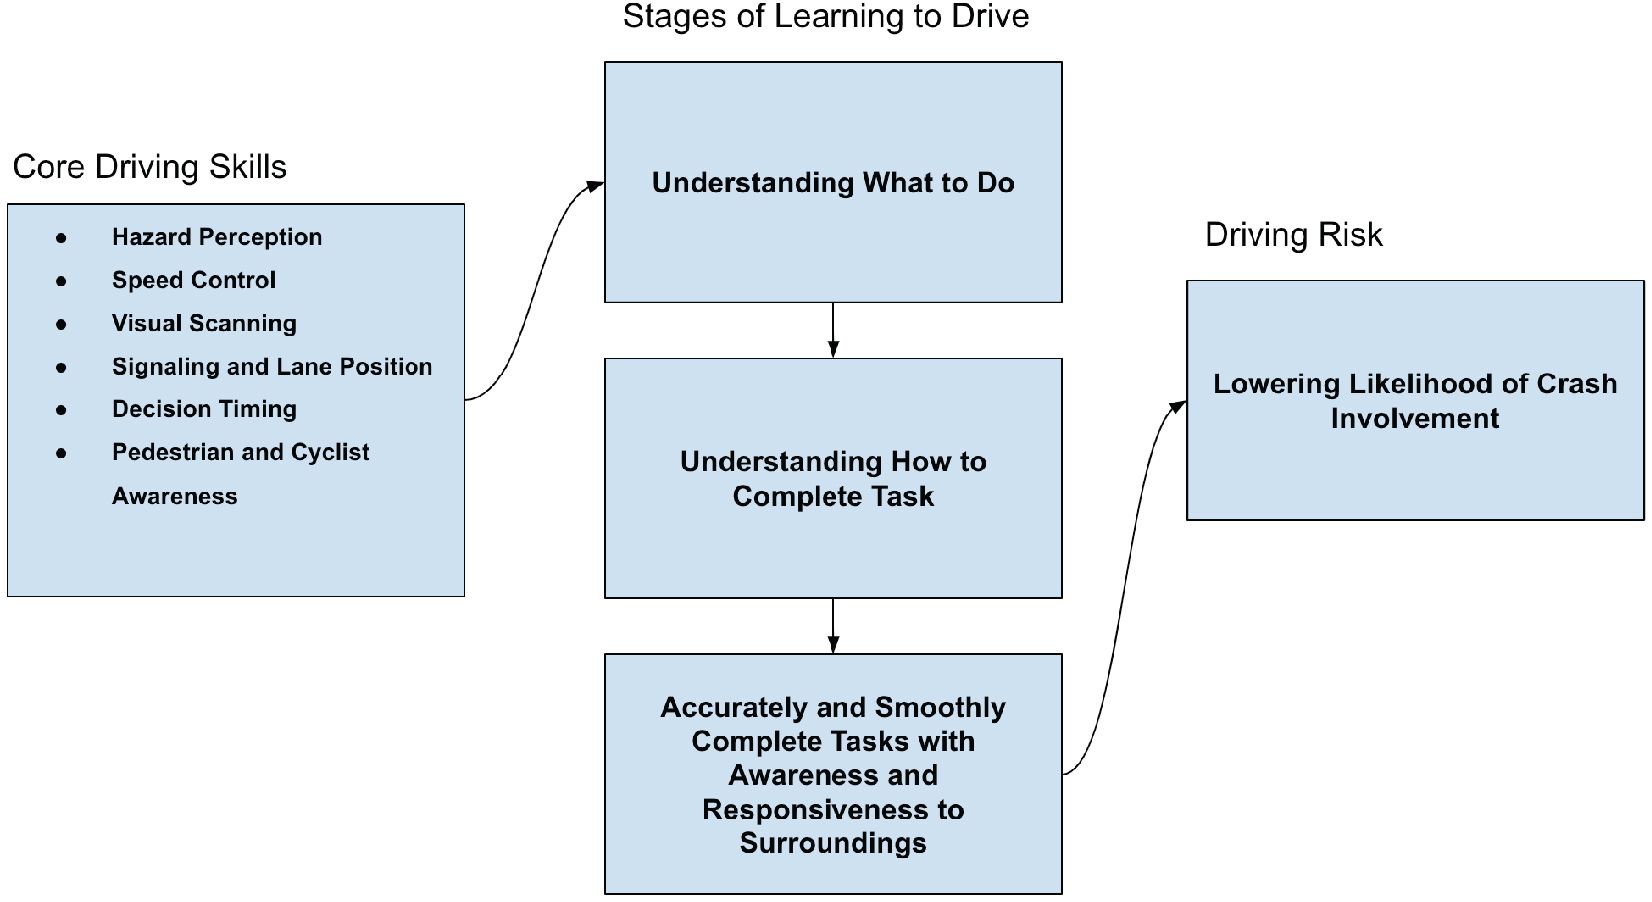
Long Description.
The flowchart starts with the first stage, Core Driving Skills, which includes hazard perception, speed control, visual scanning, signaling and lane position, decision timing, and pedestrian and cyclist awareness. The second stage, Stages of Learning to Drive, shows three phases of learning to drive: Understanding What to Do, Understanding How to Complete Tasks, and Accurately and Smoothly Complete Tasks with Awareness and Responsiveness to Surroundings. The third stage, Driving Risk, includes Lowering Likelihood of Crash Involvement. These stages are connected by arrows indicating progression. The first stage connects to the first phase of the second stage. The third phase of the second stage connects to the third stage, which leads to accurate and smooth driving with awareness and responsiveness.
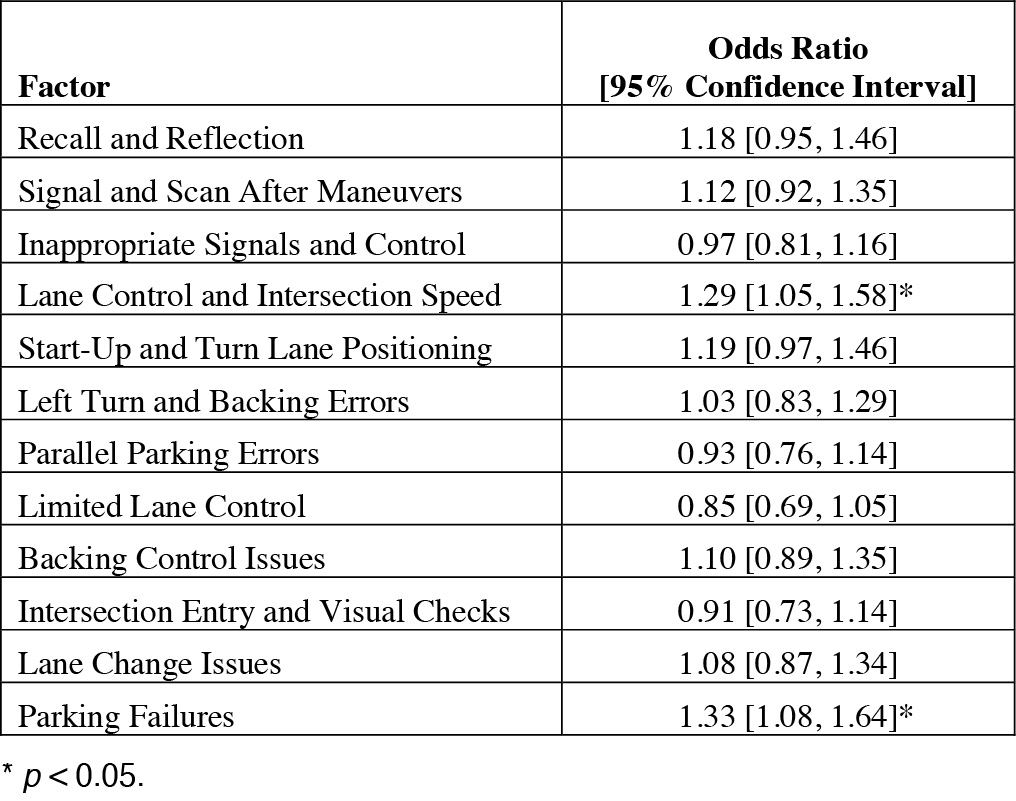
Long Description.
The table comprises two columns from left to right titled Factor and Odds Ratio [95% Confidence Interval]. The entries across the first row for both columns is Recall and Reflection and 1.18 [0.95, 1.46]. The entries across the second row for both columns are Signal and Scan After Maneuvers and 1.12 [0.92, 1.35]. The entries across the third row for both columns are Inappropriate Signals and Control and 0.97 [0.81, 1.16]. The entries across the fourth row for both columns are Lane Control and Intersection Speed and 1.29 [1.05, 1.58]*. The entries across the fifth row are Start-Up and Turn Lane Positioning and 1.19 [0.97, 1.46]. The entries across the sixth row are Left Turn and Backing Errors and 1.03 [0.83, 1.29]. The entries across the seventh row are Parallel Parking Errors and 0.93 [0.76, 1.14]. The entries across the eighth row are Limited Lane Control and 0.85 [0.69, 1.05]. The entries across the ninth row are Backing Control Issues and 1.10 [0.89, 1.35]. The entries across the tenth row are Intersection Entry and Visual Checks and 0.91 [0.73, 1.14]. The entries across the eleventh row are Lane Change Issues and 1.08 [0.87, 1.34]. The entries across the twelfth row are Parking Failures and 1.33 [1.08, 1.64]*. The asterisk denotes p less than 0.05.
category. Specifically, a one-unit increase in the factor score for lane control and intersection speed corresponded to 29 percent increased odds of being classified as having higher driving risk (odds ratio = 1.29) while a unit increase in the parking failures category corresponded to 33 percent increased odds (odds ratio = 1.33). Given the factor scores are weighted composites of multiple test items, a one-unit increase does not directly correspond to an additional point on the skills exam but rather reflects a greater number or severity of errors related to the composite items.
The implications of analysis of the driving exam items can be summarized through the following three findings. First, predictive modeling identified 82 of 122 driving exam items that were able to accurately predict 94 percent of a set of 248 studentsʼ driving risk classifications. When the model was extrapolated to predict the driving risk of students who more recently completed their skills exam (64 students) the model was only able to accurately predict the risk classification
of 36 percent of those students—slightly better than the 25 percent accuracy that could be randomly estimated. This suggests that the model offers some predictive value, including the 82 items incorporated into the model, but it is an incomplete model for predicting driving risk. Second, exploratory factor analysis identified 12 distinct patterns among the 82 predictive driving exam items. These items primarily relate to vehicle control, with some measures also measuring how drivers manage traffic situations. Finally, when assessing each of these 12 factors in relation to driving risk, two are strongly associated with higher driving risk—a factor relating to lane control and intersection speed and another relating to an inability to parallel park or appropriately park on a hill.
Taken together, these findings suggest that the current form of the Washington driving exam is able to identify and screen for the least capable drivers and that there is a secondary category of items relating to judgment and decision making surrounding driving in traffic, which the exam begins to but may not fully capture.
Task 8: Identify the Barriers to or Adverse Impacts from the Adoption of the Model Driving Skills Examination and Scoring Methodology
Implementing the proposed driving skills examination process on a wide scale presents several potential barriers and adverse impacts. The following are key considerations categorized by technological, logistical, educational, and exam-specific challenges.
Introducing a Hazard Perception Test
Technological Barriers
Not all students may have access to a reliable personal device (computer, tablet, or smartphone) or a stable internet connection, potentially disadvantaging certain groups. If hazard perception training and testing became a requirement, students would need the ability to access the content. Innovative models for providing access will need to be developed so that students can complete the requirements in a way that places minimal logistical burden on themselves and their families.
One challenge during the pilot study was ensuring that the web application functioned seamlessly across various devices, operating systems, and browsers. A dedicated development team played a critical role in ensuring the successful implementation of the online hazard perception training and testing platform. For example, as many students accessed the platform via mobile devices, the interface was refined to ensure touchscreen-friendly navigation, adaptive layouts, and proper scaling across different screen sizes. The development teamʼs responsibilities extended beyond initial software development to ongoing maintenance and troubleshooting. Throughout the pilot study, students and instructors reported various software issues that affected usability and engagement. In certain cases, students experienced test freezing or premature session terminations. The development team identified memory management issues and introduced other backend adjustments to prevent data loss. The iterative refinement process contributed to a more reliable and accessible system, laying the groundwork for broader implementation.
Moving forward, any requirement for online hazard perception training and testing will need to be hosted and maintained by an entity that specializes in the delivery of educational content and can administer online assessments. This entity should have the capability to integrate with each stateʼs data systems such that the training and testing data are readily accessible to state licensing officials.
Logistical Barriers
Substantial implementation and time costs are associated with changes to examination protocols. Developing, maintaining, and upgrading the online platform and digital assessment tools require significant financial investment. The upfront costs could be offset through a specialized grant or procurement program and could be leveraged across multiple states. Additionally, driving instructors and examiners must be trained on the new hazard perception components and digital tools, which requires time and resources. Incorporating new testing components, particularly adding items to behind-the-wheel exams, could increase the time needed for each evaluation and limit the number of tests administered.
Educational Barriers
There may be challenges for both students and instructors in adapting to a new digital learning platform. For students, some may struggle with self-guided digital hazard perception training, particularly if they are unfamiliar with web-based learning environments. This could lead to differential learning and test results that are not directly connected to the content. There may also be challenges for non-native English speakers, which is one challenge that occurred during the pilot study. Therefore, there may be a need to adapt the online platform to enable the delivery of training and assessments in multiple languages.
Additionally, instructors are often the first point of contact when students encounter technical or usability issues. To better equip them for this role, targeted training for instructors before implementation should focus on common platform issues and troubleshooting strategies. A related key requirement to support instructors is the need for an ability to track student progress through the web-based platform. The pilot study found that a significant portion of students were not completing the hazard perception training and assessments during class sessions as expected. To address the need to monitor completion, the research team developed the capability to generate progress reports. Moving forward, instructors should have access to dashboards to monitor student activity and progress on training and assessments during the class sessions to quickly prompt students and address any access issues.
Modifying the Behind-the-Wheel Exam
The behind-the-wheel test is a critical milestone for many teenagers and their families, serving as the primary assessment of a driverʼs readiness to operate a vehicle independently. Instructors play a key role in objectively evaluating a studentʼs fitness to drive, making any substantive changes to the examination process—especially the scoring methodology—an important decision that requires thorough evaluation.
Strengthening the ability of this exam to identify high-risk drivers could offer considerable potential safety benefit. Analysis of the current behind-the-wheel exam provided insight into those items that have high predictive value in identifying high-risk drivers and also identified driving maneuvers with limited safety value. These findings can serve as a guide to items that are given greater weight in the exam scoring and items that are considered for elimination to allow time for the addition of new components, such as an independent drive component.
One key consideration is the inclusion of the driver awareness questions in the behind-the-wheel exam. These questions provided a modest association with risky driving and could be a promising area of examination for further research. However, the format and the response options introduce a level of subjectivity that may challenge standardization in scoring. Variability in how instructors interpret and evaluate responses could also affect exam outcomes. Even still, the pilot study offers an example of how an evidence-based component could be added to an existing driver licensing examination process.
Further research is needed to assess the implications of modifying the driving skills examination process, such as the addition of the hazard perception test and making changes to the behind-the-wheel test, including:
- Potential scoring impacts: How would changes to scoring criteria influence pass/fail rates?
- Exam validity and driving outcomes: How well do the revised exam components predict real-world driving performance, including crash risk and citation rates?
- Examiner training needs: What level of guidance or standardization is required to ensure fair and consistent scoring?
Carefully examining these factors will help determine whether such changes enhance the assessment process while maintaining fairness and reliability in driver evaluation.


