Predicting High-Risk Drivers: Skills Examination and Scoring Guidelines (2025)
Chapter: 2 Research Approach

CHAPTER 2
Research Approach
Method
Document Review
Tasks 1 and 2 of BTSCRP Project BTS-16, “Developing Driver Skills Examination and Scoring Guidance for Evaluating and Predicting High Safety Risk Drivers,” required the documentation and critique of the current driving skills examination and scoring methodologies used by all U.S. states and all countries in the Organisation for Economic Co-operation and Development (OECD) (see the appendix). In the third quarter of 2022, the OECD review led by TRL was submitted to the panel. The review of U.S. states was initiated in parallel with the OECD review, but the scope of the task was considerably larger. Therefore, it was completed in the fourth quarter of 2022.
To document current driving skills examination and scoring methodologies in the United States, the research team began by defining the scope of the policies to be reviewed. Relevant variables for each regulation and for state government website information were identified and abstracted. Each variable fell into one of the following categories:
- Driving exam parameters
- Driving exam scoring method
- Evidence for how driving exam information is shared with the driver training community
- Required examiner qualifications and certifications to conduct the driving exam
- Driving exam failure policy
- Evidence or rationale for existing driving exam and scoring methodologies
- Exceptions to policies to accommodate those with medical conditions or physical disabilities
- Post-licensure testing
- Policies for driverʼs license suspension and revocation
- Driver education requirements
As of November 2022, all 50 states and the District of Columbia provided administrative regulations or online information through an official state government website that related to the requirements and procedures for the driver licensing process. A comprehensive summary of each requirement is provided for each category. At the conclusion of this report is a summary and critique of current driving skills examinations and scoring methodologies.
Review of Testing Approaches in the OECD
A total of 36 countries were included in the review of driving test components of the 38 countries in the OECD (see the appendix). Table 1 describes the categories of information of interest to the study.

Long Description.
The table comprises two columns from left to right titled Category and Description. The entries across the first row for both columns are 1 and Types of roads on which testing is conducted (e.g., public roads or closed-circuit private tracks). The entries across the second row are 2 and Driving maneuvers and behaviors included in the driving examination. The entries across the third row are 3 and Scoring method corresponding to required driving maneuvers and behaviors. The entries across the fourth row are 4 and Evidence for how test information is shared with the driver training community (e.g., sharing test routes). The entries across the fifth row are 5 and Examiners qualified to conduct the driver skills test (e.g., state employees versus private contractors). The entries across the sixth row are 6 and Test failure policy, including any requirements for a minimum duration of time before retesting is allowed. The entries across the seventh row are 7 and Evidence of rationale for existing driving skills examination and scoring methodologies. The entries across the eighth row are 8 and Any exceptions to policies, such as accommodations for medical conditions or physical disabilities. The entries across ninth row are 9 and Policies for driverʼs license suspension and revocation.
Expert Panel
To advance Tasks 3, 4, and 5, the research team convened an expert panel on February 28, 2023, to offer perspectives about what should be included in a new driving test. The panelists were requested to review the findings of Tasks 1 and 2 and provide the perspectives necessary for broad relevance, effectiveness, and acceptability in developing a model driving examination. These recommendations are intended to be technically feasible, research informed, and consistent with the needs, constraints, and expectations of the driving public, state licensing officials, and safety experts.
In addition, the panel discussed the role of scientific evidence in driver training and testing, and what steps could be taken to foster the use of more evidence-based methods. The research team provided the reports from the U.S. and OECD review of driver testing practices to the panelists in advance of the meeting.
Before the meeting, panelists were contacted by the research team to inform them of expectations and the process for deliberations. Panelists were then asked to provide evidence-informed comments and recommendations throughout the deliberations.
Experiment Trial
Teenagers who enrolled in driver education between July 15 and September 30, 2024, at one of seven participating driver training schools in the state of Washington were eligible to participate in this study. Schools were randomly assigned to either the control or the intervention groups. All participants and their parents were given an opportunity to opt out of the study. Those who opted out did not have their data retained by the study team and are not included in the data analysis and results. Data reported was collected through March 3, 2025.
All participants in the driver education course were required to complete a hazard perception pre-test and a hazard perception post-test, regardless of study participation, and given an opportunity to install a driver monitoring app, DriveStudy (developed by Cambridge Mobile Telematics) on their smartphones. Individuals in the control group were asked to view a series of vehicle maintenance videos during their driver education, while students in the intervention
group were asked to complete hazard perception training. The hazard perception training included modules on intersections, curves, and scenarios related to rear-end collisions.
DriveStudy monitors driving behavior without providing any feedback on trips. The app runs automatically in the background without needing to be opened or displayed to record trips. The app, however, will not record trips if the phone is turned off, low on battery, or in a battery saving mode, or if certain settings are disabled, such as location sharing. The app uses an algorithm to estimate whether the trip was made by motor vehicle and, if so, whether the user was the driver. In addition, the app allows users to review trips recorded by the app and to label the trip. For example, app users can manually apply the “passenger” label to indicate a trip when they were not the driver. Users can also label a trip as “driver—passenger used phone” to indicate that a passenger used their phone, preventing phone distraction events from being considered. Trips were excluded from analysis if neither the telematics algorithm nor the user identified as a driver. Trips were also filtered out in instances when the telematics algorithm identified the user as the driver but the user self-identified as a passenger or nonmotorist.
Experiment Trial Data
Telematics
Driver behavior was assessed in relation to five types of events: hard braking, hard cornering, hard acceleration, speeding, and distraction (screen interaction or phone use). The first three of these are high g-force events flagged when movements exceed specified thresholds, for example, a sudden slowdown of about ⅓ g. Speeding is recorded as an event when vehicle speed exceeds the speed limit by 10 mph or more. Last, distraction records when a driver is using the phone for a call, holding the phone, or tapping on the phone. These behaviors are captured when the vehicle is traveling more than 10 mph.
This study developed a methodology to calculate two key metrics for analyzing driving behavior: the event rate per 100 miles driven and the event duration per hour driven.
- Event rate: To account for differences in trip lengths, the event rate for each type of driving behavior (e.g., hard braking, speeding) was calculated by normalizing the event counts to the distance traveled. This was done by dividing the total number of events by the miles driven and multiplying by 100, resulting in an event rate expressed per 100 miles driven. The analysis was done separately for each driver, grouped by key variables like study arm (e.g., intervention versus control) and months elapsed, ensuring that drivers within each group were treated similarly.
- Event duration: In addition to event rates, the study calculates the event duration per hour of driving. Each eventʼs duration was first converted from seconds to minutes and then normalized by dividing the event duration by the total driving time in minutes, before scaling to a per-hour basis. Again, this approach was done separately for each driver and grouped by study arm and months elapsed to allow for the comparison of event durations across different groups and time periods.
The methodology involved summarizing the data at two levels: the individual driver level and the group level. At the driver level, data was grouped by unique driver identifiers, study arm (e.g., intervention or control), and months elapsed since enrollment. Within these groups, the event rate per 100 miles and the event duration per hour were averaged across individual trips. At the group level, the aggregated data was further summarized by calculating the mean event rates and event durations for each study arm and month elapsed, ensuring that the group-level results were representative of the overall population of drivers.
Telematics data collection commenced at the beginning of supervised driving and continued for up to 9 months. For those who obtained their license during this period, the telematics data collection included independent driving. As of May 2025, approximately one-third of participants have obtained their license. The average date of licensure among the licensed sample was January 31, 2025. When licensure data was connected with the telematics data, 35 percent of trips were found to have occurred during the independent phase, with the remaining trips occurring during supervised driving.
Hazard Perception Training and Assessments
Hazard perception training and assessments were based on three specific roadway scenarios in which hazard perception is relevant: curves, intersections, and scenarios in which a hazard is in front of the driver and the driver could rear-end the vehicle ahead. The training administered to the intervention arm had six exercises for each scenario, with 18 exercises in total. Each exercise had two sections in which hazards were presented from different perspectives (near and far view; see Figure 1).
All participants completed a pre-intervention hazard perception assessment (pre-test), an immediate post-intervention assessment (post-test 1), and a 3-month assessment (post-test 2). The pre-test was taken near the beginning of participantsʼ driver education course. Immediately following hazard perception training for the intervention group, all participants were instructed to complete a second hazard perception exam (i.e., post-test 1). After completing the driver education course, participants completed a second post-test (i.e., post-test 2). This was used to evaluate retention of the training material. All the tests were identical. Both the training and the testing questions were based on the three specific roadway scenarios wherein hazard perception is relevant (curves, intersections, and rear-ends).
Telematics Data Analysis Approach
Analysis of the data was conducted by comparing the study arms (i.e., the intervention and control groups). In addition, the analysis in the longitudinal analysis accounted for the number of months elapsed since the intervention, enabling comparisons of how event rates and durations changed over time.
To identify the period before the intervention and the period after the intervention, the research team calculated the average treatment date. Specifically, for each class of students in the intervention group, the average number of days between the class start date and the date
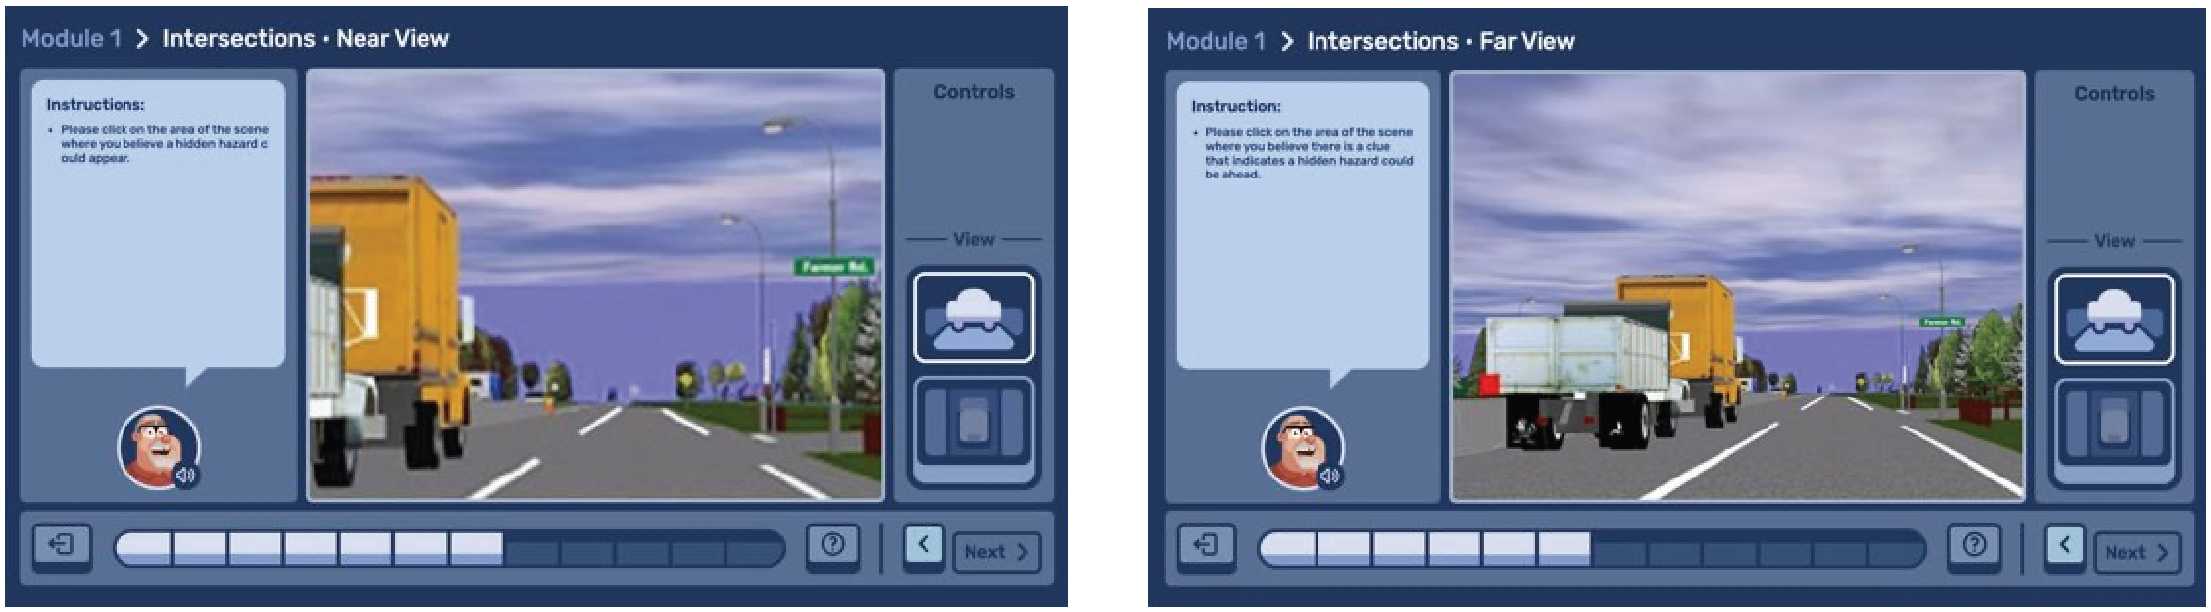
Long Description.
A Near View Interactive simulation interface shows a near view of an intersection. The scene includes a large yellow truck on the road with a gray truck behind it. The interface features a control panel on the right side with options for view. Instructions are displayed on the left side, guiding users to click on the area of the scene they believe a hidden hazard could appear. Far View Interactive simulation interface showing a far view of an intersection. The scene includes a large yellow truck on the road with a gray truck behind it. The interface features a control panel on the right side with options for view. Instructions are displayed on the left side, guiding users to click on the area of the scene they believe there is a clue that indicates a hidden hazard could be ahead.
when training was completed was estimated. This estimate was then averaged across all students in the intervention group, revealing that the average treatment date was approximately the same as the course end date. Therefore, to ensure a consistent comparison between the intervention and control groups, the course end date was used to separate the pre-intervention and post-intervention periods.
Analysis Description
Comparison Between Study Arms
The research team selected the difference-in-differences (DiD) approach as the primary method for assessing differences in the telematics data between the control and intervention groups, comparing before and after the intervention. DiD is a statistical technique used to estimate the causal effect of an intervention by comparing the changes in outcomes over time between an intervention and a control group. DiD relies on the assumption that, in the absence of the intervention, the treated and control groups would have followed parallel paths in their outcomes over time. This method is commonly used in observational studies for which random assignment is not possible. This approach was used to assess three differences:
- Comparing telematics data between the intervention and control groups
- Comparing telematics data before and after the intervention
- Comparing differences in the intervention groupʼs telematics data before and after the intervention with differences in the control groupʼs telematics data before and after the intervention
Identification of High-Risk Drivers
To identify high-risk drivers, the research team employed a clustering approach using multiple event-based metrics derived from the driverʼs behavior data. Specifically, a k-means clustering algorithm was used to group drivers based on both event duration and event count variables, which represent the frequency and duration of specific driving behaviors. The telematics data used in the identification of high-risk drivers incorporated data from the post-intervention period only. These behaviors were hard braking, hard cornering, hard acceleration, speeding, and distraction.
Once the clusters were defined, high-risk drivers were identified as those in the cluster exhibiting the highest frequency and duration of high-risk behaviors such as speeding, hard braking, and distraction. Specifically, the cluster with the highest mean values for these behaviors was considered the high-risk group. To further define high-risk drivers, a binary variable was created to classify drivers in this high-risk cluster as high risk and all others as low risk. By focusing on the drivers with the highest levels of unsafe driving behavior, the research team was able to isolate the individuals who posed the greatest potential risk for accidents and unsafe driving conditions.
Institutional Review Board
The research team was granted institutional review board (IRB) approval through the Johns Hopkins Bloomberg School of Public Health IRB for this study.


