Improving Transit Customer Perception of Personal Security (2025)
Chapter: 3 Transit Agency Survey

CHAPTER 3
Transit Agency Survey
The project team surveyed transit agency customer service, customer experience, and marketing personnel. Appendix B contains the survey instrument. The project team began with a list of 367 people representing 176 agencies who attended APTAʼs Marketing, Communications, and Customer Experience conference in February 2024. The project team identified the person from each of the 176 agencies with the title that most aligned with customer experience/customer service to email the request to participate in the survey. A link to the online survey was provided with an explanation of the project. The online survey was open for over 8 weeks, April 4–May 28, 2024. Group emails were sent to the 176 agency contacts on two occasions. Of those who did not participate in the survey during this period, individualized emails were sent with a personal plea two additional times. A total of 40 responses were received, 35 of which were complete with usable responses. Although the response rate was low, the team received a range of information about what is being done to address the perception of security. This chapter highlights the feedback received from these 35 agencies.
Survey Participant Role at Transit Agency
First, participants were asked what departments they have worked in at their transit agency. A wide variety of people in different departments responded. Table 1 shows that most respondents (21 people) reported working in management and upper management. The second most reported department was marketing (18 people). Other departments where participants reported working include administration and customer service. Participants were asked to select all that apply.
Factors Affecting Customer Perceptions of Personal Security
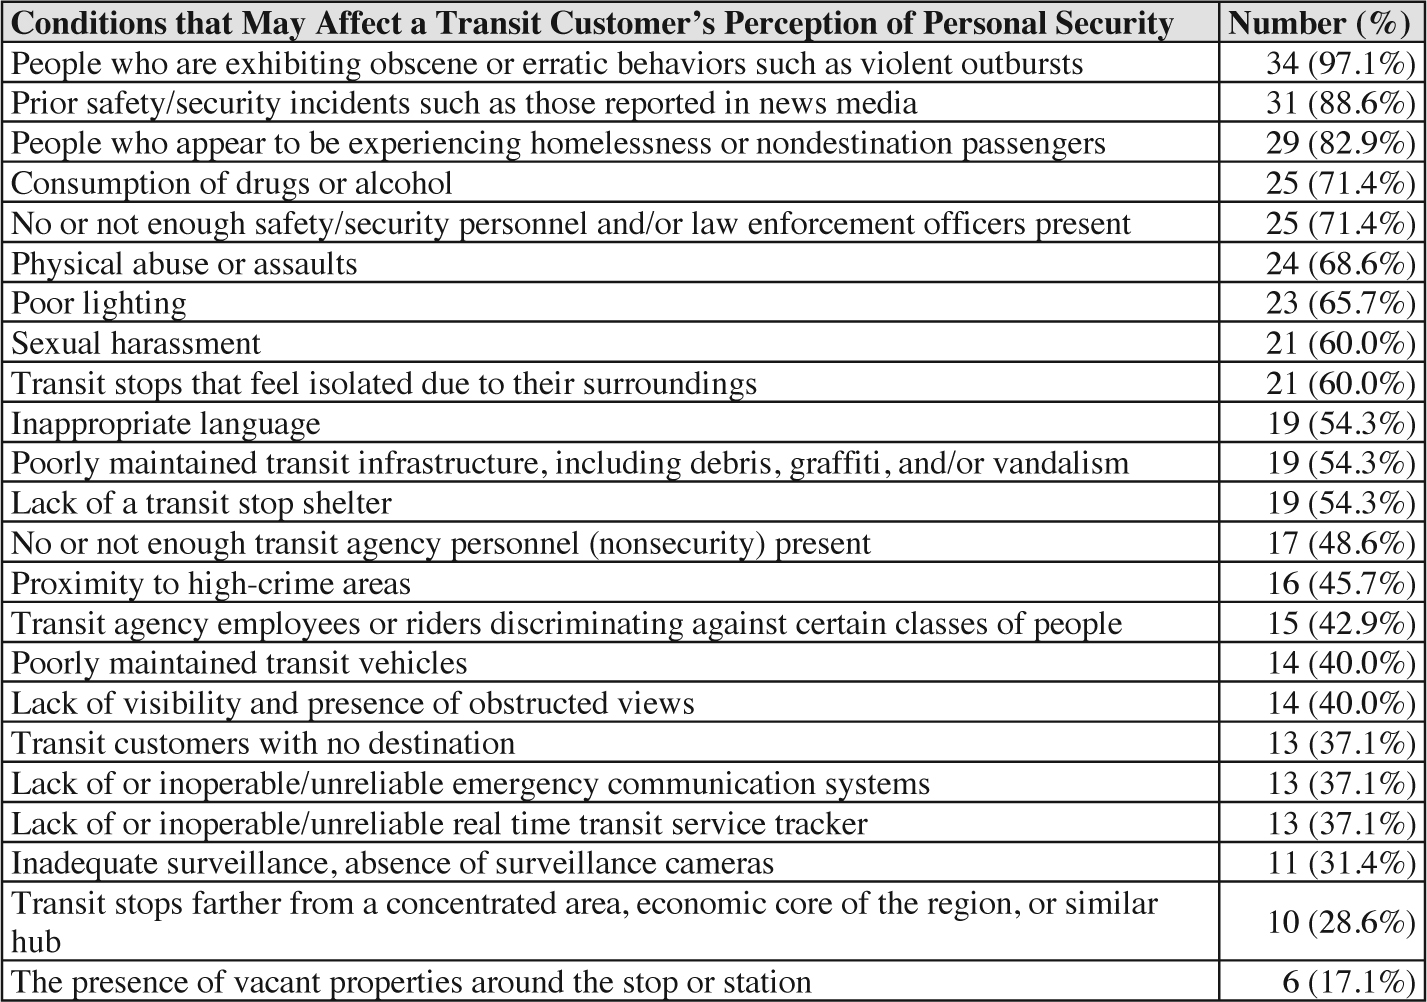
Understanding what transit agencies experience and recognize as conditions that affect a transit customerʼs perception of personal security is one of the main goals of this synthesis. Table 2 shows that many factors affect the perception of security. The condition selected most often from the list was people who are exhibiting obscene or erratic behaviors such as violent outbursts, with 97% of the respondents selecting this option. People with mental health concerns are often misunderstood and may seem threatening to other passengers.
The second most selected condition noted by 89% of respondents was prior safety/security incidents such as those reported in news media. This is a key finding as transit agencies work to improve safety perception. Learning of an incident from the news or from a family member or friend directly impacts passengersʼ perception and is challenging to overcome once that perception exists. There may be very few incidents, but one widely publicized event can give the impression that riding transit is unsafe.
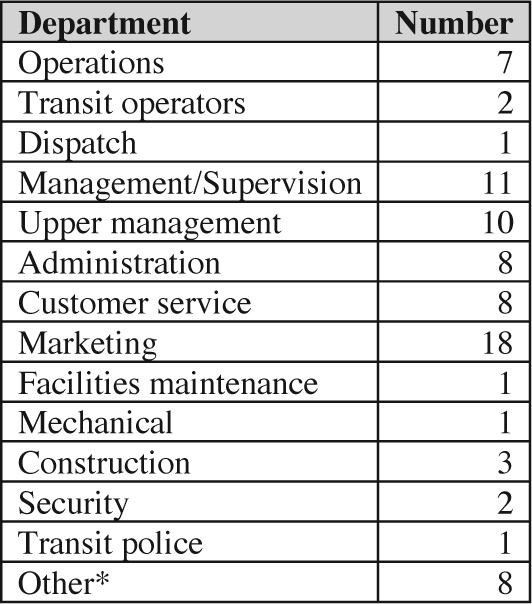
*Other answers were: communications, including crisis communications; media relations; customer experience and community relations; and planning.
Long Description.
The column headers of the table are Department and Number. Row 1: Operations: 7. Row 2: Transit operators: 2. Row 3: Dispatch: 1. Row 4: Management/Supervision: 11. Row 5: Upper management: 10. Row 6: Administration: 8. Row 7: Customer service: 8. Row 8: Marketing: 18. Row 9: Facilities maintenance: 1. Row 10: Mechanical: 1. Row 11: Construction: 3. Row 12: Security: 2. Row 13: Transit police: 1. Row 14: Other*: 8.
Long Description.
The column headers of the table are Conditions that May Affect a Transit Customer’s Perception of Personal Security, and Number (percent). The data given in the table row-wise are as follows: Row 1: People who are exhibiting obscene or erratic behaviors such as violent outbursts: 34 (97.1 percent). Row 2: Prior safety or security incidents such as those reported in news media: 31 (88.6 percent). Row 3: People who appear to be experiencing homelessness or nondestination passengers: 29 (82.9 percent). Row 4: Consumption of drugs or alcohol: 25 (71.4 percent). Row 5: No or not enough safety or security personnel and or law enforcement officers present: 25 (71.4 percent). Row 6: Physical abuse or assaults: 24 (68.6 percent). Row 7: Poor lighting: 23 (65.7 percent). Row 8: Sexual harassment: 21 (60.0 percent). Row 9: Transit stops that feel isolated due to their surroundings: 21 (60.0 percent). Row 10: Inappropriate language: 19 (54.3 percent). Row 11: Poorly maintained transit infrastructure, including debris, graffiti, and or vandalism: 19 (54.3 percent). Row 12: Lack of a transit stop shelter: 19 (54.3 percent). Row 13: No or not enough transit agency personnel (nonsecurity) present: 17 (48.6 percent). Row 14: Proximity to high-crime areas: 16 (45.7 percent). Row 15: Transit agency employees or riders discriminating against certain classes of people: 15 (42.9 percent). Row 16: Poorly maintained transit vehicles: 14 (40.0 percent). Row 17: Lack of visibility and presence of obstructed views: 14 (40.0 percent). Row 18: Transit customers with no destination: 13 (37.1 percent). Row 19: Lack of or inoperable or unreliable emergency communication systems: 13 (37.1 percent). Row 20: Lack of or inoperable or unreliable real-time transit service tracker: 13 (37.1 percent). Row 21: Inadequate surveillance, absence of surveillance cameras: 11 (31.4 percent). Row 22: Transit stops farther from a concentrated area, economic core of the region, or similar hub: 10 (28.6 percent). Row 23: The presence of vacant properties around the stop or station: 6 (17.1 percent).
The third ranked condition was people who appear to be experiencing homelessness or nondestination passengers. Urban centers mainly but smaller cities too have issues with affordability, high rents and property values, and unemployment, which have likely resulted in an increase in the number of people experiencing homelessness.
Other conditions reported by participants included:
- lack of cell phone chargers (young people fear their phones dying and feel less safe if that happens)
- too much police presence (people think something awful just happened)
- presence of used needles
- lack of control over admitting nonpaying transit riders, and lack of enforcement of fares and other train rules (no loud music, smoking, sleeping on trains, etc.)
- landscaping that does not allow a view of all areas
- houseless populations congregating near transit transfer centers and bus stops
Level of Concern at Transit Agency
A follow-up question was asked about how much of a concern these conditions are at their transit agency. A high percentage of respondents indicated that the following circumstances are extremely concerning at their agency (see Table 3):
- physical abuse or assaults (56.5%)
- sexual harassment (42.9%)
- no or not enough safety/security personnel and/or law enforcement officers present (36.0%)
- transit agency employees or riders discriminating against certain classes of people (33.4%)

Long Description.
The column headers of the table are Condition (Number) and Level of Concern (percent). The second column has sub-columns: Not a Concern at All, Slightly Concerning, Somewhat Concerning, Very Concerning, and Extremely Concerning. The data given in the table row-wise are as follows: Row 1: People exhibiting obscene or erratic behaviors such as violent outbursts (N equals 33): NIL; 15.1; 36.4; 30.4; 18.2. Row 2: Prior safety or security incidents such as those reported in news media (N equals 30): 3.3; 10.0; 40.0; 30.0; 19.5. Row 3: People who appear to be experiencing homelessness or nondestination passengers (N equals 29): 3.5; 3.5; 41.4; 34.4; 17.3. Row 4: Consumption of drugs or alcohol (N equals 25): NIL; 20.0; 28.0; 32.0; 20.0. Row 5: No or not enough safety or security personnel and or law enforcement officers present (N equals 25): 8.0; 12.0; 8.0; 36.0; 36.0. Row 6: Physical abuse or assaults (N equals 23): 8.7; 17.4; 8.7; 8.7; 56.5. Row 7: Poor lighting (N equals 22): 18.1; NIL; 27.3; 36.4; 18.2. Row 8: Sexual harassment (N equals 21): 4.8; 9.5; 28.6; 14.3; 42.9. Row 9: Transit stops that feel isolated due to their surroundings (N equals 20): 15.0; 15.0; 35.0; 20.0; 15.0. Row 10: Inappropriate language (N equals 19): 10.5; 15.8; 36.9; 26.3; 10.6. Row 11: Poorly maintained transit infrastructure, including debris, graffiti, and or vandalism (N equals 19): 15.8; 21.0; 15.8; 36.9; 10.6. Row 12: No or not enough transit agency personnel (nonsecurity) present (N equals 19): 11.8; 6.0; 17.1; 41.5; 23.7. Row 13: Lack of a transit stop shelter (N equals 18): 11.1; 16.7; 27.8; 33.3; 11.1. Row 14: Proximity to high-crime areas (N equals 15): NIL; 26.7; 40.0; 20.0; 13.3. Row 15: Transit agency employees or riders discriminating against certain classes of people (N equals 15): 26.7; 6.6; 20.0; 13.3; 33.4. Row 16: Poorly maintained transit vehicles (N equals 14): 14.3; 35.8; NIL; 21.5; 28.6. Row 17: Lack of visibility and presence of obstructed views (N equals 14): 21.5; 14.3; 42.9; 7.2; 14.3. Row 18: Transit customers with no destination (N equals 24): NIL; 26.2; 43.6; 17.4; 12.9. Row 19: Lack of or inoperable or unreliable emergency communication systems (N equals 13): 23.1; 7.7; 30.8; 23.1; 15.4. Row 20: Lack of or inoperable or unreliable real-time transit service tracker (N equals 12): 16.7; 33.4; 25.0; 25.0; NIL. Row 21: Inadequate surveillance, absence of surveillance cameras (N equals 11): 9.1; 36.4; NIL; 27.3; 27.3. Row 22: Transit stops farther from a concentrated area, economic core of the region, or similar hub (N equals 11): 9.1; 27.3; 27.3; 27.3; 9.1. Row 23: The presence of vacant properties around the stop or station (N equals 6): 16.7; NIL; 33.3; 33.3; 16.7.
A rating of very concerning was noted by at least one-third of those who identified the following as conditions affecting customer perception of security:
- no or not enough transit agency personnel (nonsecurity) present (41.5%)
- poorly maintained transit infrastructure, including debris, graffiti, and/or vandalism (36.9%)
- poor lighting (36.4%)
- no or not enough safety/security personnel and/or law enforcement officers present (36.0%)
- people who appear to be experiencing homelessness or nondestination passengers (34.4%)
- the presence of vacant properties around the stop or station (33.3%)
- lack of a transit stop shelter (33.3%)
When looking at the top three levels of concern (somewhat concerning to extremely concerning), some interesting factors rise to the top for transit agencies. The following conditions were given a higher level of concern by 80% of transit agency respondents:
- people who appear to be experiencing homelessness or nondestination passengers
- prior safety/security incidents such as those reported in news media
- sexual harassment
- people who are exhibiting obscene or erratic behaviors such as violent outbursts
- the presence of vacant properties around the stop or station
- no or not enough transit agency personnel (nonsecurity) present
- poor lighting
- consumption of drugs or alcohol
- no or not enough safety/security personnel and/or law enforcement officers present
Methods Used to Gather Passenger Feedback
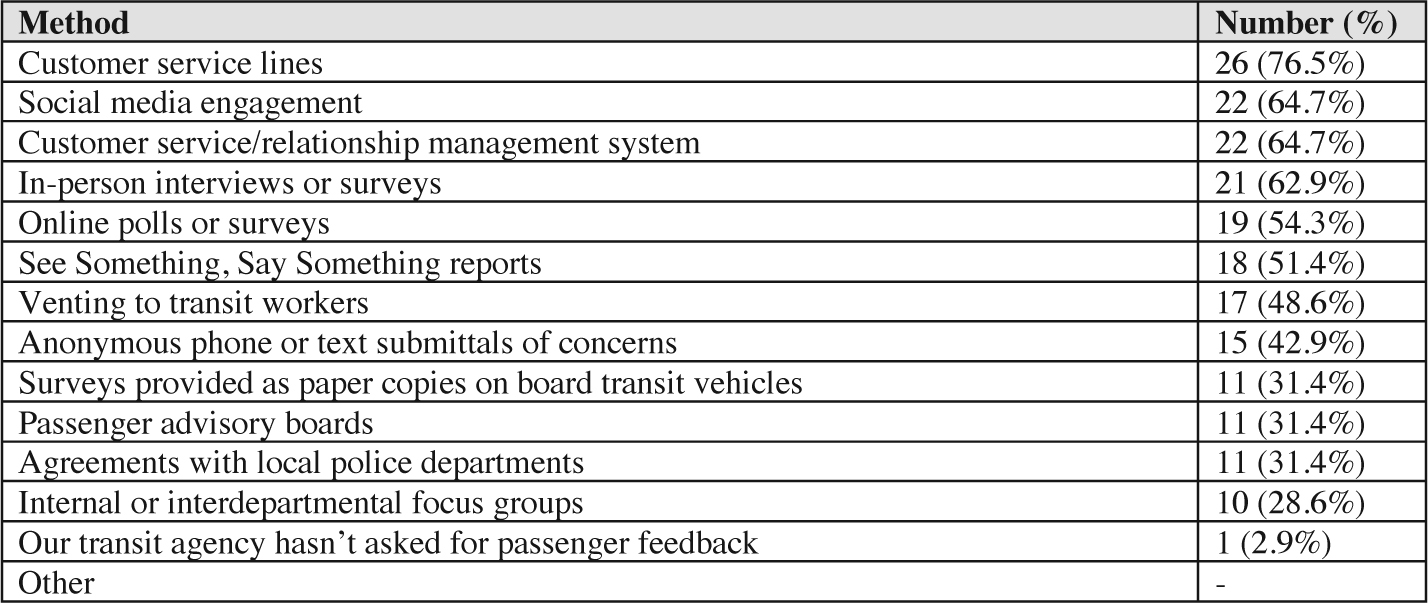
The most frequently used method of gathering feedback from customers, as reported by survey participants, was customer service lines, followed by social media engagement, customer service/relationship management systems, and in-person interviews or surveys (see Table 4). It appears from the responses that about a quarter of the agencies do not have customer service lines. It may be, however, that these agencies have customer service lines but do not use them to gather feedback on the perception of security.
Long Description.
The column headers of the table are Method and Number (percent). The data given in the table row-wise are as follows: Row 1: Customer service lines: 26 (76.5 percent). Row 2: Social media engagement: 22 (64.7 percent). Row 3: Customer service or relationship management system: 22 (64.7 percent). Row 4: In-person interviews or surveys: 21 (62.9 percent). Row 5: Online polls or surveys: 19 (54.3 percent). Row 6: See Something, Say Something reports: 18 (51.4 percent). Row 7: Venting to transit workers: 17 (48.6 percent). Row 8: Anonymous phone or text submittals of concerns: 15 (42.9 percent). Row 9: Surveys provided as paper copies on board transit vehicles: 11 (31.4 percent). Row 10: Passenger advisory boards: 11 (31.4 percent). Row 11: Agreements with local police departments: 11 (31.4 percent). Row 12: Internal or interdepartmental focus groups: 10 (28.6 percent). Row 13: Our transit agency hasn’t asked for passenger feedback: 1 (2.9 percent). Row 14: Other: NIL.
Long Description.
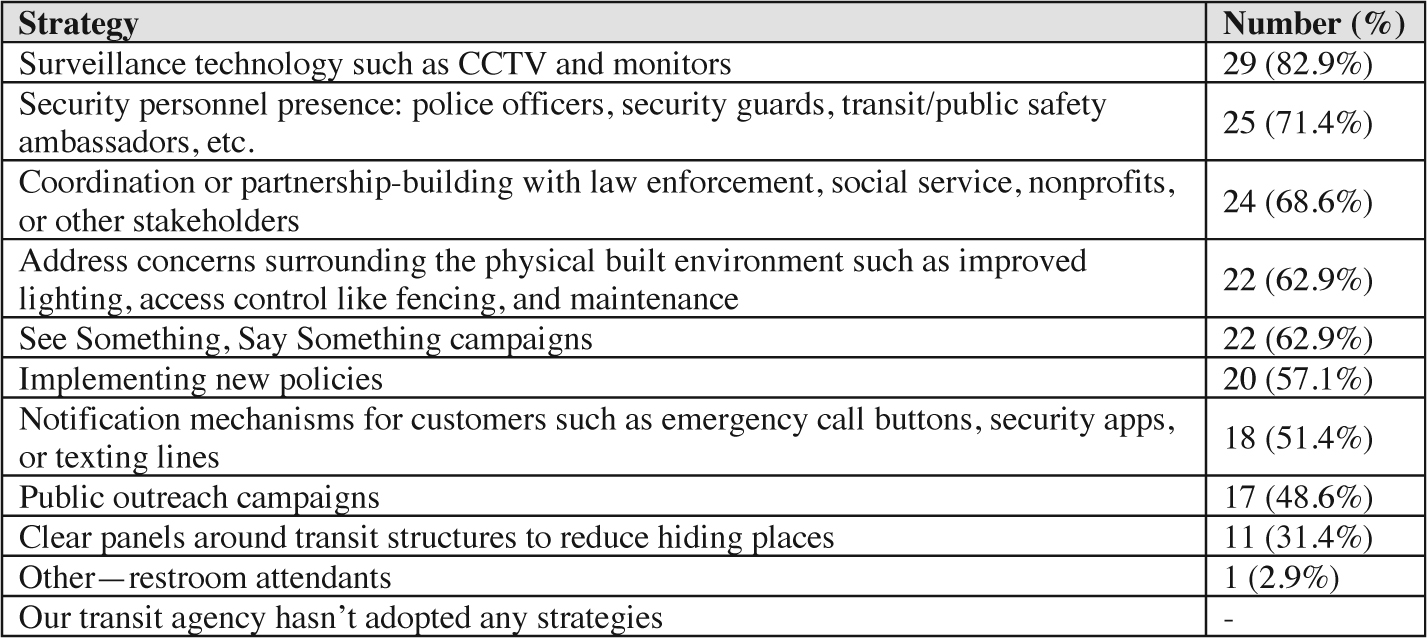
The column headers of the table are Strategy and Number (percent). The data given in the table row-wise are as follows: Row 1: Surveillance technology such as CCTV and monitors: 29 (82.9 percent). Row 2: Security personnel presence: police officers, security guards, transit or public safety ambassadors, etc.: 25 (71.4 percent). Row 3: Coordination or partnership-building with law enforcement, social service, nonprofits, or other stakeholders: 24 (68.6 percent). Row 4: Address concerns surrounding the physical built environment, such as improved lighting, access control like fencing, and maintenance: 22 (62.9 percent). Row 5: See Something, Say Something campaigns: 22 (62.9 percent). Row 6: Implementing new policies: 20 (57.1 percent). Row 7: Notification mechanisms for customers such as emergency call buttons, security apps, or texting lines: 18 (51.4 percent). Row 8: Public outreach campaigns: 17 (48.6 percent). Row 9: Clear panels around transit structures to reduce hiding places: 11 (31.4 percent). Row 10: Other—restroom attendants: 1 (2.9 percent). Row 11: Our transit agency hasn’t adopted any strategies: NIL
Strategies Adopted at Transit Agencies to Address Perception
Almost all the agencies indicated that they use surveillance technology to improve customer perceptions of security. Other strategies used by at least two-thirds of the agencies surveyed include security personnel presence and coordination and partnership-building (see Table 5).
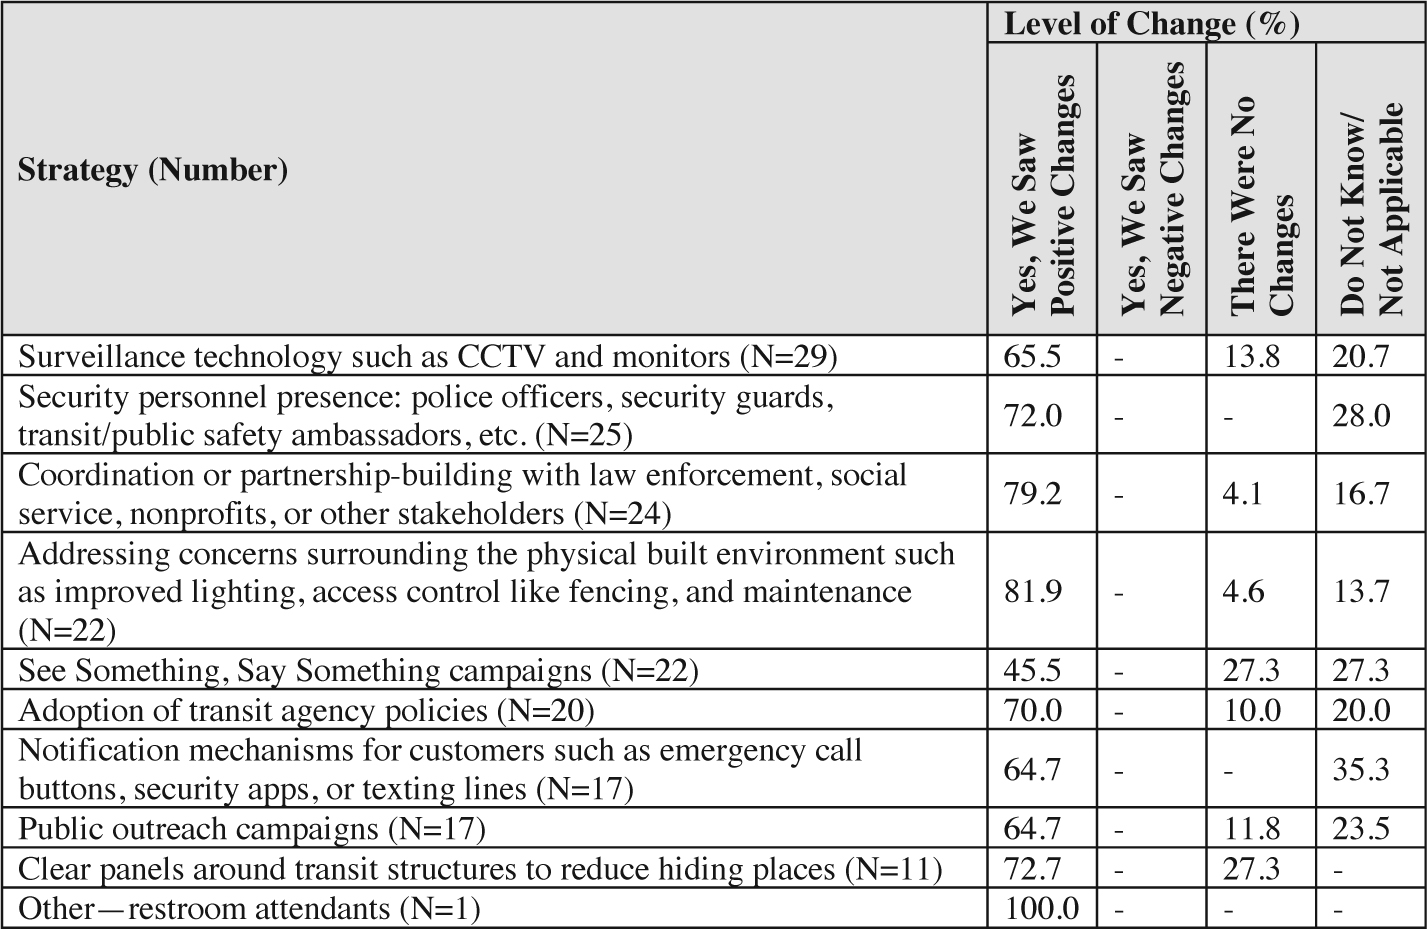
Changes Noted After Implementing Strategies
Agency staff noted that positive changes were seen after implementing some of the strategies (see Table 6). The strategies for which the highest number of survey participants noted positive changes were:
- Security personnel presence, including police officers, security guards, transit/public safety ambassadors, etc.
Long Description.
The column headers of the table are Strategy (Number) and Level of Change (percent). The second column has sub-columns: Yes, We Saw Positive Changes, Yes, We Saw Negative Changes, There Were No Changes, Do Not Know, or Not Applicable. The data given in the table row-wise are as follows: Row 1: Surveillance technology such as CCTV and monitors (N equals 29): 65.5; NIL; 13.8; 20.7. Row 2: Security personnel presence: police officers, security guards, transit or public safety ambassadors, etc. (N equals 25): 72.0; NIL; NIL; 28.0. Row 3: Coordination or partnership-building with law enforcement, social service, nonprofits, or other stakeholders (N equals 24): 79.2; NIL; 4.1; 16.7. Row 4: Addressing concerns surrounding the physical built environment, such as improved lighting, access control like fencing, and maintenance (N equals 22): 81.9; NIL; 4.6; 13.7. Row 5: See Something, Say Something campaigns (N equals 22): 45.5; NIL; 27.3; 27.3. Row 6: Adoption of transit agency policies (N equals 20): 70.0; NIL; 10.0; 20.0. Row 7: Notification mechanisms for customers such as emergency call buttons, security apps, or texting lines (N equals 17): 64.7; NIL; NIL; 35.3. Row 8: Public outreach campaigns (N equals 17): 64.7; NIL; 11.8; 23.5. Row 9: Clear panels around transit structures to reduce hiding places (N equals 11): 72.7; NIL; 27.3; NIL. Row 10: Other—restroom attendants (N equals 1): 100.0; NIL; NIL; NIL.
- Coordination or partnership-building with law enforcement, social service, nonprofits, or other stakeholders
- Addressing concerns surrounding the physical built environment such as improved lighting, access control like fencing, and maintenance
- Clear panels around transit structures to reduce hiding places
The strategies with the highest percentage of respondents saying they saw no changes were See Something Say Something campaigns and the addition of clear panels around transit structures to reduce hiding places.
Security Configuration at Transit Agencies Represented
The existing security configurations at most of the transit agencies represented in the survey include using customer service agents, other transit staff members, and/or a police force (dedicated, local, or contracted) (see Figure 3). About 40% of respondents said they use ambassadors or in-house nonsworn security guards.
Other reported security configurations included:
- contracted security services, e.g., for security presence in transit centers
- social workers who work directly with police and respond with police to calls for service
- transit ambassador program (forthcoming in fiscal year 25)
- transit crisis counselor
- first-year medical students serving as health navigators and social service agencies partnering with the SCOPE team
Technological Solutions
A high percentage of respondents indicated that their transit agency uses video surveillance and real-time monitoring dashboards to track vehicles to address passenger perceptions of security (see Figure 4).
Other technological solutions reported by participants included:
- custom phone number (801-287-EYES) and text number (274-637) for safety and security concerns
- signage
- ArcGIS for SCOPEʼs outreach workers
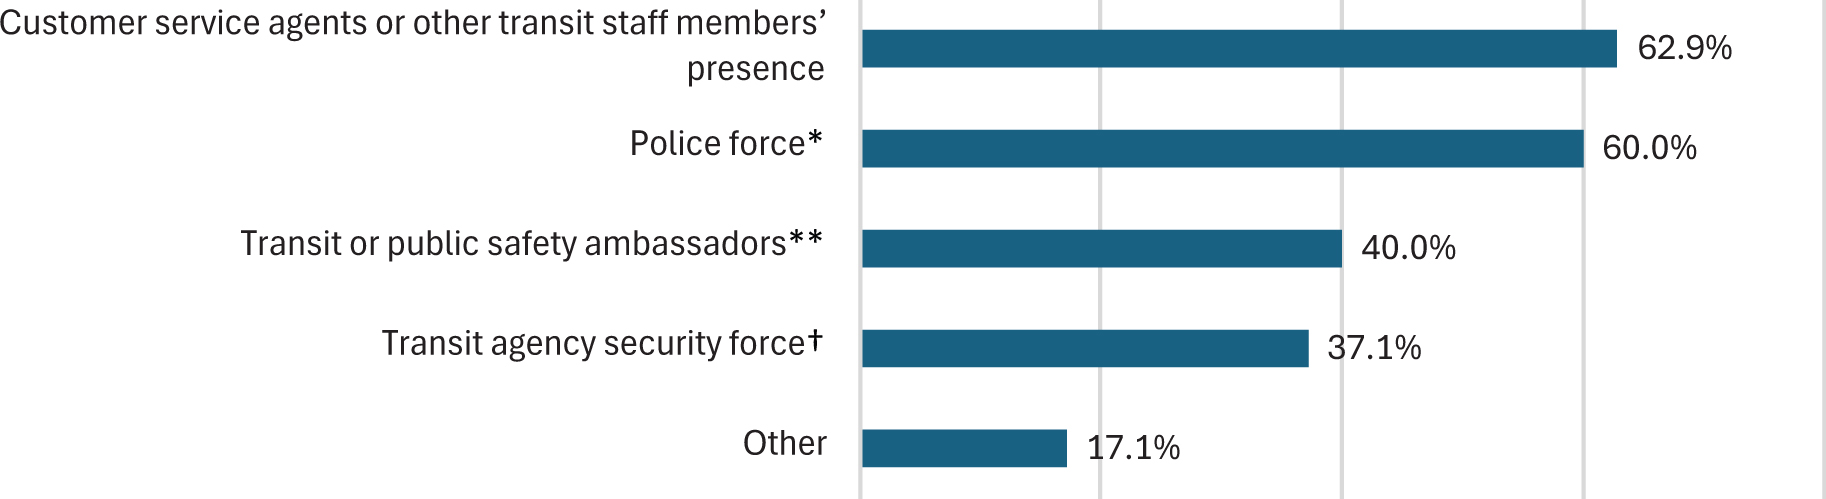
*including dedicated transit police force, local police, and contracted law enforcement
**transit agency staff wearing uniforms who donʼt carry firearms, who help riders, report crime and drug use to law enforcement, connect unhoused riders to crisis teams such as houseless support and mental health clinicians, and alert custodial staff about messes and litter
†in-house nonsworn security guards
Long Description.
The graph has no horizontal axis. The vertical axis consists of five bars with percentage values. The data given in the graph are as follows: Customer service agents or other transit staff members' presence: 62.9. Police force, including dedicated transit police force, local police, and contracted law enforcement: 60.0. Transit or public safety ambassadors (transit agency staff wearing uniforms who don’t carry firearms, who help riders and report crime and drug use to law enforcement, connect unhoused: 40.0. Transit agency security force: In-house, non-sworn security guards: 37.1. Other: 17.1.

Long Description.
The graph has no horizontal axis. The vertical axis consists of five bars with percentage values. The data given in the graph are as follows: Video surveillance and monitoring: 82.9. Real-time monitoring dashboards to track vehicles: 80.0. Mobile Apps for transit customers to report security incidents: 40.0. Wearable communication devices for staff such as body cameras, smartwatches or specialized communication gear: 25.7. Other: 8.6.
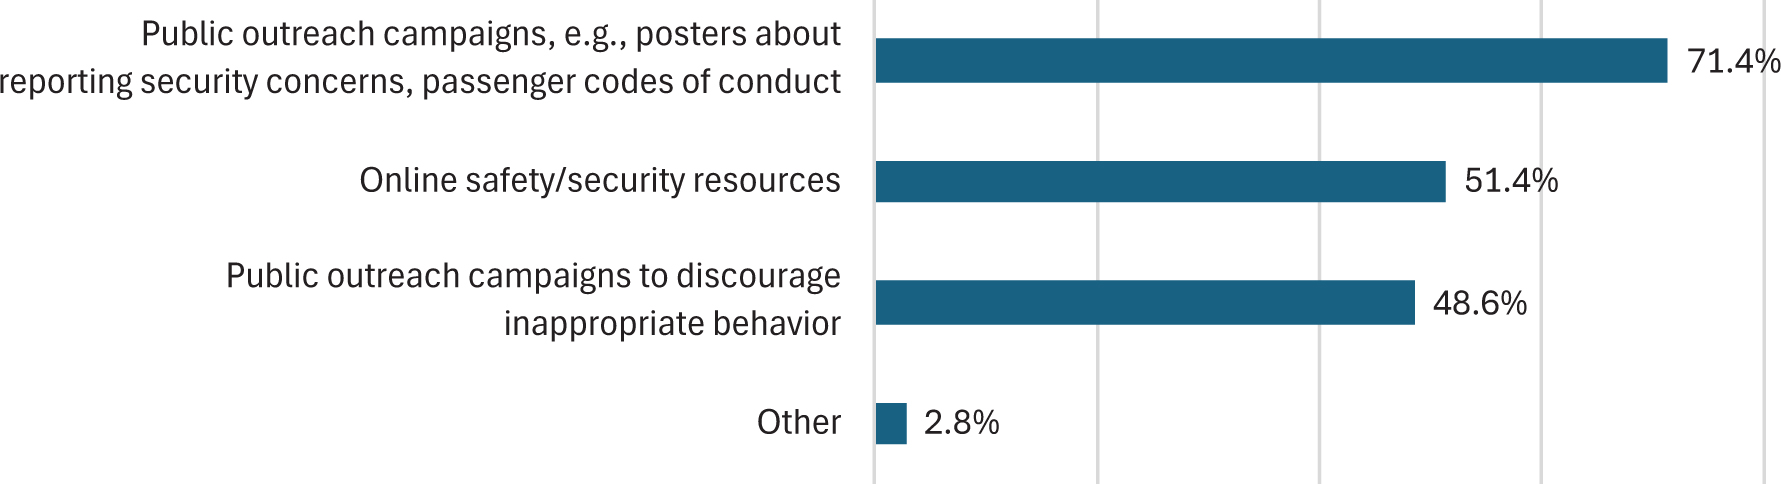
Public Information and Outreach Programs
Most respondents said that their agency has public outreach campaigns, and just over half of respondents said that their agency has resources online about safety/security (see Figure 5).
Other public information and outreach efforts reported by participants included positive public relations interviews promoting riders and their experiences.
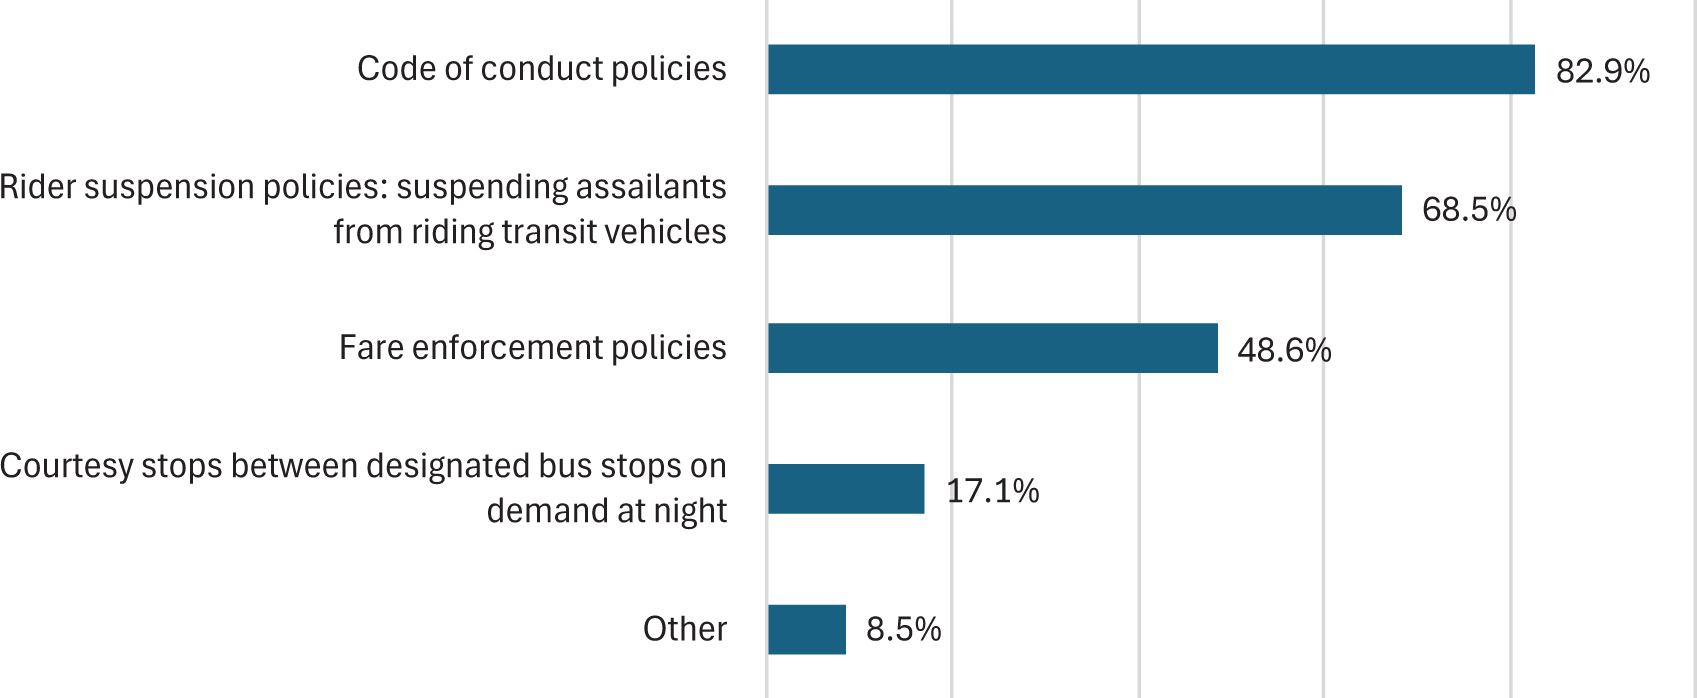
Policies Adopted by Agencies
Over 80% of respondents said their agency has code-of-conduct policies, and almost 70% of respondents said their agency has rider suspension policies (see Figure 6). Just under half of the agencies have fare enforcement policies.
Other reported policies for improving customersʼ perceptions of safety included:
- Safe transit policy, which is a resolution declaring the San Francisco BART Districtʼs commitment to be a safe, secure, inviting, inclusive transit system and affirming a dedication to the values of dignity, respect, and inclusivity for all in the community, regardless of ethnic or national origin, gender, gender identity, race, religious affiliation, sexual orientation or immigration status (https://www.bart.gov/sites/default/files/docs/Safe_Transit_Policy_2017.pdf)
- Supervisors trained to respond to and de-escalate situations who can also transport nonviolent riders or call law enforcement to respond
- Driver reporting program
- Safety and security anonymous reporting program
Long Description.
The graph has no horizontal axis. The vertical axis consists of five bars with percentage values. The data given in the graph are as follows: Public outreach campaigns, E G posters about reporting security concerns, passenger codes of conduct: 71.4. Online safety or security resources: 51.4. Public outreach campaigns to discourage inappropriate behavior: 48.6. Other: 2.8.
Long Description.
The graph has no horizontal axis. The vertical axis consists of five bars with percentage values. The data given in the graph are as follows: Code of conduct policies: 82.9. Rider suspension policies: suspending assailants from riding transit vehicles: 68.5. Fare enforcement policies: 48.6. Courtesy stops between designated bus stops on demand at night: 17.1. Other: 8.5.
Where Security Concerns Exist
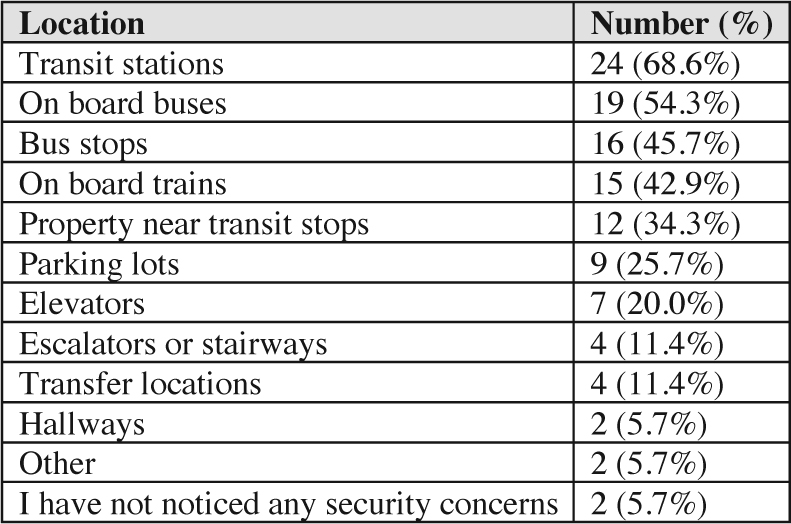
Transit stations were mentioned most frequently by respondents when asked about specific locations where security concerns exist. Buses and bus stops were the second and third most selected locations, respectively (see Table 7). Transit stations are where people are more likely to hang out. Although there is an expectation that they are waiting for a bus or a train, sometimes they are just loitering.
Other reported locations for security concerns included ferry terminal parking lots (particularly for car vandalism). One participant noted that select transit stations in specific locations are of concern, but others are not.
Efforts to Address Security Concerns for Specific Communities
Almost one-third of transit agencies represented in the survey have undertaken special efforts to address security concerns for specific communities (see Figure 7).
Specific Communities that Agencies are Working to Help
The top three selected communities that agencies are making special efforts for were people with visual, hearing, and ambulatory disabilities (22.9%), aging population (20.0%), and people of color (20.0%) (see Table 8). Note that the number of agencies addressing specific communities represents a small sample size.
Long Description.
The column headers of the table are Location and Number (percent). The data given in the table row-wise are as follows: Row 1: Transit stations: 24 (68.6 percent). Row 2: On board buses: 19 (54.3 percent). Row 3: Bus stops: 16 (45.7 percent). Row 4: On board trains: 15 (42.9 percent). Row 5: Property near transit stops: 12 (34.3 percent). Row 6: Parking lots: 9 (25.7 percent). Row 7: Elevators: 7 (20.0 percent). Row 8: Escalators or stairways: 4 (11.4 percent). Row 9: Transfer locations: 4 (11.4 percent). Row 10: Hallways: 2 (5.7 percent). Row 11: Other: 2 (5.7 percent). Row 12: I have not noticed any security concerns: 2 (5.7 percent).

Long Description.
The chart is titled 'Any special effort to address security concerns for specific communities of people?' The pie chart is divided into three sections with data: Yes: 30 percent. No: 37 percent. I don't know: 33 percent.
Partnering with Other Agencies
Transit agencies partner with various organizations to address and prevent security concerns and improve the perception of security. More than half the participating agencies (68.6%) partner with local police/sheriff department (see Table 9). Most agencies have contracts with local police departments, while one mentioned they only have informal agreements. Participants also noted that they partner with local police for law enforcement and employeesʼ safety and de-escalation training. One participant mentioned that his agency has a dedicated assistant district attorney working on cases involving the transit system.
The second and third most frequently reported partnerships included services for people experiencing homelessness, including homeless advocacy groups and mental health service centers. Seven participants partnered with nonprofit agencies on violence prevention and collaborated with programs like Not One More Girl, Letʼs Talk About Us, and Transit Host.
Other transit agency partners reported by respondents included:
- girl-serving organizations
- cultural strategists and artists
- Salem for Refugees

Long Description.
The column headers of the table are Community and Number (percent). The data given in the table row-wise are as follows: Row 1: Visual, hearing, and ambulatory disabilities: 8 (22.9 percent). Row 2: Aging population: 7 (20.0 percent). Row 3: People of color: 7 (20.0 percent). Row 4: Low income: 6 (17.1 percent). Row 5: Immigrants: 5 (14.3 percent). Row 6: Cognitive disabilities: 5 (14.3 percent). Row 7: Lesbian, gay, bisexual: 5 (14.3 percent). Row 8: Transgender: 5 (14.3 percent). Row 9: Homeless: 5 (14.3 percent). Row 10: Women: 4 (11.4 percent). Row 11: Particular religions: 1 (2.9 percent). Row 12: Other—substance abuse or addiction issues; mental health issues: 1 (2.9 percent).

Long Description.
The column headers of the table are Partnered Agencies and Number (percent). The data given in the table row-wise are as follows: Row 1: Local police or sheriff department: 24 (68.6 percent). Row 2: Services for people experiencing homelessness, including homeless advocacy groups: 17 (48.6 percent). Row 3: Mental health service centers: 16 (45.7 percent). Row 4: Municipal or county social service agencies: 15 (42.9 percent). Row 5: Homeless advocacy groups: 13 (37.1 percent). Row 6: Local government agencies: 12 (34.3 percent). Row 7: Nonprofit agencies on violence prevention: 7 (20.0 percent). Row 8: Other: 6 (17.1 percent). Row 9: Victim service centers: 3 (8.6 percent).
- United States Coast Guard
- federal law enforcement
Partnership Descriptions
When asked to provide details about partnerships, several agency representatives provided the following information:
- The Not One More Girl initiative (bart.gov/NotOneMoreGirl) is a Black, indigenous, and people of color youth-led initiative in partnership with community-based organizations and BART. BART has a campaign specific to domestic violence, Letʼs Talk About Us, in partnership with the Asian Womenʼs Shelter and a renowned artist (https://www.bart.gov/guide/safety/domestic-violence).
- Contract in place with Long Beach Police Department
- Generally, partnerships are an informal agreement between both agencies. We sign an annual agreement with local law enforcement to have additional patrols throughout the business district. We also have agreements for human trafficking awareness to be taught to all new employees by our county advocacy group. In addition, we partner with assisted living facilities to teach new riders how to navigate our transportation system.
- If there is a safety issue on board a vessel during a crossing that canʼt be handled by captain or crews, we might communicate with Coast Guard personnel.
- LA Metro contracts with local law enforcement such as the Los Angeles Police Department and Los Angeles Sheriffʼs Department to monitor and respond to incidents on the bus or train system. Additionally, LA Metro has its own agency officers. Lastly, LA Metro has launched two programs to help curb crime on the system: (1) the Ambassador Program, which is LA Metroʼs customer service program that also serves as our “eyes and ears” and (2) a partnership with local homeless service providers to address the high number of homeless individuals who may need these services and also ride the system.
- On-call memoranda of understanding for local police support for our code compliance officers
- Our Transit Host program operates through partnerships with Cherriots and Garten, which are organizations that support individuals with disabilities in their effort to contribute to the community through employment. The two transit hosts are located at the Downtown Transit Center to answer questions, assist in transferring, and provide a welcoming environment. The program has had 35,238 interactions in 3 years. The Transit Host program is for all people but focuses on older adults and individuals with disabilities to ensure that public transportation is accessible for all populations in the community. Salem is a welcoming place for refugees, and we are proud of the work we have been doing with Salem for Refugees and the Welcoming Our New Neighbors program. We provide travel training to families and individuals who resettle in Salem from more than a dozen countries. It is an incredible privilege and humbling experience to learn from them as they establish their lives in the community and gain access to shelter, jobs, education, health care, social services, and family and friends.
- Our Transit Police Division is a law enforcement task force overseen by the Multnomah County Sheriffʼs Office. We also have a dedicated assistant district attorney working on cases that involve the transit system. Our Safety Response Team is effectively a team of ambassadors, but they specialize in connecting with people who may need social services. They can connect these people with county and nonprofit resources should they choose to pursue them. We continuously work with local jurisdictional partners to help connect people to resources and address societal issues that can spill over into the transit system.
- The Regional Transportation District (RTD) holds regular meetings with municipalities, nonprofit organizations, and service agencies to ensure there is alignment with and understanding about collaborative efforts. During meetings, we provide updates and develop plans for addressing security-related issues in a holistic manner.
- Sun Metro is a department of the City of El Paso, TX, just like the police and fire departments. We use these departments to provide employee training on de-escalation techniques, first aid, Narcan administration, and TSA first observer training. Police also train for K-9, bomb squad, and active shooter/hostage situations and stage their fleet vehicles at our facilities so they are prepared to respond. First responders are trained on shutting down the overhead catenary system for our streetcar and on our fleetʼs compressed natural gas fueling systemʼs safety requirements.
- We partner closely with an organization we call anytime we encounter an individual who has expressed a desire or need for assistance. The organizationʼs office is just two blocks from our transit center, so we often refer individuals there. Many organizations are invited to participate as guest speakers during our monthly safety meetings with frontline staff.
- We partner with a mental health group that provides drug and alcohol support for those that have substance abuse issues and need resources.
- We use local law enforcement as needed.
- We work with other county agencies on the homelessness issue and have homeless outreach teams. We also work with the Los Angeles Sheriffʼs Department for law enforcement.
- We assign officer liaisons to federal task forces for the Federal Bureau of Investigation; the Bureau of Alcohol, Tobacco, Firearms, and Explosives; and the Drug Enforcement Administration.
Communication Methods
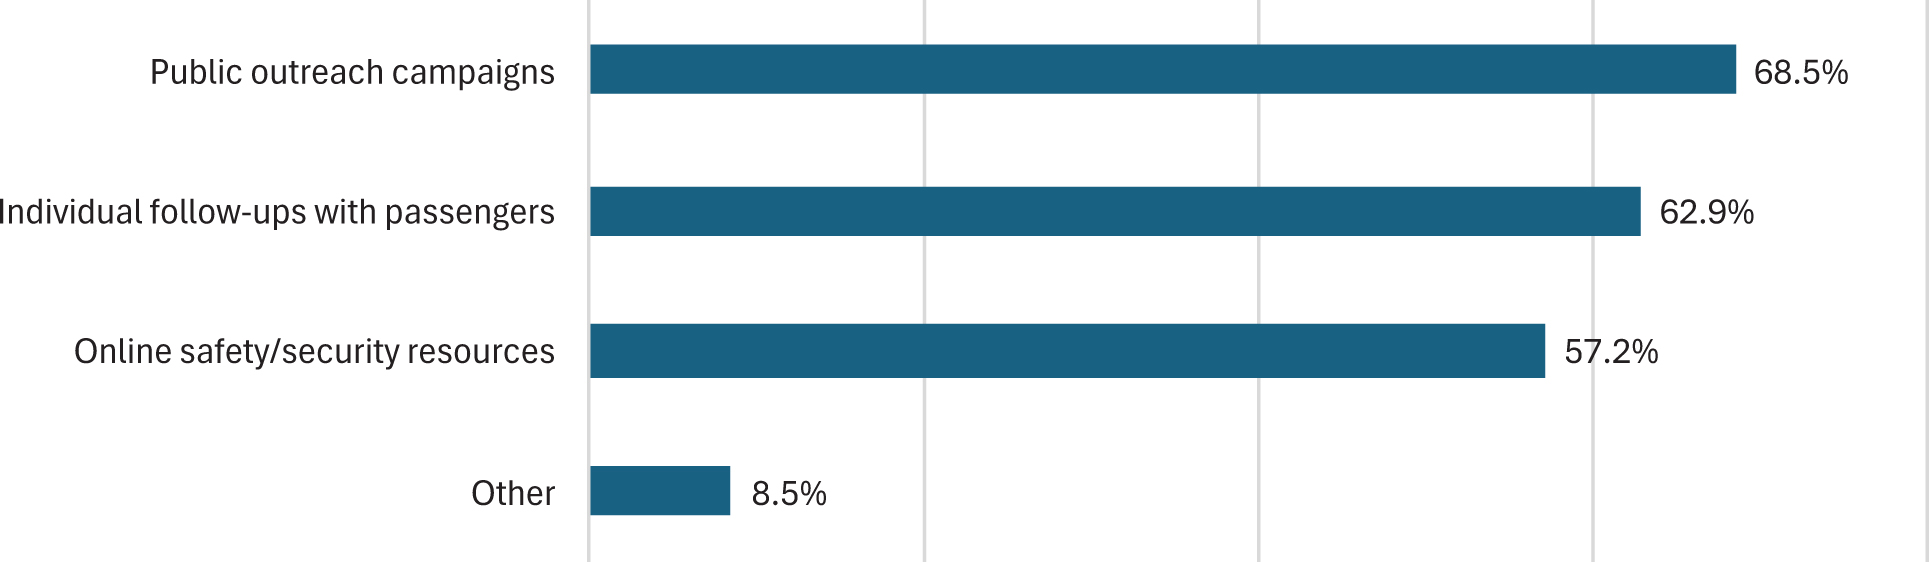
Regarding communication methods to improve public perceptions of personal security, most participants (68.5%) selected public outreach campaigns from the list. Secondary communication methods included individual follow-ups with passengers and online safety/security resources (see Figure 8).
Long Description.
The graph is titled 'Communication Methods to Improve the Public Perception of Personal Security' and has no horizontal axis. The vertical axis consists of four bars with values in percentage. The data given in the graph are as follows: Public outreach campaigns: 68.5. Individual follow-ups with passengers: 62.9. Online safety or security resources: 57.2. Other: 8.5.
Some agencies mentioned other communication methods, such as in-person community presentations; pop-up events; and staffing booths at marketplaces, festivals, and community events. One respondent mentioned the use of social media, attending community engagement events, and getting communication out through media outlets.
Strategy Differences from 10 Years Ago
Lastly, transit agencies reported how current strategies related to advanced technology, increasing security personnel, public outreach campaigns, and partnerships with other agencies differ from the strategies used 10 years ago. Advanced technologies for tracking buses, better communication between operators and riders (such as new smartphone apps), monitoring and collecting data, and analyzing specific areas were most frequently reported in the survey. Specifically, many agencies have apps that allow customers to report personal safety incidents directly and have back-and-forth dialogue with police department dispatch.
Several agencies mentioned having a greater security presence in the last 10 years. Two agencies noted that they now have transit ambassadors or specialists to better connect transit users to resources and report safety concerns. They also improved their police training to better intervene in and de-escalate situations.
Regarding public outreach and campaign strategy differences, some agencies provided detailed information. In general, agencies reported more public outreach to specific groups, including people experiencing homelessness and mental health issues. One agency mentioned bystander intervention training via a video on their website for the public. Details provided by survey participants include:
- Advancements in technology allow bus tracking and better communication between operators, riders, and management to track incidents and look for trends in specific areas or with equipment.
- Digital and app-based messaging; personalized travel training
- LA Metro Ambassador Program supports riders on LA Metro buses and trains and at stations by connecting them to resources and facilitating reporting maintenance and safety concerns. The program increases visibility of LA Metro staff at key locations.
- Homeless outreach teams
- Monitoring data regarding requests for law enforcement assistance
- RTD has introduced a smartphone application that allows customers to directly report personal safety- and security-related incidents. The app allows for dialogue between the police department dispatch and the customer. RTD also recently dispatched a team of employee ambassadors across the system to provide support for customers and report situations that may need to be addressed. RTD is transitioning previous resources from a third-party contracted security team to a sworn police force.
- We do more public outreach and use partnerships to advertise those partnerships. We collect survey data electronically and online and apply many different tactics for in-person collections.
- We have increased our security presence through contracted officers. Over the past 10 years, the number of officers in our Transit Police Division has decreased. We also introduced the Safety Response Team as part of our Reimagining Safety on Public Transportation initiative, which is a way of addressing issues that donʼt necessarily merit a police response.
- We now have bystander intervention training via a video on our website and we offer bystander intervention cards (https://www.bart.gov/guide/safety/gbv/intervention). Two wallet-size cards are available to riders to discreetly hand to people to signal they need help or support, or to notify someone being harassed that you are there to help and support them. These new bystander intervention cards are a concept developed by the youth design team, who expressed
- the need for options when asking for help or approaching a situation of potential harm. The cards include the slogans I Got You and You Got Me? with a list of actionable items riders can take to help a situation, from reporting the harassment to simply standing with someone. As young people are still trying to find their voices and figuring out how to navigate and decipher harassment, a physical card you can hand to someone is an effective tool to precipitate the shift from being a bystander to becoming an agent of change. The cards are available for pickup at each BART station agent booth, and ambassadors and crisis intervention specialists carry the cards and give them out when engaging riders. Weʼve seen a drop in reported incidents of sexual harassment, and based on surveys riders say they feel safer after learning about these tools (https://www.bart.gov/guide/safety/gbv/data).
- Weʼve increased service and lowered fares, which means more people are riding ferries, which in turn lowers instances of vandalism or rowdy behavior on board vessels.
- Different use-of-force policies are now in place, such as banning carotid restraints and choke holds, including using knee pressure on the neck, throat, or head. The use of force is required to be proportional to the seriousness of the subjectʼs offense. A duty to intervene exists if witnessing excessive force by another employee. De-escalation tactics are required when feasible (de-escalation training was previously provided but is now written into policy). A warning is required prior to the use of force.
- A Transit Ambassador Program and crisis intervention specialists have been in place for less than 2 years but have shown positive outcomes. They provide greater visibility of the system, deter crime, and provide outreach services for those in need. Additionally, the police department has become more diverse, allowing the community to see people who look like them.
- A virtual patrol center to support SEPTAʼs Police Department. Deployment of dedicated outreach teams to engage individuals experiencing homelessness and substance use disorders/mental health conditions. Partnerships with office of homeless services, mental health/homeless/harm reduction providers, and local universities.
Summary of Survey Results
Many different transit departments were represented in the survey, from upper management to marketing and customer service to operations and construction.
Respondents selected many of the factors or conditions that might impact a customerʼs perception of security. Over half the respondents selected 12 conditions from the list, with four having to do with the built environment and four having to do with the behavior of other passengers. One was about the physical appearance of people on or near transit vehicles or properties. A key finding and one that is difficult to address is the second most selected factor by agency staff. It involves learning about incidents reported in the media. The question of how agencies can influence riders when media reports come out with negative stories of assault or other crimes needs attention.
About half the respondents said that physical abuse or assaults and sexual harassment are extremely concerning at their agency. Over a third said that a lack of safety/security personnel and discrimination against certain classes of people are extremely concerning. The intent of this question was to understand if the agency experiences these security concerns; however, it appears the question was not clearly stated for respondents.
Agencies get information from the public mostly by way of their customer service lines, though several mentioned more technologically advanced methods. It is important to note that questions asking riders if they feel safe are not enough to understand the differences between safety and security. Is that person thinking they may be hit by a bus when walking or otherwise involved in
a bus crash, expecting to slip or fall when boarding or alighting, or concerned about the presence of someone who may harass or hurt them? The survey questions must be more detailed.
On the topic of technology, almost all agencies reported using surveillance cameras and monitors. A question that warrants follow-up is whether agencies label the cameras at stations to indicate people are being watched. There is debate about whether potential perpetrators are deterred by such cameras and notices; the other side being not to state that the area is being monitored so perpetrators can be caught committing the crime.
As for mitigation strategies, a high percentage of respondents named security presence, partnerships, and built environment changes as things that have worked for their agency.
Almost all agencies have public outreach campaigns and codes of conduct. About half the agencies have fare enforcement policies. In some cases, there is a fear of repercussion if an operator reports someone for fare evasion.
Stations and buses are where most of the agencies have security concerns. Transit stations can provide shelter from extreme heat or cold, but places where people loiter can become more susceptible to security incidents.
Partnerships are mostly with the local police department. Less than half the agencies said they partner with organizations offering services for people experiencing homelessness or mental health services.
Strategies have changed over the last decade. Aside from technology, the biggest change is about the approach to address the perception of security with more focus on social services and partnerships to address societal concerns.
Beyond the limitation of the small sample size of some of the answers, another limitation of the survey is that those who answered the survey were not able to answer all the questions, since the question topics crossed many different areas of security. Expecting transit agency staff to collect responses from different departments is burdensome.


