Stainless Steel Strands for Prestressed Concrete Bridge Elements (2025)
Chapter: 3 Results of the Experimental Program

CHAPTER 3
Results of the Experimental Program
3.1 Introduction
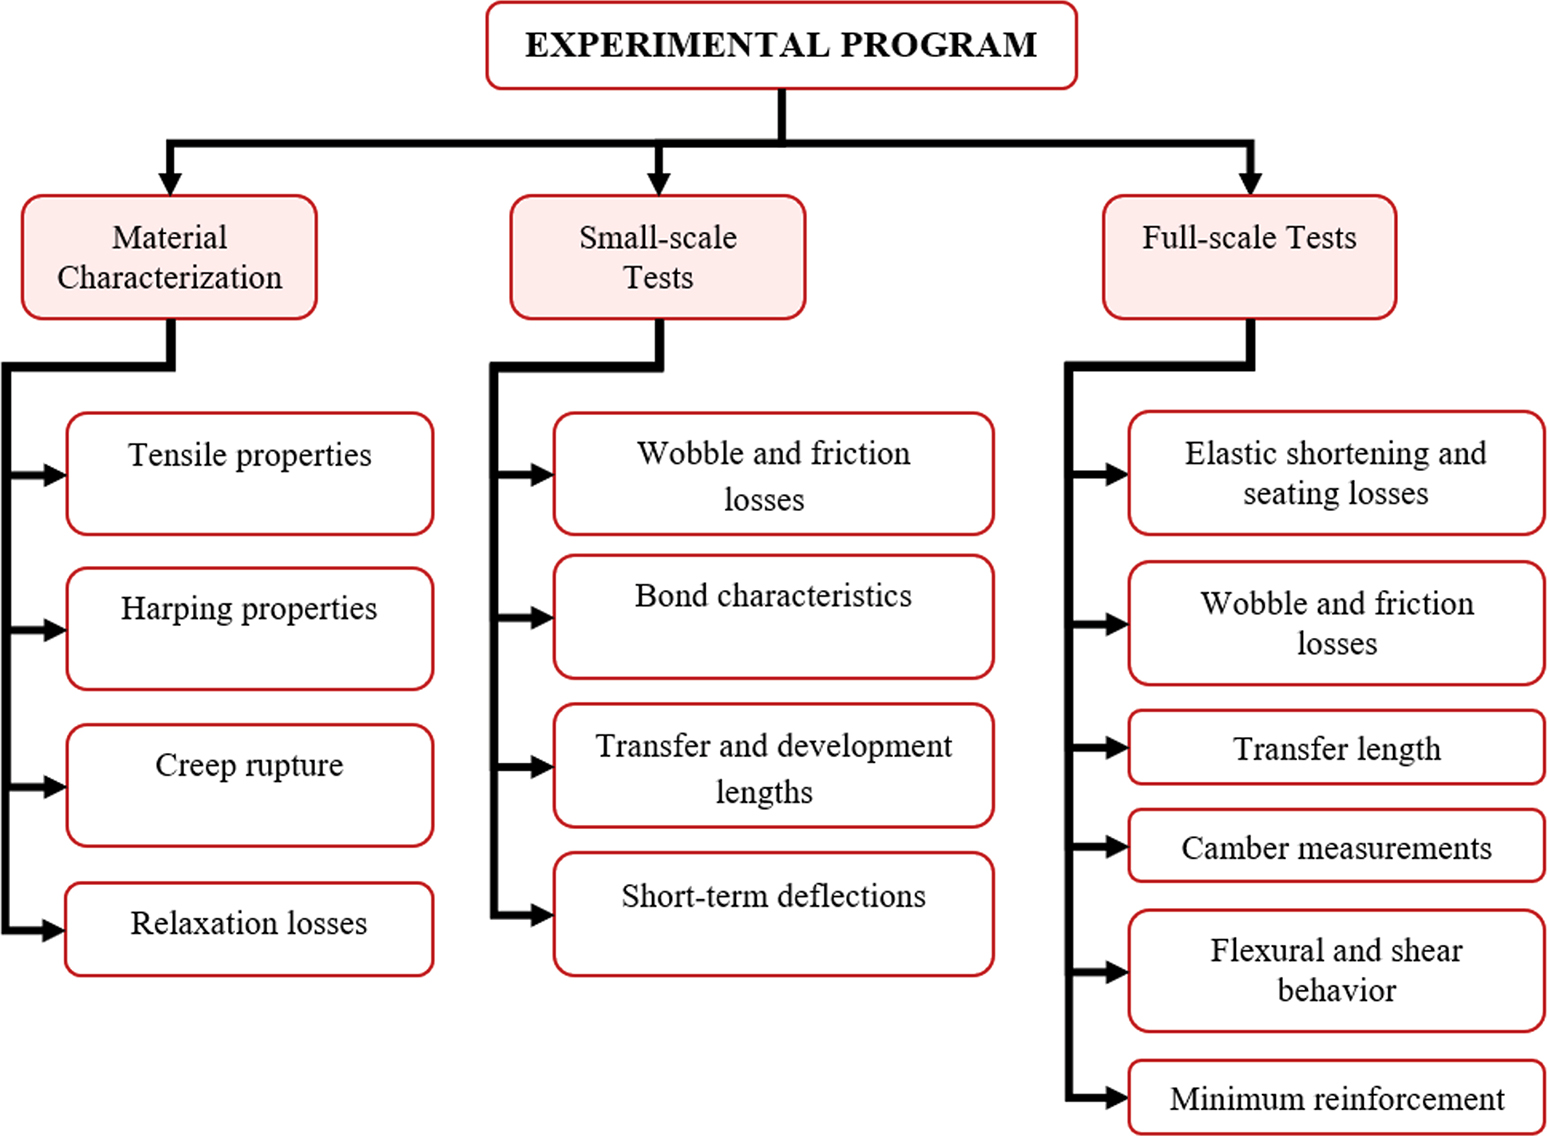
Building upon previous experimental and analytical research efforts, comprehensive experimental and analytical programs were developed. The proposed testing plan consisted of characterizing the mechanical properties of the strands, small-scale element tests, and large-scale prestressed member tests.
First, the mechanical properties were obtained by performing tensile tests on SS strands; in addition, the evaluation of the creep rupture strength of these strands was carried out. The test results were used for material characterization and the basis for the other tasks. The small-scale tests investigated specific factors: measuring prestress losses due to strand relaxation, anchorage seating, and friction; determining transfer and development lengths; and evaluating jacking stresses in harped strands. Finally, all the necessary information from the described tests was used for the testing and analysis of the large-scale experiments. The evaluation of flexure and shear behavior of pre- and posttensioned members was conducted on AASHTO Type I girders. These girders were subjected to monotonic flexure and flexural fatigue loads to obtain the full behavior of the prestressed stainless steel system. Analytical investigations were carried out to assess the suitability of the proposed design and material requirements. This involved probabilistic analyses to determine strength reduction factors, as well as numerical simulations utilizing the finite element method to expand the range of parameters and validate the findings from the experimental program.
The overall experimental program is summarized in Figure 2.
3.2 Mechanical Properties of Stainless Steel Prestressing Strands
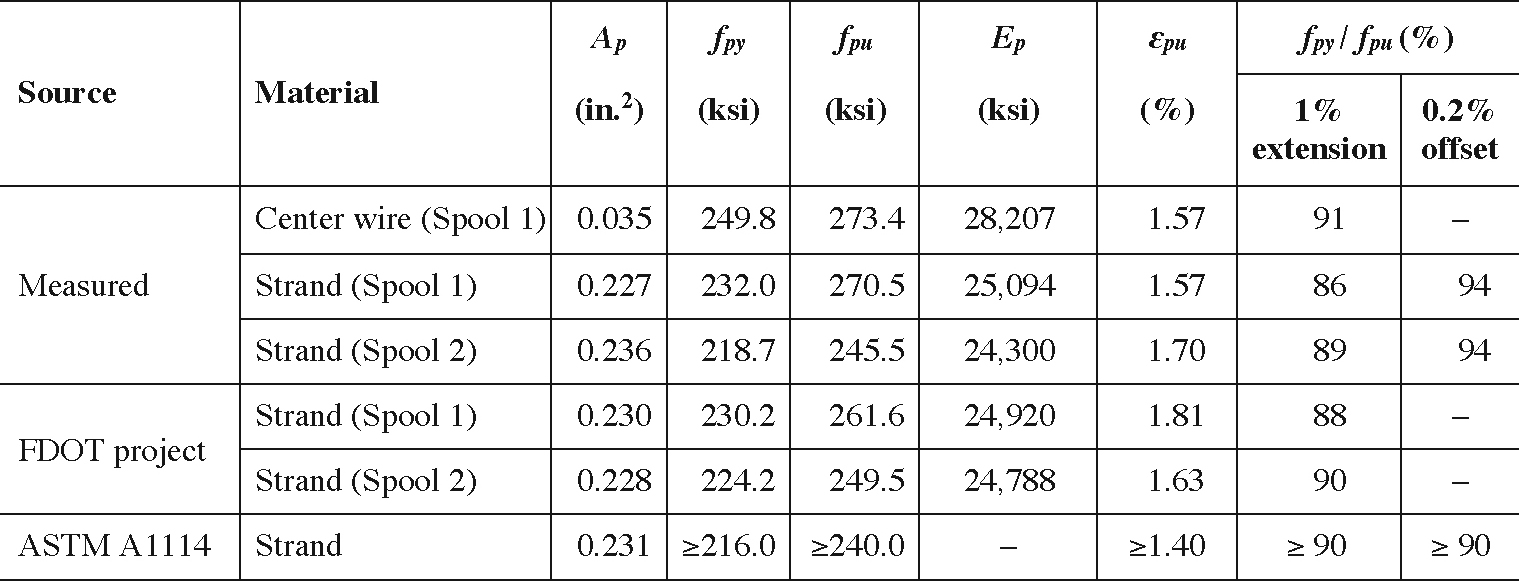
The tensile tests provided the full stress-strain behavior of SS strand, including yield stress (fpy), ultimate stress (fpu), ultimate strain (εpu), modulus of elasticity (Ep), and the shape of the stress-strain curve. The results of these tests provide the necessary information for the remaining subtasks of the experimental program (relaxation and creep rupture tests, among others) as well as the required input for validation of analytical and numerical models. In Table 4, the summarized results of the tensile tests performed herein (the tests were conducted on strands obtained from two separate spools) and reported in the FDOT project are supplemented with the ASTM A1114 provisions. Every test exceeded the ASTM A1114 requirements with 4%–14% higher ultimate stresses and 12%–29% higher ultimate strains. Modeling of the nominal stress-strain curve for SS strands was based upon the widely accepted modified Ramberg-Osgood model (Mattock, 1979), also known as the power formula:
Long Description.
The flow chart presents an experimental program divided into three branches labeled material characterization, small-scale tests, and full-scale tests. The material characterization branch flows downward into four items: tensile properties, harping properties, creep rupture, and relaxation and losses. The small-scale tests branch flows into four items: wobble and friction losses, bond characteristics, transfer and development lengths, and short-term deflections. The full-scale tests branch flows into six items: elastic shortening and seating losses, wobble and friction losses, transfer length, camber measurements, flexural and shear behavior, and minimum reinforcement.

Long Description.
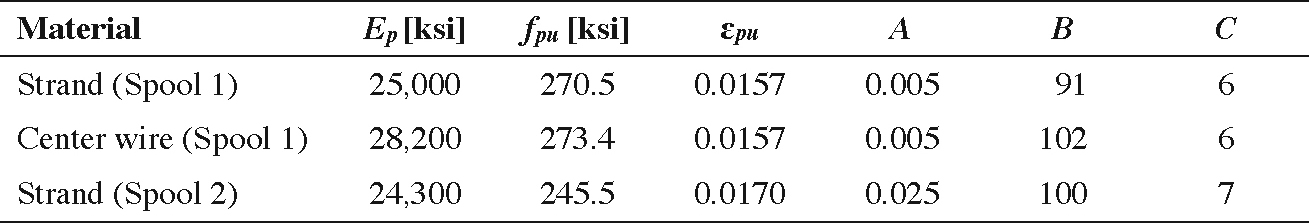
f sub p x equals capital E sub p times epsilon sub p x times the quantity capital A plus the fraction 1 minus capital A over the quantity 1 plus B times epsilon sub p x raised to the power of C, all raised to the power of 1 over C.
where fpx is the nominal stress in prestressed reinforcement (ksi), Ep is the modulus of elasticity (ksi), εpx is the nominal strain (in./in.), and A, B, and C are constants that depend on the specific type of steel. The Ramberg-Osgood model constants for both spools are presented in Table 5.
Long Description.
The table summarizes tensile test data with columns Source, Material, capital A sub p in squared inches, f sub p y in k s i, f sub p u in k s i, capital E sub p in k s i, epsilon sub p u in percent, and f sub p y over f sub p u in percent. Measured center wire spool 1 records area 0.035, yield stress 249.8, ultimate stress 273.4, modulus 28,207, strain 1.57, ratio 91 at 1 percent extension, and no offset at 0.2 percent. Measured strand spool 1 records area 0.227, yield stress 232.0, ultimate stress 270.5, modulus 25,094, strain 1.57, ratio 86 at 1 percent extension and 94 at 0.2 percent offset. Measured strand spool 2 records area 0.236, yield stress 218.7, ultimate stress 245.5, modulus 24,300, strain 1.70, ratio 89 at 1 percent extension and 94 at 0.2 percent offset. Florida DOT strand spool 1 records area 0.230, yield stress 232.2, ultimate stress 261.6, modulus 24,920, strain 1.81, ratio 88 at 1 percent extension, and no offset at 0.2 percent. Florida DOT strand spool 2 records area 0.228, yield stress 224.2, ultimate stress 249.5, modulus 24,788, strain 1.63, ratio 90 at 1 percent extension, and no offset at 0.2 percent. ASTM International A 1 1 1 4 minimum strand requirements list area 0.231, yield stress at least 216, ultimate stress at least 240, strain at least 1.40, and ratio at least 90 for both criteria.
Long Description.
The table presents mechanical properties of stainless steel strand materials, including two strands and one center wire, with columns labeled Material, modulus E sub p in k s i, f sub p u in k s i, epsilon sub p u, A, B, and C. For strand spool 1, the modulus E sub p is 25000, ultimate stress f sub p u is 270.5, strain epsilon sub p u is 0.0157, A is 0.005, B is 91, and C is 6. For center wire spool 1, modulus E sub p is 28200, f sub p u is 273.4, epsilon sub p u is 0.0157, A is 0.005, B is 102, and C is 6. For strand spool 2, modulus E sub p is 24300, f sub p u is 245.5, epsilon sub p u is 0.0170, A is 0.025, B is 100, and C is 7.
3.3 Harping Characteristics of Stainless Steel Prestressing Strands
In harped configurations, the curvature of prestressing strands around strand hold-down devices—commonly referred to as deviators—induces localized stress concentrations and elevated stresses and strains at the outer diameter due to bending. These effects intensify as the radius of curvature decreases and the harping angle increases. For CS strands, which exhibit high ductility and post-yield capacity, the associated reduction in tensile strength is typically not critical in design. However, for strands with limited or no ductility, such as CFRP and SS strands, harping can significantly compromise tensile capacity and raise the risk of wire rupture at the deviator during tensioning. To address this, the current study includes experimental testing focused on evaluating the impact of harping angles on the tensile performance of SS strands (Mechaala et al., 2024).
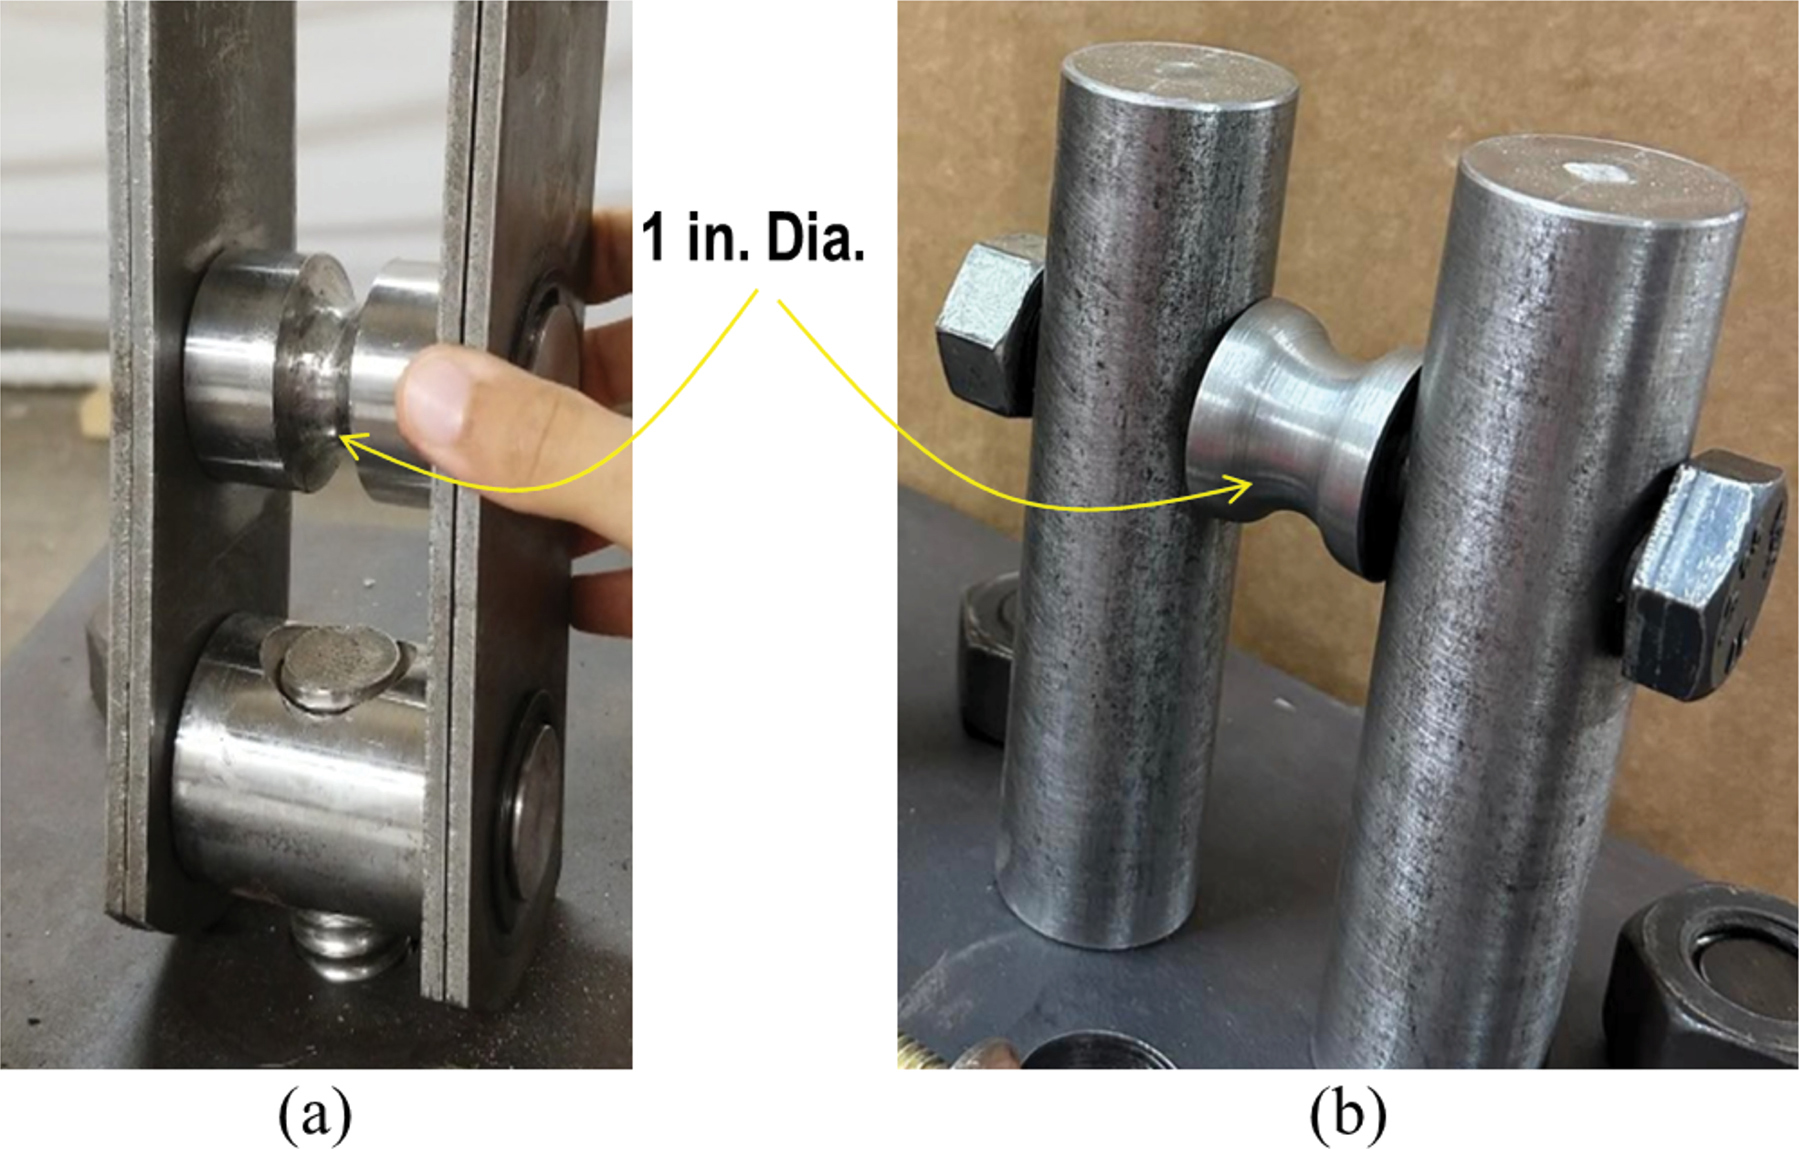
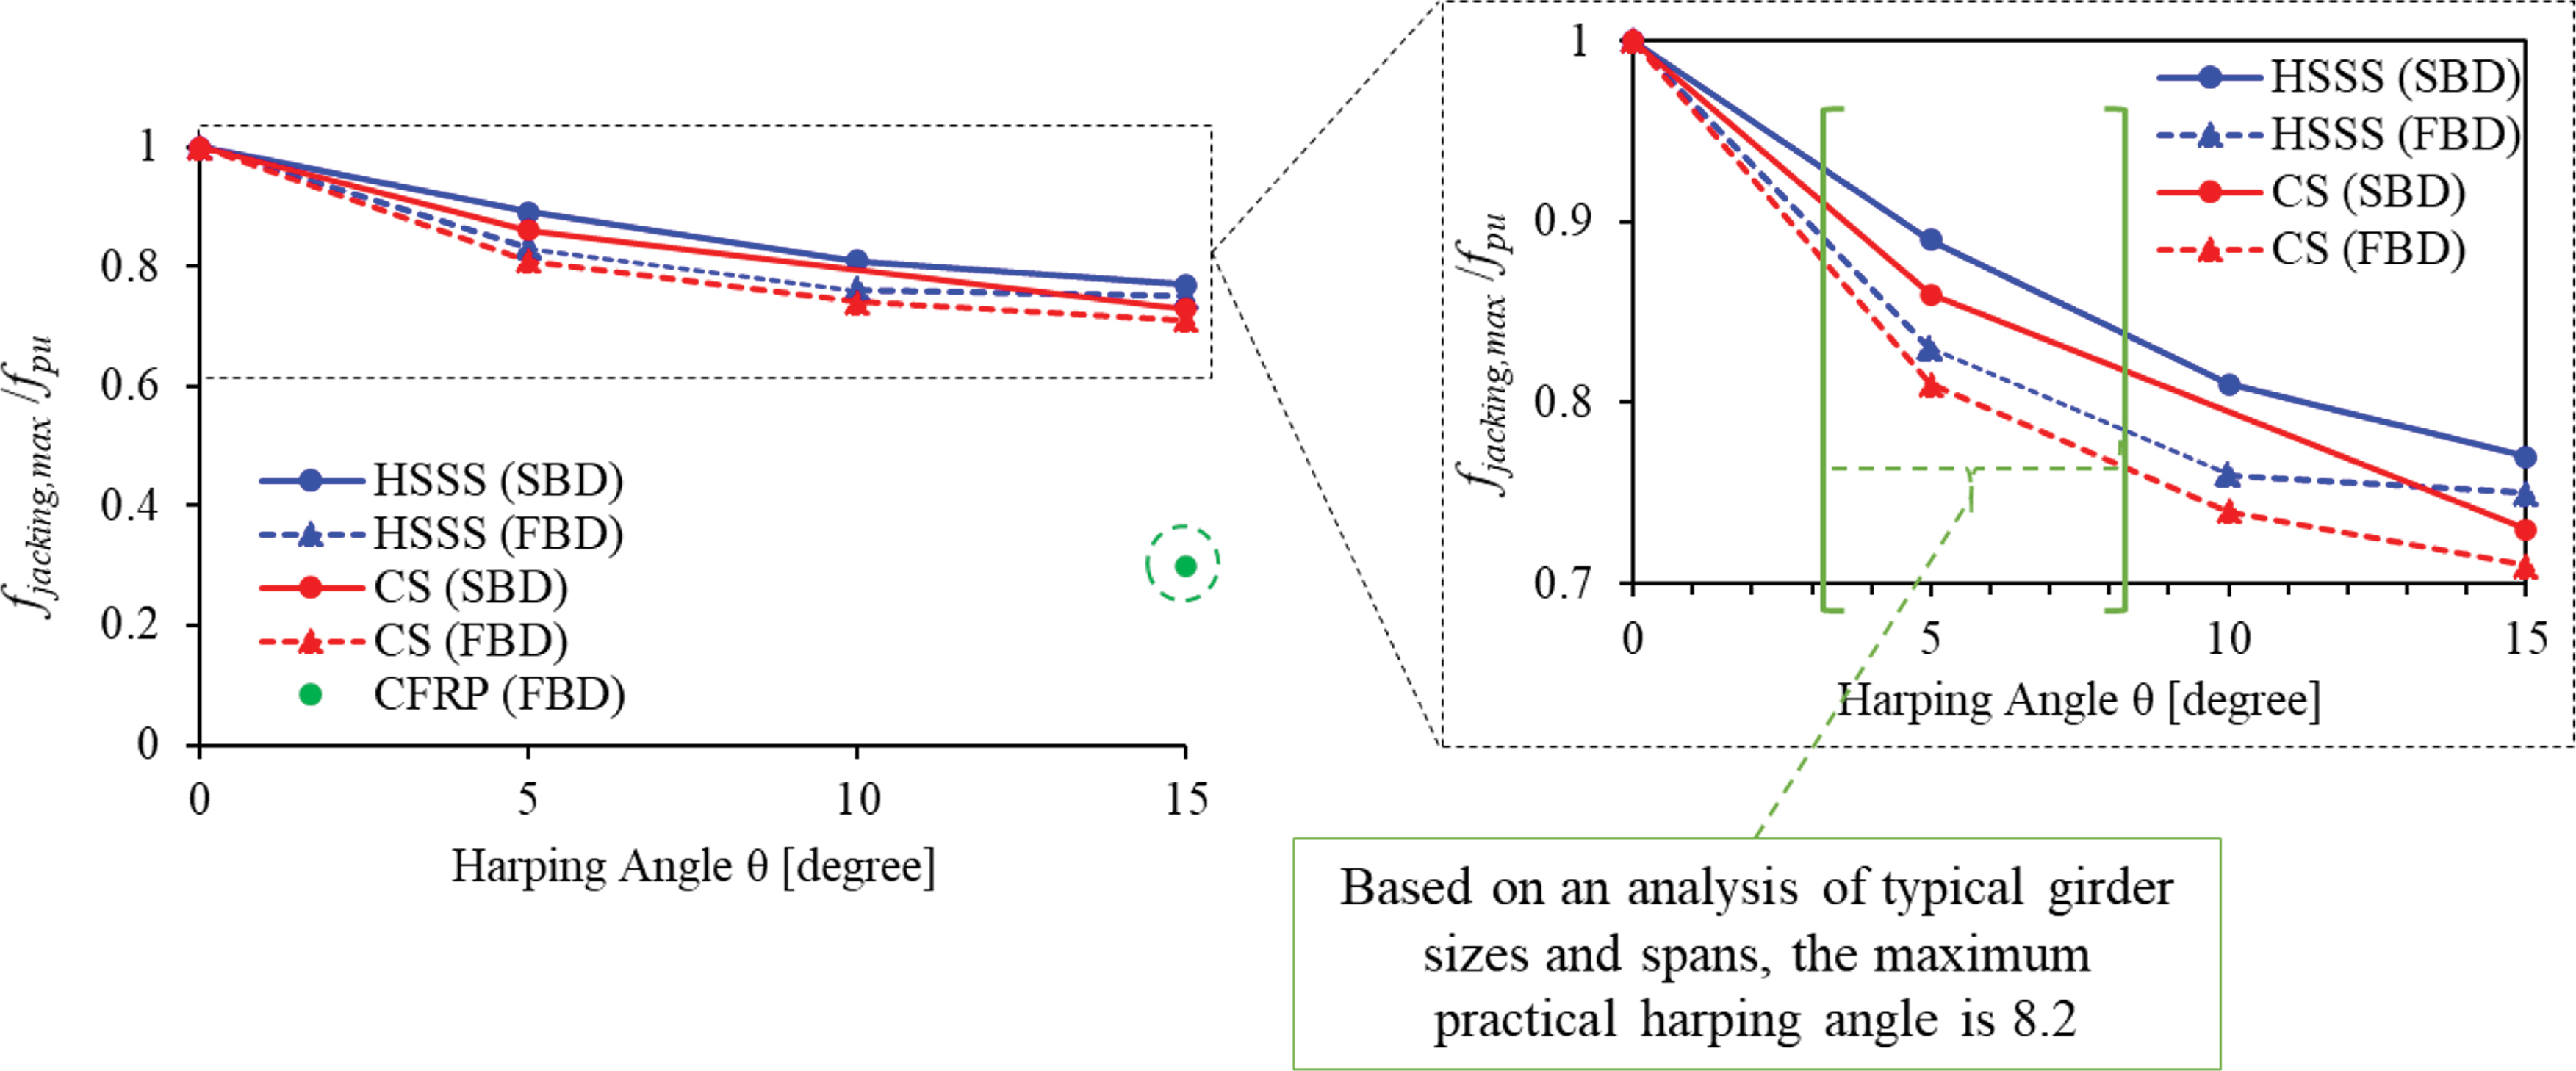
Based on an analytical evaluation performed by the research team for a range of bridge girders with different heights and lengths with typical deviator locations within the span, pretensioned beams typically have harping angles that do not exceed 8.2°. According to a study by Yan et al. (2021), a strand with a greater harping angle can create an unfavorable mechanical condition in the girder at the deviator. As a result, harping angles less than 12° are commonly used in prestressed concrete girders. To cover the full range of possible harping angles for this research, the maximum tested harping angles for both SS and CS strands were limited to 15°. In practice, strand deviators are either swivel-based (SBD) or fixed-based (FBD) as shown in Figure 3. In this study, both types of deviators were used to evaluate the effect of each deviator type on strand performance.
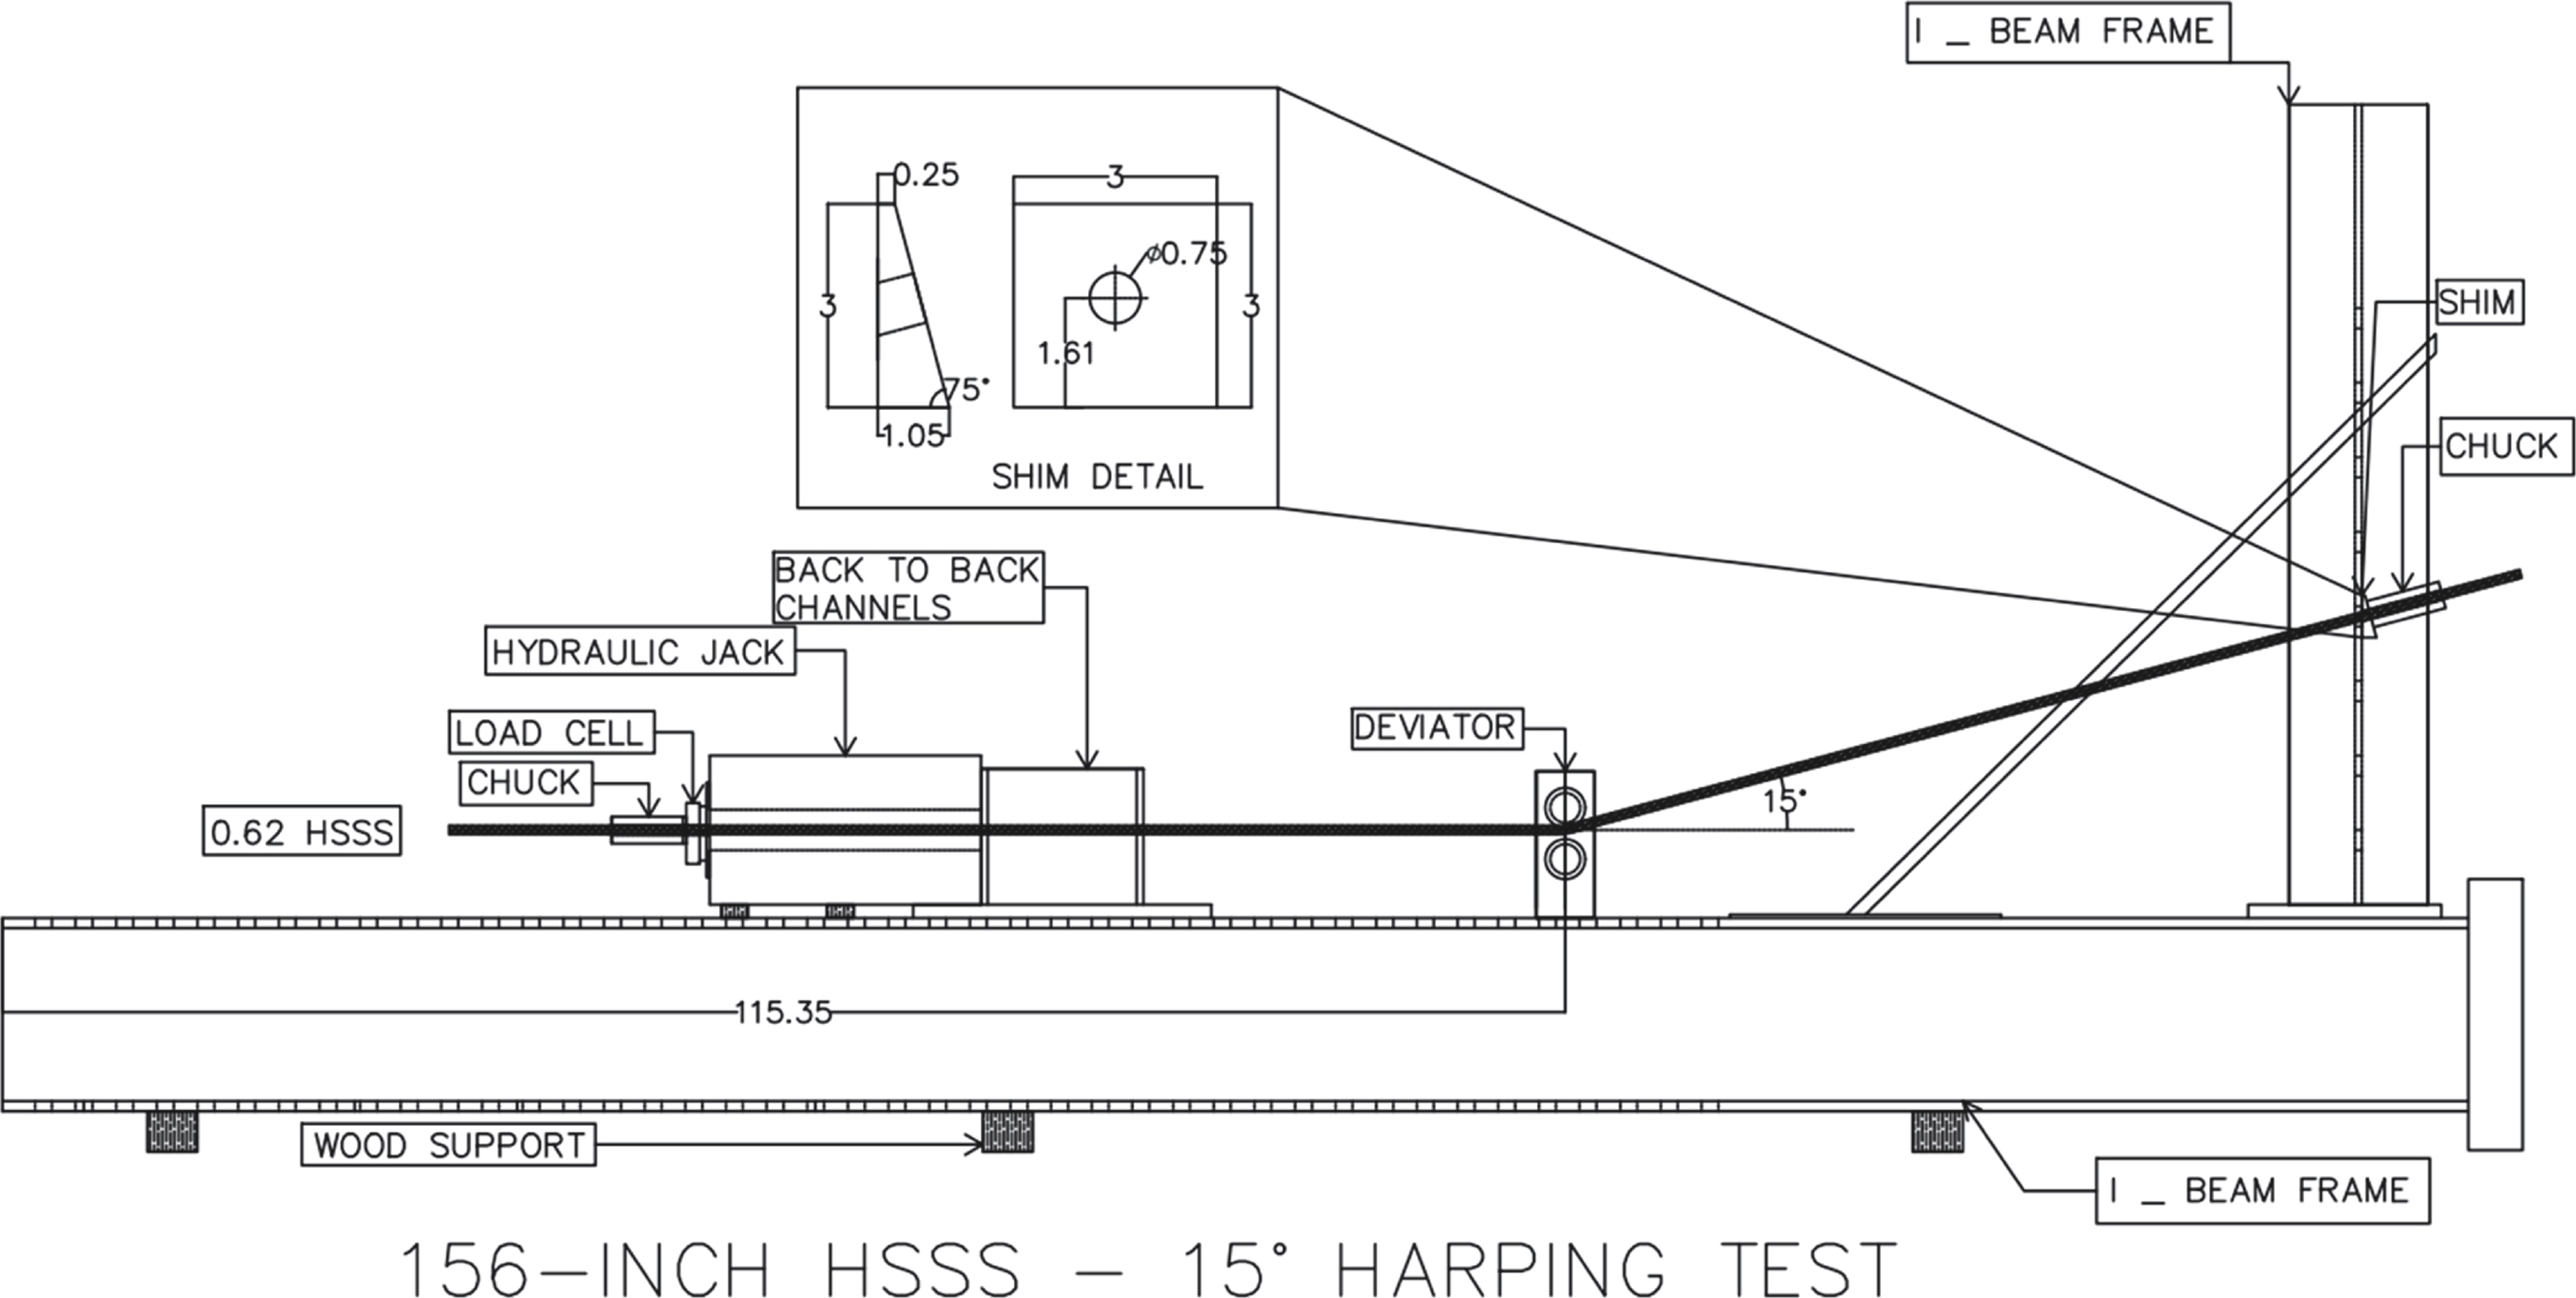
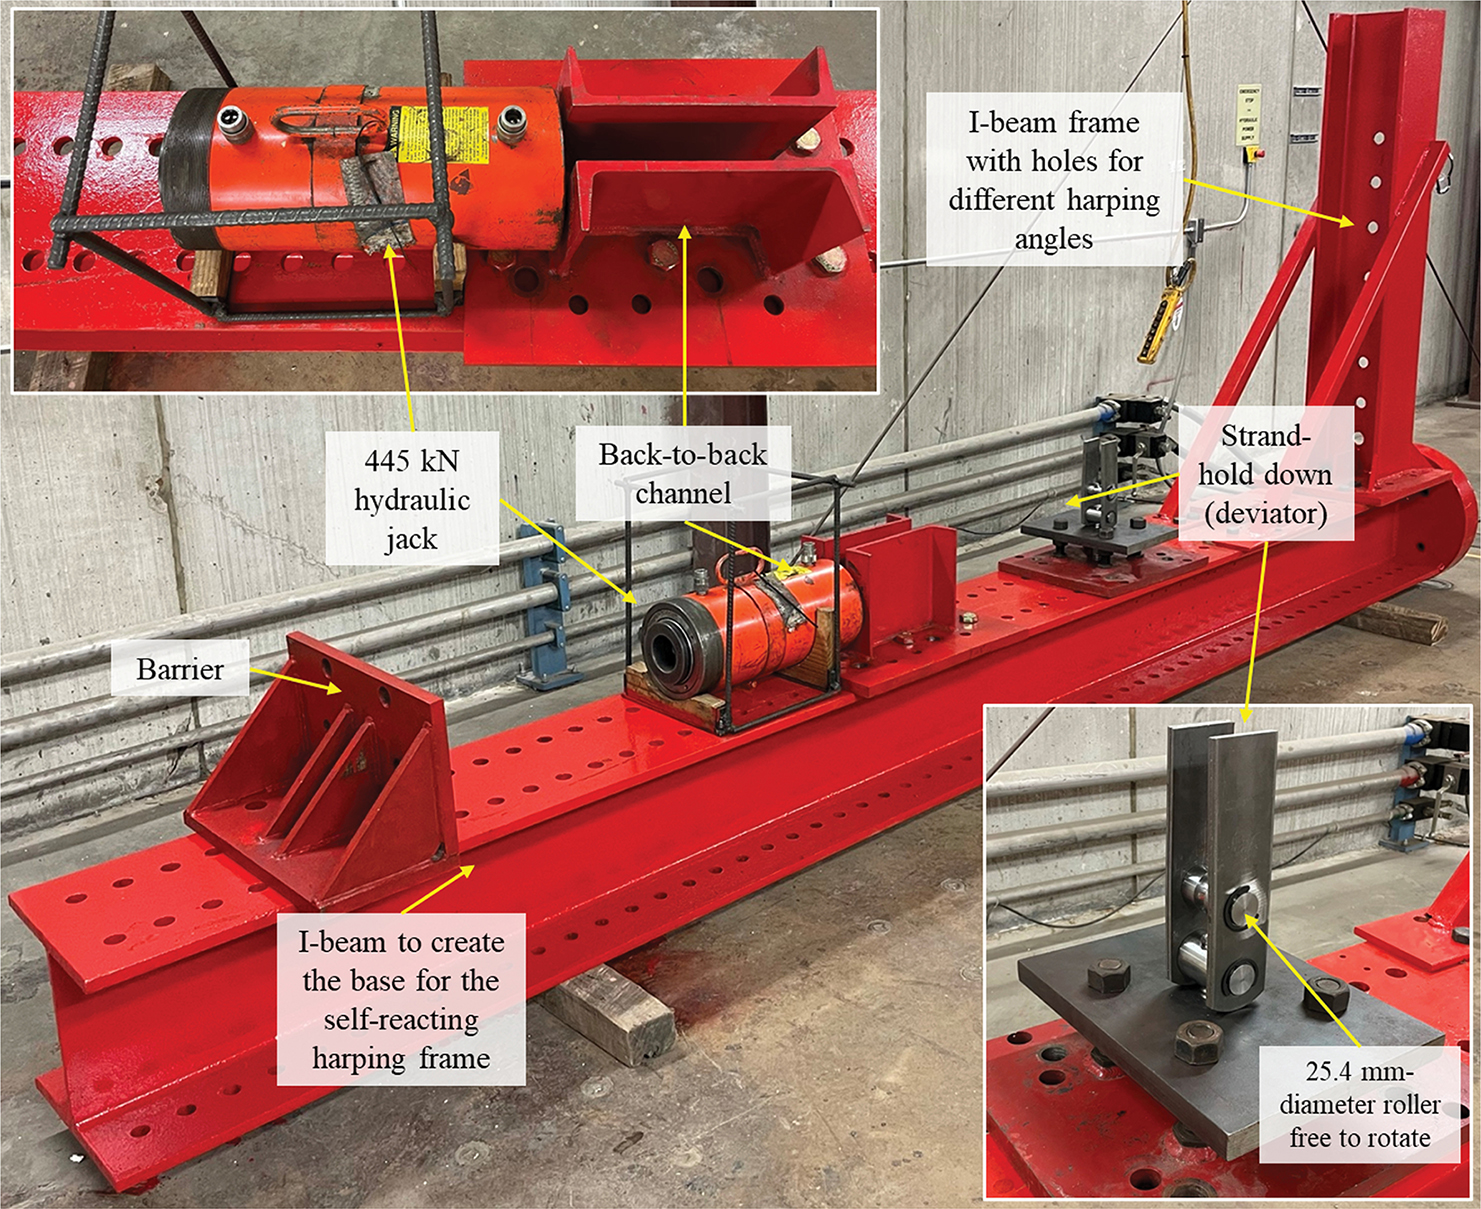
The harping tests were performed using the self-reacting testing frame, with the schematic shown in Figure 4; the pictures of the frame and its components are provided in Figure 5.
Long Description.
An illustration presents two tension testing devices. On the left, part A shows a swivel based deviator with two cylindrical rods and a central pin that allows rotation, aligned vertically between two plates. A finger is pointing to a central section labeled 1 inch diameter. On the right, part B shows a fixed based deviator where the 1 inch diameter central pin is held rigidly between two upright rods with bolts. Arrows point from each pin to the shared 1 inch diameter label.
Long Description.
The schematic shows a 156 inch long stainless steel strand harping test setup with a 15 degree harping angle. The test frame consists of an I beam base supported by wood blocks. From left to right, the setup includes a wood support, a hydraulic jack, a chuck, a load cell, and a deviator mounted along the beam. The strand labeled 0.62 high strength stainless steel runs diagonally from the left chuck, through the deviator at 15 degrees, and ends at a second chuck on the right. The deviator redirects the strand at the specified angle. Each end of the structure is supported by a pair of side-by-side vertical I-beam frames. A callout box labeled shim detail shows a close-up of the shim , featuring a 0.75-inch hole and overall dimensions of 3 by 3 inches. The horizontal spacing from the chuck to the deviator is marked as 115.35 inches.
Long Description.
A self-reacting harping test frame used in strand testing includes an I-beam base that supports the entire setup. On the left side, a barrier connects to an I-beam that supports a 445 kilonewton hydraulic jack mounted within a pair of back-to-back channels. On the right, an I-beam frame with multiple holes is used to adjust for different harping angles. Attached to this frame is a strand-hold down device labeled deviator, which includes a 25.4 millimeter diameter roller free to rotate. Two inset images provide close-up views of the hydraulic jack within the back-to-back channel and the rotating roller at the deviator. All major components are labeled.
Figure 6 presents the overall harping test results for both SS and CS steel strands using FBD and SBD devices. The tests revealed that FBDs led to a lower breaking capacity compared to SBDs, primarily due to increased frictional losses at the strand–deviator interface, The CS strands exhibited slightly lower capacities compared to the SS strands; both SS and CS strands demonstrated a significant decrease in capacity with an increasing harping angle (Mechaala et al., 2024).
Tahsiri and Belarbi (2022) used the same test frame to test CFRP strands with an FBD using a 15° harping angle. For these tests, the percentage of the harped strand breaking load compared to the design tensile strength of the strand did not exceed 30%, which is notably lower than the minimum 70% ratio of the breaking load used to design tensile strength for carbon and SS strands for a harping angle of 15°, despite SS strands having low ductility (see Figure 6). The results demonstrate that SS strands may be harped in prestressed structures within a range of practical values of harping angles between 4° and 8° (Mechaala et al., 2024). More details of the tests and results are presented in Appendix B.
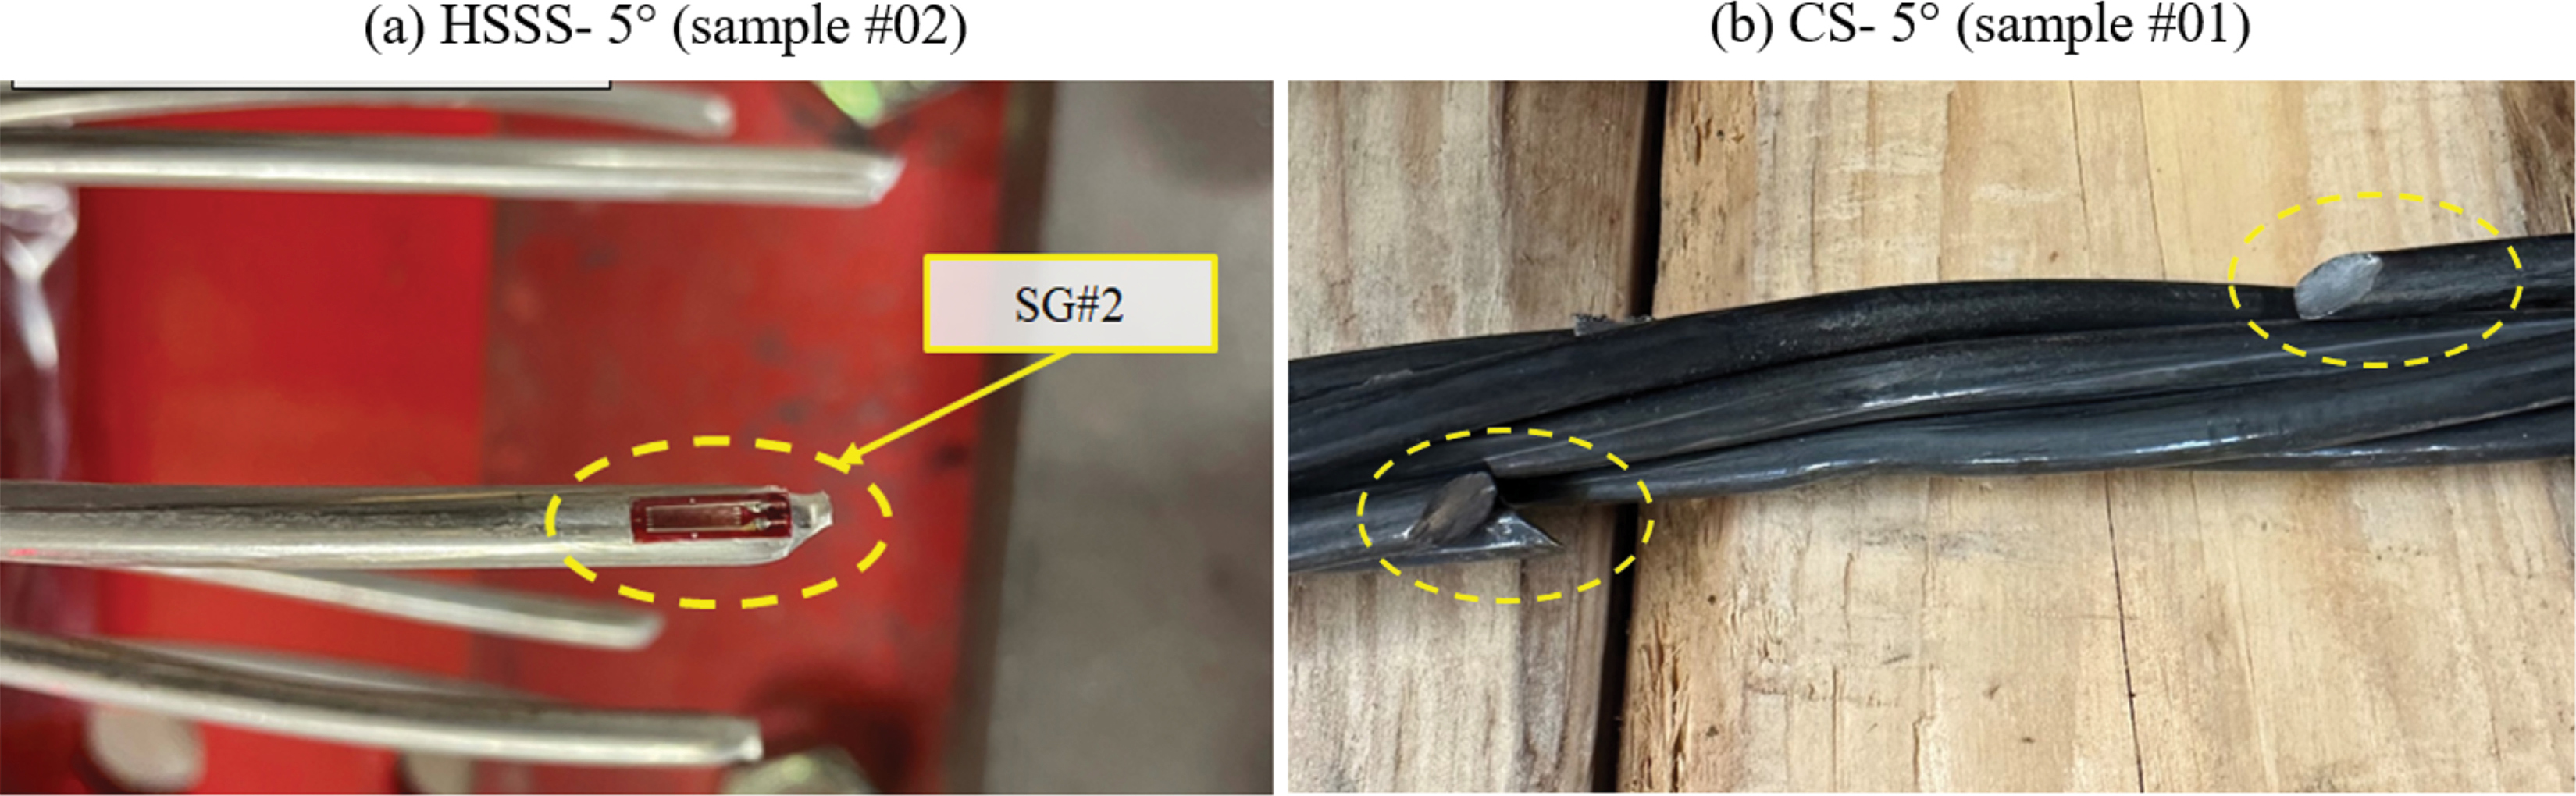
Figure 7 shows the observed failure modes for both SS and CS strands. Stainless steel strands primarily failed through the rupture of all seven wires, although in some cases, only five wires ruptured. Failures typically initiated at the bottom outer wire, where bending-induced tensile
Long Description.
The graph presents the ratio of measured stress to full stress on the vertical axis and harping angle in degrees on the horizontal axis, ranging from 0 to 15. Five data series are shown: high strength stainless steel with swivel-based deviators, high strength stainless steel with fixed-based deviators, carbon steel with swivel-based deviators, carbon steel with fixed-based deviators, and carbon fiber reinforced polymer with fixed-based deviators. All lines show a downward trend, indicating a decrease in stress ratio with increasing harping angle. The inset zooms into angles from 0 to 15 degrees for a closer view. A bracketed note states that based on typical girder sizes and spans, the maximum practical harping angle is 8.2 degrees. high strength stainless steel strands show higher stress ratios than carbon steel strands at all angles, with the swivel-based deviators configuration slightly outperforming the fixed-based deviators. Carbon fiber reinforced polymer is only represented under the fixed-based deviators condition.
Long Description.
An illustration features two failed strands after harping tests at 5 degrees. On the left, part A shows the stainless steel strand labeled high strength stainless steel sample 2 held in place with metal clamps. A strain gauge labeled SG numbered 2 is attached near the fractured end, which is highlighted. On the right, part B shows the carbon steel strand labeled carbon steel sample 1 resting on wood, with two fractured strand ends, which are highlighted. Both specimens display clear break points where the wire has failed due to the test conditions.
stresses are highest. Visible necking of the wires confirms a tensile failure mechanism (see Figure 7a). Conversely, the CS strands failed by fracturing only one or two outer wires for all tested samples. This failure is depicted in Figure 7b, where the diagonal nature of the ruptured strand (45°) indicates a shear type of failure (Mechaala et al., 2024).
Based on these observations, it can be concluded that the CS strands failed in a more brittle manner compared to the SS strands, which failed in a more ductile manner. This is surprising because CS strands tested in tension are ductile, while SS strands tested in tension exhibit more brittle behavior. Based on these test results, it appears that SS strands can be harped in the same manner as CS strands. While the stress reduction at hold-down devices at various harping angles is about the same for both SS and conventional CS strands, the SS strands failed by simultaneous rupture of all 7 wires due to lack of ductility. It is recommended that any limitations that may be imposed on harping of CS strands also be used when harping SS strands. Furthermore, proof testing of SS strands and swivel-base deviation devices is recommended and gives less strength reduction based on test results of the harping experiments as shown in Figure 6.
3.4 Evaluation of Creep Rupture Strength of Stainless Steel Prestressing Strands
The creep rupture tests of available 0.62 in. SS strands were performed following the procedures in ASTM D7337 and ASTM E139 (standards for evaluating creep rupture of FRP bars and metallic materials, respectively), since no creep rupture test standards exist for SS strands. Different levels of the force ratio (sustained force/measured tensile strength) were applied and the time required for the sample to rupture due to creep deformation was recorded. The level of force ratio was plotted with respect to the corresponding time-to-failure observations.
Two testing approaches were used. The first approach was the so-called one-million-hour test, which is usually performed for jacking stress ratios up to 90% of the measured ultimate strength. For this project, a sustained force of 75% and 85% of the ultimate measured stress was applied, with three repetitions at a load of 75% of the measured ultimate stress and one repetition at a load of 85%. The self-reacting test frame shown in Figure 8 was used. For higher prestressing ratios (more than 90% of the ultimate strength), an approach called the “one-thousand-hour test” is usually performed because rupture typically occurs between 100 and 1,000 hours. In this study, the one-thousand-hour test procedure was used for sustained forces corresponding to ~90% and ~95% of the measured ultimate strength.
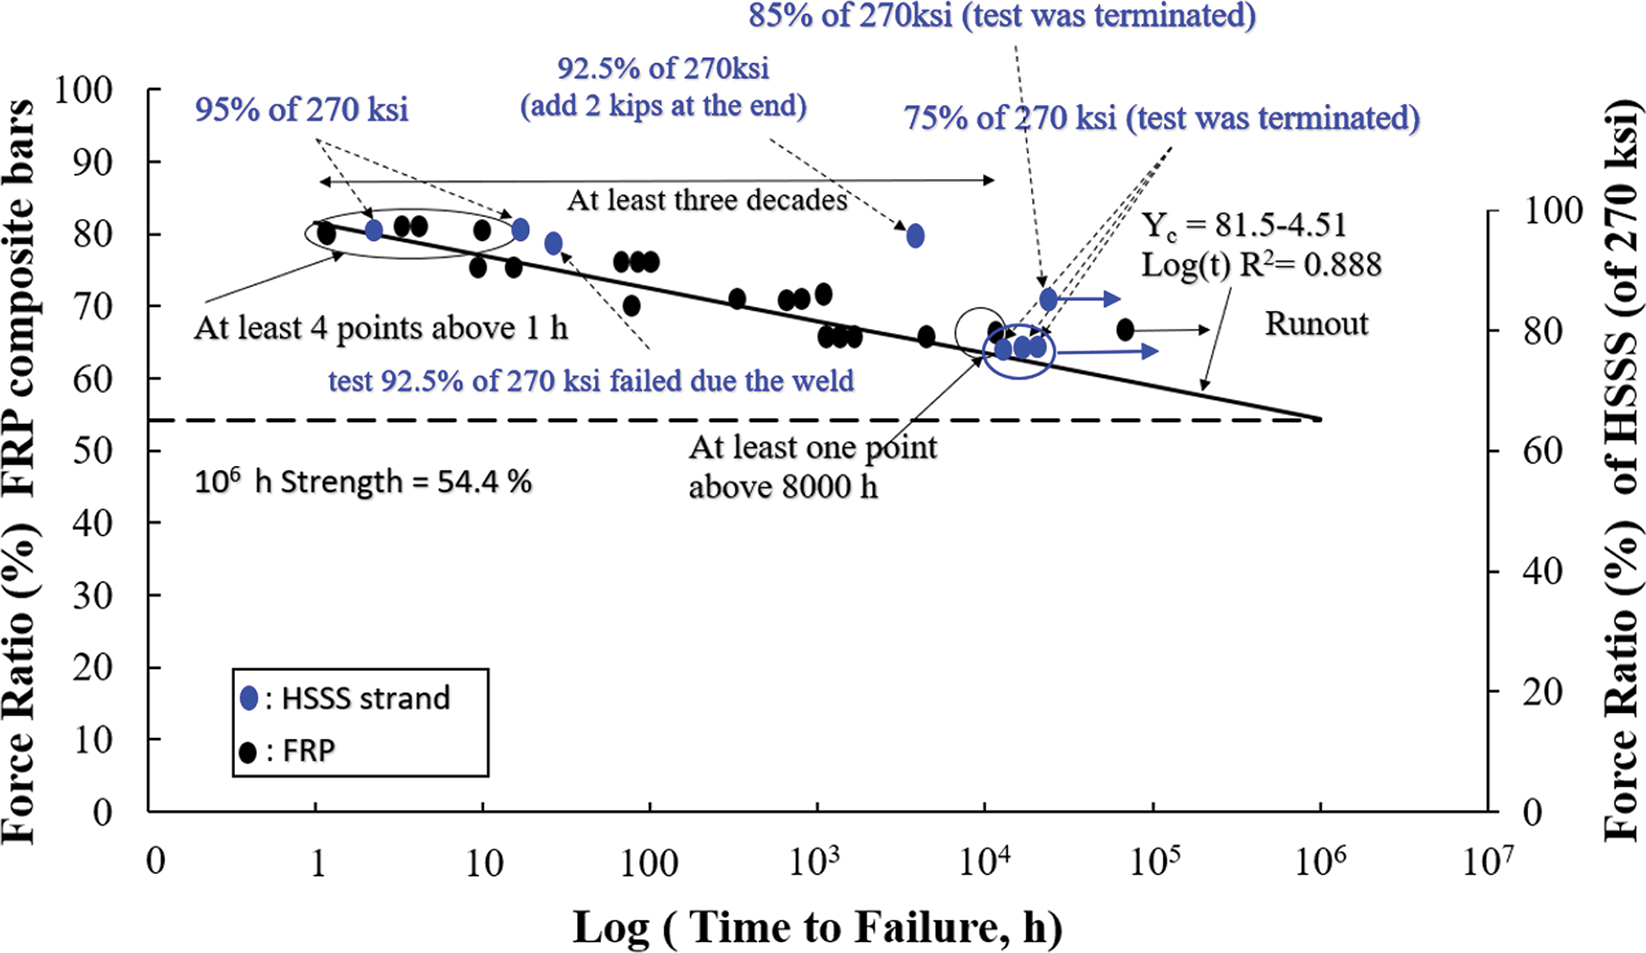
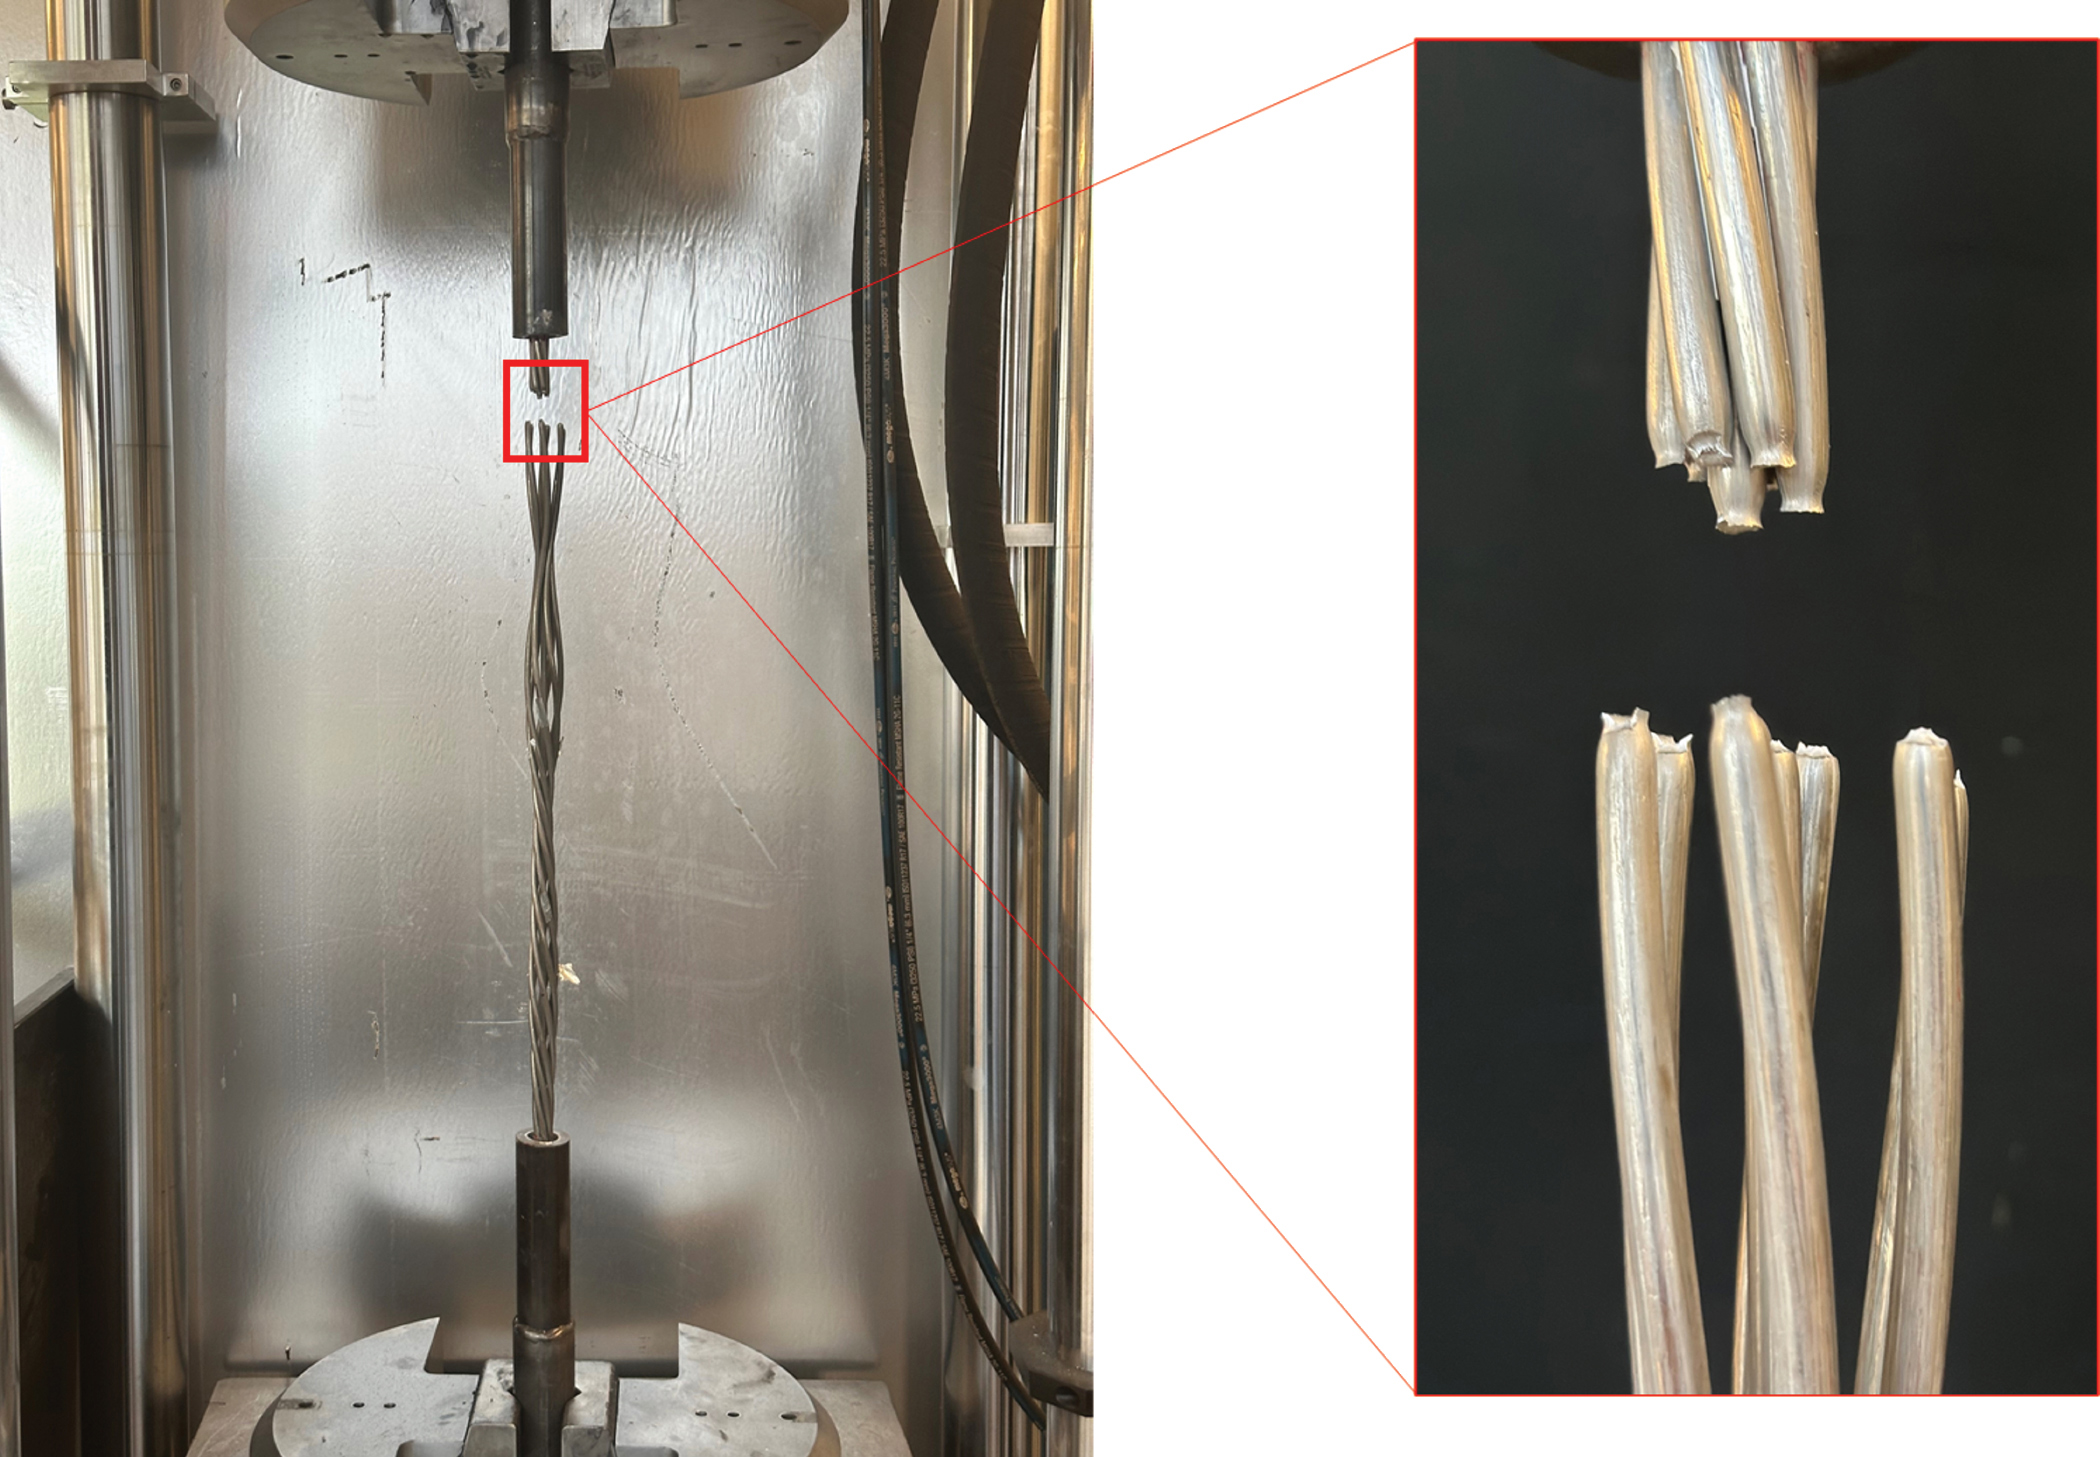
Test results for the million-hour creep-rupture test method, as outlined in ASTM D7337, were extrapolated from the force ratio versus creep rupture time curve that is plotted using experimental data from the tests performed at different force levels. Figure 9 shows data and a best-fit line as described in ASTM D7337 for FRP matrix composite bars, along with the results from the SS strands creep-rupture tests. The study initially aimed to generate a more representative curve for SS strands to extrapolate to the one-million-hour creep-rupture capacity; however, after more than two years of testing, the experiment was terminated without strand failure. Given that the stainless steel in the strands is a material distinct from FRP with different properties, the expected time to rupture at the selected force levels may differ from ASTM D7337 guidelines. Additionally, both the one-thousand-hour test conducted at a force level of approximately 95% of the ultimate strength and the results from the ~92.5% strength tests were included. In the 95% tests, both samples ruptured at one of the anchors, whereas in the 92.5% tests, the first test was terminated due to strand slippage at the anchor. The second test ruptured, after adding the 1-kilopound (kip) increase (twice) and then increasing the stress to ultimate (see Figure 10). Details of the tests and results are presented in Appendix B.
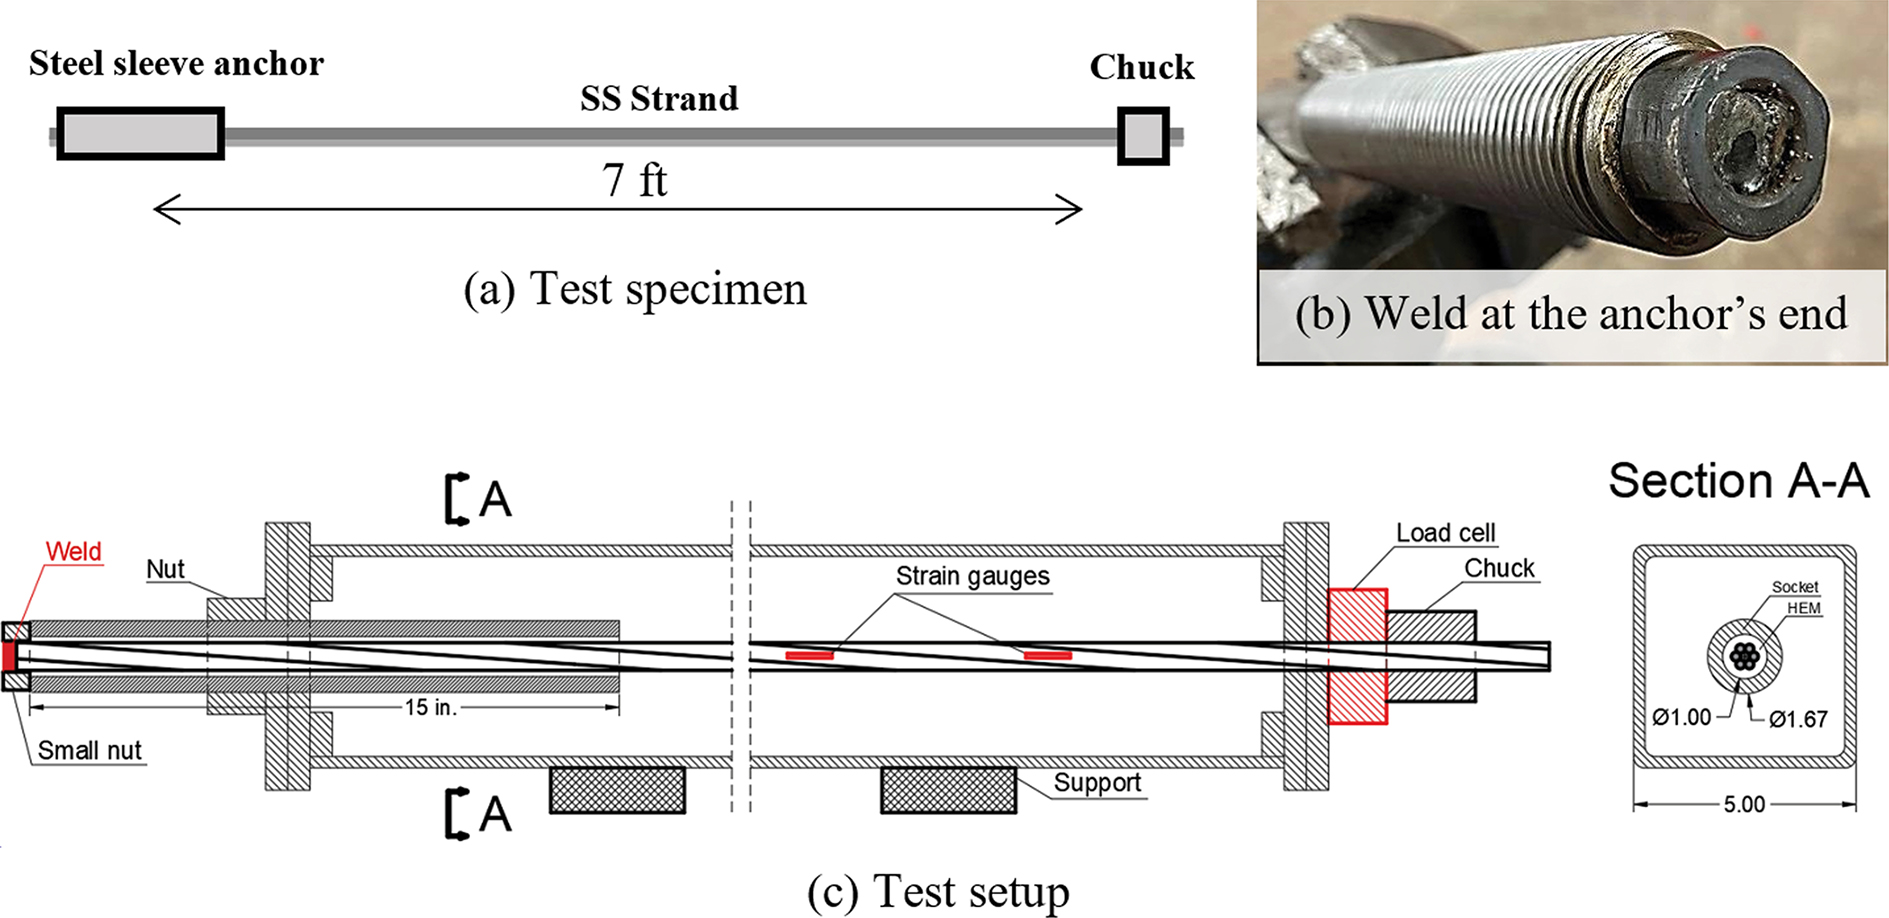
Long Description.
The illustration describes the one-million-hour test configuration in three parts. Part a shows a 7 foot long test specimen with a stainless steel strand between a steel sleeve anchor on the left and a chuck on the right. Part b is a close-up of a weld made at the end of the anchor to secure the strand and prevent slippage. Part c shows the full test setup with the strand anchored between two end plates. On the left side, the strand is welded and secured with a nut and a small nut. A 15 inch length is marked from the weld inward. In the middle section, three strain gauges are mounted along the strand. The right side includes a chuck connected to a load cell to measure force. Section A A shows a cross-section of the anchor, identifying two strand holes of 0.1 and 0.167 inch diameter spaced within a 5 inch wide socket. The entire setup is supported underneath by blocks.
Long Description.
The graph compares the force ratio in percent on the vertical axis and the log time to failure in hours on the horizontal axis. The left vertical axis is for FRP composite bars, and the right vertical axis is for high strength stainless steel strands of 270 k s i tensile strength. Blue points represent high strength stainless steel strands, and black points represent FRP bars. The trend line passes through both data sets and indicates a declining force ratio with increasing time. A dashed line marks the extrapolated 10 to the power of 6 hour strength at 54.4 percent. Labels indicate results such as 95 percent, 92.5 percent, 85 percent, and 75 percent of 270 k s i, with some tests terminated early. One test failed due to a weld. Annotations highlight individual test points and trends. The fitted curve equation is Y sub c equals 81.5 minus 4.51 times log of t with an R squared value of 0.888. Multiple data clusters and annotations show that the test duration spans from below 1 hour to over 10 to the power of 6 hours. A region marked as runout shows samples that did not fail.
Long Description.
A close view of specimen 2 mounted in a vertical testing machine after rupture. The failed region is highlighted. A zoomed-in view on the right displays multiple frayed ends of the separated strands, showing clean breaks and splayed wire tips. The broken wires appear untwisted and uneven, indicating the location and nature of the rupture. Both the full machine view and the detailed image provide visual evidence of the failure mode.
Test results for prestress levels of 75% and 85% indicate that no strand ruptures occurred after two years of testing. When the force fell below the assumed limit for these tests—below a 2% threshold—the load was adjusted to account for incremental relaxation effects. Since the million-hour creep-rupture capacity for the SS strands showed no failure, the sustained-level stress limits can be selected for this range.
The one-thousand-hour test was conducted at 92.5% of the ultimate measured force after 1,000 hours, which was the intended test duration. During this time, the prestressed strand remained at the secondary creep level. After 3,897 hours—almost four times the original test duration for the 92.5% fpu specimen—the load was increased to failure. Details of the tests and results are presented in Appendix B.
3.4.1 Prestress Losses
3.4.1.1 Strand Relaxation Loss
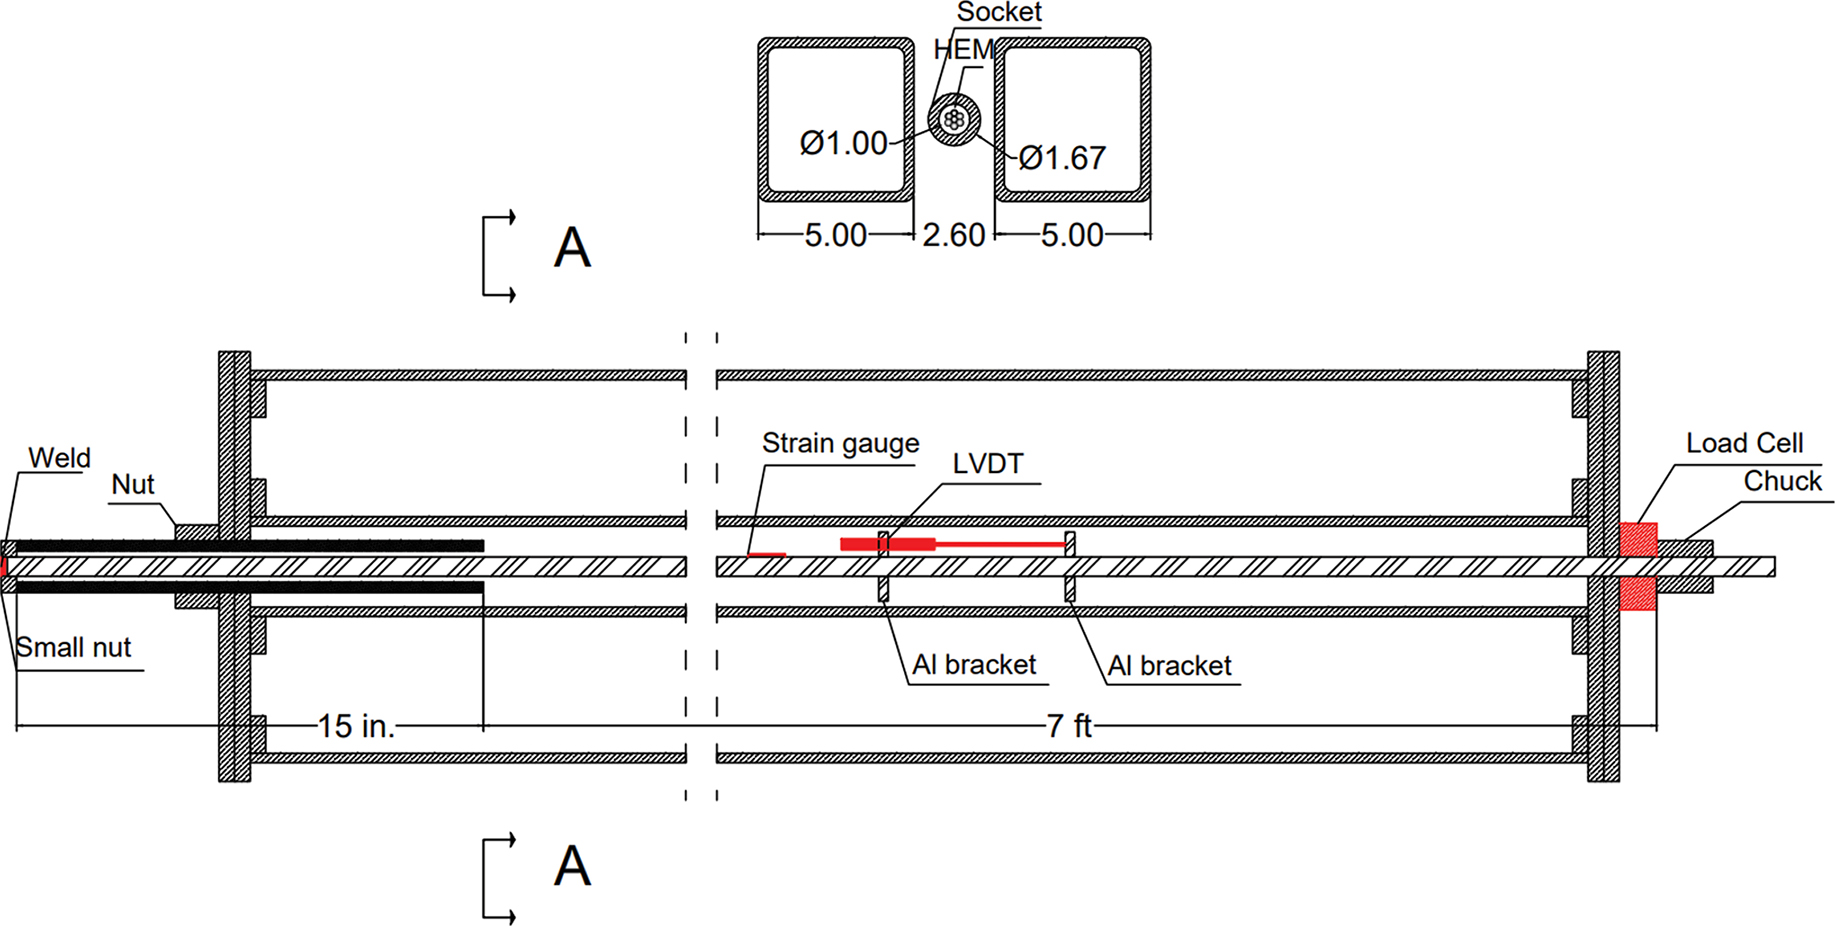
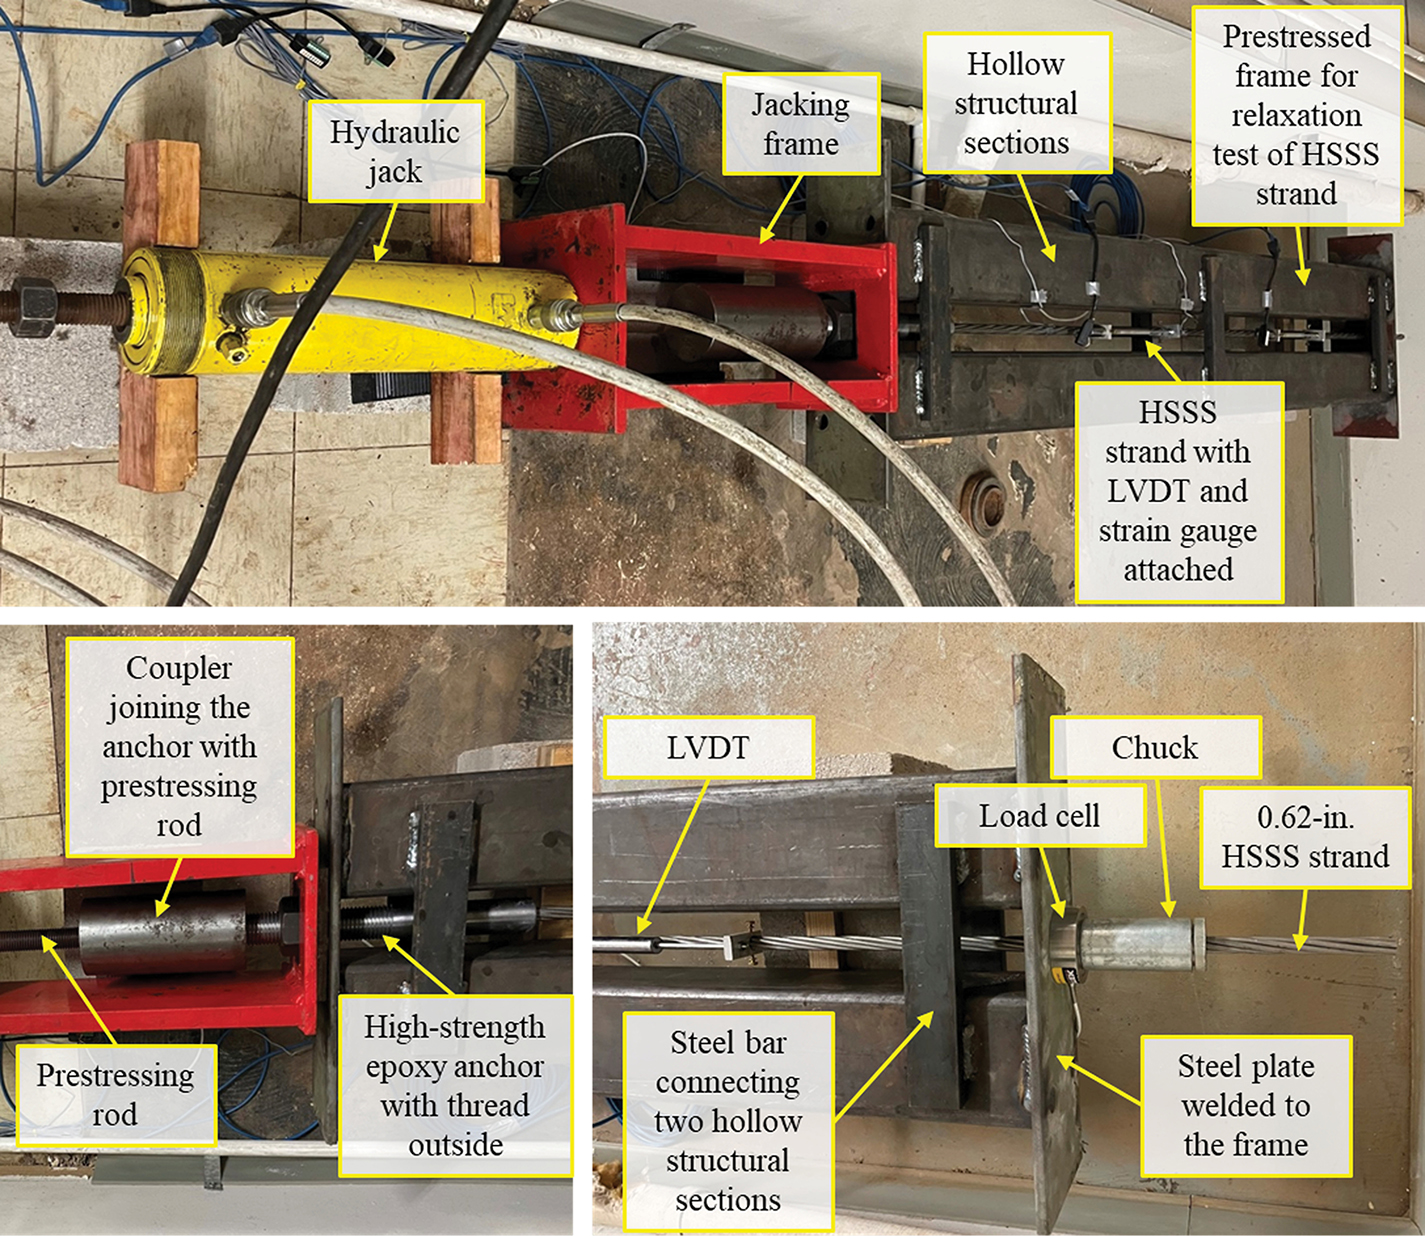
The test configuration of the relaxation test was designed to subject a SS strands specimen to a sustained force. Tests were conducted at stress levels of 60%, 70%, and 80% of the ultimate measured stress from coupon tests. Three repetitions were conducted for each prestressing level until the measured prestressing force stabilized. Test specimens used the same anchorage details that were used for the one-million-hour creep rupture test with a reusable chuck on one end and a steel sleeve with the epoxy on the other end. This configuration included welding the strand to the anchor to prevent any slippage. The test setup for the relaxation losses test is illustrated schematically in Figure 11. The test setup resembles a one-million-hour test for creep rupture. However, since strand rupture was not expected, the strand was anchored between two steel frames so a linear variable differential transformer (LVDT) could be attached to the strand to monitor strain more precisely; a strain gauge was also attached to a wire for an additional strain reading. Load in the strand was monitored using a load cell. Photographs of a frame assembled for the relaxation test, along with labels on the parts of the test apparatus, are shown in Figure 12.
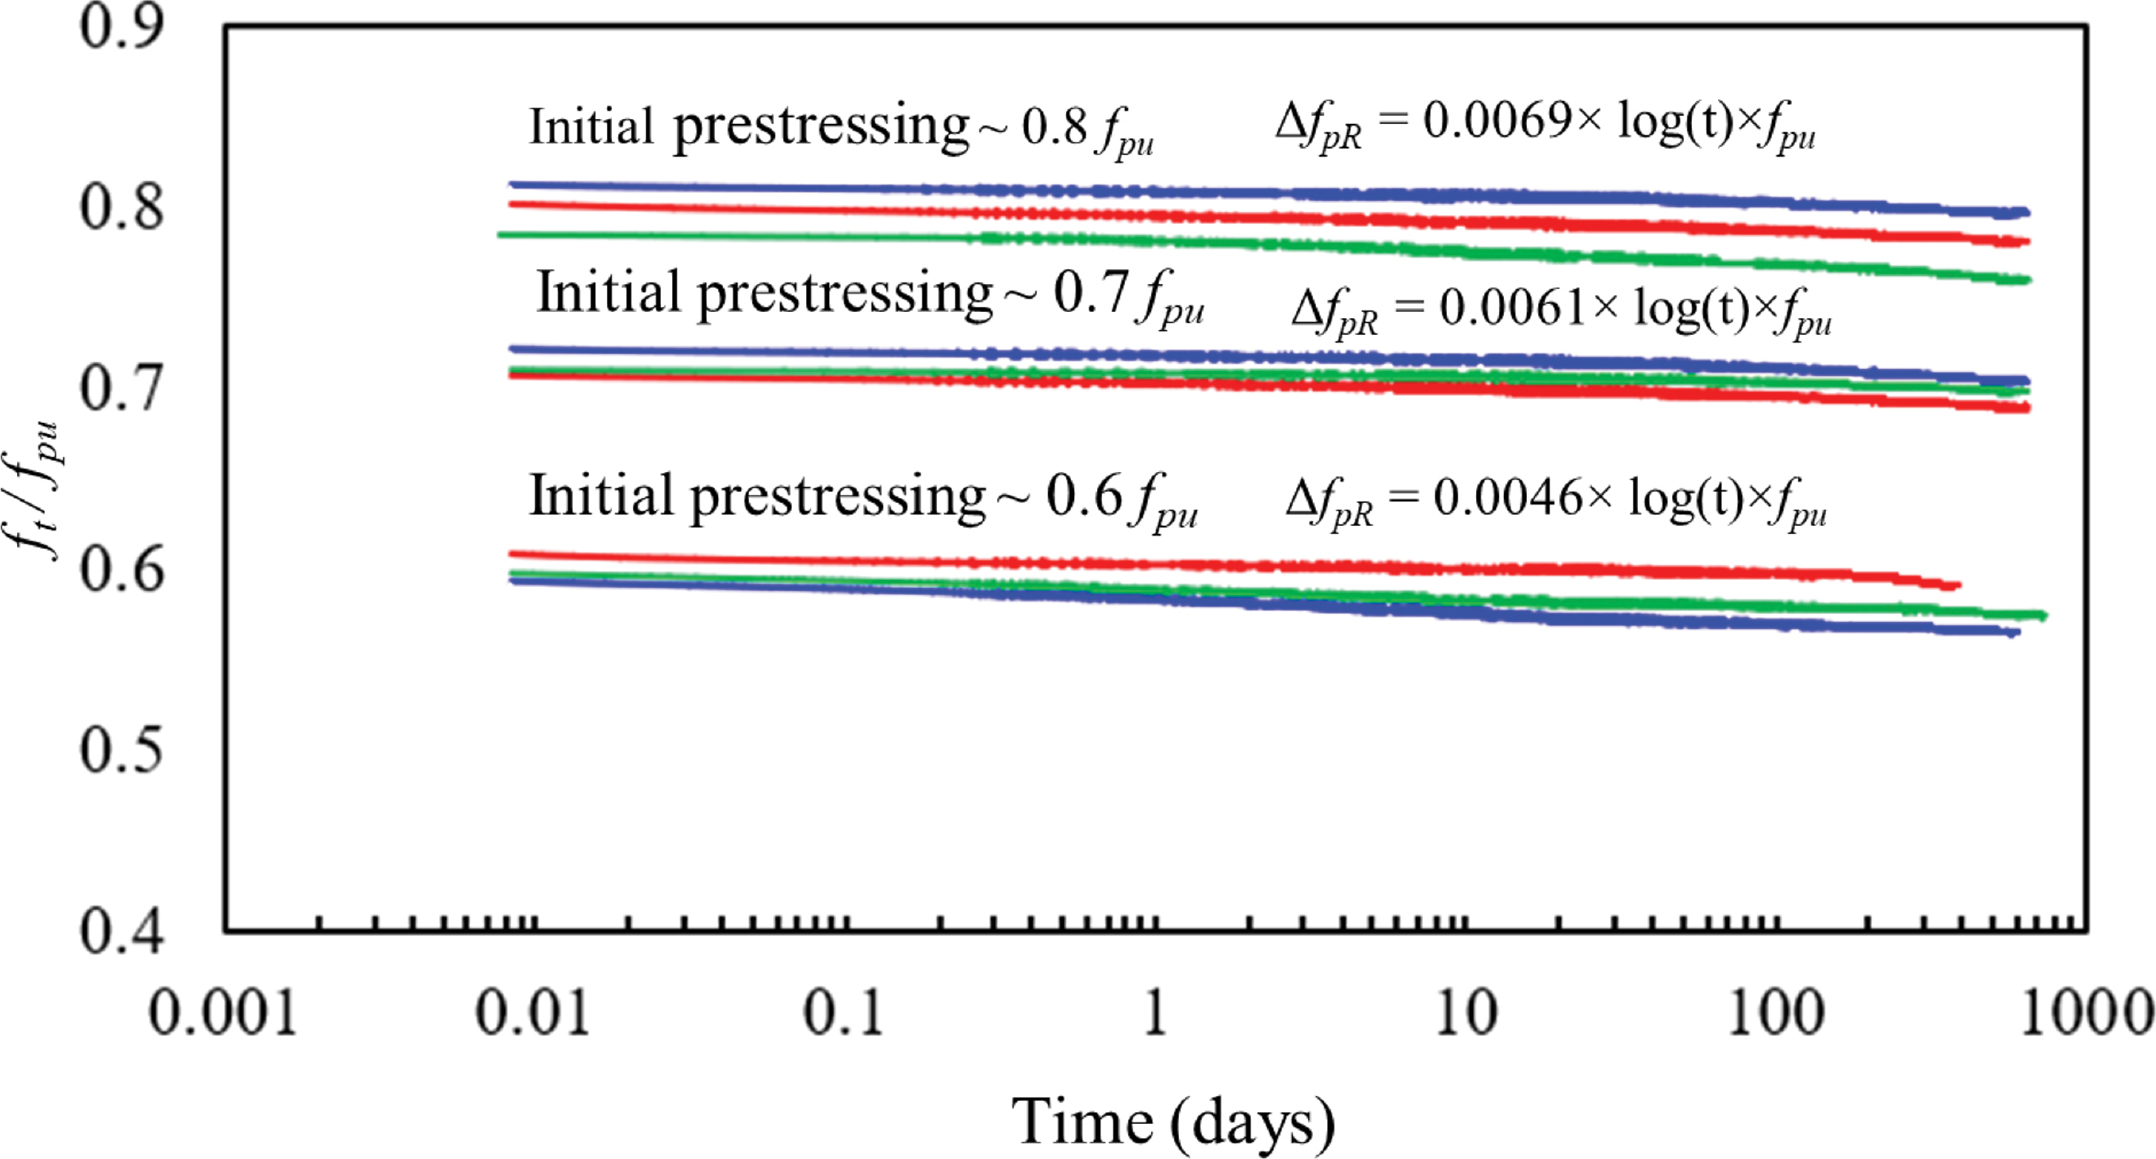
Figure 13 shows the combined results for all nine relaxation samples as well as a formula for measured relaxation losses based on the average trend line for the results of the three samples for each prestressing level. The proposed formulas are based on a logarithmic time scale where time, t, is the number of days since prestressing. The relaxation loss among specimens with the same target initial prestressing level (i.e., test repetitions) showed slight variations in actual initial stress, but all remained within a consistent range.
Long Description.
The diagram shows a test frame for evaluating relaxation loss in stainless steel strands. The setup includes a welded end with a nut and a small nut on the left, securing one end of the strand. A 15 inch segment from the weld is marked, followed by a central span containing a strain gauge and an LVDT sensor placed along the strand. Two aluminum brackets are fixed under the strand to support the LVDTs. On the right end, the strand is anchored into a chuck connected to a load cell for measuring force. Section A-A provides a cross-sectional view showing two square frames, each 5 inches wide and spaced 2.6 inches apart. The strand passes through an anchor socket of 1 inch and 1.167 inch inner and outer diameter, respectively (filled with high-strength epoxy resin (Magmaflow Grout-Pak CF)). The entire frame is enclosed between two vertical supports.
Long Description.
The test frame measures relaxation loss in a 0.62 inch high-strength stainless steel strand under 60 percent of ultimate stress. The top view includes a hydraulic jack mounted to a jacking frame, which is connected to hollow structural sections. The stainless steel strand passes through the frame and is equipped with an LVDT and strain gauge. The lower left close-up shows a prestressing rod secured with a coupler and a high-strength epoxy anchor with external threads. The lower right close-up shows the load cell and chuck gripping the strand, which is welded to the steel plate at the frameʼs end. A steel bar links the hollow structural sections. Each component is labeled to show its role in applying and measuring stress during the test.
Long Description.
The graph presents the ratio of force to ultimate stress f over f sub p u on the vertical axis and time in days on a logarithmic horizontal axis from 0.001 to 1000. Three grouped trend lines show relaxation behavior for stainless steel strands under initial prestressing of 0.8, 0.7, and 0.6 times f sub p u, where f sub p u equals 270 k s i. Each group is fitted with an equation for relaxation loss delta f sub p R, calculated as 0.0069 times log of t times f sub p u for 0.8 f sub p u, 0.0061 times log of t times f sub p u for 0.7 f sub p u, and 0.0046 times log of t times f sub p u for 0.6 f sub p u. The stress ratio gradually decreases over time, with higher initial prestress levels showing slightly faster reductions. Multiple colored curves in each group represent individual test samples.
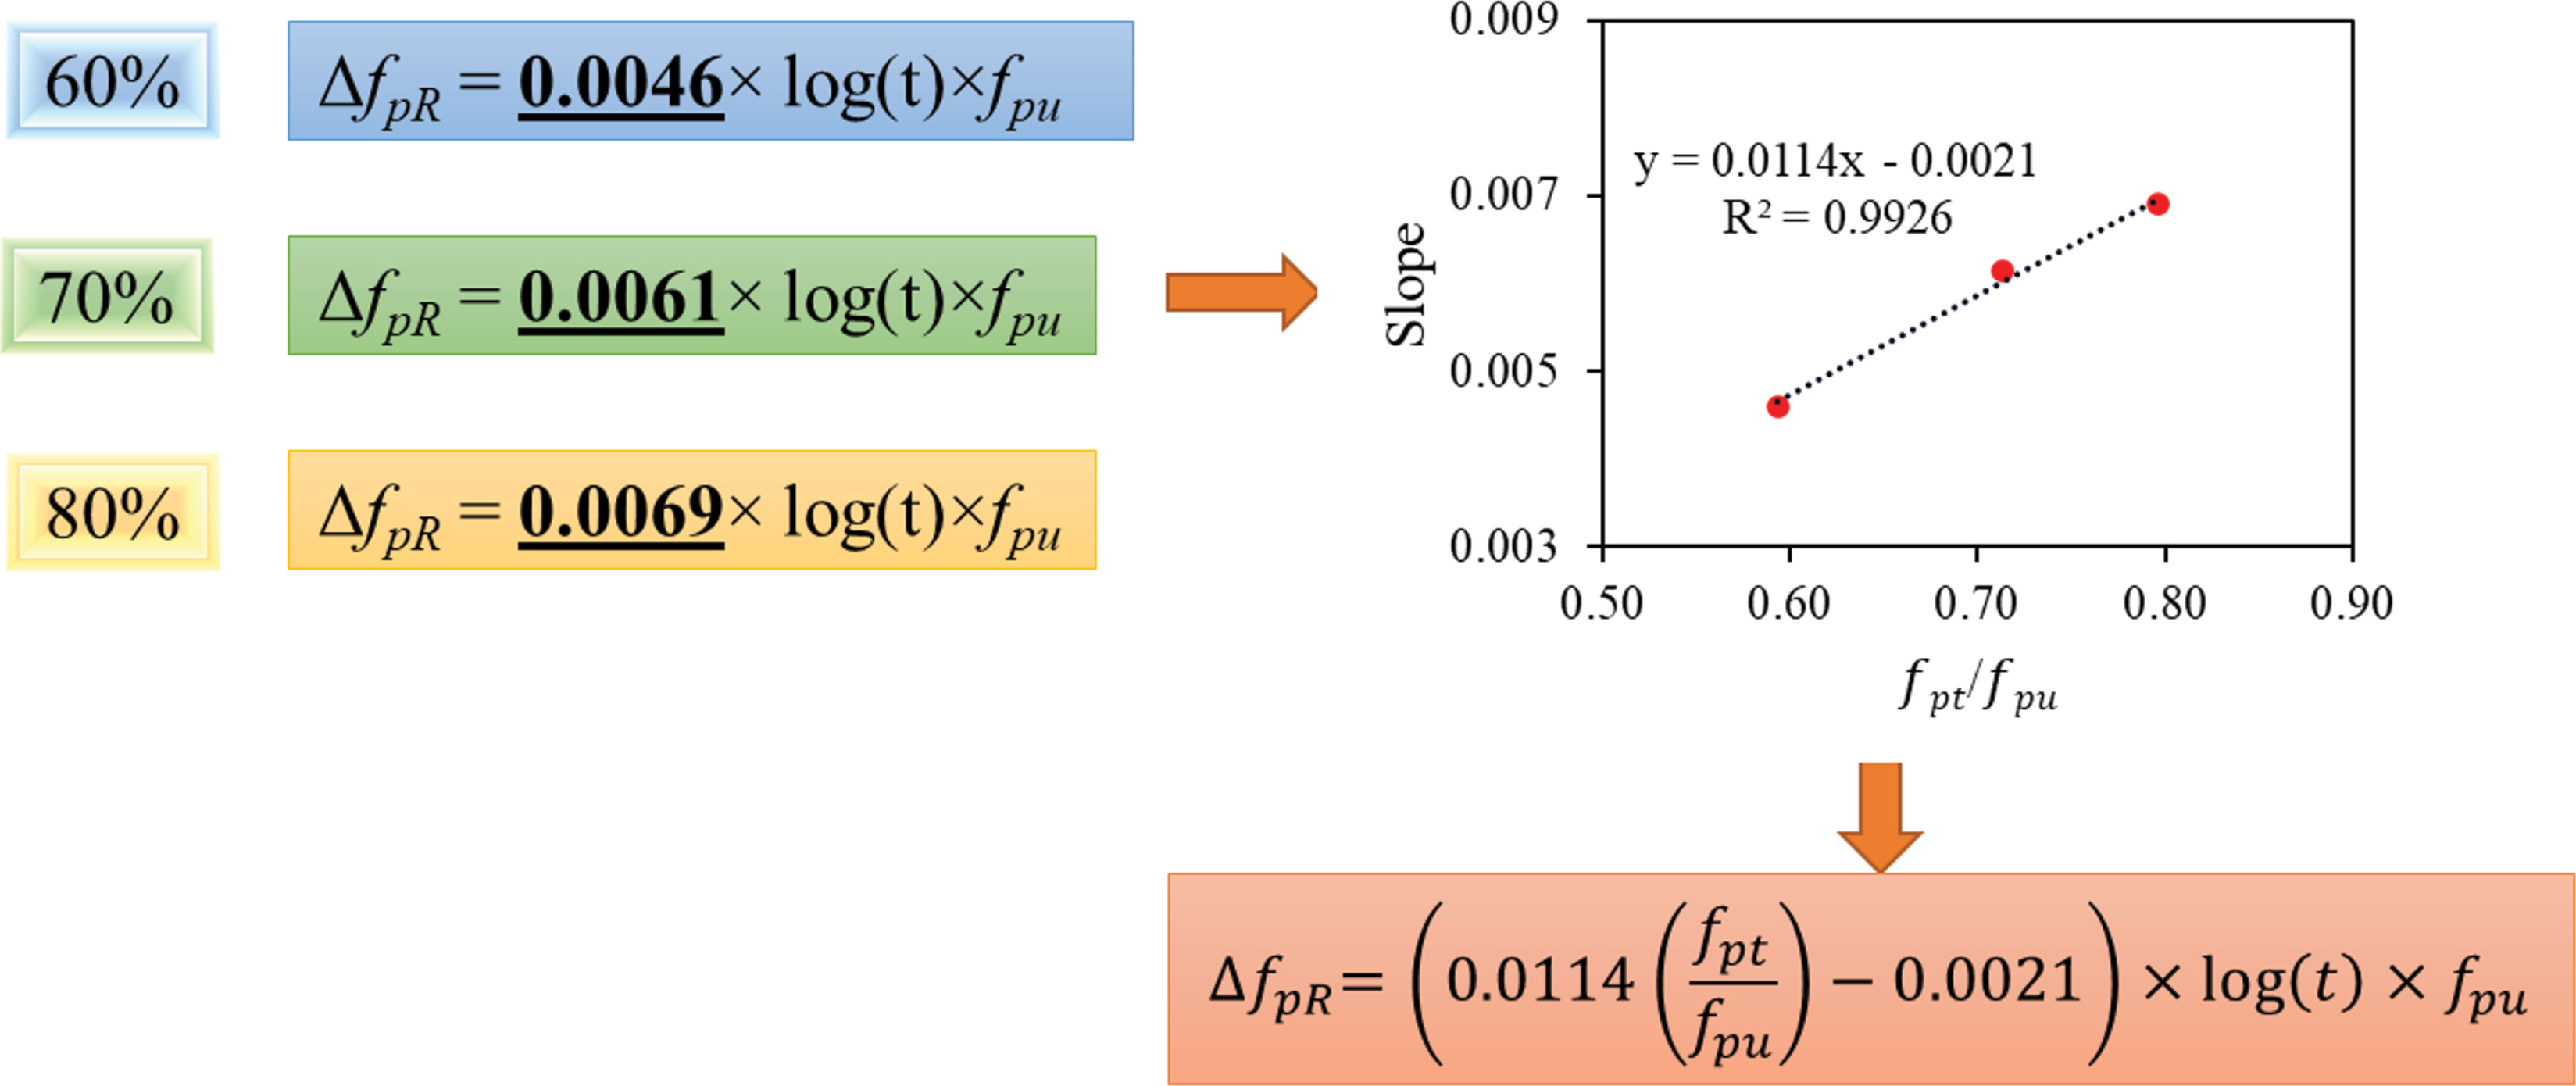
The prestress loss due to relaxation of the SS strands (ΔfpR) for each initial stress level was determined based on experimental results and regression analysis. Figure 14 presents relaxation loss equations for each prestress level, and a single equation that incorporates the relaxation tests for stress levels of 60% to 80% of the tensile strength.
Based on these results, it is recommended that the prestress loss due to relaxation of the SS strands (ΔfpR) shall be determined by the following equation:

Long Description.
delta f sub p R equals open parenthesis 0.0114 times f sub p t over f sub p u minus 0.0021 close parenthesis times log of t times f sub p u.
where
fpt = stress in prestressing strands immediately after the transfer,
fpu = ultimate strength of prestressing, and
t = time immediately after prestress transfer (days).
Long Description.
The illustration presents relaxation loss equations for stainless steel strands at three initial prestress levels and derives a general formula. On the left, relaxation loss delta f sub p R equals 0.0046 times log of t times f sub p u for 60 percent, 0.0061 times log of t times f sub p u for 70 percent, and 0.0069 times log of t times f sub p u for 80 percent. An arrow points to a plot in the center, which shows the variation of slope values versus the ratio of f sub p t to f sub p u. The best fit equation is y equals 0.0114 x minus 0.0021 with an R squared value of 0.9926. An arrow points from the plot to a generalized equation derived as delta f sub p R equals open parenthesis 0.0114 times open parenthesis f sub p t over f sub p u close parenthesis minus 0.0021 close parenthesis times log of t times f sub p u. This captures the relationship between relaxation loss and different initial stress levels.
According to ASTM A1114, SS prestressing strands must exhibit relaxation losses no greater than 2.5% when initially stressed to 70% of their specified minimum breaking strength, and no more than 3.5% when stressed to 80%, after 1,000 hours of testing. For the strands tested at 70% and 80% of the measured breaking strength, the measured relaxation losses are 1.36% and 1.42%, respectively; these values are well within the limits required by ASTM A1114. The strand manufacturer provided a test result of 1.30% relaxation loss after 200 hours for strands initially stressed to 70%; with extrapolation from this measured value, the relaxation loss after 1,000 hours is expected to equal 1.30%, also within the ASTM A1114 limit.
Two additional samples that were initially stressed to 50% showed less relaxation loss compared to samples initially stressed to 60% (the loss for strands stressed to 60% is 3.6 times the value for 50%). Additionally, the ratio of the losses between 70% and 60%, and between 80% and 70%, are 1.33 and 1.12, respectively. Details of all tests and results are presented in Appendix B.
LRFD BDS Article 5.9.3.4.2c provides Eq. 3 for computing the relaxation prestress loss between the time of transfer and deck placement, ∆fpR1, based on the Tadros et al. (2003) study. This equation was used to confirm that a KL factor of 30 can also be used for SS low-relaxation strands. Therefore, LRFD BDS Eq. 5.9.3.4.2c-1 can be used for SS prestressing strands:

Long Description.
delta f sub p R 1 equals f sub p t over K sub L times the quantity f sub p t over f sub p y minus 0.55
where
fpy = yield strength of SS prestressing strands;
fpt = stress in prestressing strands immediately after transfer, taken as not less than 0.55fpy; and
KL = factor accounting for type of steel taken as 30 for low-relaxation SS prestressing strands.
3.4.1.2 Friction Losses
According to AASHTOʼs LRFD BDS, the prestress loss due to friction (∆fpF) can be obtained from the following equation:

Long Description.
delta f sub p F equals f sub p j times the quantity one minus e to the power of negative open parenthesis K x plus mu alpha close parenthesis.
where µ is the coefficient of friction, K is the wobble friction coefficient per unit length of tendon (per ft), fpj is the jacking stress (ksi), α is the total angular change between the jacking point and dead end (rad.), and x is the total length of the prestressing SS strands from the jacking end to the dead end (ft).
To obtain the wobble and friction coefficient, friction tests were conducted on three full-scale posttensioned girders prestressed using 0.62 in. diameter SS strands and round corrugated plastic (polyethylene) duct. The wobble friction coefficient was conducted on straight prestressing SS strands (total angular change = 0). Load cells were used to monitor the prestressing force at jacking and dead ends of the SS prestressing strands during jacking. Tensioning data for five SS prestressing strands were used to determine the wobble coefficient. Based on the experimental results, the average value of the wobble coefficient was determined as 0.00127 (per ft) for SS strands in a round corrugated plastic (polyethylene) duct.
Following the determination of the wobble coefficient for SS strands, friction tests were carried out on four draped SS prestressing strands. The total angular change, α, between the jacking and dead ends was measured at 0.17 rad. Based on the experimental data, the average friction coefficient, µ, for the SS strands was found to be 0.21. Further details of the testing procedures and results are provided in Appendix B.
3.4.2 Bond Characteristics
Stainless steel prestressing strands have different surface textures, chemical compositions, and mechanical properties from conventional strands. Therefore, the bond of SS strands to concrete is relevant for this study. The objective of the current section is first to establish the adequacy of the bond of the 0.62 in. diameter SS strands used in this study to concrete by performing pull-out tests on strand samples according to ASTM A1081 (ASTM International, 2015a) and then comparing the results to available results from other studies (for both SS and conventional steel strands) as well as available acceptance criteria. Furthermore, to derive more information on the relationship of the bond of the SS strand to concrete of varying strengths, further tests were performed following ASTM A1081 procedures except concrete was used in lieu of mortar as was done by Ramirez and Russell (2008).
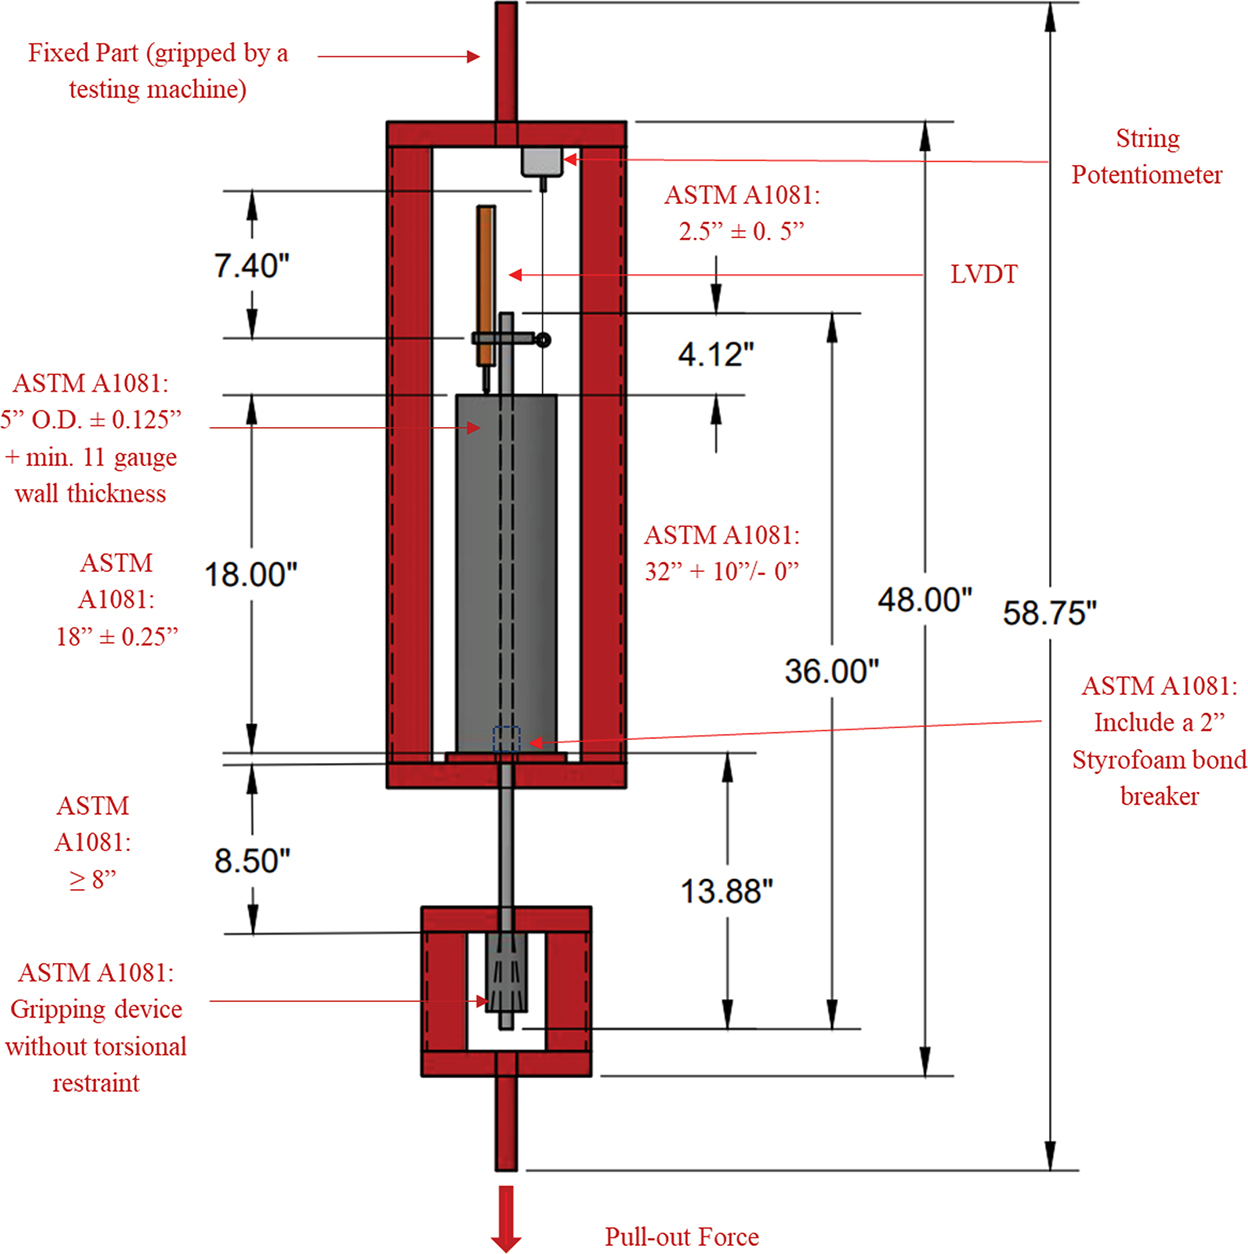
The test frame was designed to meet the dimensional requirements outlined in ASTM A1081 for the test apparatus, accounting for the required free length of the strand and the lack of torsional restraint in the gripping device. A schematic representation of the test frame and test setup is shown in Figure 15.
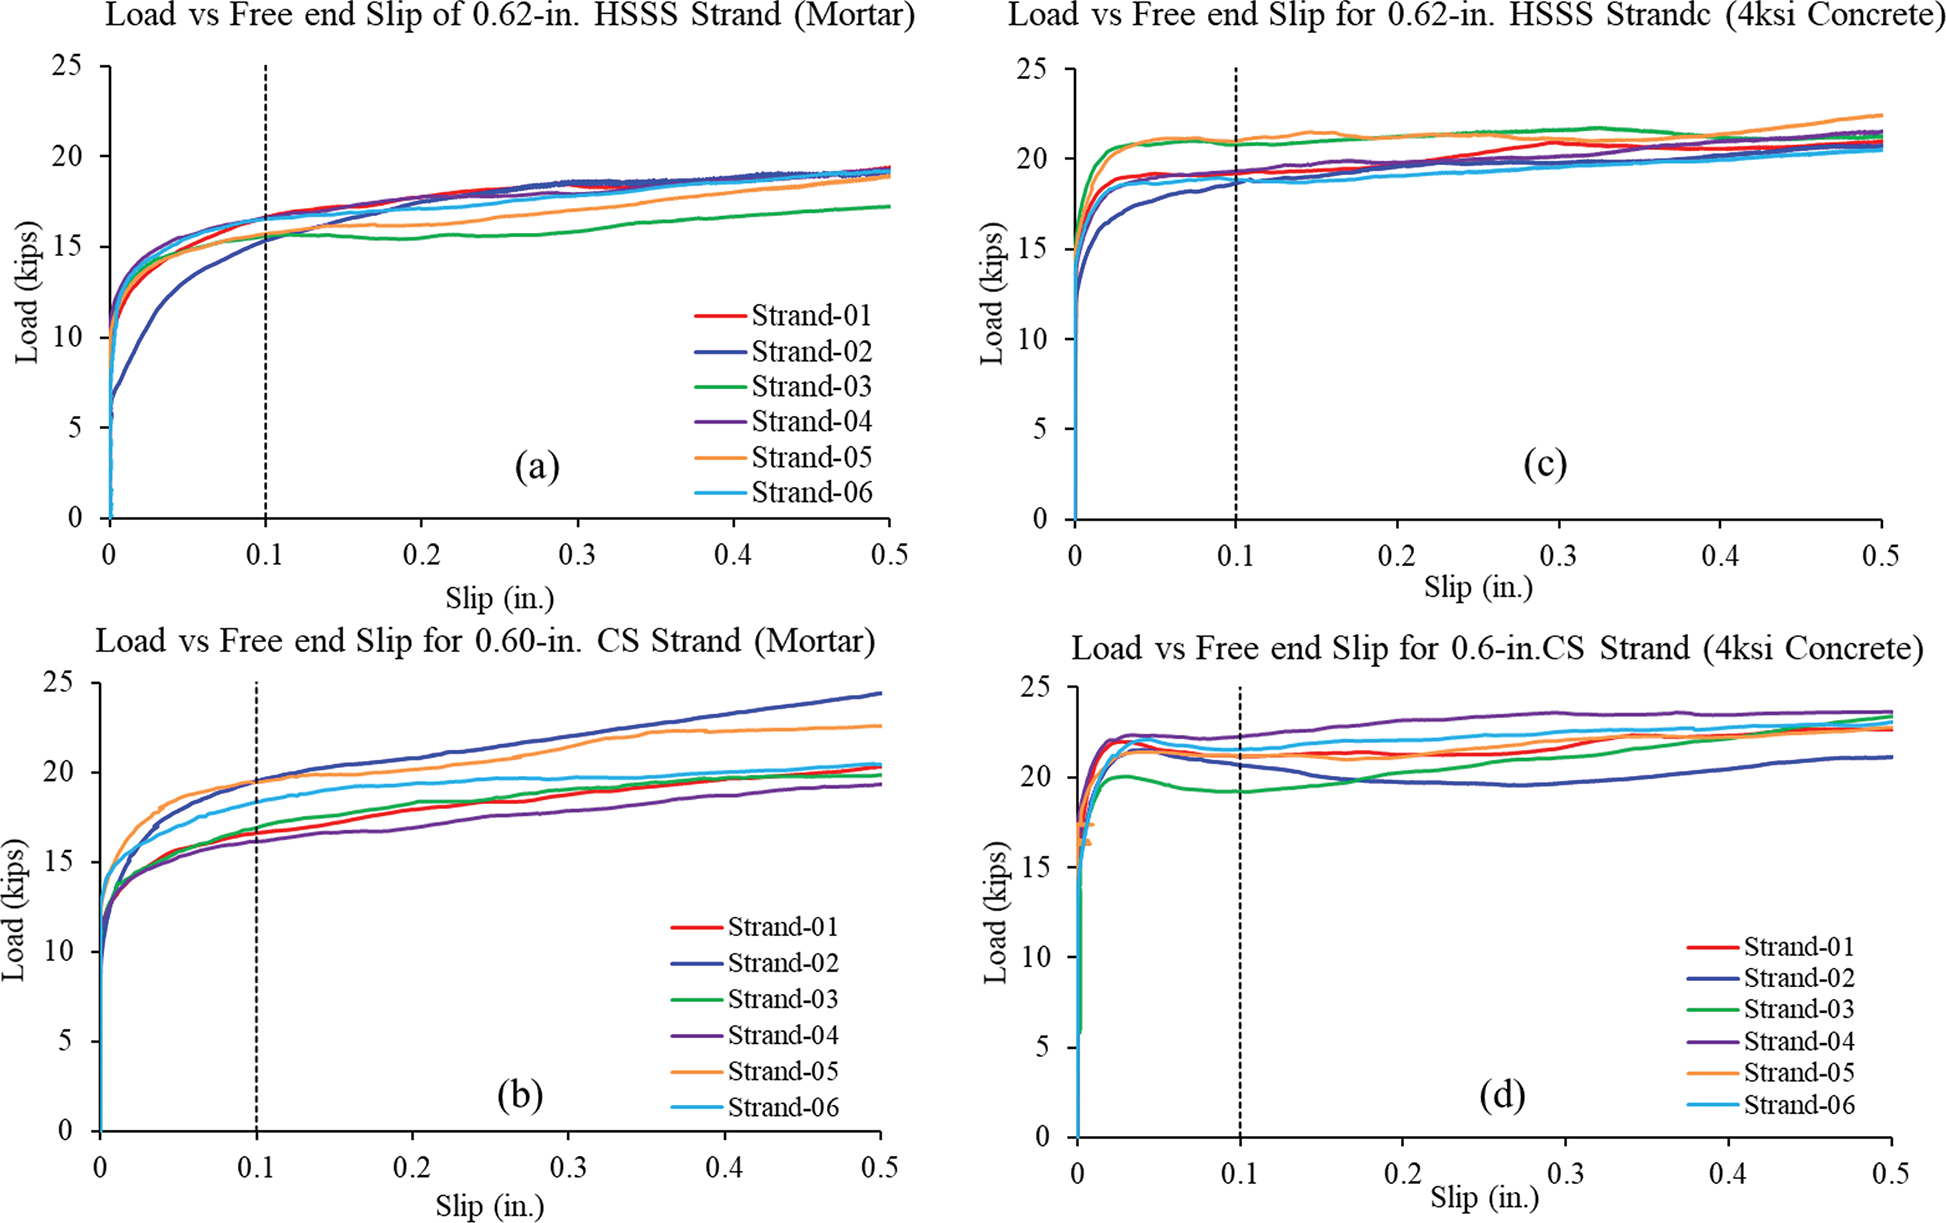
Figure 16a and Figure 16b display the load-slip curves for both SS and CS strands within the range of slip reported by other researchers (Tessema, 2006; Ramirez and Russell, 2008; Rambo-Roddenberry and Al-Kaimakchi, 2020). According to the Precast/Prestressed Concrete Institute (PCI) task groupʼs specifications, the minimum ASTM A1081 value is required to be satisfied for both the SS and CS strands (for mortar samples). Therefore, it can be confidently concluded that the 0.62 in. diameter SS strands used in this study indeed meet the criteria for acceptable bond strength (details of the tests and results are presented in Appendix B).
Long Description.
The diagram shows a vertical pull-out test frame setup complying with ASTM International A 1 0 8 1 standards. A fixed upper part is gripped by a testing machine, and a pull-out force is applied downward through the specimen. The outer tube is 5 inches in outer diameter with 11 gauge wall thickness and a total height of 58.75 inches. Inside, the bonded length is 32 inches with a tolerance of plus 0 or minus 1 inch. A 2 inch Styrofoam bond breaker is placed at the bottom end of the bonded zone. The embedment depth is 36 inches, and the steel bar section length above the bond zone is 18 inches with a tolerance of plus or minus 0.25 inches. The gripping device is at least 8 inches long and must permit rotation without torsional restraint. A linear variable differential transformer, labeled LVDT, and a string potentiometer are mounted at the top for displacement measurement. A vertical scale marks all key measurements in inches, including 13.88 inches from the bottom of the gripping device to the bond zone. The frame and instrumentation are annotated with labels specifying ASTM International dimensions and installation notes.
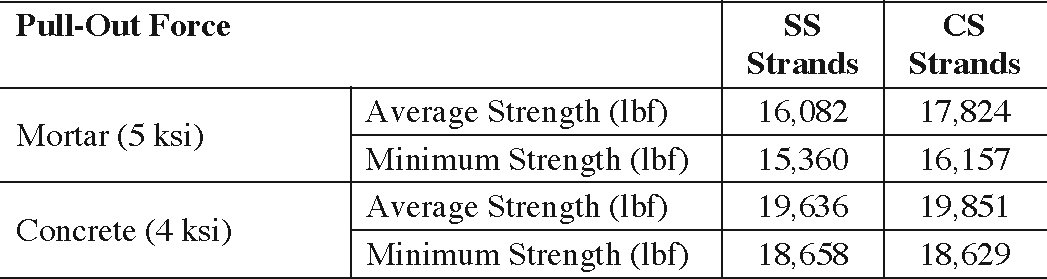
It is important to note that for both the SS and CS strands, the minimum and average bond strengths at a 0.1 in. displacement using 4 ksi concrete (see Figure 16) are nearly identical, as shown in Table 6. This similarity indicates that both the SS and CS strands exhibit comparable bond strength characteristics, confirming using the same friction coefficient when calibrating the transfer length results for both strands.
3.4.3 Transfer and Development Lengths
3.4.3.1 Transfer Length
Transfer length is defined in LRFD BDS Article 5.2 as “the length over which the pretensioning force is transferred to the concrete by bond and friction in a pretensioned member” and may be taken as 60 strand diameters (LRFD BDS Article 5.9.4.3.1). One of the goals of this study was
Long Description.
Four graphs for load versus free-end slip, each plotting load in kips on the vertical axis from 0 to 25 and slip in inches on the horizontal axis from negative 0.1 to 0.5. Graph A displays six stainless-steel strands in mortar that rise steeply to about 15 kips by 0.05 inch, then increase gradually toward 20 kips by 0.4 inch; a vertical dashed line marks 0.1 inch slip. Graph b shows six carbon-steel strands in mortar following a similar pattern but reaching roughly 18 kips at 0.4 inches. Graph C plots six stainless-steel strands in 4 ksi concrete that climb quickly to about 17 kips by 0.05 inch and level near 22 kips by 0.4 inch, again with a dashed line at 0.1 inches. Graph D depicts six carbon-steel strands in 4 ksi concrete that increase to around 16 kips by 0.05 inch and approach 20 kips by 0.4 inches. All series flatten beyond 0.1 inch slip, and the dashed line indicates the slip value used for results reported in Table 6.
Long Description.
The table presents pull-out force values at 0.1 inch slip for two strand types, stainless steel strand and carbon steel strand, embedded in mortar with 5 ksi strength and concrete with 4 ksi strength. Under mortar 5 ksi, the average strength is 16,082 pounds force for stainless steel strand and 17,824 pounds force for carbon steel strand. The minimum strength is 15,360 pounds force for stainless steel strand and 16,157 pounds force for carbon steel strand. Under concrete 4 ksi, the average strength is 19636 pounds force for stainless steel strand and 19,851 pounds force for carbon steel strand. The minimum strength is 18,658 pounds force for stainless steel strand and 18,629 pounds force for carbon steel strand.
to experimentally determine the transfer length of SS strands since it is an important design parameter. To achieve this objective, an experimental program was conducted that included tests of both small-scale rectangular cross-sections and large-scale AASHTO Type I girders.
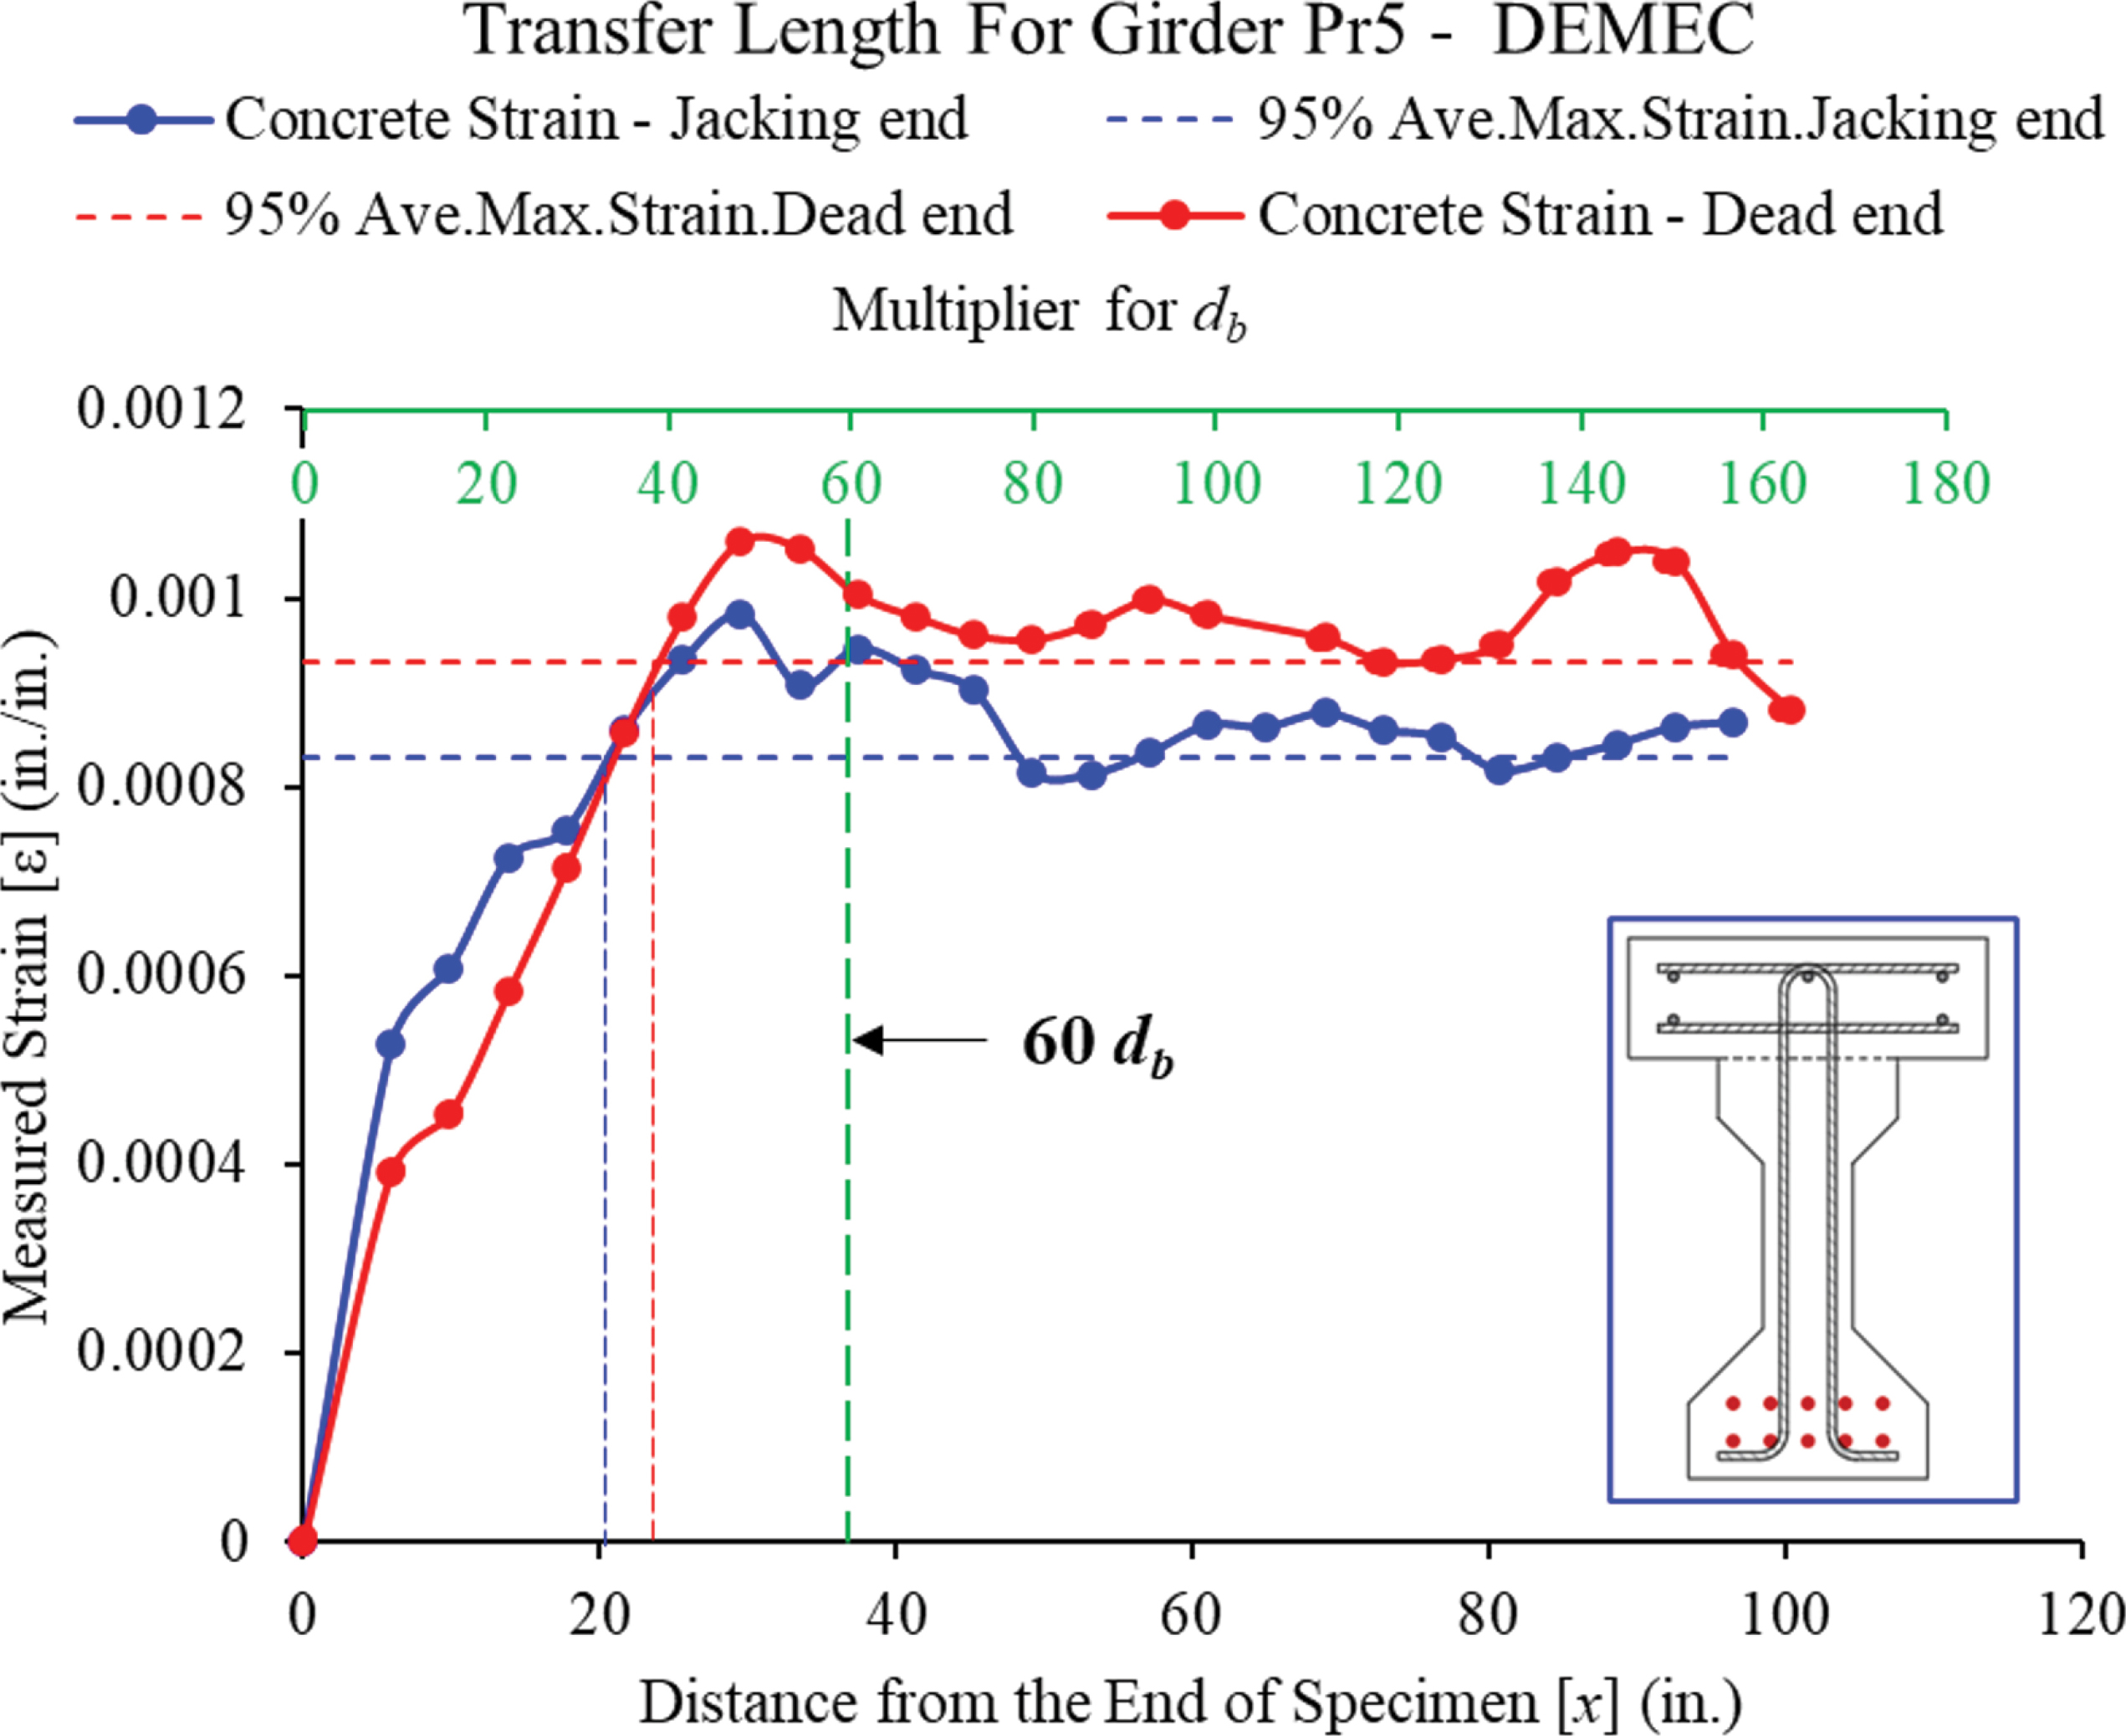
The measured transfer length of each specimen was obtained using a smoothed concrete strain profile obtained from the demountable mechanical strain gauge (DEMEC) measurements and the 95% average maximum strain (AMS) method (Oh and Kim, 2000). Concrete strain measurements used to establish the transfer length for one of the girders tested are shown in Figure 17 (Stefaniuk et al., 2025). More detailed results are provided in Appendix B.
Test results for pretensioned girders with SS prestressing strands indicate that the transfer lengths of these strands were similar to transfer lengths for carbon steel prestressing strands. It is important to note that the measured transfer lengths for SS prestressing strands were less than the transfer length computed using the provisions of the LRFD BDS. Therefore, it is recommended that the LRFD BDS expression for transfer length be used for SS prestressing strands.
3.4.3.2 Development Length
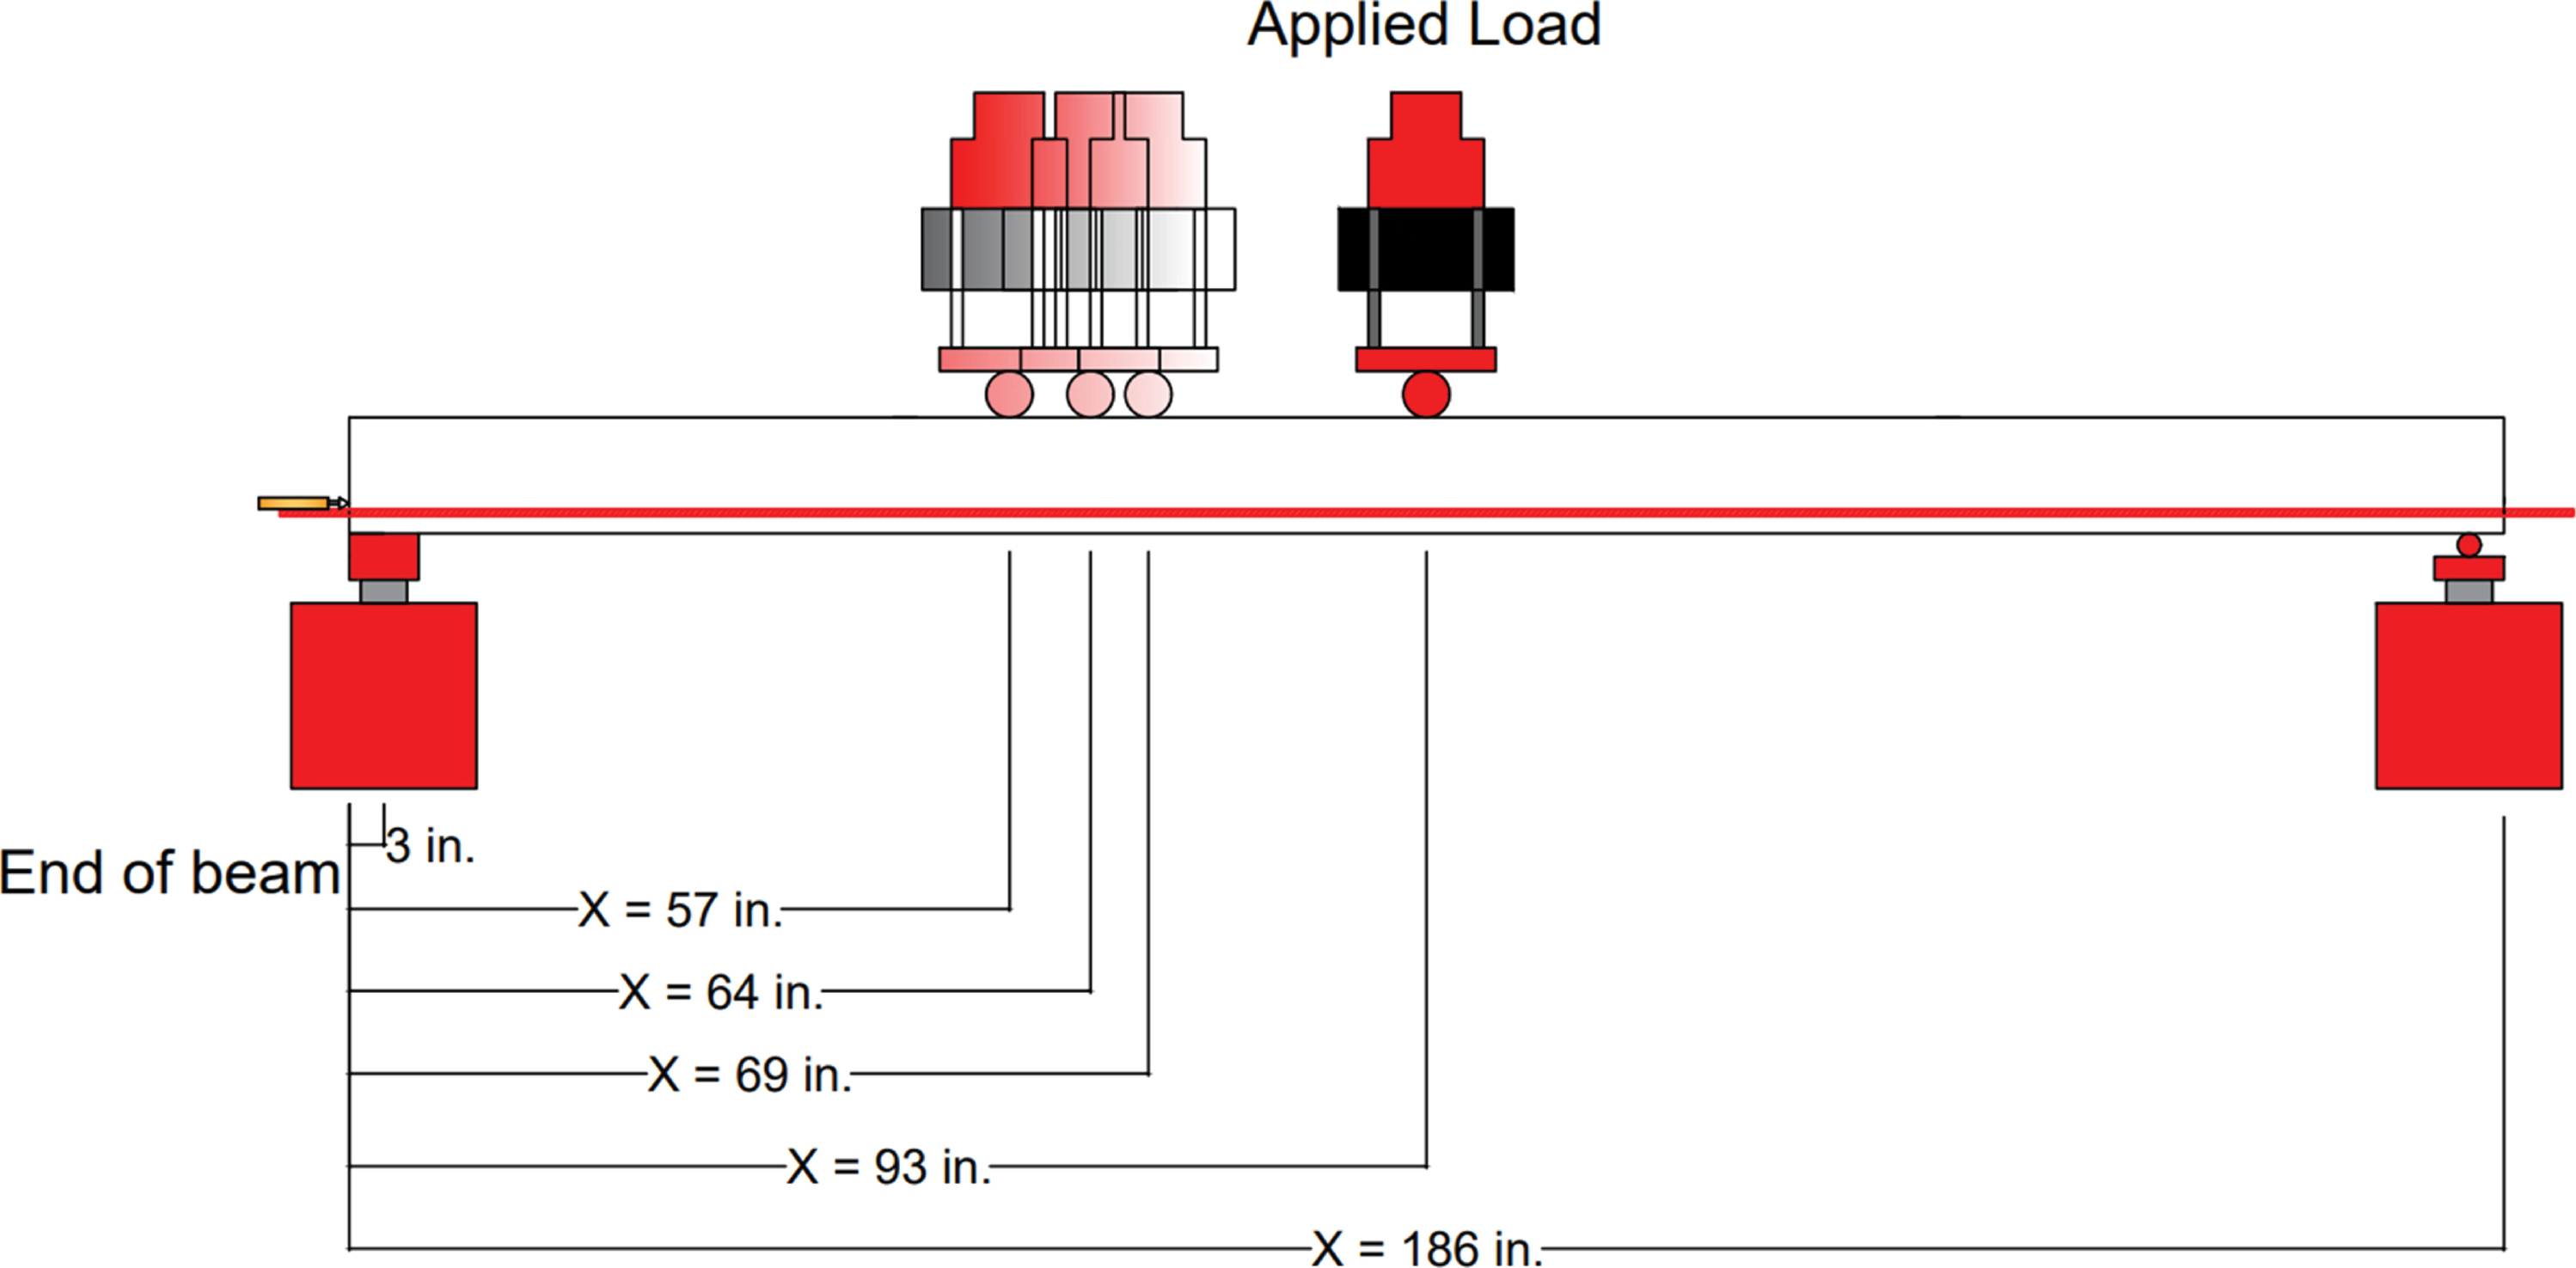
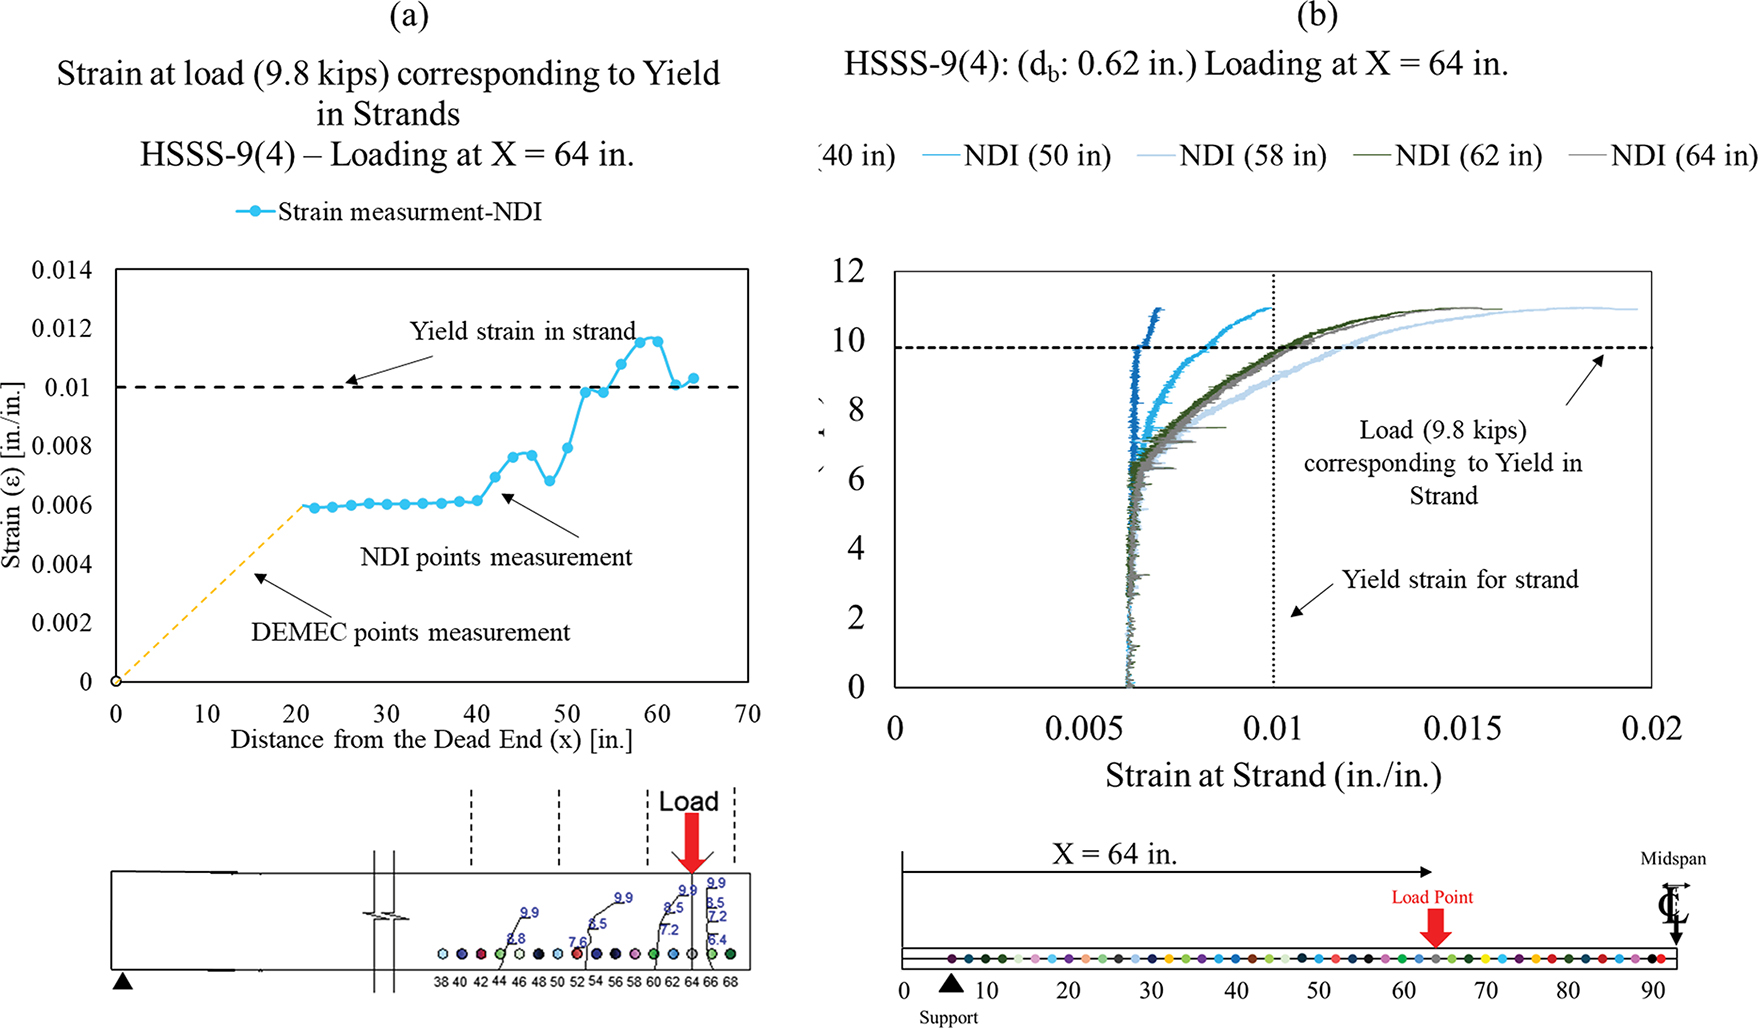
To evaluate the development lengths of SS strands, an experimental program was conducted on both SS and CS strands. A total of 10 small-scale beams were tested using both carbon steel and SS strands with the same level of prestressing and two concrete strengths (4.5 ksi and 9.0 ksi). The load was applied at different distances from the support to establish the minimum embedment length required to fully develop the strand (Figure 18).
Typical strain measurements and results for a beam with 9 ksi concrete strength that is prestressed with SS strands and tested for a 64 in. embedment length are shown in Figure 19. The Northern Digital Inc. (NDI) Optotrak system (a 3D noncontact displacement measurement system) strain measurements indicate that the strain in the strand was greater than the yield strain at locations between 58 and 64 in. from the end of the beam. At locations greater than 60 in. from
Long Description.
The graph depicts measured strain in inches per inch on the vertical axis and distance from the end of the specimen in inches on the horizontal axis. One solid line represents concrete strain at the jacking end, and another solid line represents concrete strain at the dead end. A dashed line marks 95 percent average maximum strain at the jacking end, and another dashed line marks 95 percent average maximum strain at the dead end. Both strain curves rise steeply near the origin and level off after approximately 20 inches. An arrow indicates a distance of 60 times the diameter b. The top axis provides a multiplier scale for diameter b in high-strength stainless steel strands. A small inset sketch on the lower right shows a concrete beam with prestressing strands and strain measuring points at both ends.
Long Description.
A schematic depicts a simply supported beam with one support near the left end and one near the right end. An applied load is positioned near the center of the beam. Measurement locations are labeled along the beam length. From the left, the end of the beam is marked. Following this, five positions are labeled with distances: x equals 3 inches, x equals 57 inches, x equals 64 inches, x equals 69 inches, x equals 93 inches, and x equals 186 inches. These positions are spaced along the bottom of the beam. The applied load sits between the positions labeled x equals 64 inches and x equals 93 inches. Both supports and load application points are shown as mechanical blocks under the beam.
Long Description.
Two graphs depict strain analysis for specimen high strength stainless steel 9 (4) with 9 ksi concrete strength and 64 inches embedment length. In section A on the left, the vertical axis represents strain at the strand in inches per inch, and the horizontal axis represents distance from the dead end in inches. Plotted points represent nondestructive inspection strain measurement points, and an orange line indicates DEMEC points. The data show a gradual increase in strain with a peak near 60 inches. A dashed horizontal line indicates the yield strain in the strand. In section B on the right, the vertical axis represents force in kips, and the horizontal axis represents strain at the strand in inches per inch. Multiple colored lines correspond to nondestructive inspection measurements taken at distances of 40 inches, 50 inches, 58 inches, 60 inches, and 64 inches. These curves show increasing force with strain until approximately 9.8 kips, which corresponds to yield strain in the strand. A horizontal dashed line marks the yield force. Below the graph labeled b, a schematic layout shows the beam with strain marker positions labeled in sequence along its bottom face, ranging from 0 inches to 90 inches. The load point is marked at 64 inches, and the support is shown near 0 inches. An arrow identifies the load point.
Long Description.
Two plots labeled a and b display normalized stress at strand as a function of distance from the end of the beam in inches and in diameter b units. In both graphs, the vertical axis is labeled normalized stress and the horizontal axis is labeled distance from the end of the beam. In plot A on the left, two curves represent experimental results: a line for carbon steel at 9 k s i and another line for stainless steel at 9 k s i. The normalized stress rises from 0 at the beam end to a plateau near 0.85 by 60 inches. In plot B on the right, both lines represent experimental results for carbon steel and stainless steel with 20 k s i strand stress. The trend mirrors that of plot a, with stress increasing steeply before leveling off beyond 60 inches. Both graphs use identical axes and legend labels, and both indicate the comparison between carbon steel and stainless steel strand performance in concrete with 9 k s i strength.
the end, the strain variation was affected by crack openings; however, no crack was observed between 54 and 60 in., as shown in Figure 19a. It is important to note that the increase in strain observed at 58 in. from the end of the beam, as shown in Figure 19b, also supported that yielding started at 58 in. The results indicate that the SS strand beam with 4.5 ksi concrete exhibits yielding between embedment length of 60 and 64 in., while the 9 ksi beam yields between 58 and 64 in. More detailed results are provided in Appendix B.
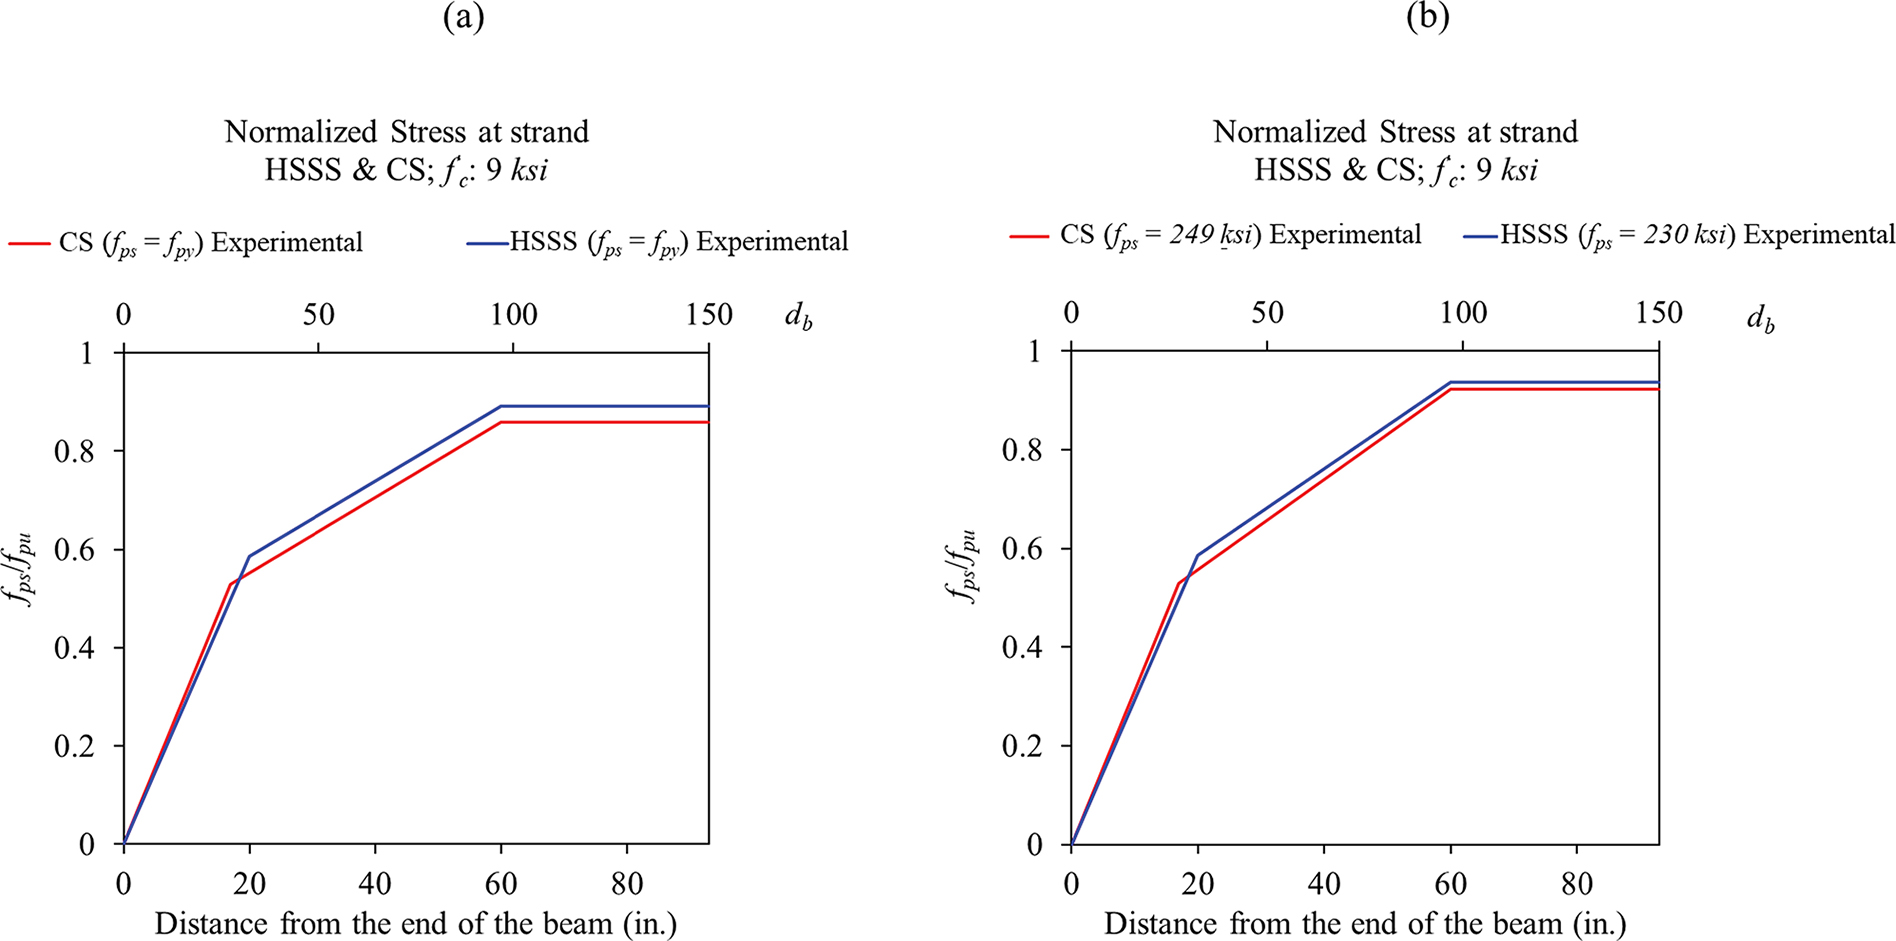
The bond between concrete and the strand is a critical factor influencing development length, which is affected by concrete strength (Zia and Mostafa, 1977; Abrishami and Mitchell, 1993; Mitchell et al., 1993; Ramirez and Russell, 2008). From this study, it can be concluded that the development lengths of CS and SS strands are similar due to their comparable bonding characteristics, as discussed in the bond test section of this report. As shown in Figure 20, it is clear that both CS and SS strands exhibit similar behavior in terms of transfer length and development length.
3.5 Full-Scale Girders Testing
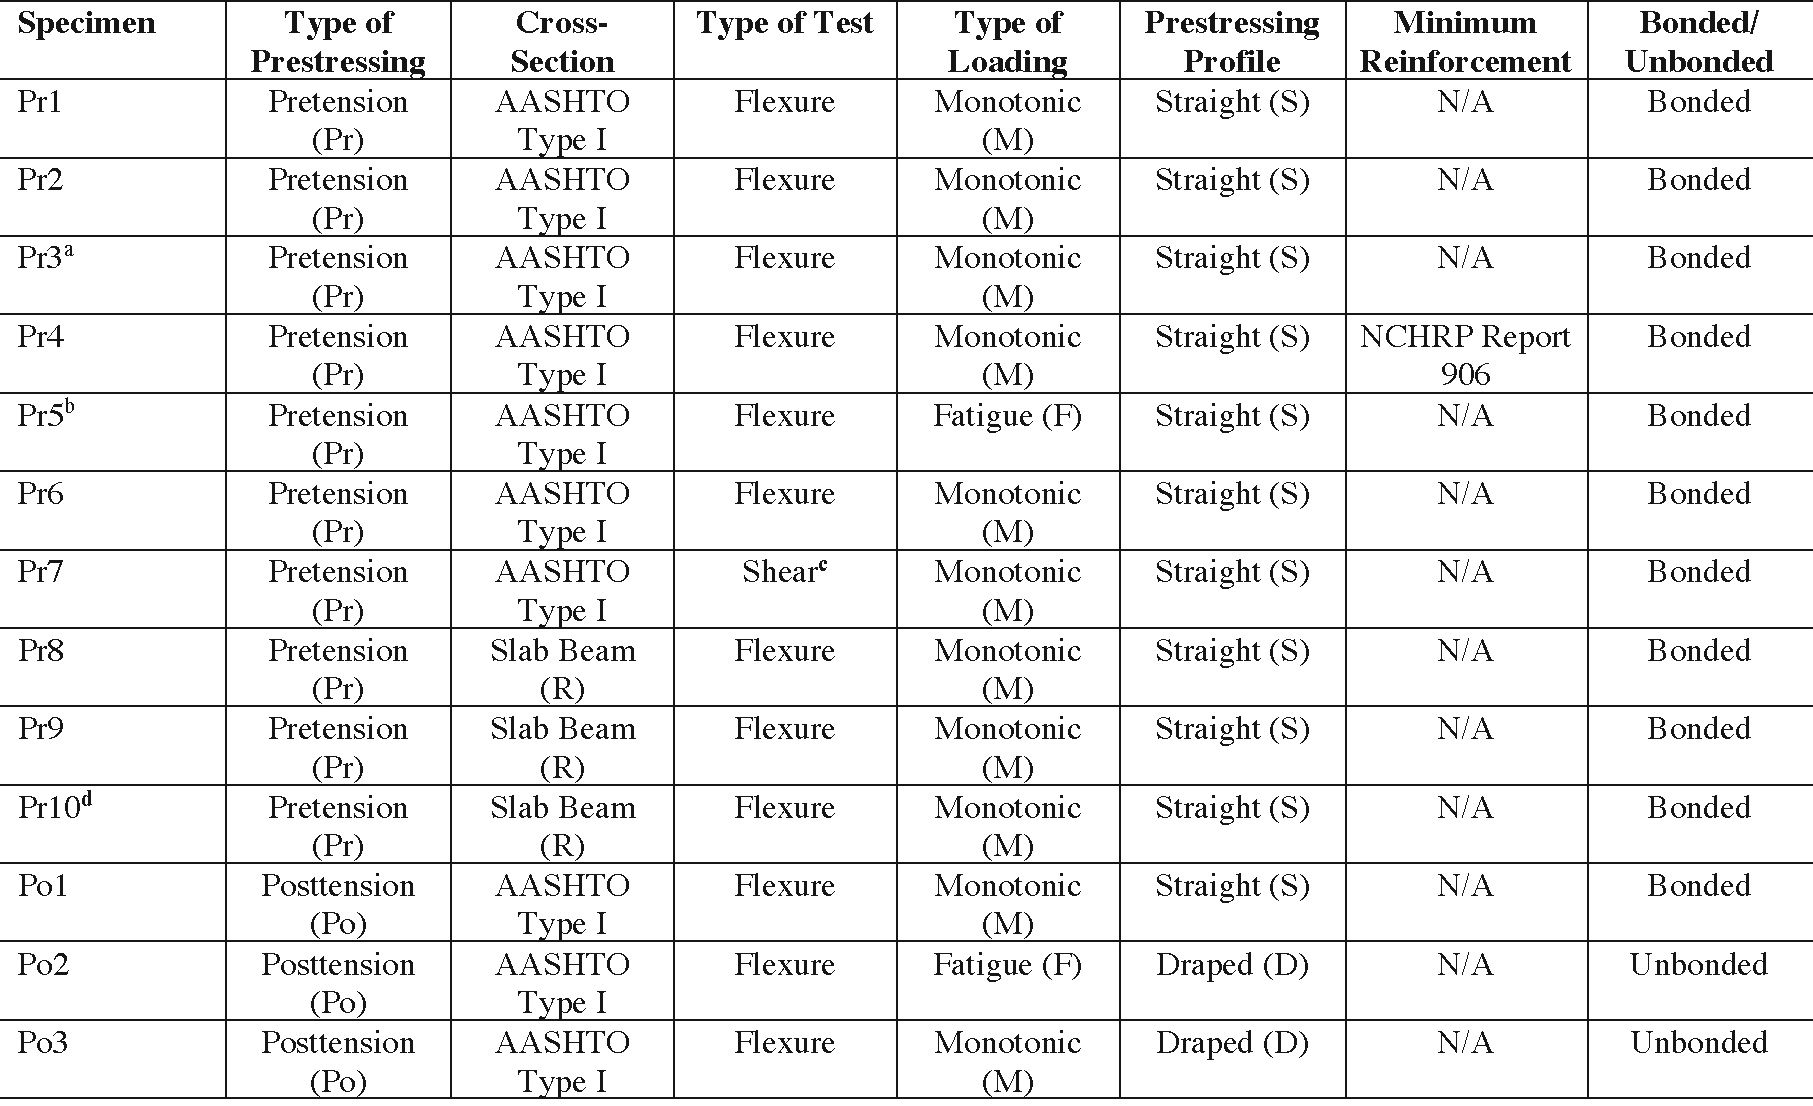
A series of full-scale I-girders (AASHTO Type I girders) and slab beams were designed, constructed, and tested in this experimental program to evaluate the flexural and shear performance of pretensioned and posttensioned beams. In addition, these full-scale specimens served several other purposes, such as providing an opportunity to measure prestress losses, camber, and transfer lengths, as indicated in Figure 2. The beams were 39.5 ft long and were tested under supported conditions to evaluate flexural and shear behavior. Table 7 shows the test matrix for the flexure and shear tests. Six pretensioned full-scale AASHTO Type I girders were tested under monotonic flexure loading conditions, except for Pr5, which was tested first under flexural fatigue loading conditions. One specimen, Pr7, was tested to evaluate shear behavior. In addition, two slab beams were constructed with 0.62 in. diameter
Note:
a. Over-reinforced to produce crushing of concrete without rupture of strands.
b. This test is a repetition for Specimen Pr1.
c. Two tests were performed on two ends. One end had straight SS strands and CS stirrups while the other end had straight SS strands and stainless-steel stirrups.
d. Reinforced with CS strands.
N/A: Not applicable.
Long Description.
The table includes 8 columns and 13 rows. The column headers are Specimen, Type of Prestressing, Cross-Section, Type of Test, Type of Loading, Prestressing Profile, Minimum Reinforcement, and Bonded or Unbonded. The row details are as follows: Row 1: P r 1, Pretension, AASHTO Type 1, Flexure, Monotonic, M, Straight, S, not applicable, Bonded. Row 2: P r 2, Pretension, AASHTO Type 1, Flexure, Monotonic, M, Straight, S, not applicable, Bonded. Row 3: P r 3 with note cue A, Pretension, AASHTO Type 1, Flexure, Monotonic, M, Straight, S, not applicable, Bonded. Row 4: P r 4, Pretension, AASHTO Type 1, Flexure, Monotonic, M, Straight, S, N C H R P Report 96, Bonded. Row 5: P r 5 with note cue B, Pretension, AASHTO Type 1, Flexure, Fatigue, F, Straight, S, not applicable, Bonded. Row 6: P r 6, Pretension, AASHTO Type 1, Flexure, Monotonic, M, Straight, S, not applicable, Bonded. Row 7: P r 7, Pretension, AAASHTO Type 1, Shear with note cue c, S, Monotonic, M, Straight, S, not applicable, Bonded. Row 8: P r 8, Slab Beam, R, AASHTO Type 1, Flexure, Monotonic, M, Straight, S, not applicable, Bonded. Row 9: P r 9, Slab Beam, R, AASHO Type 1, Flexure, Monotonic, M, Straight, S, not applicable, Bonded. Row 10: P r 10 with note cue d, Slab Beam, R, AASHO Type 1, Flexure, Fatigue, F, Straight, S, not applicable, Bonded. Row 11: P o 1, Post-tension, AASHTO Type 1, Flexure, Monotonic, M, Straight, S, not applicable, Bonded. Row 12: P o 2, Post-tension, AASHTO Type 1, Flexure, Monotonic, M, Draped, D, not applicable, Unbonded. Row 13: P o 3, Post-tension, AASHTO Type 1, Flexure, Fatigue, F, Draped, D, not applicable, Unbonded. Note A states that P r 3 was over-reinforced to produce crushing of concrete without rupture of strands. Note b states that the test for P r 5 is a repetition for specimen P r 1. Note c states that for P r 7, two tests were performed on two ends. One end had straight stainless steel strands and carbon steel stirrups while the other end had straight stainless steel strands and stainless steel stirrups.
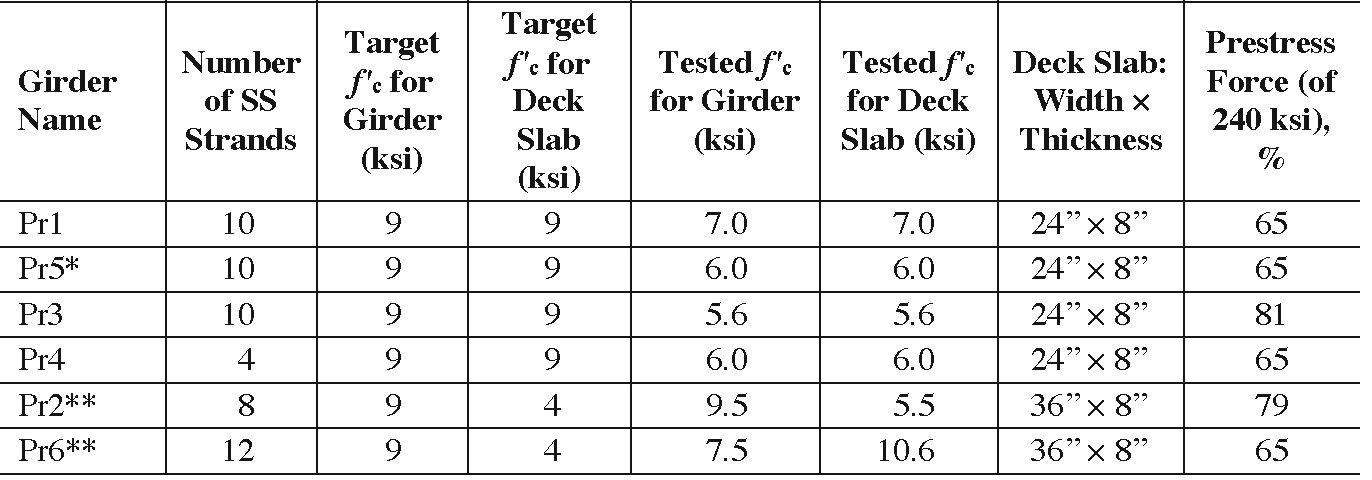
SS strands, and the third slab beam used 0.6 in. diameter CS strands for comparison purposes. The posttensioned beams were constructed with straight (bonded) and parabolic draped (unbonded) 0.62 in. diameter SS prestressing strands. For Girders Pr1, Pr3, Pr4, and Pr5, the deck slab was cast monolithically with the girder using a 24 in. deck width and an 8 in. deck thickness, while for specimens Pr2 and Pr6, the decks were cast on the girders later as separate (composite) pours. For all the posttensioned specimens, the deck slabs were cast on the girders later as separate (composite) placements (see Appendix B for more details).
3.5.1 Flexure Tests
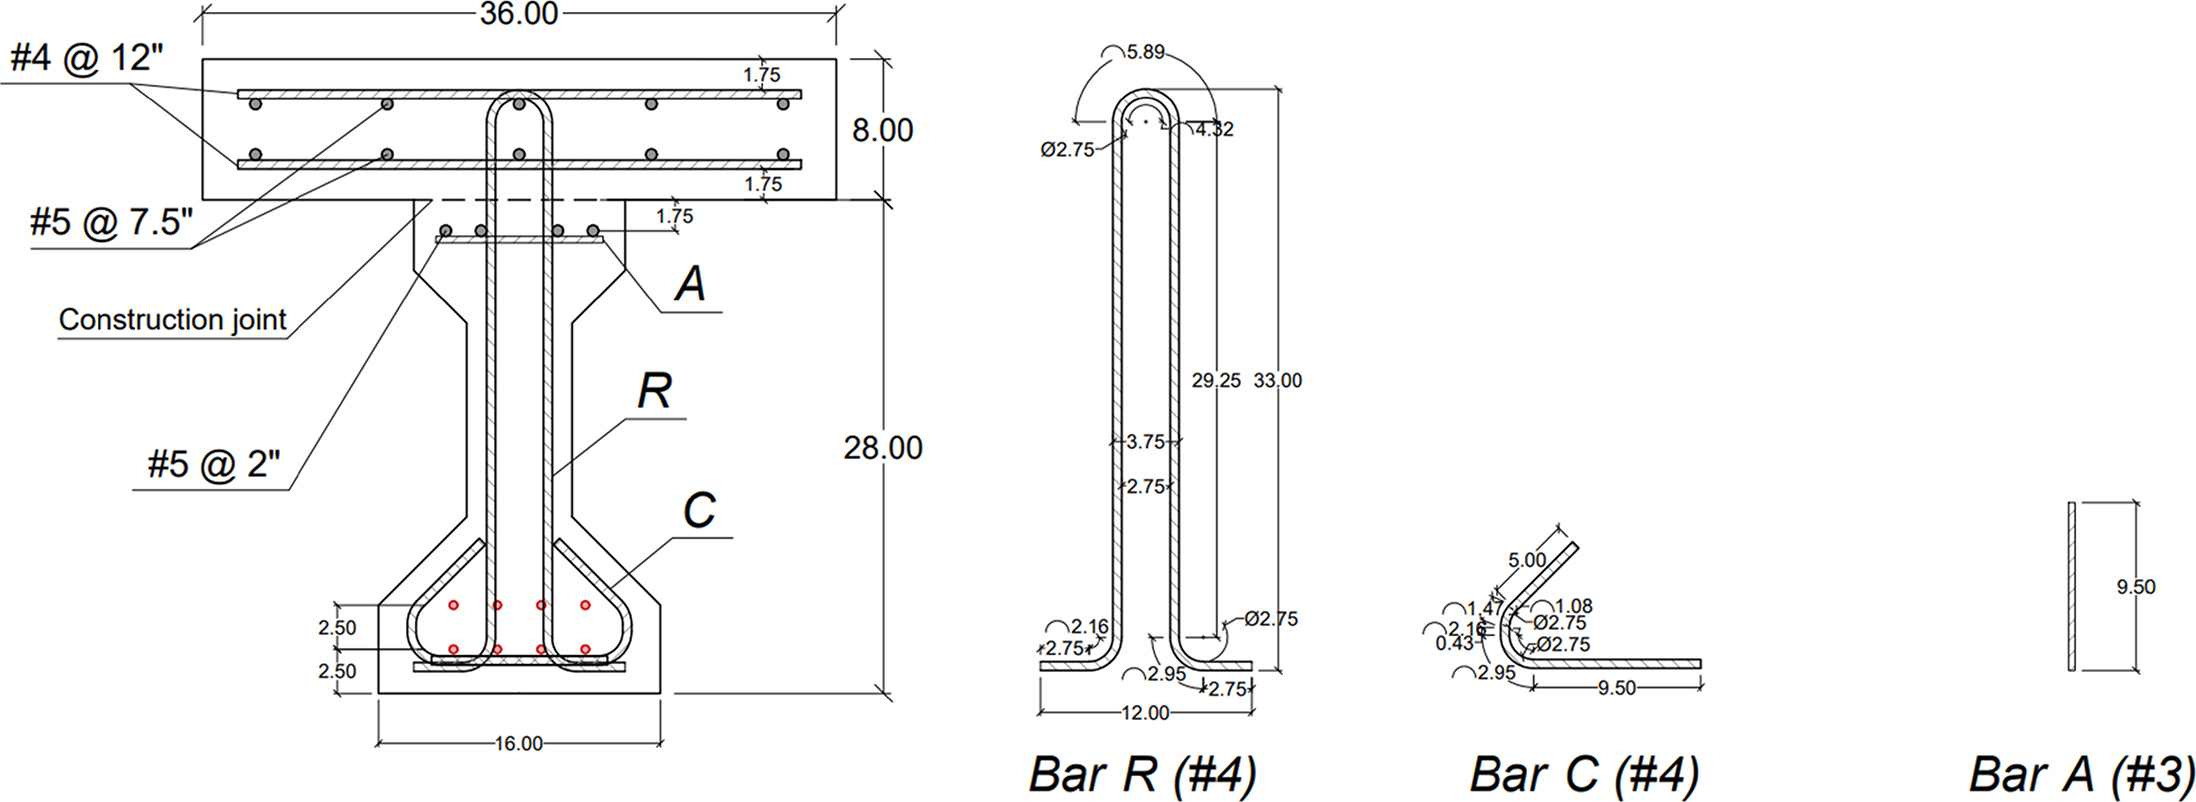
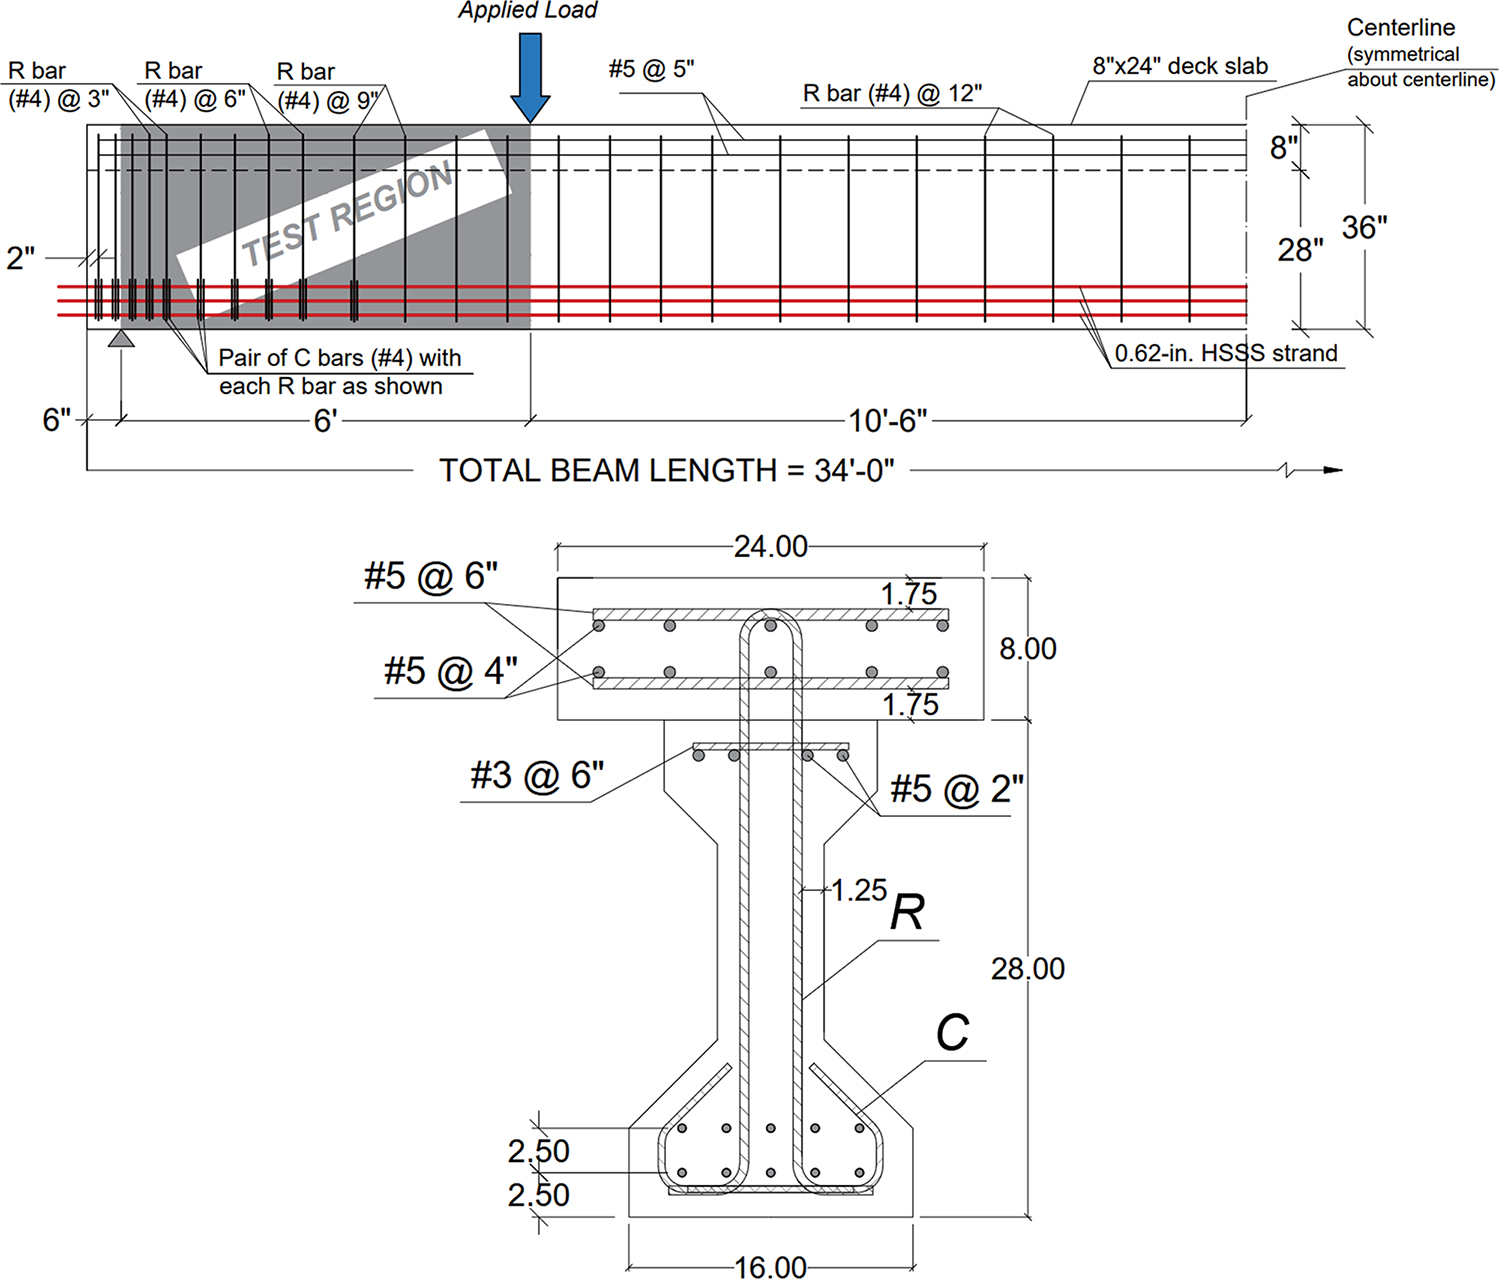
The section and elevation views of the AASHTO Type I girder with a composite deck slab (Specimen Pr2) are shown in Figure 21 and Figure 22, respectively. All the remaining specimen details are provided in Appendix B.
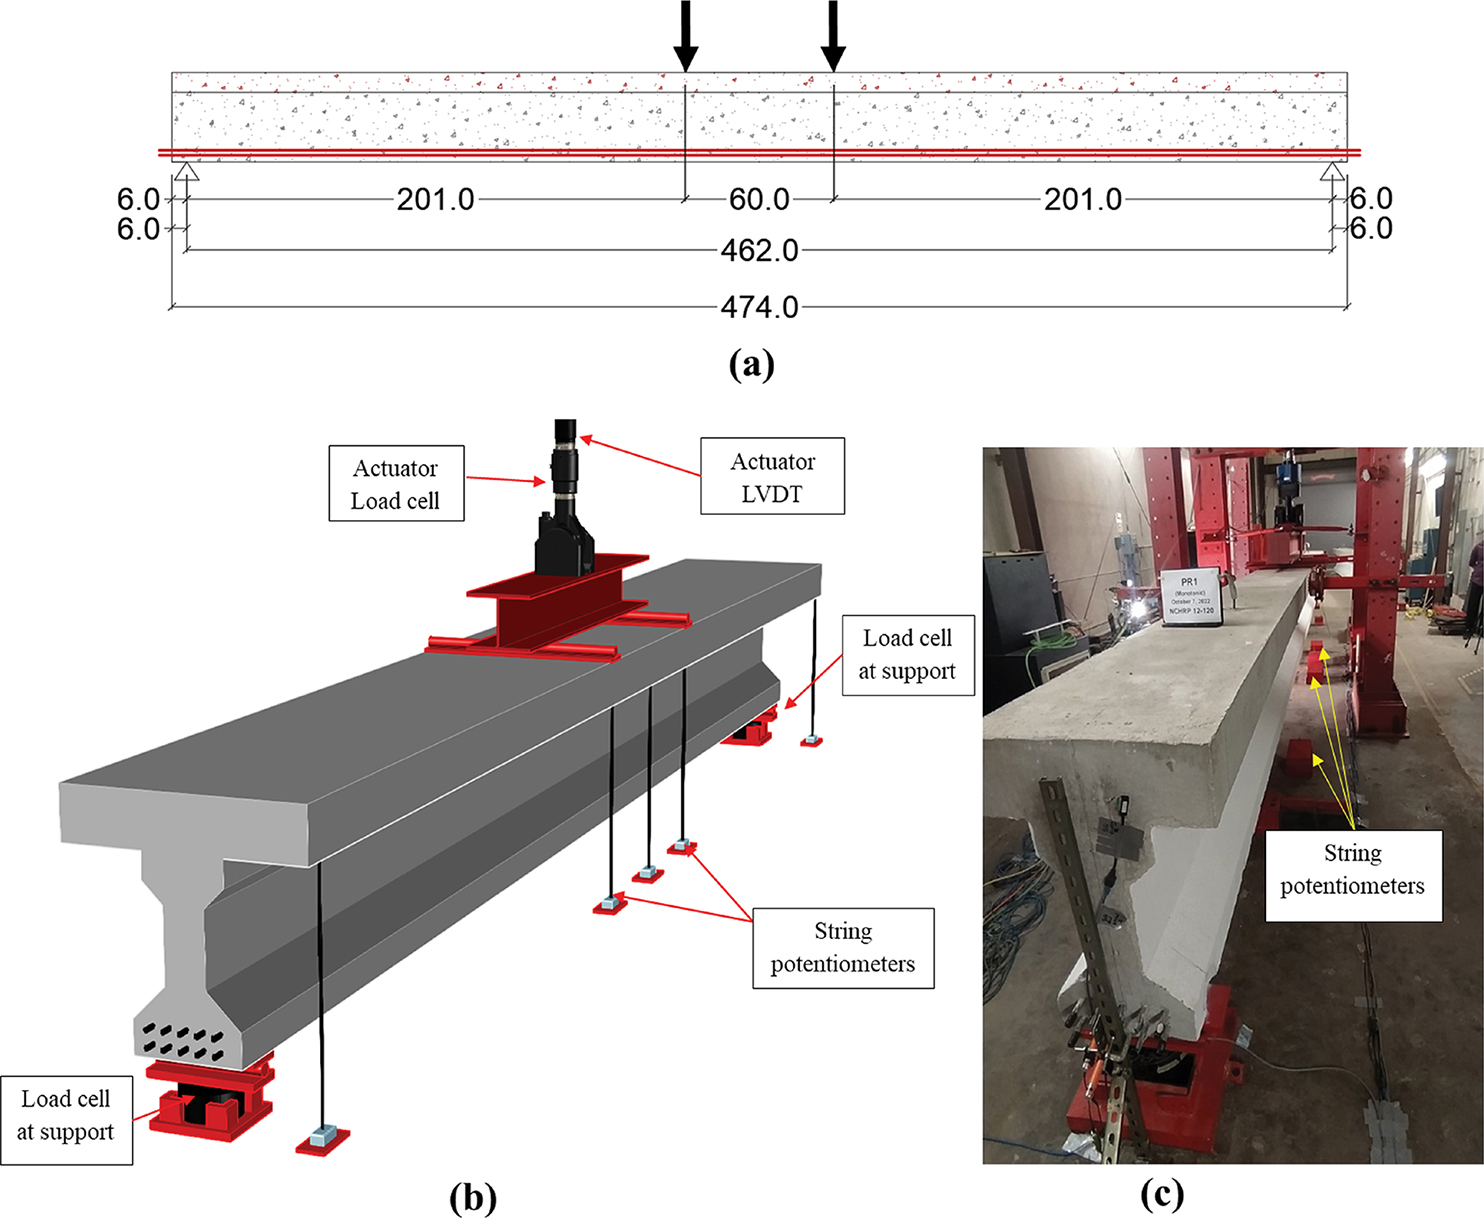
The six pretensioned specimens and three posttensioned specimens were tested for flexure in four-point bending tests using a 235 kip servo-hydraulic actuator, as illustrated in Figure 23(b). For the three slab beams, the flexural test setup and instrumentation details are identical to those described for the AASHTO Type I girders, except that the slab beams were 34 ft long with a 33.5-ft span; the distance between loading points was maintained at 5 ft.
3.5.2 Load-Deflection Behavior
3.5.2.1 Pretensioned Specimens
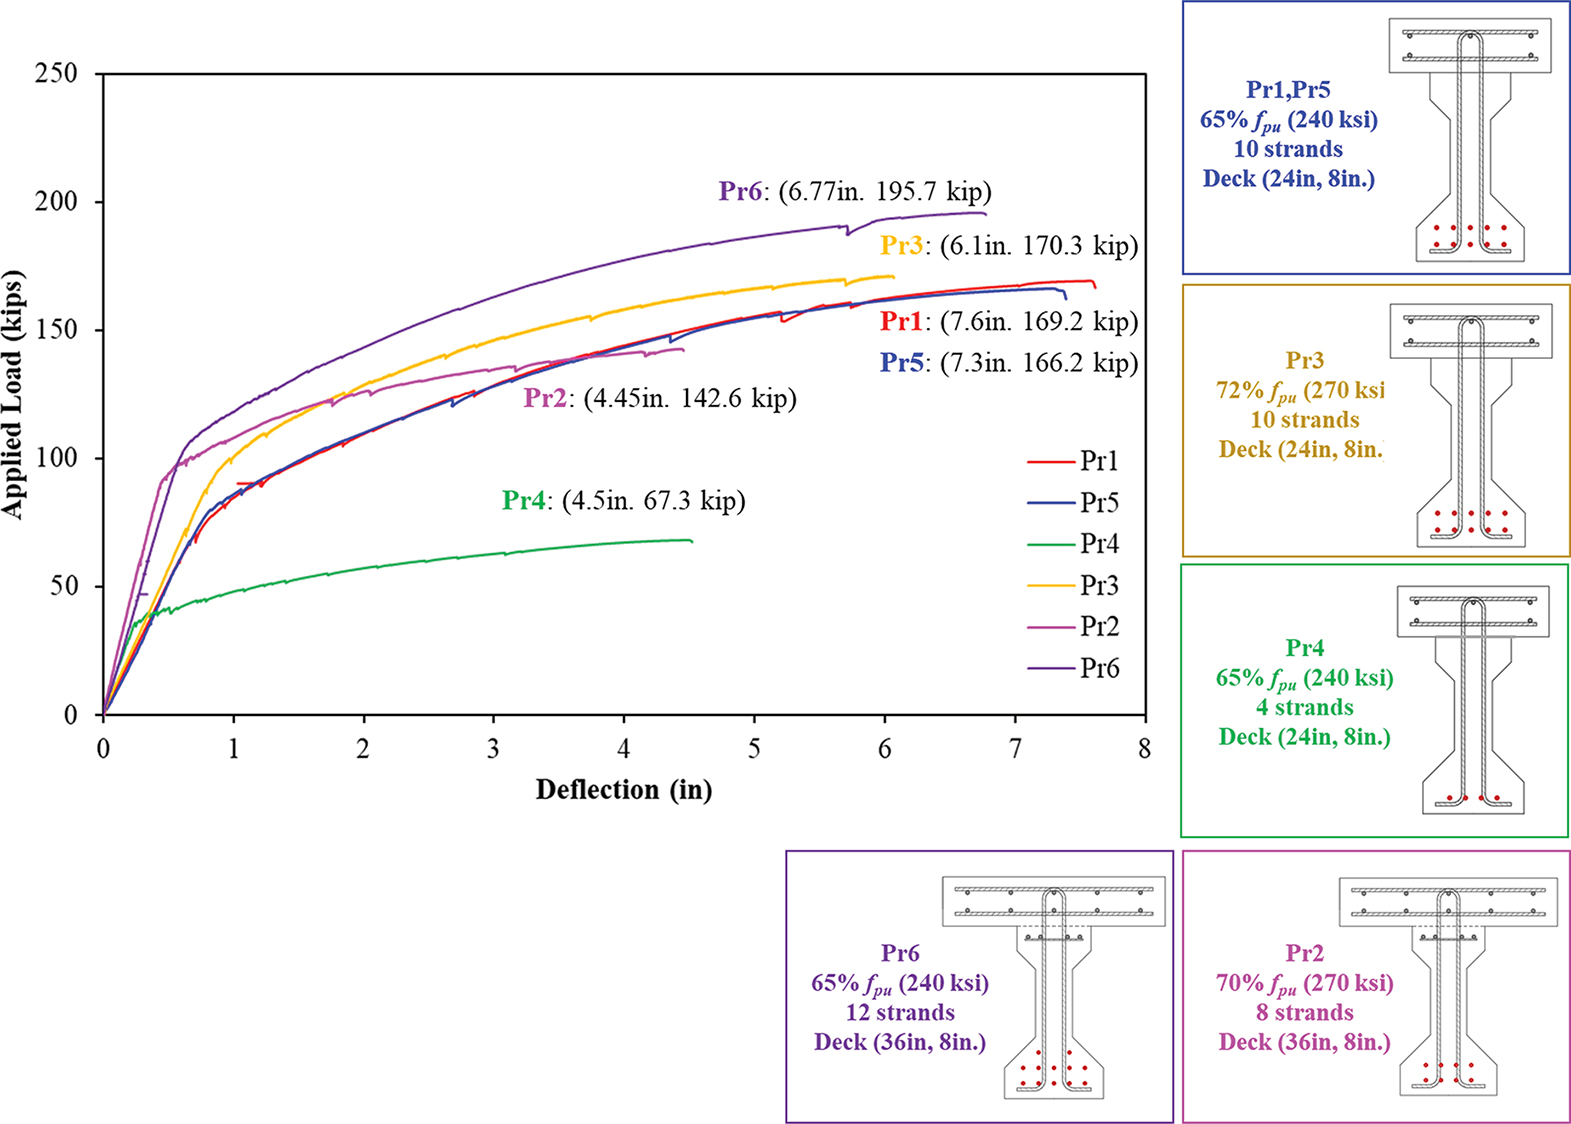
The experimental load-deflection responses for Specimens Pr1, Pr2, Pr3, Pr4, Pr6, as well as Pr5 (for the monotonic segment of testing) are presented in Figure 24 where the corresponding
Long Description.
A cross-section of an AASHTO Type 1 girder for specimen P r 2 is shown with all reinforcement and deck slab dimensions in inches. The deck slab is 36 inches wide and 8 inches thick. The girder height is 28 inches high and the deck slab adds 8 inches, for a total of 36 inches. The deck slab is 8 inches thick and contains number 4 bars spaced at 12 inches across the width. Number 5 bars are spaced at 7.5 inches near the top and 2 inches at the bottom. A construction joint is marked just below the slab. Three reinforcement bars are labeled A, R, and C. Bar R is a number 4 bar with a total length of 92.5 inches, including a 2.5 inch bend radius and vertical legs of 29.75 and 30 inches. Bar C is a number 4 bar bent in a closed stirrup shape with 2 inch hooks and a base of 12 inches. Bar A is a number 3 straight vertical bar with a length of 9.5 inches. All bar shapes are shown next to the girder section with labeled dimensions.
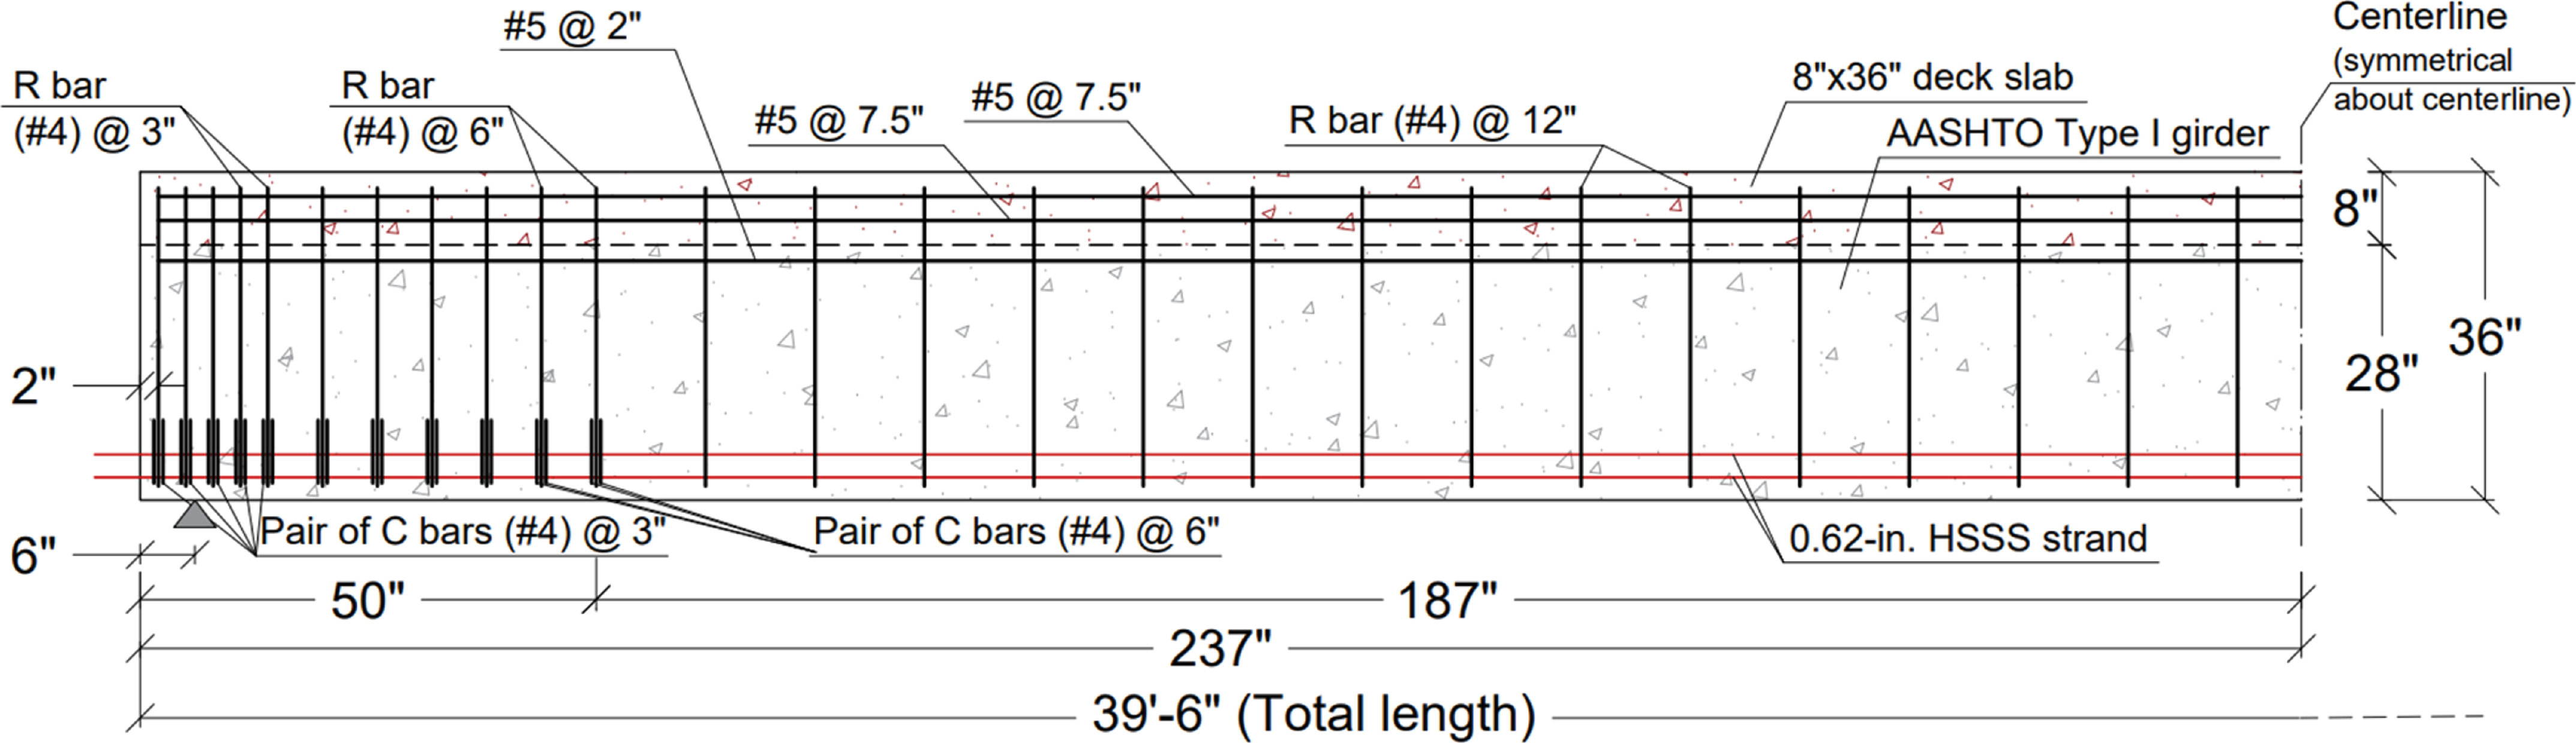
Long Description.
A half elevation of an AASHTO Type 1 girder for specimen P r 2 is shown with a total length of 39 feet 6 inches. The girder is symmetric, consisting of a 237 inch section made up of 50 inches and 187 inches on each side of the centerline. The section includes a 28 inch deep girder and an 8 inch thick by 36 inch wide composite deck slab. Nonprestressed reinforcement consists of number 4 R bars placed at 3 inch, 6 inch, and 12 inch spacing along the length. Number 5 bars are spaced at 2 inch and 7.5 inch intervals in the slab. Number 4 C bars are arranged in pairs at 3 inch and 6 inch spacing. Prestressed reinforcement includes 0.62 inch high-strength stainless steel strands located near the bottom of the girder. The centerline is noted as symmetrical. The drawing shows detailed bar positions, strand placement, and spacing across the full length.
midspan deflection and peak load are noted for each specimen. In addition, the concrete details for the specimens are presented in Table 8.
Specimens Pr1 and Pr5, which had 10 strands and an initial prestressing level of 65% of the minimum specified SS strand strength of 240 ksi, had almost the same cracking load: 80 kip and 78 kip, respectively. Specimen Pr1 had an ultimate load of 169.2 kip; Specimen Pr5 had an ultimate load of 166.2 kip after being subjected to fatigue loading. Therefore, it appears the fatigue loading did not significantly reduce the flexural capacity of the cross section. See Appendix B for details of fatigue loading. The ultimate deflection was 7.6 in. for Pr1 and 7.3 in. for Pr5.
Specimen Pr3, with 10 strands and an initial prestressing level of 72% of the measured ultimate strength of 270 ksi, had a higher cracking load of 99 kip compared to Pr1 and Pr5 due to its higher initial prestressing, as shown in Figure 24. Specimens Pr1, Pr5, and Pr3, each containing 10 strands, achieved nearly identical ultimate capacities, with Pr3 exhibiting the highest at 170.3 kip. Pr1 and Pr5 showed similar initial stiffness, reflecting their comparable concrete strengths. In contrast, Pr3 demonstrated slightly greater stiffness, attributed to its higher initial prestressing level. At the
Long Description.
Section A is an elevation view of the test specimen with a total length of 474 inches. The specimen spans 462 inches between two supports, with each end extending 6 inches beyond the support. Two applied loads are centered 60 inches apart, each located 201 inches from the supports. Section B is an isometric drawing of the test setup showing a concrete girder on two supports with load cells at each support and actuators at the load points. String potentiometers are placed below the beam for displacement measurement. Section C is a photograph of specimen P r 1 in the test frame. The beam rests on supports and is positioned directly under the actuator. String potentiometers are visible at the base. All views use labels to identify actuators, load cells, and potentiometers, and all dimensions are in inches.
peak load of 170.3 kip, Pr3 also exhibited reduced net deflection compared to Pr1 and Pr5, owing to its increased prestress and lower reserve strain. Specimens Pr1 and Pr5 displayed similar initial stiffness since they had comparable concrete strengths (Mechaala et al., 2025).
Strand rupture occurred in Specimens Pr2, Pr3, Pr4, and Pr6 due to the limited ultimate strain capacity of the SS strands. In these cases, the bottom layer of strands reached their ultimate strain before the extreme concrete compression fiber reached its assumed failure strain of 0.003. This failure mode is unfamiliar to most bridge designers, as concrete girders prestressed with CS strands typically fail through concrete crushing. In this testing program, failure indicators were monitored at various stages, including in Pr4, where a reduced number of strands was used—further increasing the likelihood of strand rupture.
Specimen Pr4, with the fewest strands (four) and the low prestressing level of 65% of the minimum specified tensile strength of 240 ksi, gave additional information regarding the warning that the member is reaching its ultimate strength. The cracking load of Pr4 was 35 kip with a deflection of 0.23 in. At the ultimate load, Specimen Pr4 reached 67.3 kip and an ultimate deflection of 4.5 in.; Specimen Pr4 shows a reserve deflection ratio between the failure and development of the first flexural crack of 12.25, which is an unexpected indication of ductility for strands with limited strain capacity.
Long Description.
The graph shows applied load in kips on the vertical axis and deflection in inches on the horizontal axis. It compares six pretensioned AASHTO Type 1 girder specimens labeled P r 1 to P r 6. Each curve represents a different specimen and peaks at various load and deflection values. P r 1 reaches 7.6 inches and 169.2 kips. P r 2 reaches 4.4 inches and 142.6 kips. P r 3 reaches 6.1 inches and 170.3 kips. P r 4 reaches 4.5 inches and 67.3 kips. P r 5 reaches 7.3 inches and 166.2 kips. P r 6 reaches 6.77 inches and 195.7 kips. The right side contains six labeled girder section drawings, color-coded to match each curve and showing bar arrangement, concrete strength, and strand profile. P r 4, P r 5, and P r 6 have 240 k s i girder concrete. P r 2 and P r 3 have 270 k s i girder concrete. Strand types and shapes are also shown. Each curve demonstrates the load capacity and ductility of the corresponding specimen.
Note:
* Specimen subjected to fatigue cycles before monotonically loaded to failure.
** Specimens were built with a composite deck slab. Other specimens were built with a monolithic deck slab.
Long Description.
The table presents tested values for concrete strengths and structural details for pretensioned AASHTO Type 1 girder specimens. It includes columns for girder name, number of stainless steel strands, target and tested compressive strength in ksi for both girder and deck slab, deck slab width and thickness, and prestress force as a percentage of 240 ksi. Specimen P r 1 used 10 strands with target strengths of 9 ksi and tested strengths of 7 ksi for both girder and deck, and a deck slab of 24 inches by 8 inches at 65 percent prestress. Specimen P r 5 marked with an asterisk had the same strand and dimensions but tested at 6 k s i and was subjected to fatigue before monotonic loading. Specimen P r 3 had 10 strands, tested strengths of 5.6 ksi, and an 81 percent prestress force. P r 4 used 4 strands with 6 ksi tested strengths and 65 percent prestress. Specimens P r 2 and P r 6, marked with double asterisks, used composite slabs of 36 inches by 8 inches. P r 2 had 8 strands, tested girder strength of 9.5 ksi and deck of 5.5 ksi, and 79 percent prestress. P r 6 had 12 strands, girder strength of 7.5 ksi, deck of 10.6 ksi, and 65 percent prestress. The note clarifies that single-asterisked specimens were subjected to fatigue cycles before monotonically loaded to failure, while double asterisk specimens were built with composite slabs. Other specimens used monolithic slabs.
For Specimens Pr2 and Pr6, the girders had eight strands with a deck slab that was cast separately and was 50% wider, with dimensions of 36 in. × 8 in. These specimens experienced failure characterized by the rupture of the strands at midspan similar to Pr3 and Pr4. Specimen Pr2 demonstrated a reduced ultimate capacity of 142.6 kip compared to Specimens Pr1, Pr5, and Pr3. This reduction in capacity is attributed to the fact that Specimen Pr2 had only 8 strands while Specimens Pr1, Pr3, and Pr5 had 10 strands. Specimen Pr6 demonstrated an increase in the ultimate capacity of 195.7 kip compared to all other specimens because it had 12 strands, the most
of any specimen. Conversely, Specimen Pr6 exhibited slightly lower initial stiffness compared to Pr2. This lower initial stiffness was a direct result of the lower concrete strength, as indicated in Table 8. It is important to note that the load on all specimens continued to increase up to failure with no discernible plateau, although there was a marked reduction in stiffness after cracking that extended to relatively large deformations; in addition, the strength ratio of the ultimate and the first flexural crack shows reserve strength while using the SS strands for all the tests. This observation was also reported by Al-Kaimakchi and Rambo-Roddenberry (2021). In the Sectional Analysis section, the measured strengths of the tested elements were compared with the calculated strengths. Test results for pretensioned AASHTO Type I girder Specimens Pr1, Pr2, Pr3, Pr4, Pr5, and Pr6 are summarized in Table 9.
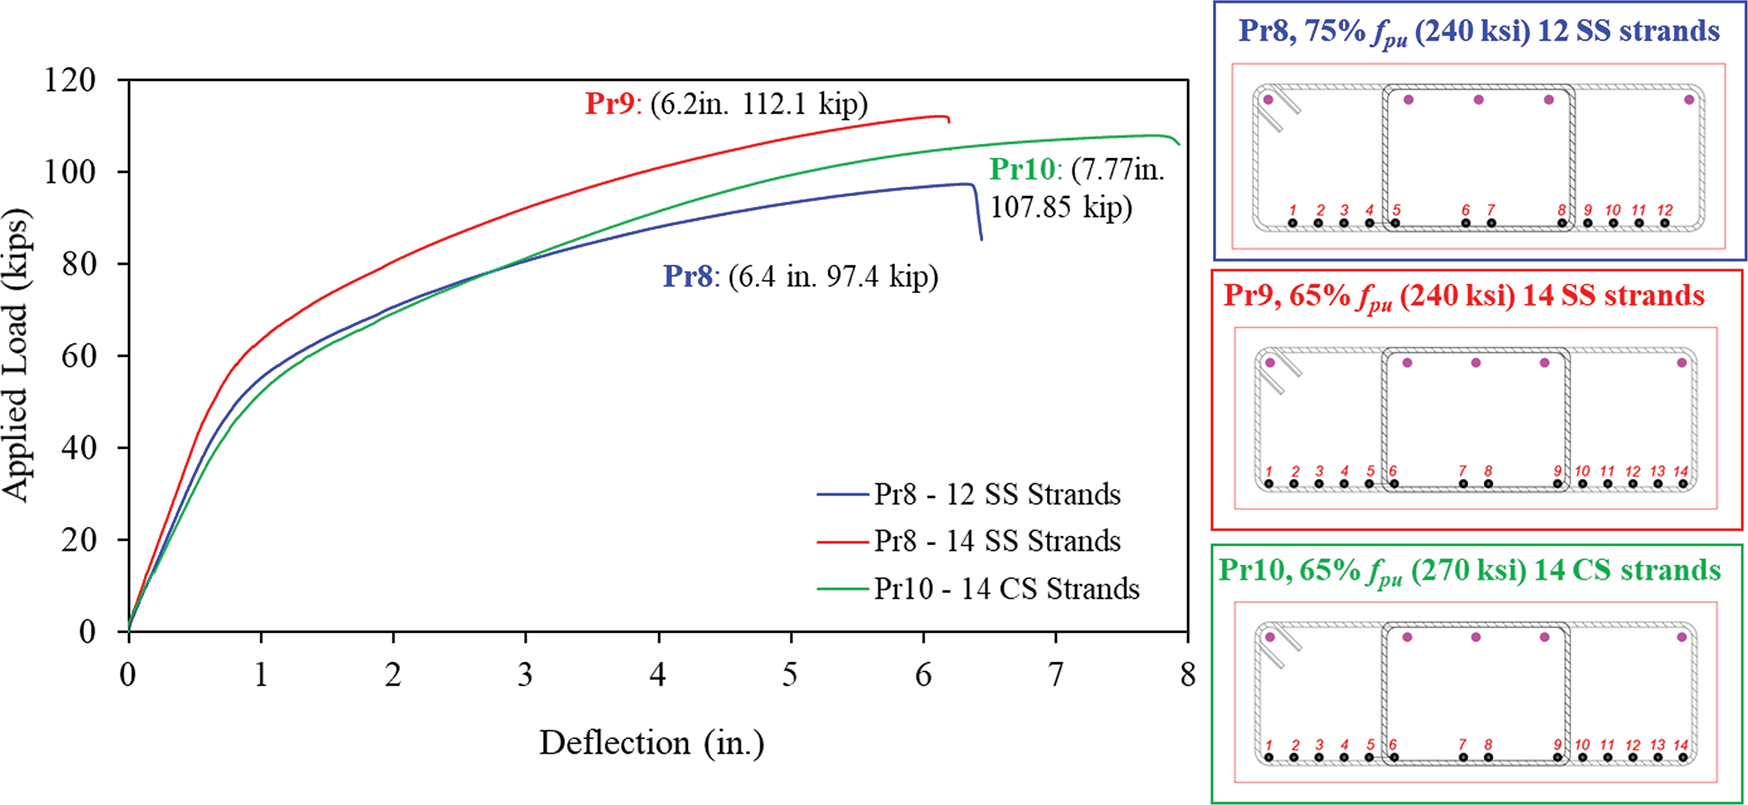
For slab beams, the loading process was similar to that used for pretensioned specimens. The experimental load-deflection responses for slab beams Pr8, Pr9, and Pr10 are presented in Figure 25.
Test results for the three slab beams are summarized in Table 10, including predicted values. Notably, Pr9 exhibited a higher ultimate capacity compared to slab beams Pr8 and Pr10, attributed to its higher total prestressing force (Pr8 and Pr10 being 85% and 96% of the ultimate capacity of Pr9, respectively). Additionally, Pr9 demonstrated higher initial stiffness despite comparable concrete strength among all slab beams tested. However, strain gauge readings after detensioning the strands revealed that the prestressing force for Pr9 is higher than for Pr8 and Pr10 (Pr8 and Pr9 being 88% and 94% of Pr9, respectively). The maximum deflection measured for Pr10 was 7.77 in., while for Pr8 and Pr9, maximum deflections reached 6.4 in. and 6.2 in., respectively.
Slab beam Specimen Pr8 with 12 0.62 in. diameter SS strands reached its maximum load with concrete crushing at an applied load of 97.4 kip. Subsequently, strand rupture occurred at an applied load of 85.3 kip at a small amount of additional deflection.
Slab beam Specimen Pr9 was prestressed with 14 0.62 in. diameter SS strands. It failed due to concrete crushing at an applied load of 112.1 kip, while slab beam Specimen Pr10, prestressed with 14 0.6 in. diameter CS strands, failed by concrete crushing at an applied load of 107.9 kip. More detailed results are provided in Appendix B.

Note:
* No available data.
** The strain gauge failed at 141 kip before reaching the ultimate applied load.
CC = Concrete crushing; SR = Strand rupture.
Long Description.
The table shows experimental results for pretensioned AASHTO Type 1 girders. The table includes 7 columns and 12 rows. The column headers are Experimental results, P r 1, P r 5, P r 3 , P r 4, P r 2 , and P r 6. The row details are as follows: Row 1. Number of strands: 10, 10, 10, 4, 8, 12. Row 2. f prime c (girder) ( ksi): 7, 6, 5.6, 6, 9.5, 7.5. Row 3. Initial Prestress percentage of 240 ksi: 65 percent, 65 percent, 81 percent, 65 percent, 79 percent, 65 percent. Row 4. Prestress force (A sub p f sub p e) kips: approximately 360, approximately 360, approximately 449, approximately 144, approximately 350, approximately 432. Row 5. Total Force (A sub p f sub p u) kips: 613, 613, 613, 245, 490, 665. Row 6. Predicted M sub n (kip-feet): 1,533, 1,518, 1,512, 658, 1246, 1,735. Row 7. Experimental M sub n (kip-feet): 1,510, 1,485, 1,519, 656, 1300, 1753. Row 8. Experimental e sub c (inches per inch): single asterisk, single asterisk, single asterisk, single asterisk, 0.0012, 0.0023. Row 9. Experimental e sub p (inches per inch): 0.0132, 0.0145, 0.0153, 0.0155, 0.0133 double asterisk, 0.0167. Row 10. Change in (inches) Cracking: 0.88, 0.78, 0.95, 0.23, 0.43, 0.63. Row 11. Change in (inches) failure: 7.6, 7.3, 6.1, 4.5, 4.45, 6.77. Row 12. Failure Mode: Cracking and Crushing, Cracking and Crushing, Sliding Resistance, Sliding Resistance, Sliding Resistance, Sliding Resistance. A single asterisk represents no available data. A double asterisk represents the strain gauge failed at 141 kips before reaching the ultimate applied load.
Long Description.
The graph shows applied load in kips on the vertical axis and deflection in inches on the horizontal axis for three pretensioned slab beam specimens. The curve representing P r 8 with 12 stainless steel strands is at 75 percent of 240 ksi. The curve representing P r 9 with 14 stainless steel strands is at 65 percent of 240 ksi. The curve representing P r 10 with 14 carbon steel strands is at 65 percent of 270 ksi. P r 9 reaches the highest load, followed by P r 10 and P r 8. All curves show increasing load with deflection, peaking between 6 and 8 inches. On the right, three labeled beam cross-section diagrams correspond to each curve. Each diagram shows strand count, prestress level, and strand material. The strands are arranged at the base of each section. P r 8 and P r 9 have identical cross-section geometry but different strand count and prestress levels. P r 10 uses carbon steel and reaches a slightly lower peak load compared to P r 9. All specimens exhibit ductile behavior before reaching ultimate capacity.
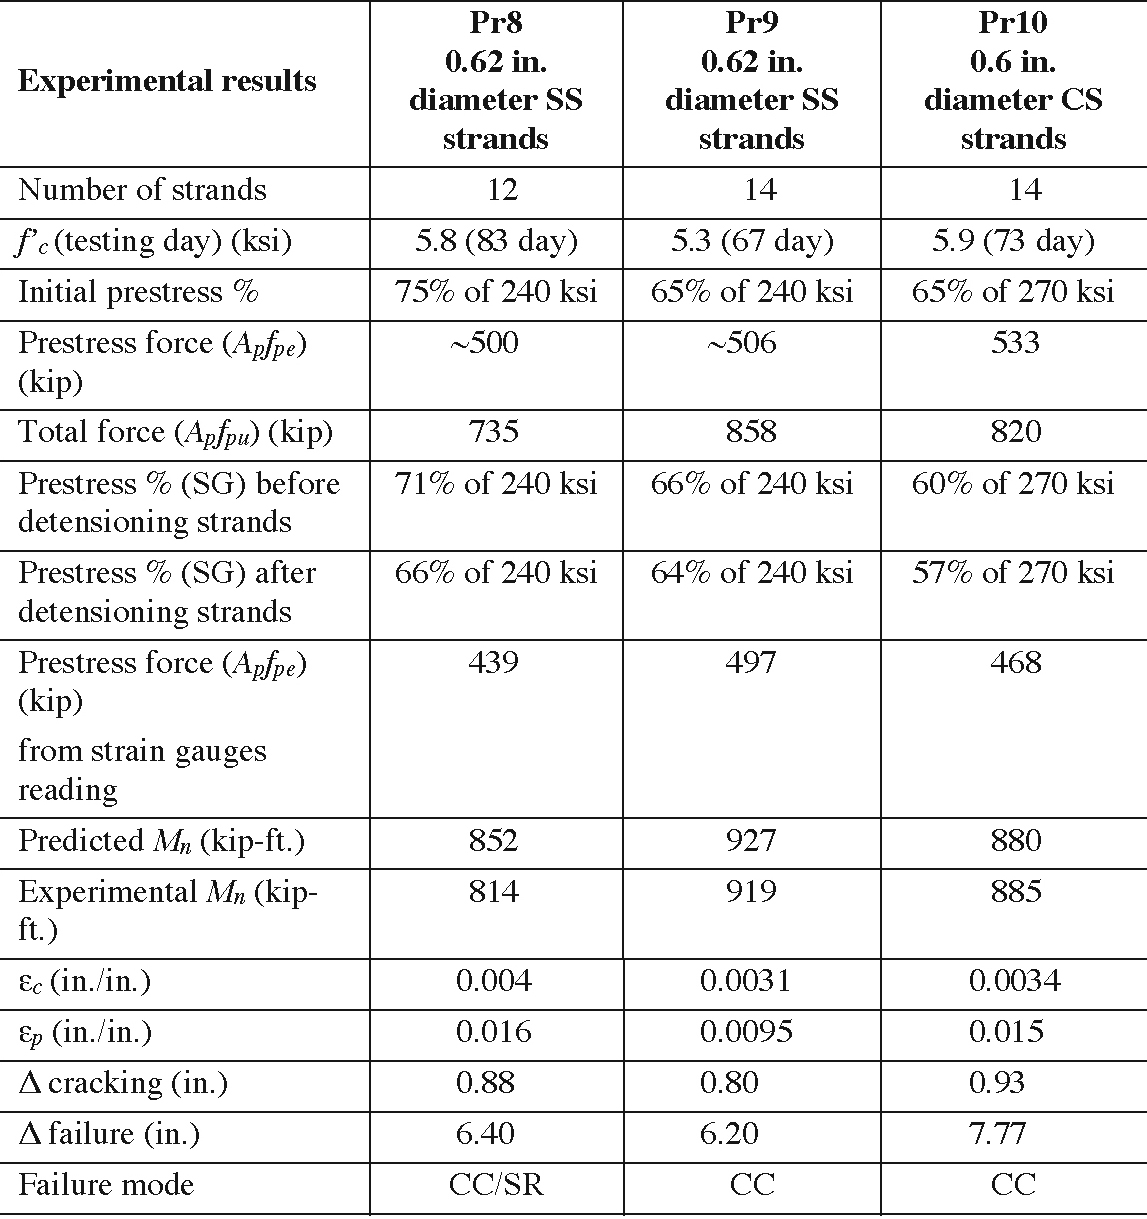
NOTE: CC = Concrete crushing; SG = Strain gauge; SR = Strand rupture.
Long Description.
The table presents experimental results for three pretensioned slab beam specimens using stainless steel and carbon steel strands. P r 8 uses 12 strands of 0.62 inch diameter stainless steel with compressive strength of 5.8 ksi at 83 days. P r 9 uses 14 strands of 0.62 inch stainless steel with compressive strength of 5.3 ksi at 67 days. P r 10 uses 14 strands of 0.6 inch carbon steel with compressive strength of 5.9 ksi at 73 days. Initial prestress percentages are 75 percent for P r 8 and 65 percent for P r 9 and P r 10. Prestress forces before detensioning are 240 ksi for P r 8 and P r 9, and 270 ksi for P r 10. After detensioning, prestress percentages decrease to 66 percent for P r 8, 64 percent for P r 9, and 57 percent of 270 ksi for P r 10. From strain gauge readings, prestress forces are 439 kips for P r 8, 497 kips for P r 9, and 468 kips for P r 10. Predicted moment capacities are 852 kip-feet for P r 8, 927 kip-feet for P r 9, and 880 kip-feet for P r 10. Experimental moment capacities are 814 kip-feet, 919 kip-feet, and 885 kip-feet, respectively. Measured strain values are also reported: compressive strain ranges from 0.0034 to 0.004 inches per inch, and prestress strain ranges from 0.0095 to 0.017 inches per inch. Crack deflection values range from 0.88 inch to 0.93 inch, and deflection at failure ranges from 6.2 inches to 7.7 inches. Failure modes are concrete crushing for all three beams, with specimen P r 8 also experiencing strand rupture.
The behavior of slab beams constructed with both CS and SS strands exhibited comparable response under similar conditions. This similarity suggests that the performance characteristics of the slab beams prestressed with either carbon steel or SS strands can be analyzed and understood in the same way.
3.5.2.2 Posttensioned Specimens
Concrete crushing is typically the flexural failure mode of unbonded posttensioned specimens. This is because the force that can be achieved in unbonded strands is lower than in bonded strands. Since the strands are unbonded, the tendency to increase strains in the strands at the critical section is relieved by the redistribution of strain along the total length of the strand, which increases the strain in the adjacent sections of the beam. Therefore, strains in the strands at the critical location are less than those that occur with bonded strands. Cracks in the concrete near the critical section are typically wider because the force across the crack is reduced, but fewer cracks tend to form and are not as well distributed, leading to only a few wide cracks forming as the member nears failure. As a result, the ultimate strength of beams with bonded tendons is higher than that of beams with the same number of unbonded tendons, regardless of tendon type (CS or SS strands).
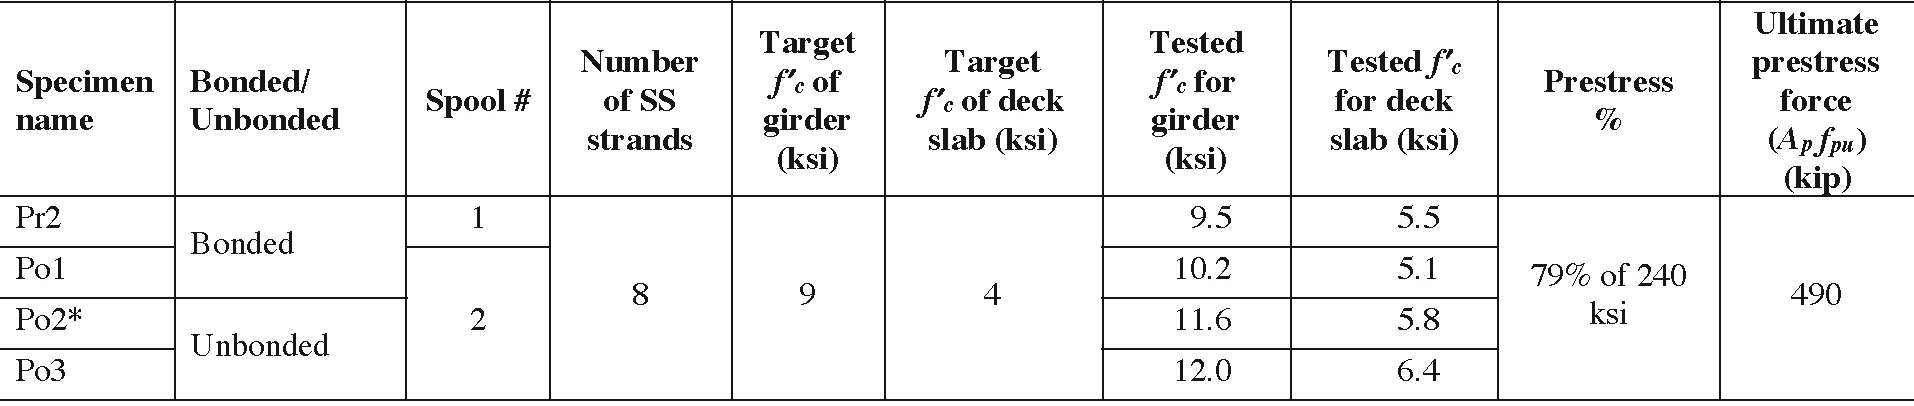
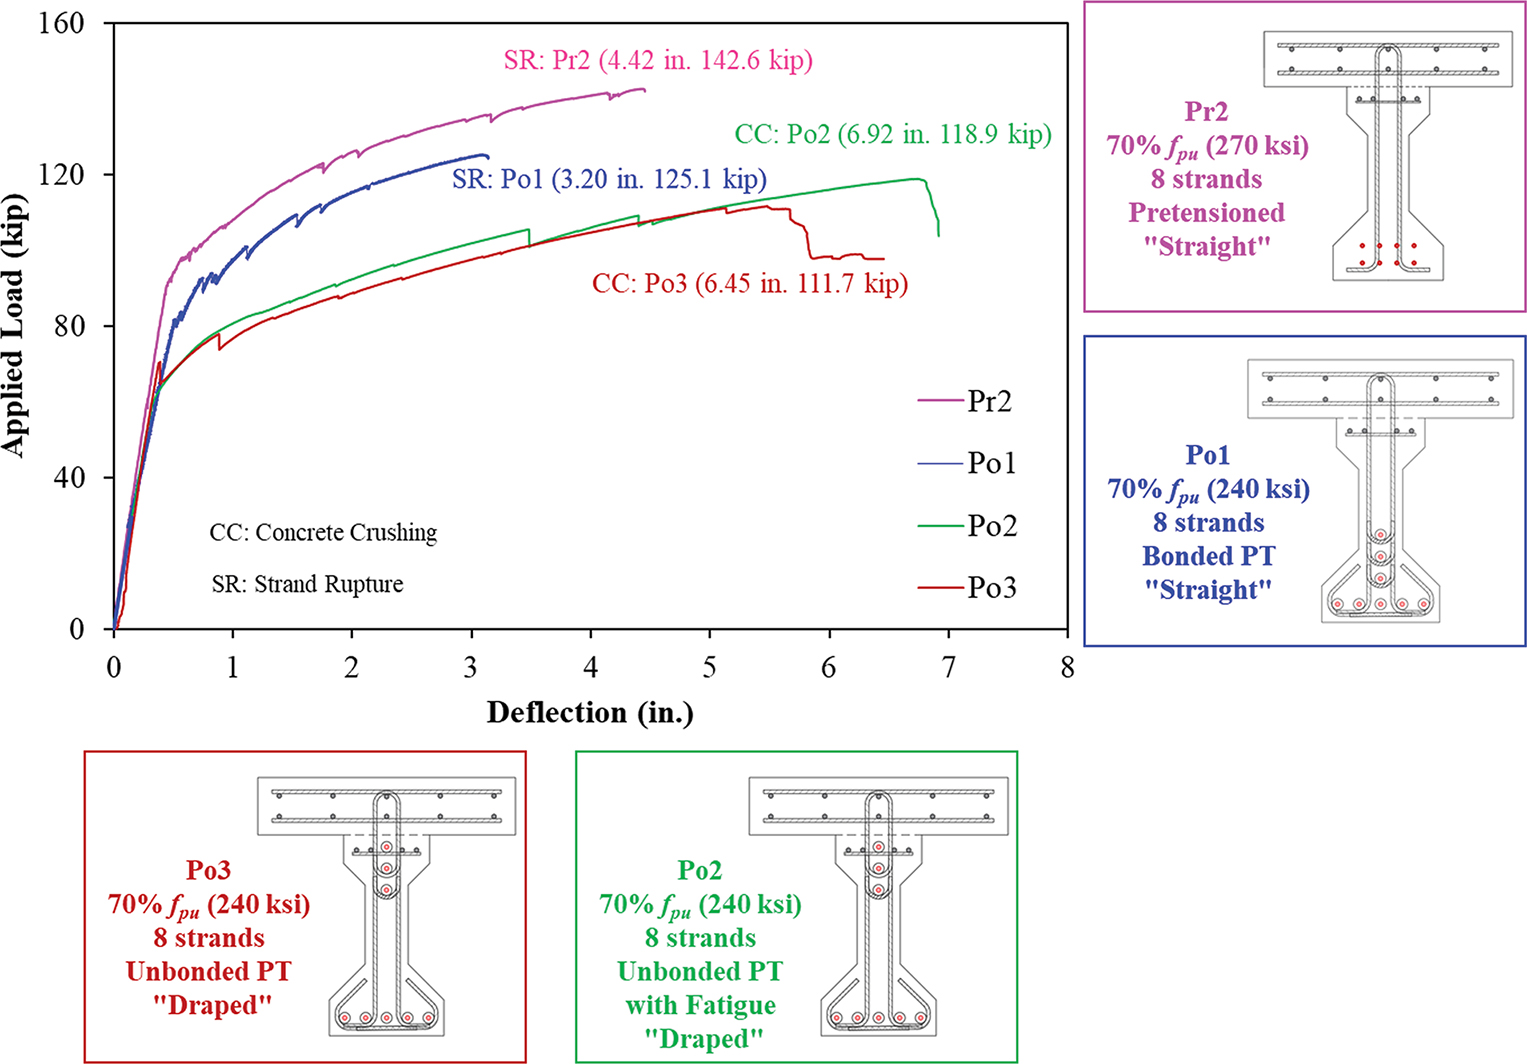
The following discussion of the posttensioned girder Specimens Po1, Po2, and Po3, and the pretensioned Specimen Pr2 is also included in this section for comparison purposes. Eight strands for each specimen were used in order to compare the results with the pretensioned Specimen Pr2. However, the properties of the spool number are different, which makes a difference in the total prestressing force. Table 11 presents the details of the three posttensioned specimens and Specimen Pr2.
Figure 26 shows the load-deflection behavior of four prestressed concrete girders with bonded (pretensioned and posttensioned) and unbonded (posttensioned) SS strands.
For Specimens Pr2 and Po1, both specimens exhibited similar initial stiffness. Specimen Po1 failed due to strand rupture at midspan, a failure mode consistent with Specimen Pr2. However, Specimen Po1 demonstrated a lower ultimate load capacity of 125.1 kip compared to 142.6 kip for Specimen Pr2, along with a lower ultimate deflection of 3.2 in., compared to 4.42 in. for Specimen Pr2. This reduction in both capacity and deflection is attributed to Po1 being cast with strands from Spool 2, which had a lower ultimate strength than the strands from Spool 1 used for Specimen Pr2, leading to a reduced total prestressing force. For Specimens Po1 and Po3, Figure 26 illustrates that the initial behavior of both specimens was comparable, exhibiting a linear response prior to the cracking of Specimen Po3. The first crack in unbonded posttensioned Specimen Po3 appeared at a load of 70.79 kip, while the first crack in the bonded specimen Po1 occurred at 82 kip. The two specimens exhibited distinct failure modes: Specimen Po1 failed due to strand rupture, while Specimen Po3 failed due to concrete crushing. Specimen Po3, with unbonded strands, achieved a maximum applied load of 111.67 kip, which was lower
Note: * Specimen subjected to fatigue cycles before monotonically loaded to failure.
Long Description.
The table presents details for four specimens: P r 2 , P o 1, P o 2, and P o 3. It includes information on bonding type, spool number, number of high-strength stainless steel strands, target and tested compressive strength in ksi for girder and deck slab, prestress percentage, and ultimate prestress force. Specimen P r 2 , from spool 1, is bondedwith 8 high strength stainless steel strands, target girder strength of 9 ksi, tested girder strength of 9.5 ksi, target deck slab strength of 4 ksi, and tested deck strength of 5.5 k s i. P o 1, from spool 2, is bonded with 8 strands, target girder strength of 9 ksi, tested girder strength of 10.2 ksi, target deck slab strength of 4 ksi, tested deck strength of 5.1 ksi, and a prestress of 79 percent of 240 k s i with ultimate prestress force of 490 kips. P o 2 and P o 3 are unbonded and from spool 2. P o 2 has 8 strands, tested girder strength of 11.6 ksi, tested deck strength of 5.8 ksi. P o 2 also underwent fatigue before failure. P o 3 has 8 strands, tested girder strength of 12.0 ksi, and tested deck strength of 6.4 ksi. Target strengths for P o 2 and P o 3 were 9 ksi for the girder and 4 ksi for deck slab. The ultimate prestress force for all specimens is 490 kips.
Long Description.
The graph shows applied load in kips on the vertical axis and deflection in inches on the horizontal axis for four girder specimens. P r 2 reaches 142.6 kips at 4.42 inches and fails by strand rupture. P o 1 reaches 125.1 kips at 3.20 inches and fails by strand rupture. P o 2 reaches 118.9 kips at 6.92 inches and fails by concrete crushing. P o 3 reaches 111.7 kips at 6.45 inches and fails by concrete crushing. All curves show increasing load with deflection until their respective peak capacities. The right side contains labeled girder section diagrams for each specimen. P r 2 is pretensioned with 8 straight strands at 70 percent of 270 ksi. P o 1 is bonded post-tensioned with 8 straight strands at 70 percent of 240 ksi. P o 2 is unbonded post-tensioned with 8 draped strands at 70 percent of 240 k s i and includes fatigue loading. P o 3 is unbonded post-tensioned with 5 draped strands at 70 percent of 240 ksi. Failure modes are noted as CC for concrete crushing and SR for strand rupture
than the 125.1 kip observed for Specimen Po1 with bonded tendons. In terms of deflection at failure, Specimen Po3 recorded a larger maximum deflection of 6.45 in. compared to 3.20 in. for Specimen Po1. The comparison of the load-deflection response of the posttensioned Specimens Po3 and Po2 (see Figure 26) indicates that the 3 million cycles of fatigue loading did not affect the overall behavior. Even after this fatigue loading, the post-cracking and pre-cracking stiffnesses remained identical to those of Po3. for the ultimate capacity of the fatigued specimen (Po2) shows higher values than the Po3, which was tested under monotonic loading without prior fatigue exposure. The load on all specimens continued to increase up to failure with no discernible plateau; the ratio of ultimate strength to first flexural cracking strength demonstrates the reserve capacity provided by SS strands for all the tests. More detailed results are provided in Appendix B.
3.5.3 Crack Patterns and Strand Strains at Failure
3.5.3.1 Pretensioned Specimens
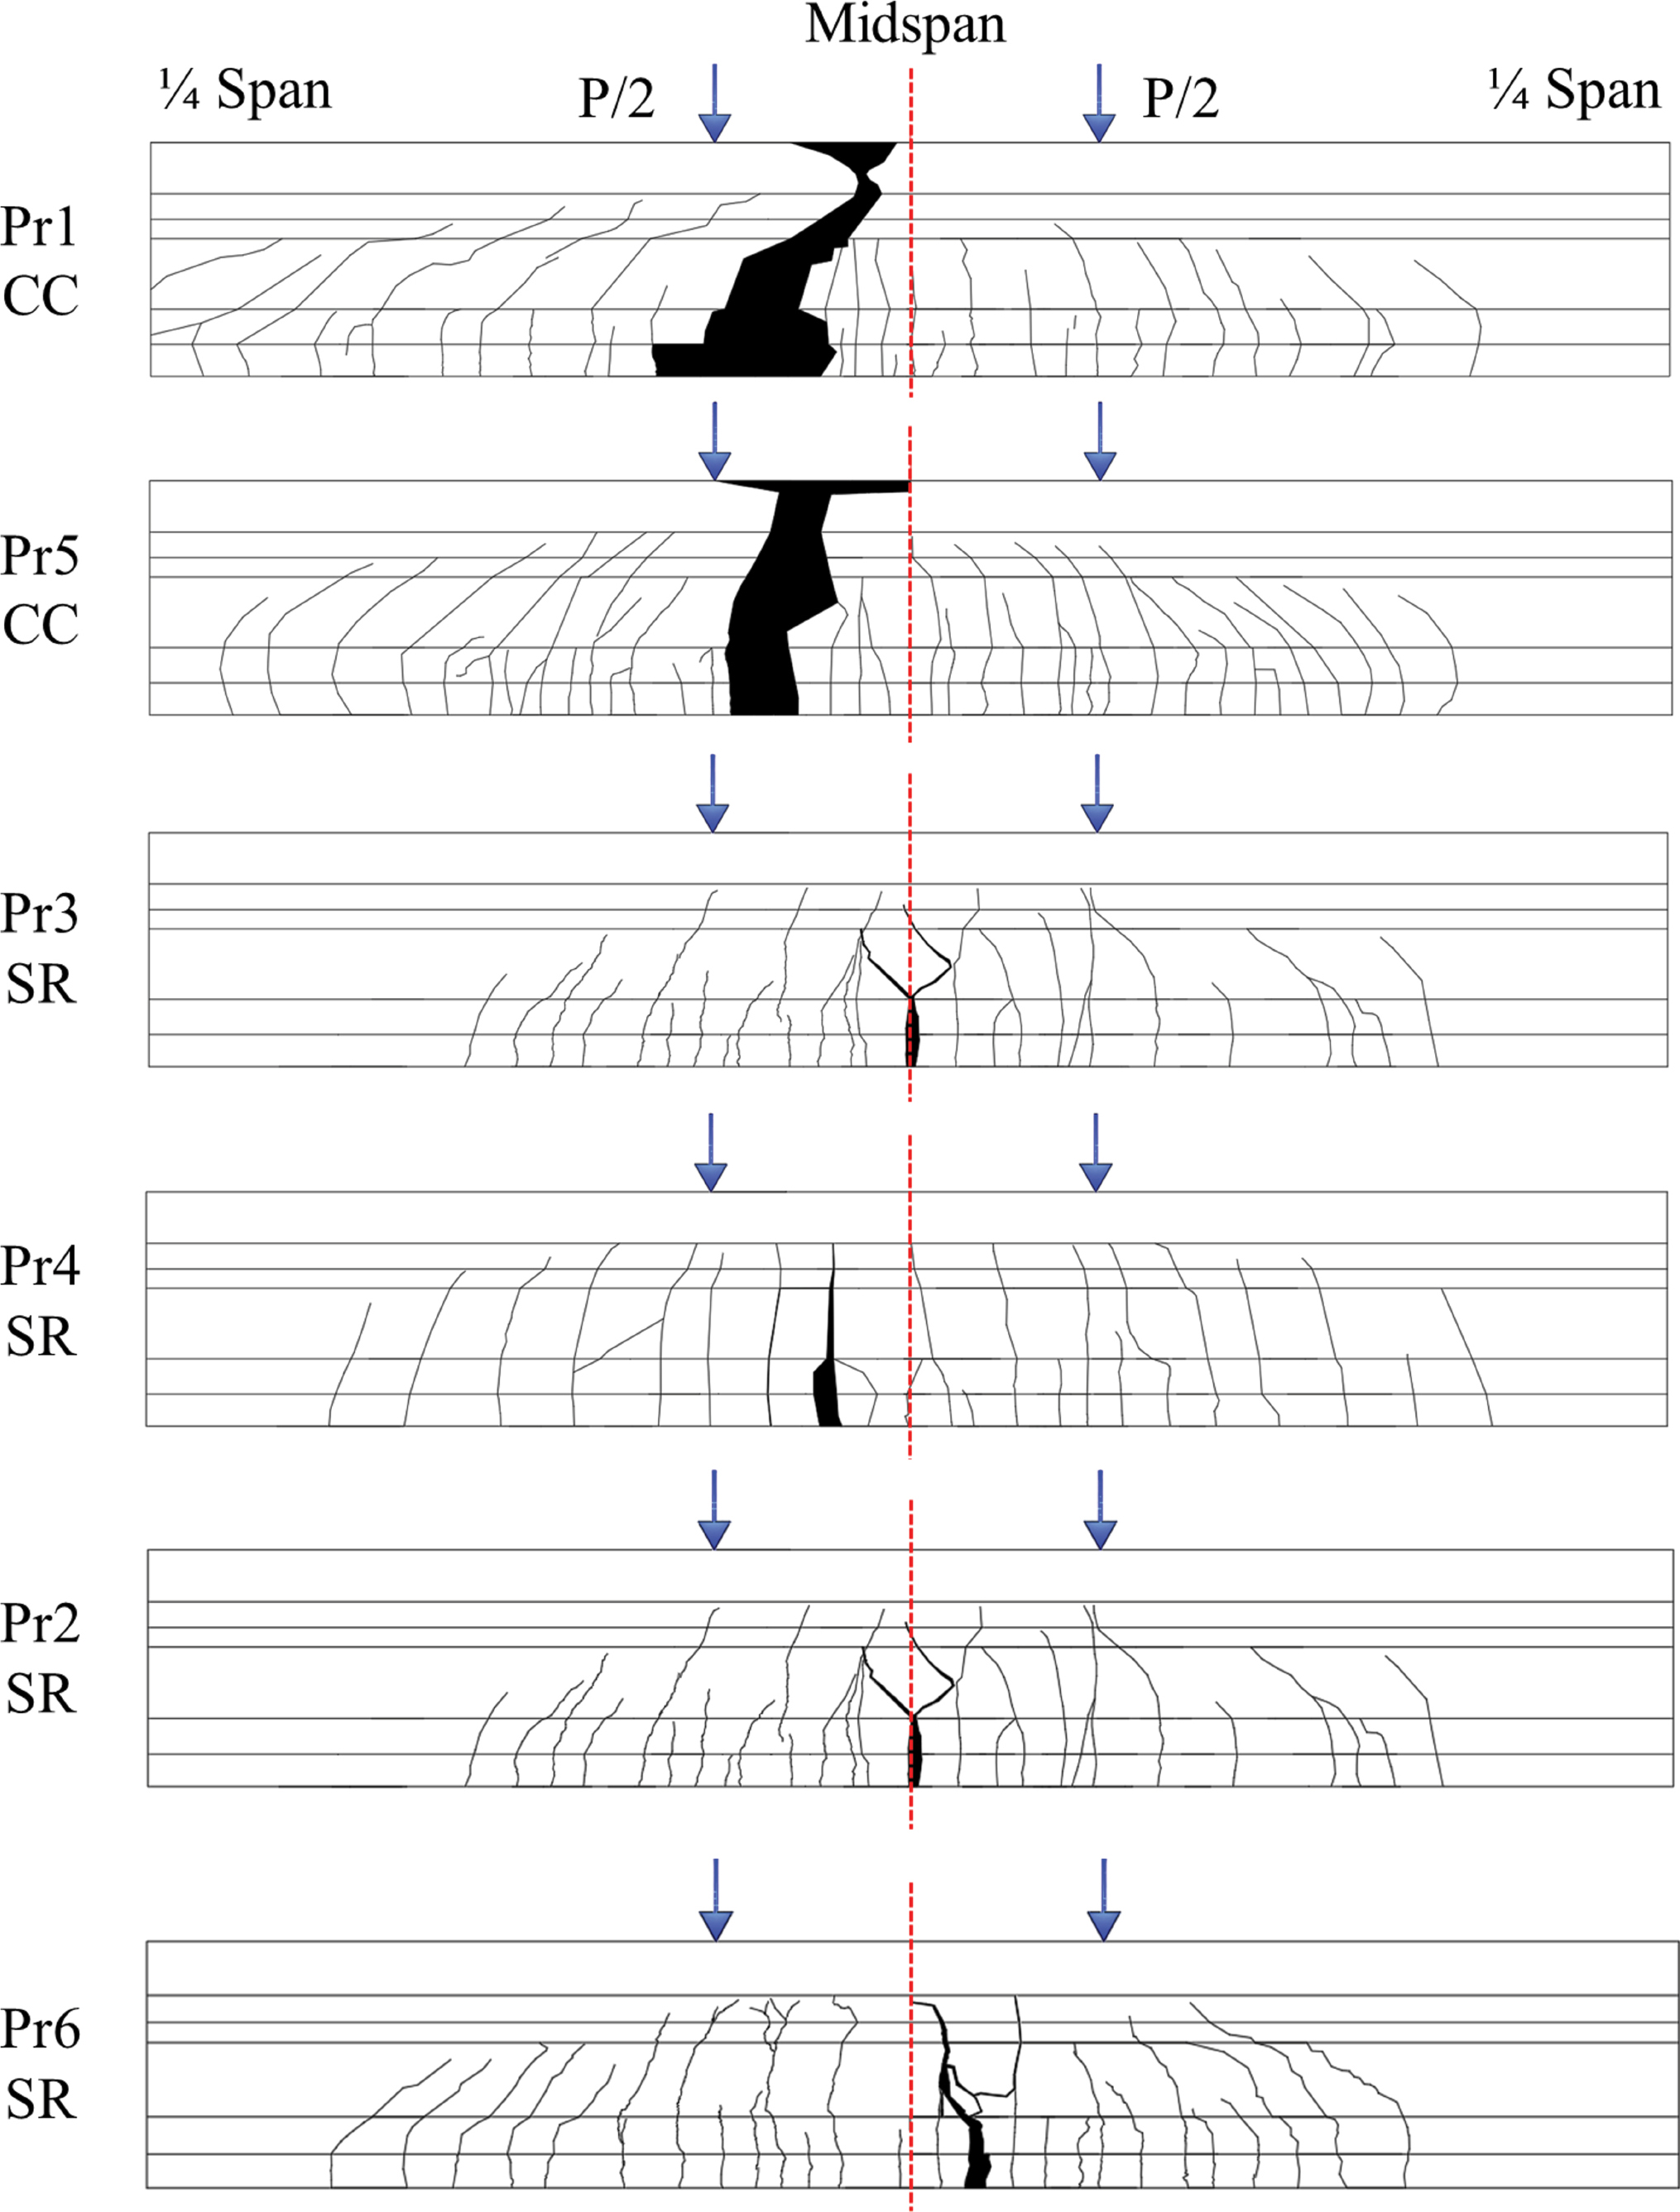
For specimens governed by strand rupture (Pr2, Pr3, Pr4, and Pr6), failure was marked by a larger crack, as depicted in Figure 27. This larger crack occurred after the strands reached their rupture strains followed by simultaneous rupture and large crack formation. Similar observations were made in the study by Al-Kaimakchi and Rambo-Roddenberry (2021), where strand rupture was also associated with a single large crack near midspan. The strand rupture failure involved necking and rupture of all seven wires in the SS strands (see Figure 27), which is consistent with the behavior observed during uniaxial tension tests on stainless steel
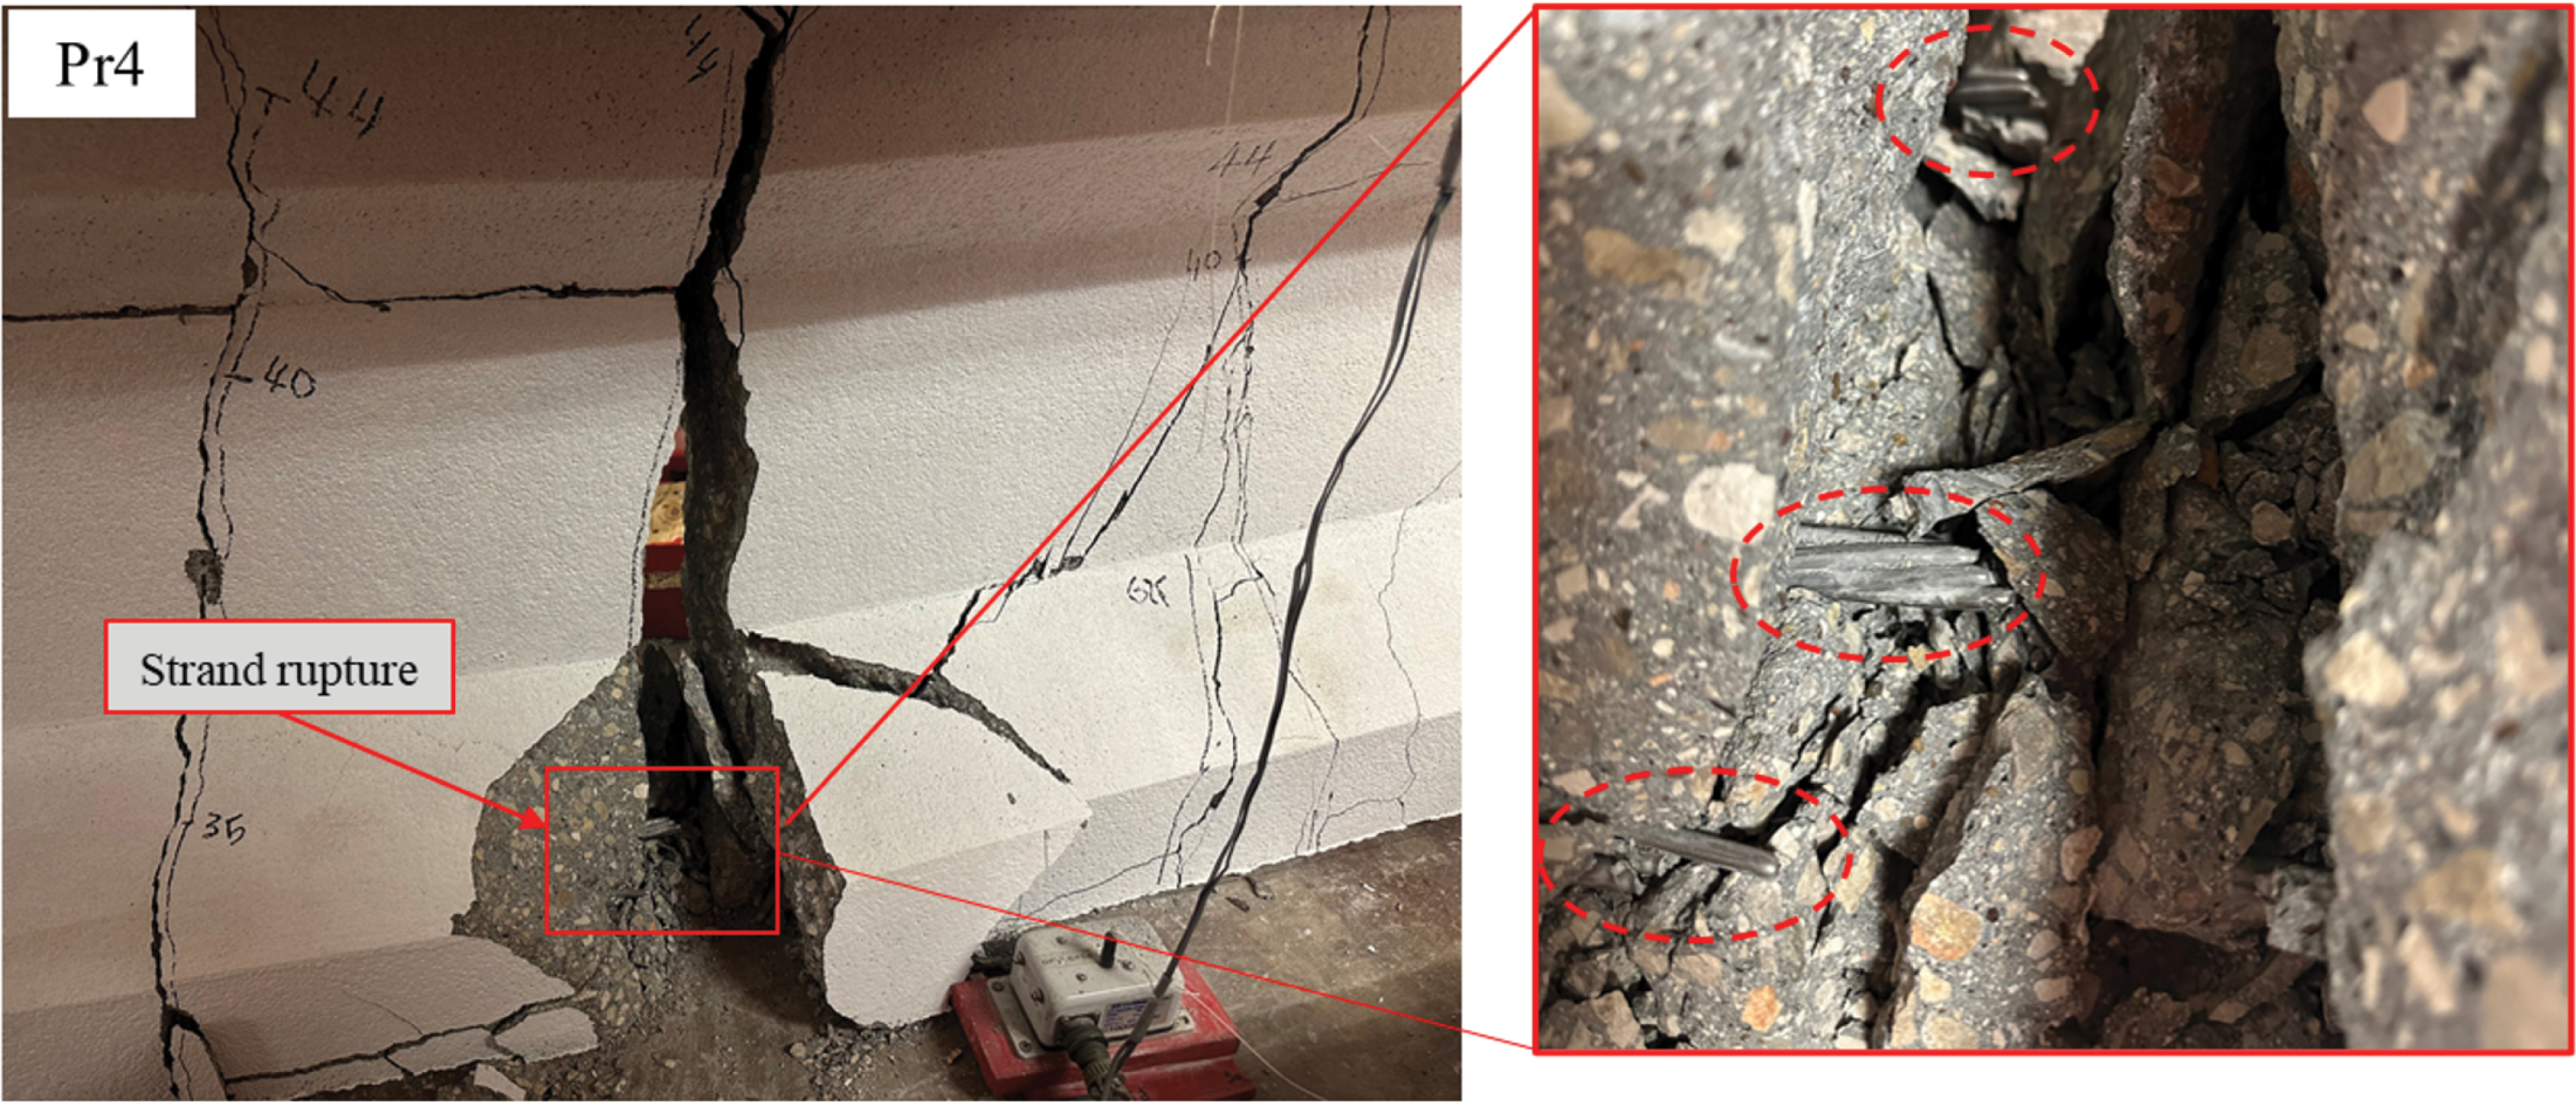
Long Description.
Two photographs document the rupture of all seven wires of the stainless steel strand in specimen P r 4. The left photo shows a close-up of a wide vertical crack extending from the bottom of the girder into the web area. Lines outline the crack boundaries, and a red label marks the location of strand rupture. A zoomed-in view on the right highlights the fractured ends of individual wires within the strand, clearly showing all seven wires broken and exposed within the concrete matrix. Dashed outlines in both views mark the rupture zone. Surface markings are also visible to indicate measurement locations on the girder.
seven-wire strands. As explained earlier, it is important to highlight that the large crack appeared precisely at the moment of strand rupture, while the unbonded posttensioned specimen developed cracks upon initial cracking and gradually increased in width until failure. Additionally, the specimens displayed significant warning signs prior to failure, including extensive cracking that progressed from the initial stages to the final failure, along with noticeable deflection as the failure load approached. Crack patterns observed for each specimen are shown in Figure 28. More detailed results are provided in Appendix B.
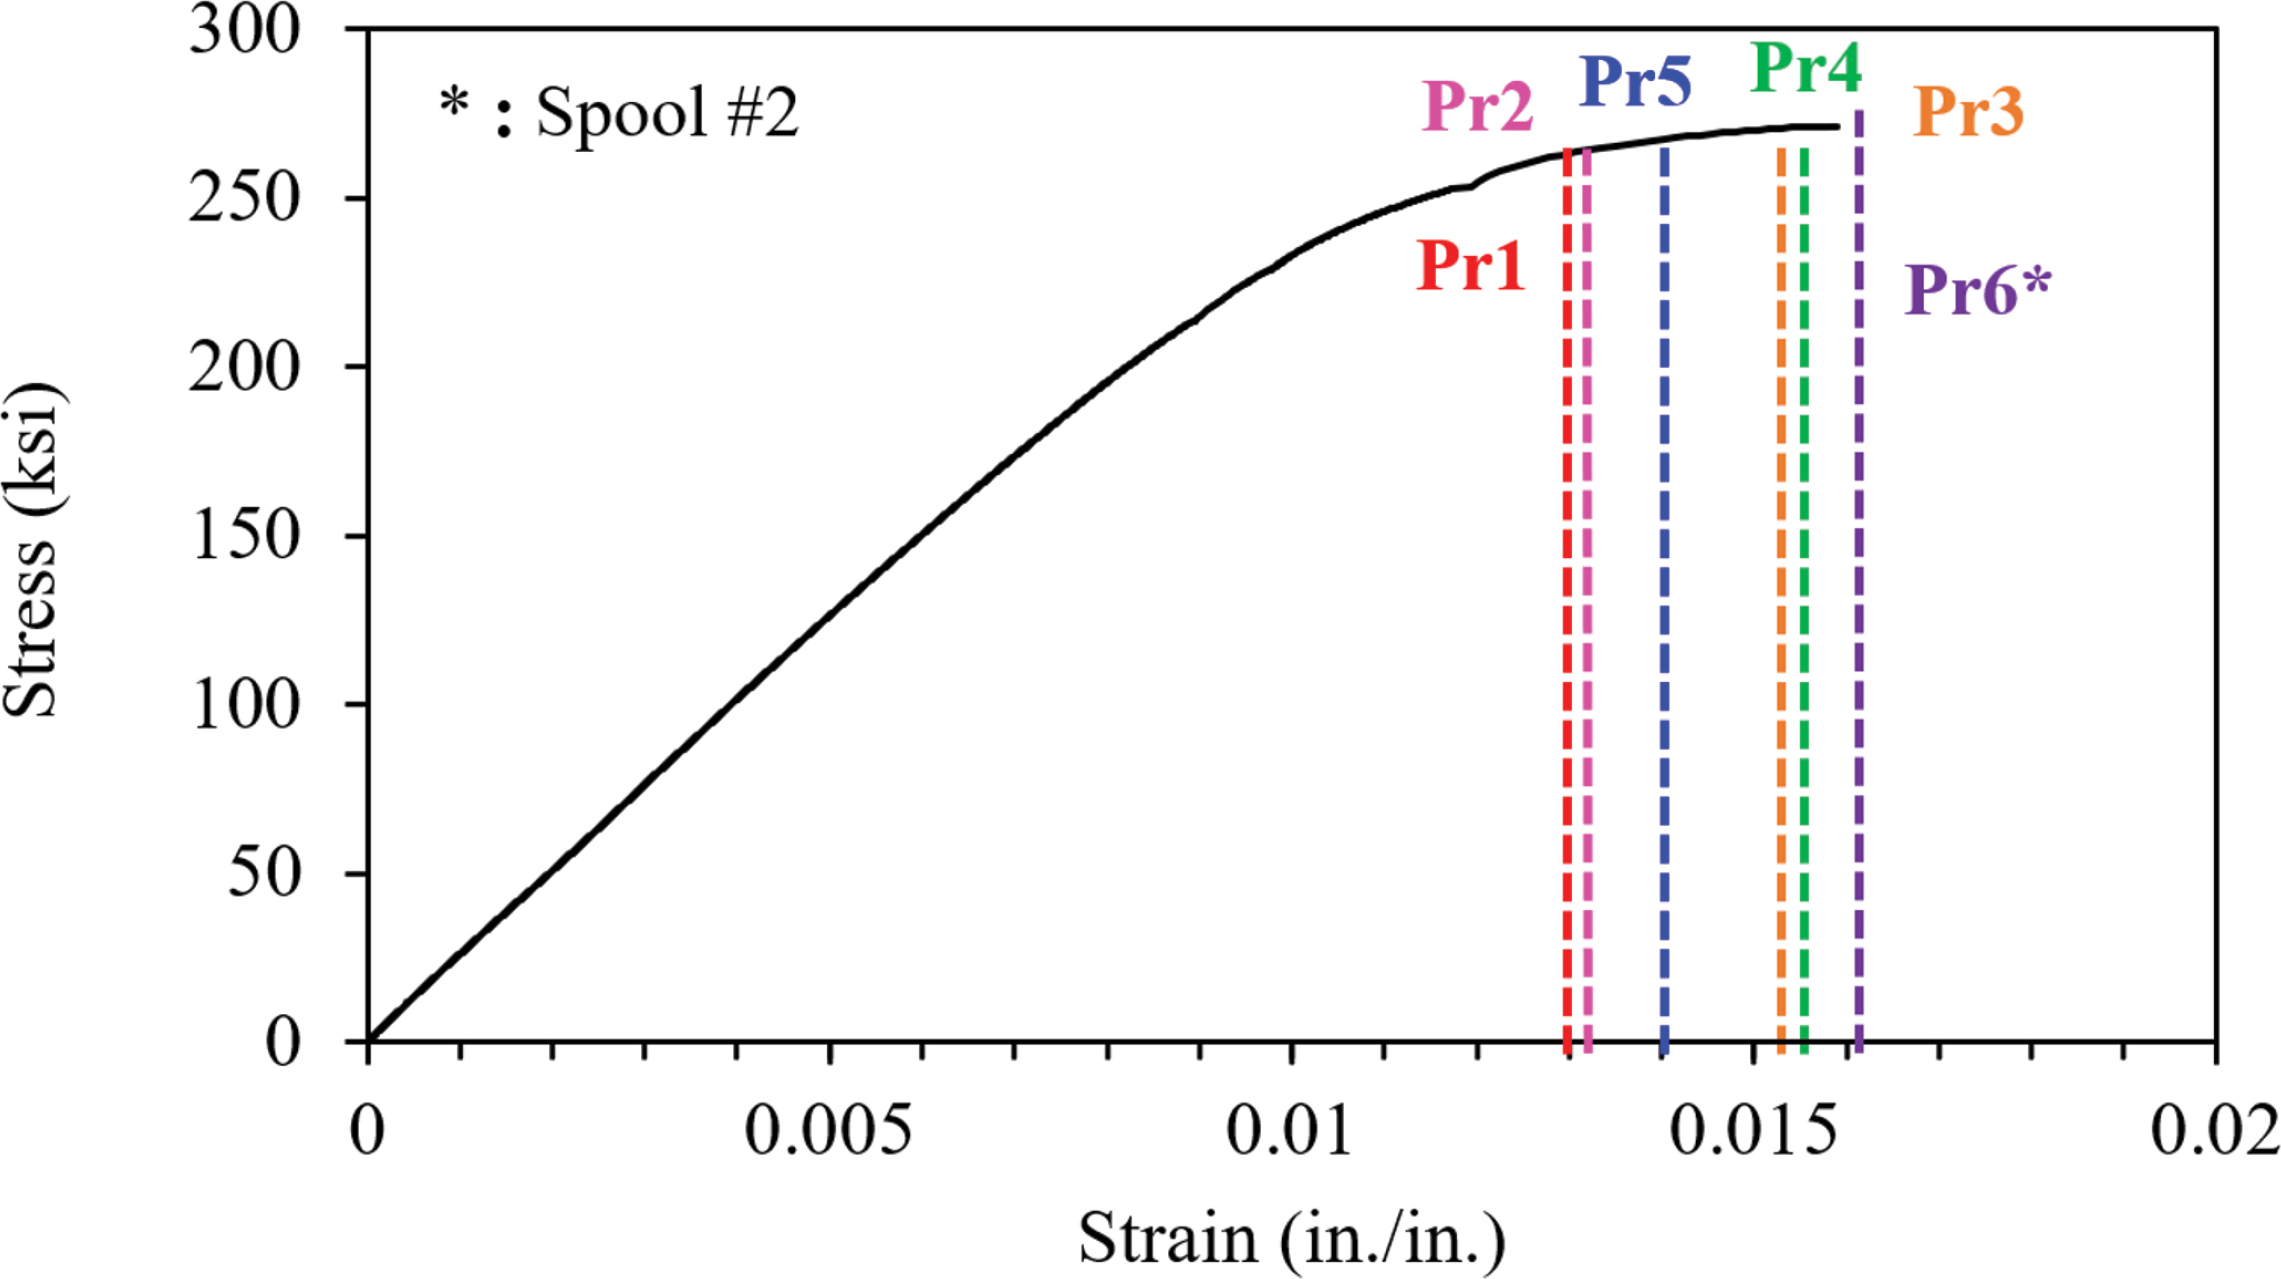
The uniaxial measured stress-strain relationships for the SS strands relative to the maximum strain recorded in the strands at the ultimate applied load for all test specimens are indicated in Figure 29, where dashed lines in the figure indicate the ultimate strain measured for each specimen. Strains were measured by strain gauges on strands at midspan for all specimens. For specimens that experienced strand rupture, the recorded strains nearly reached the ultimate strain measured in the tensile test for Spool 1, which was 0.0157 in./in., except for Pr2, where the strain gauge got damaged before reaching the ultimate load, and the strain shown for Pr2 is the last reading recorded. The ultimate strain measured in the tensile test for Spool 2, which was used for Specimen Pr6, was 0.017 in./in. For Specimens Pr1 and Pr5, the measured strains reached values of 0.0132 in./in. and 0.0145 in./in., respectively, slightly less than the ultimate tensile test. These lower strand strains were expected for Specimens Pr1 and Pr5 because the concrete strengths for these specimens were lower than expected, resulting in failures by crushing of the concrete rather than strand rupture (Mechaala et al., 2025).
3.5.3.2 Posttensioned Specimens
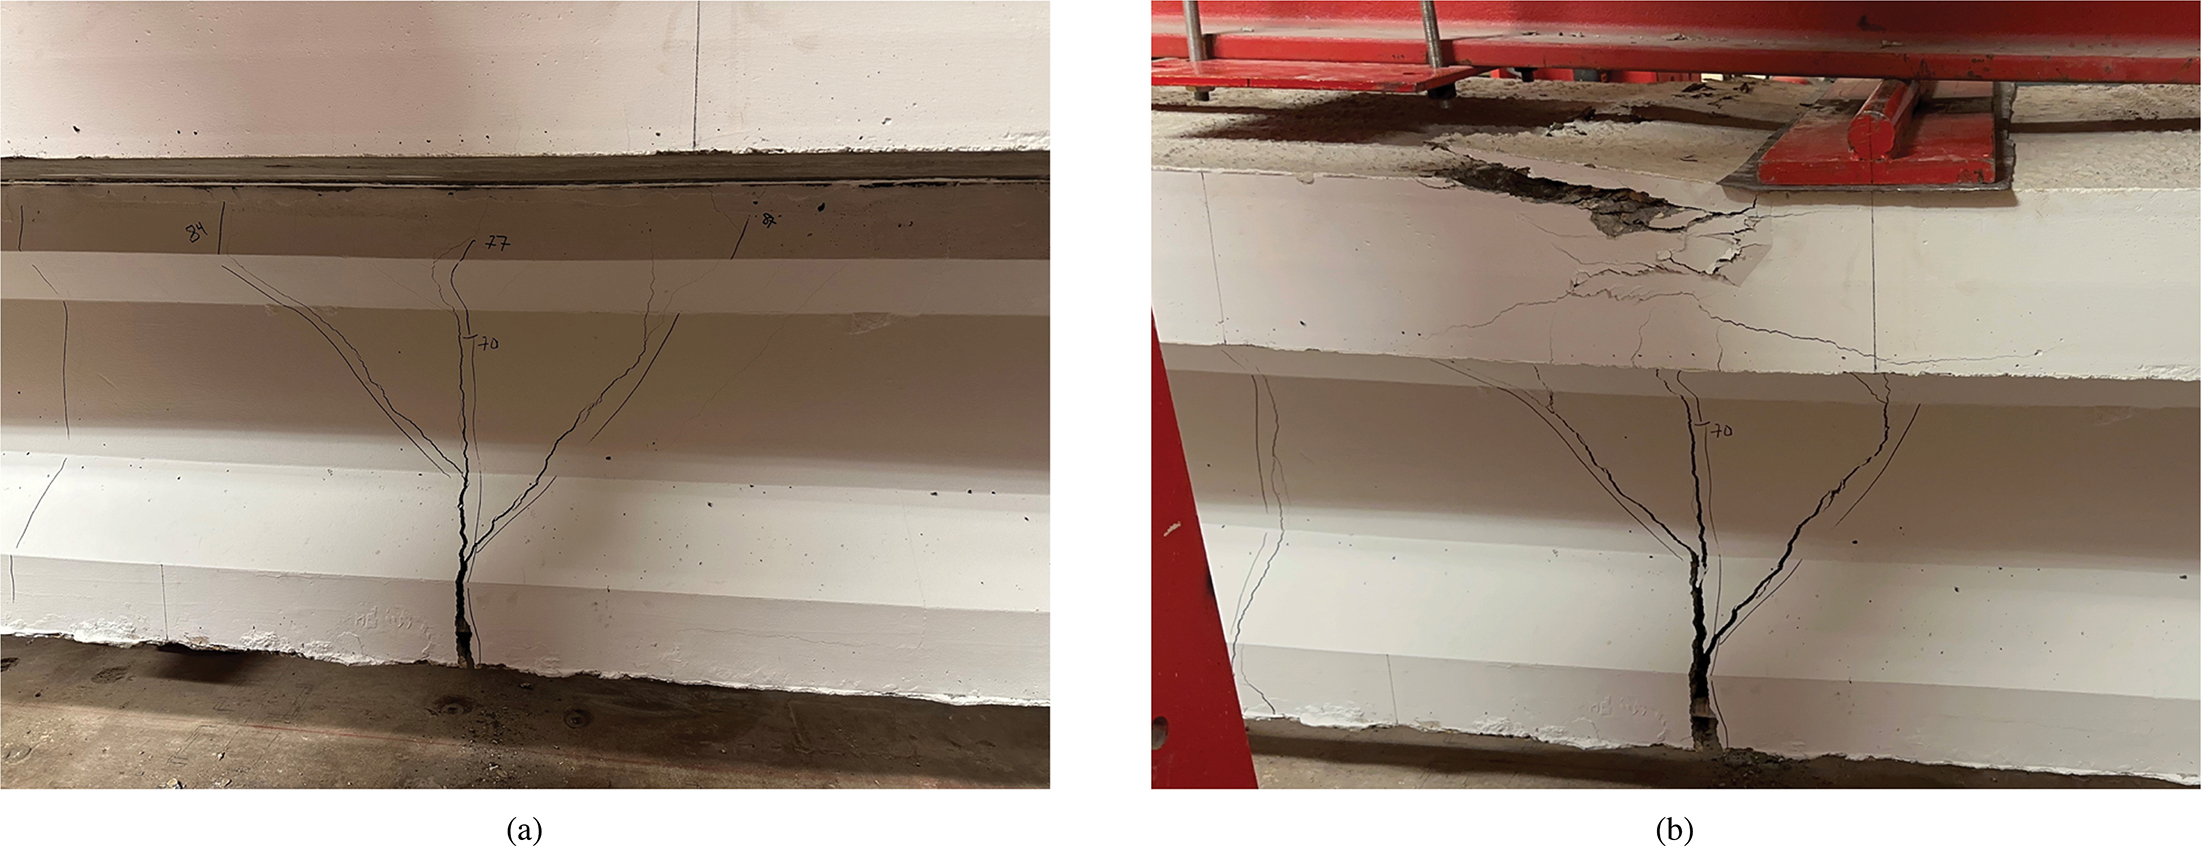
For the girders with unbonded tendons (Specimens Po2 and Po3), failure was governed by concrete crushing, characterized by a large crack within the constant moment region, as shown in Figure 30. It is important to note that the larger crack observed at failure in girders with unbonded tendons differs from crack patterns in girders with bonded tendons (both pretensioned and posttensioned). In specimens with bonded tendons, large cracks typically appear only at failure. In specimens with unbonded tendons, due to the concentration of rotation at crack locations, only a few cracks form, with their width and depth rapidly increasing during loading (see Figure 30). Both of the specimens with unbonded tendons failed with two large cracks near midspan. Crack patterns observed in the posttensioned specimens, and also pretensioned Specimen Pr2, are presented in Figure 31. The bonded posttensioned specimen, Specimen Po1, displayed significant warning signs before failure, including progressive cracking from the initial stages to the final failure. However, the distribution of these cracks was less extensive compared to that observed in bonded pretensioned specimens. More detailed results are provided in Appendix B.
Long Description.
Digitized crack patterns for six pretensioned girder specimens labeled P r 1 through P r 6. The horizontal axis for each girder spans from quarter span to quarter span, with midpoint and load points marked by a vertical dashed red line and arrows. P r 1 and P r 5, which failed by concrete crushing, show thick and wide cracks concentrated near midspan. P r 1 has a dominant vertical crack with branching at the top, while P r 5 has multiple large cracks extending vertically. P r 3 , P r 4, P r 2 , and P r 6 failed by strand rupture and display relatively narrow cracks. These are primarily located around the midspan and extend upward in a fan-like pattern from the bottom of the girder. Crack density is higher around load points but remains confined to the central region. The view excludes the outer quarters of each specimen, focusing only on the test region between the load points.
Long Description.
The graph displays a tensile test result for stainless steel strand from Spool 1. The vertical axis shows stress in k s i from 0 to 300, and the horizontal axis shows strain in inches per inch from 0 to 0.02. The curve begins at the origin and increases steeply, transitioning to a flatter slope as it nears 270 k s i stress. Colored vertical dashed lines indicate the strain at failure for six specimens. P r 1 fails at about 0.013 strain, P r 2 near 0.0131, P r 5 at approximately 0.0145, P r 4 near 0.0155, P r 3 slightly beyond 0.0155, and P r 6 marked with an asterisk representing Spool 2, failing near 0.0167. All strains align close to the peak of the stress-strain curve, suggesting failure occurred near ultimate strand stress.
Long Description.
The left photograph labeled a shows specimen P o 3 after reaching the cracking stage at 85 kips. A few thin vertical and diagonal cracks are visible extending from the bottom midspan region upward. The concrete surface appears intact, and the cracks are outlined with dark markings. The right photograph labeled b shows the same specimen at failure. Cracks have widened and extended to the top flange, and the top surface near the loading point has crushed inward. The crushing zone includes multiple branches, and the midspan bottom crack has widened substantially. Support plates and actuators are seen above the specimen in both views, indicating load application locations.
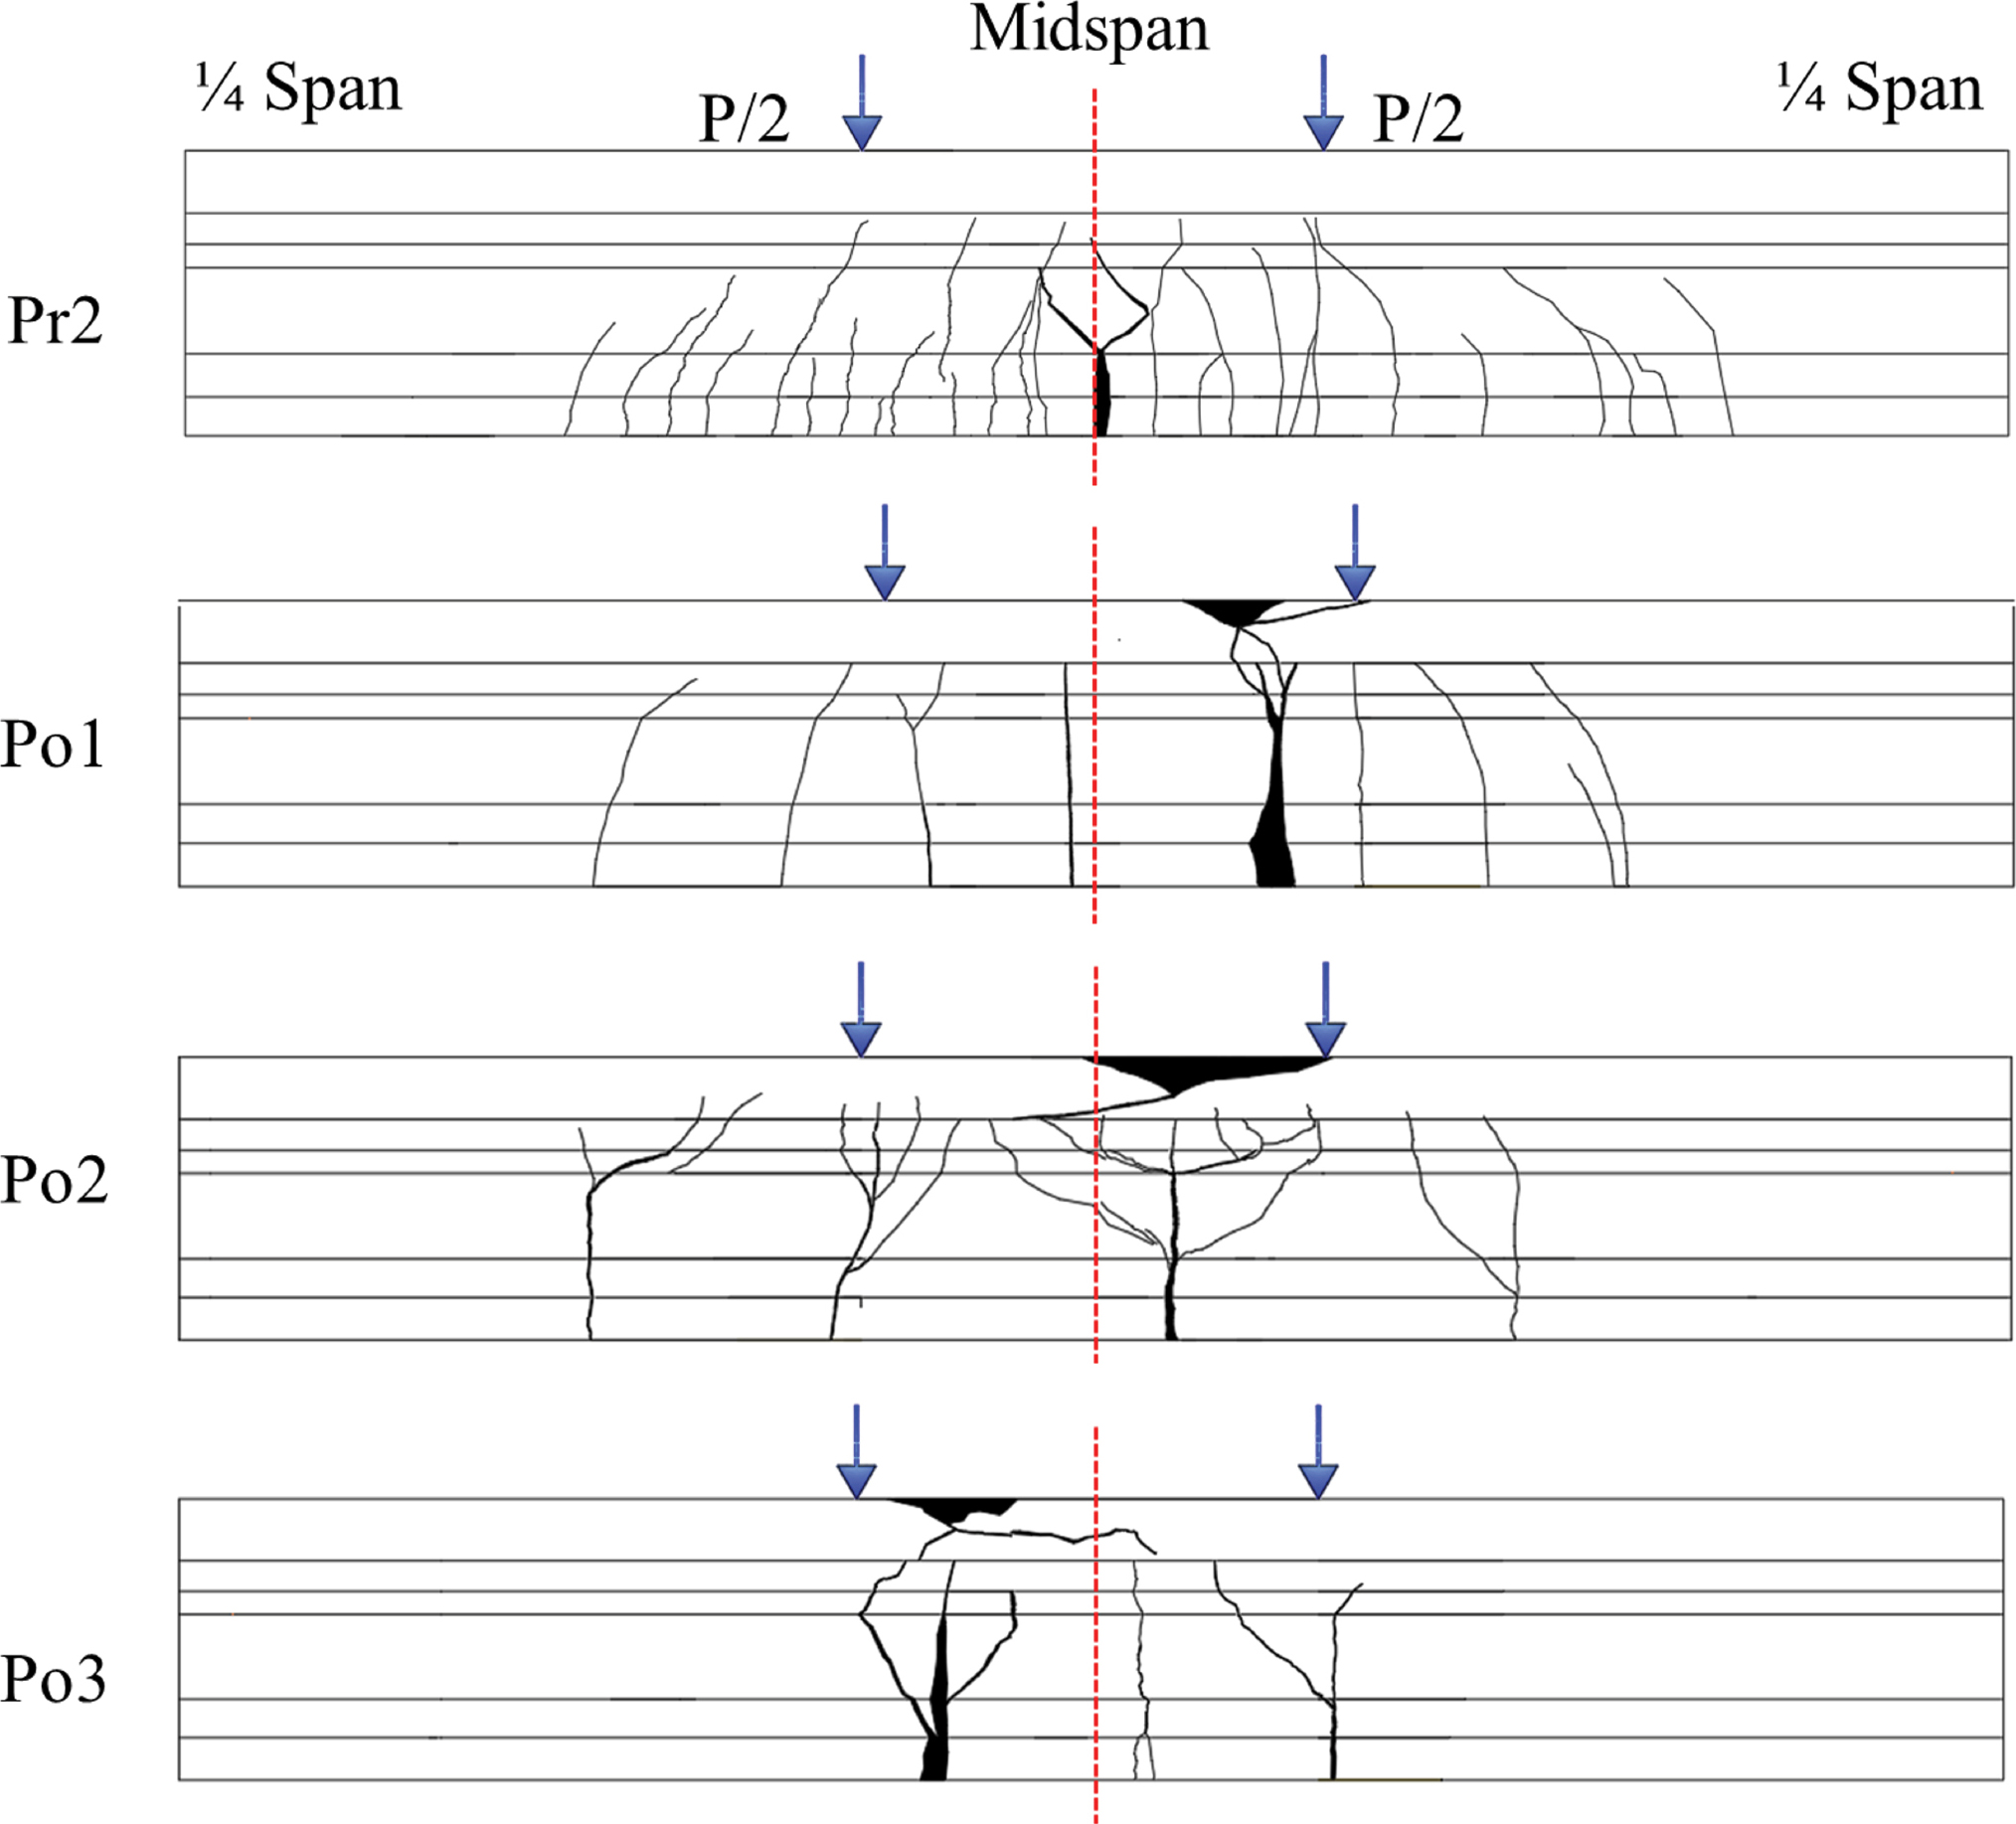
Long Description.
Digitized crack patterns for four girder specimens, P r 2 , P o 1, P o 2, and P o 3, displaying the region between quarter span points. Horizontal beams are marked with quarter span, half span, and midspan lines. Arrows indicate loading points at P over 2 and midspan is marked by a dashed line. P r 2 shows fine vertical cracking centered at midspan. P o 1 shows vertical and diagonal cracks near midspan with concrete crushing at the top face. P o 2 displays wide horizontal and vertical cracks at midspan with splitting along the top and sides. P o 3 has multiple vertical cracks at midspan with visible crushing at the top. All crack zones concentrate around the load points, showing different crack distributions and failure intensities for each post-tensioned and pretensioned specimen.
3.5.4 Shear Test
An AASHTO Type I girder prestressed with SS strand and reinforced with CS shear reinforcement on one end and SS shear reinforcement on the other end was tested in shear at both ends. The specimen was tested under 3-point bending with a shear span of 6 ft, corresponding to a shear-span-to-depth ratio (a/d) of 2, and exhibited shear-controlled failure. The section and half-elevation views of the reinforcement for Specimen Pr7 are presented in Figure 32 (details on the design and construction of the specimens are provided in Appendix B). Figure 33 shows the general specimen layout with the critical tested shear zone highlighted. Photographs of shear test setup are presented in Figure 34.
3.5.4.1 Shear Test Results
Results for the test region with stainless steel stirrups are discussed here. Initially, before any cracking, the load increased linearly. The first crack appeared at a shear force of 122.8 kip (with an applied load at the loading frame of 167 kip). As loading continued, additional flexural-shear cracks developed. The observed failure mode was a shear failure at a maximum shear force of
Long Description.
The diagram presents a half elevation and section view of specimen P r 7, an AASHTO Type 1 girder with a composite deck slab. The total beam length is 34 feet. The girder height is 28 inches, and the composite slab adds 8 inches, totaling 36 inches. The deck slab is 24 inches wide and 8 inches thick. A 6 foot section near the left support is labeled Test Region. Sets of 2 number 4 R bars are spaced in the test region at 3 inches, 6 inches, and 9 inches, and at 5 inches and at 12 inches near midspan. In the Test Region, each R bar is paired with two number 4 C bars. Number 5 bars are placed at 6 inches and at 4 inches across the slab. A single 0.62 inches high-strength stainless steel strand layer is located near the bottom of the beam. Section view shows detailed bar placement including number 3 vertical bars and the positions of R and C bars. All measurements are labeled in inches and the beam is symmetrical about the centerline.
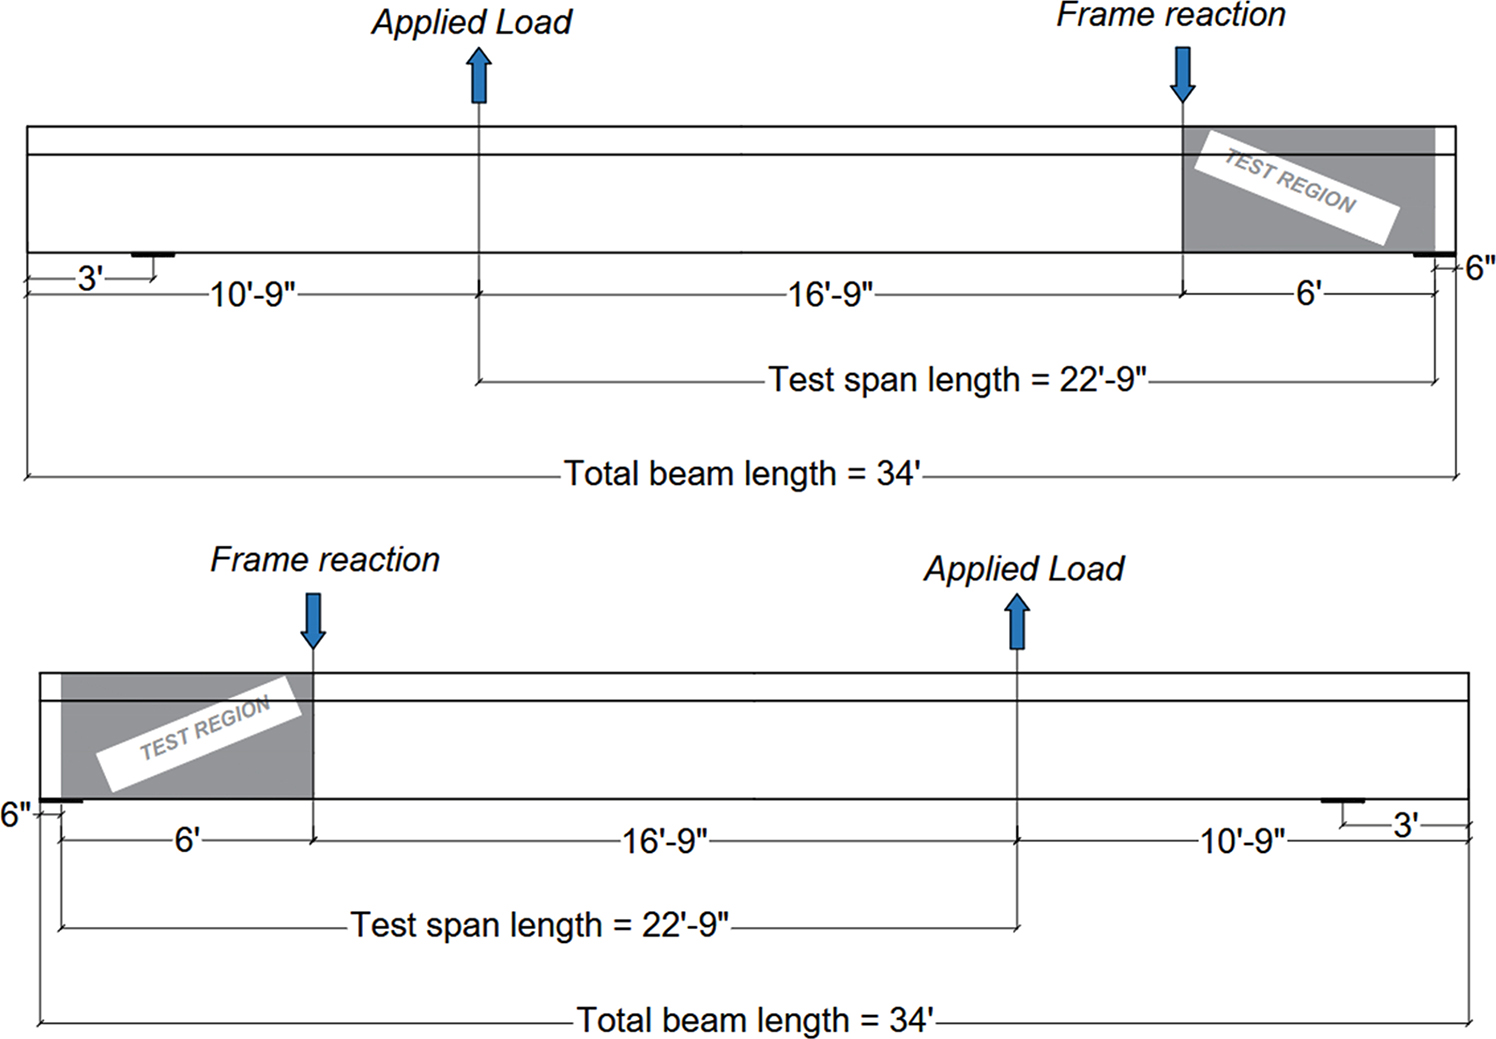
Long Description.
Two elevation views of full-scale beam specimen P r 7 with a total beam length of 34 feet. In the top view, the applied load is located 10 feet 9 inches from the left end and 16 feet 9 inches from the right support. The right support, marked as frame reaction, is 6 inches from the beam end. The test region is shaded near the right end. The test span length is 22 feet 9 inches. In the bottom view, the beam is rotated, placing the applied load 10 feet 9 inches from the right and the frame reaction 6 inches from the left. The shaded test region now appears near the left end. Each setup uses the same total beam length and test span length, but mirrors the load and support configuration to test shear behavior on opposite ends. The gray areas mark where shear cracking is evaluated during the experiment.
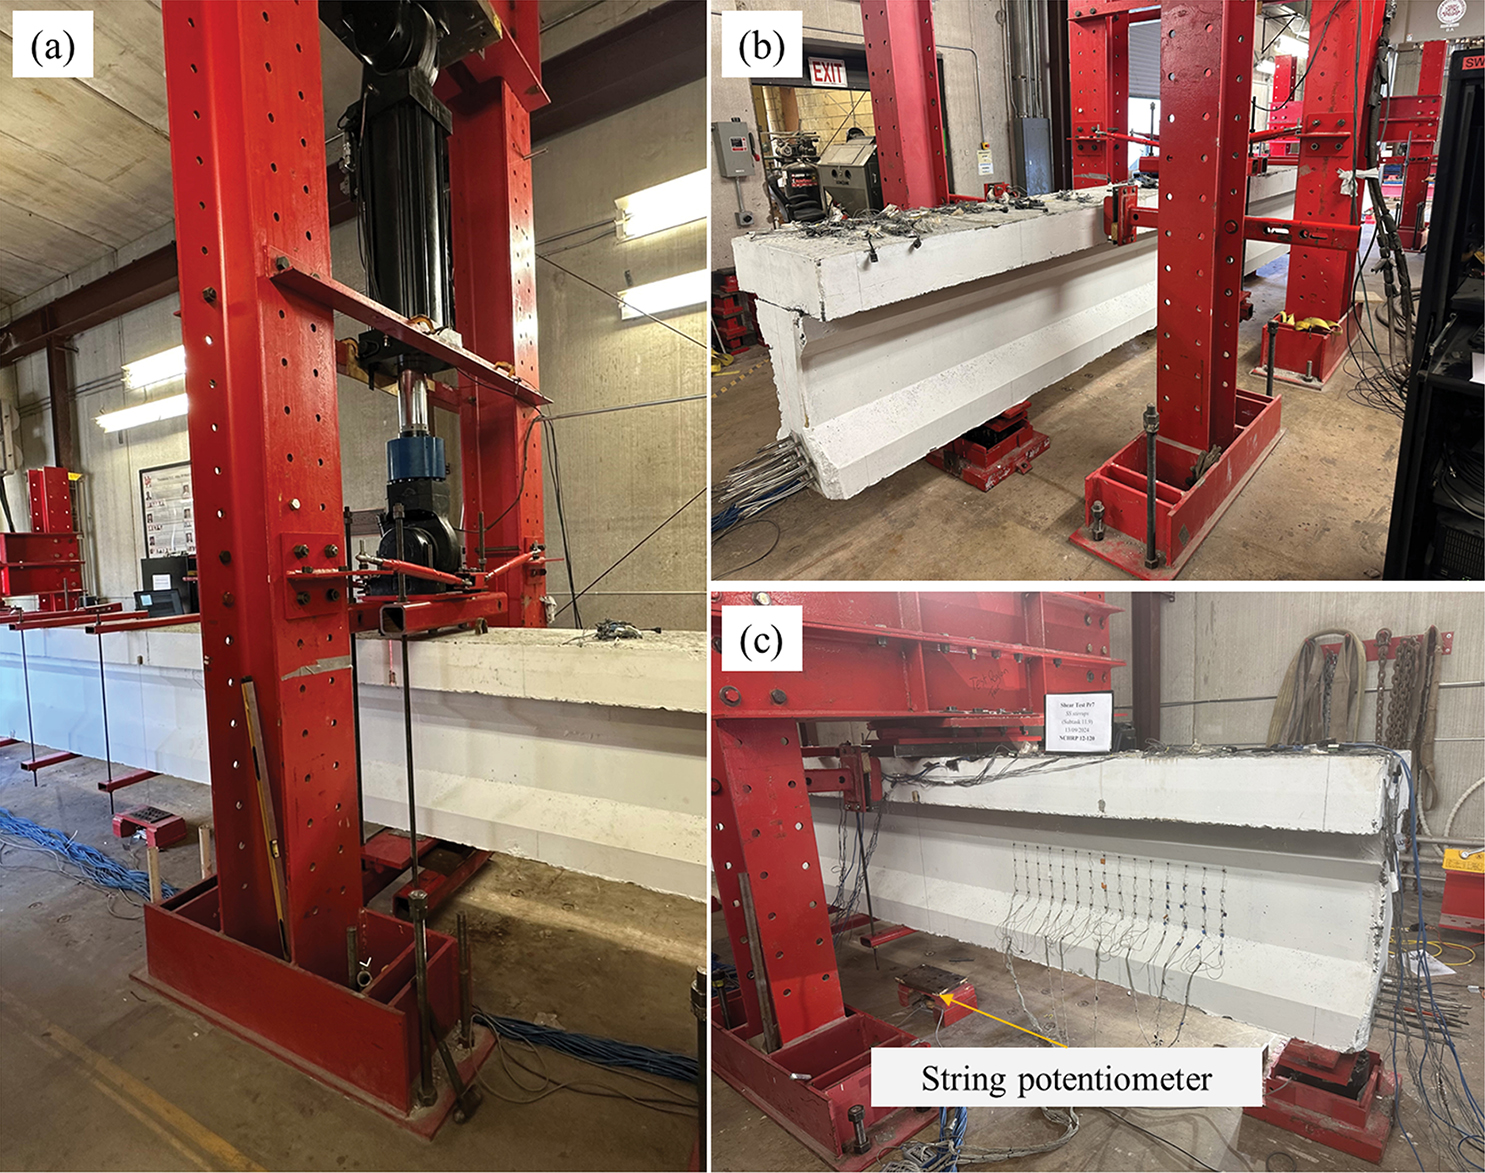
Long Description.
Three labeled photographs documenting the shear test setup for a full-scale beam. In photo A, the actuator system is shown mounted on a vertical steel frame, connected to the beam through a steel plate assembly to apply vertical loading. In photo b, the lateral restraining devices and hollow structural section rods are assembled at both ends of the beam to prevent lateral movement during shear testing. In photo c, the beam face is instrumented with multiple string potentiometers aligned vertically along the test region to measure deflection and crack opening. The label indicates their function. The beam is positioned horizontally in all views, resting on support fixtures. Wires and sensors are visible, connecting the instrumentation to external data systems.
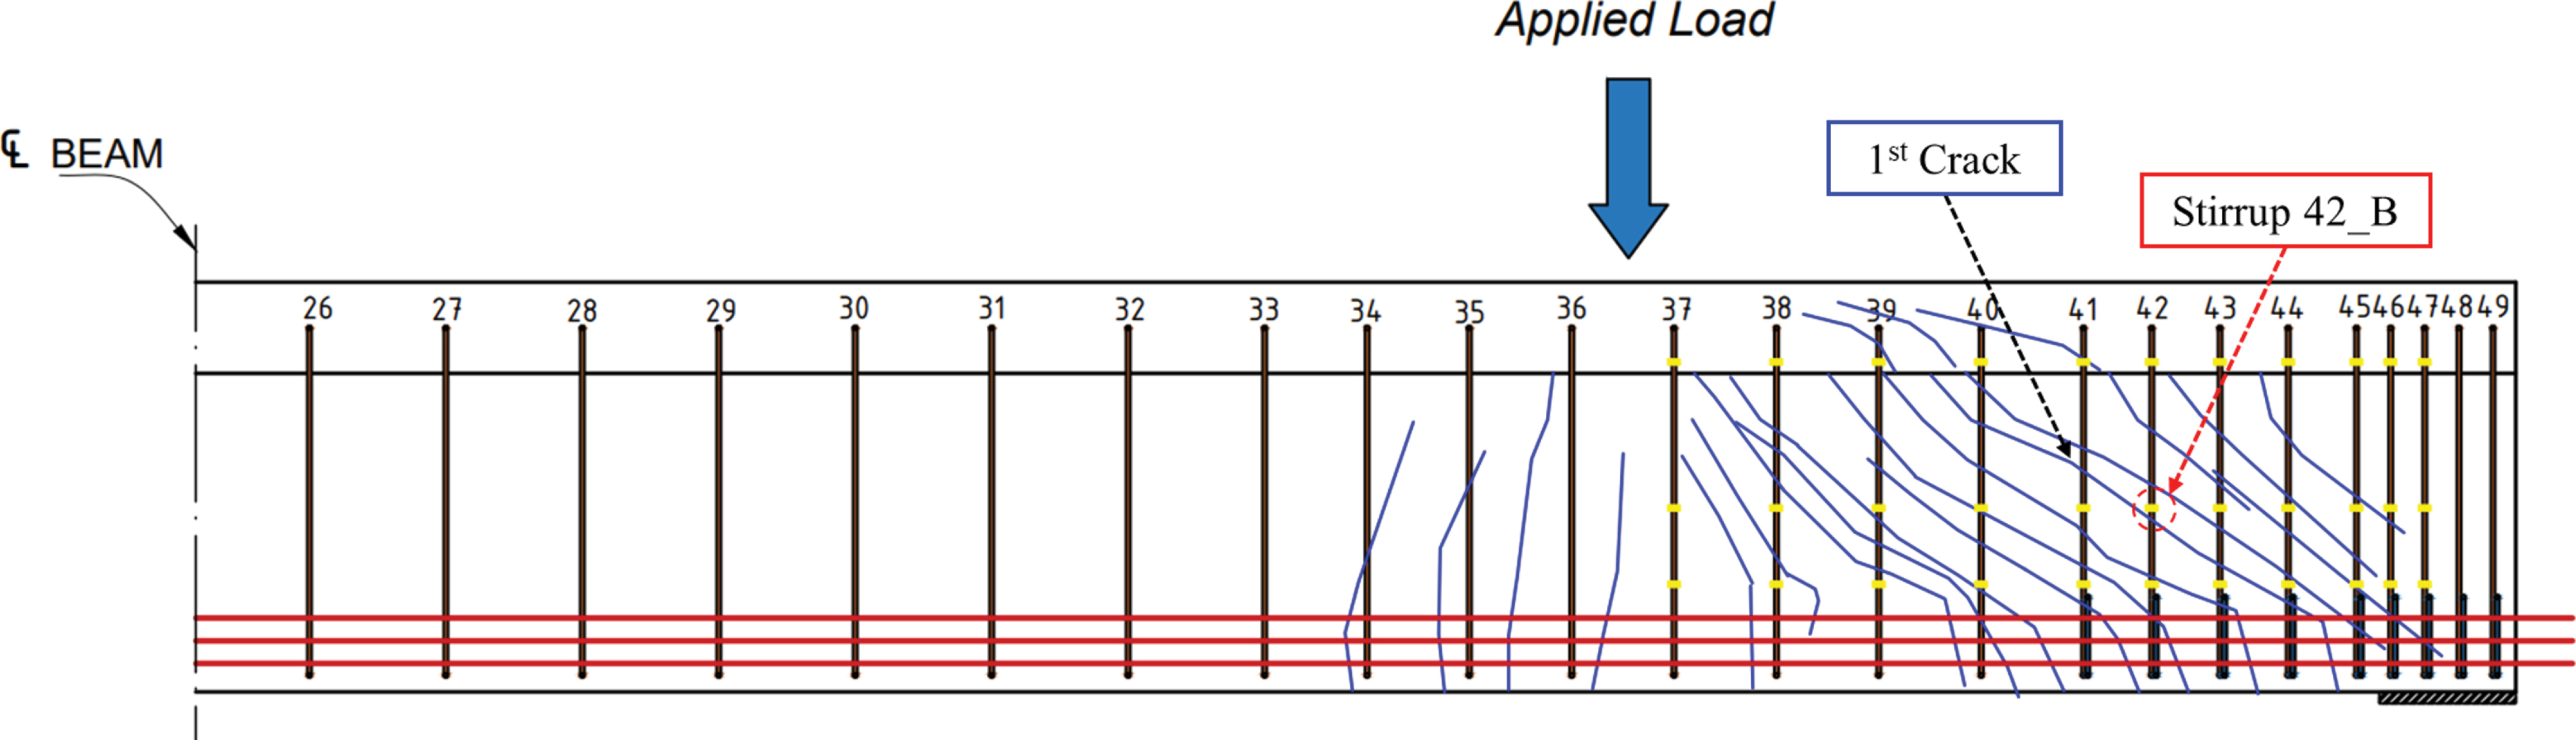
Long Description.
An illustration of the shear test region of the beamʼs east face with vertical stirrups numbered 26 through 49 and horizontal prestressing strands near the bottom. A large downward arrow indicates the applied load located at stirrup 37. Several diagonal and vertical lines mark the crack pattern extending from the bottom strands upward between stirrups 35 and 44. A label near stirrup 42 B marks the location of the first visible crack. Dots show strain gauge locations across the cracked region. The cracking pattern intensifies near stirrups 41 to 44, indicating higher shear activity. All stirrups are uniformly spaced and labeled, and the cracking develops progressively outward from the load point.
213 kip. It should be noted that no strand slippage was observed. Figure 35 shows the crack patterns in the testing region with respect to the strain gauge locations. The strain recorded at each stirrup was significantly influenced by the location of the strain gauges in relation to the concrete cracks. The maximum recorded stirrup strain was 0.0095 in./in., located at stirrup 42_B. Table 12 summarizes the cracking shear force (and applied force), failure shear force (and applied force), angle of inclination of the first crack, and the maximum recorded strain in the SS stirrups. More detailed discussions of testing for this specimen with test regions reinforced with stainless steel stirrups and carbon steel stirrups are presented in Appendix B.
3.5.4.2 Contribution of Concrete to the Total Shear Force in Both Test Zones
To understand the change in shear force components, the first crack that appeared in Zone B was chosen as a reference point, and the stirrups that intersected with the crack were specified and considered as the main shear contribution of the transverse reinforcement, Vs. Figure 36 shows the contribution of concrete and stirrups to the total shear force using NDI strain measurements for both stainless steel stirrups and carbon steel stirrups. It is important to note that the primary difference between using SS stirrups and CS stirrups lies in their yield stresses—75 ksi for SS and 60 ksi for CS. Additionally, the concrete shear contribution, Vc, differed between the two ends: 94.8 kip for Zone A (with CS stirrups) and 122.8 kip for Zone B (with SS stirrups). However, the predicted value for Vc, based on LRFD BDS equations was 30 kip. As a result, LRFD BDS equations for calculating the concrete shear contribution, Vc, is conservative and underestimates the contribution of the concrete to the total shear capacity.
The SS stirrups exhibited comparable performance to the CS stirrups, reaching a maximum strain of 0.0095 in./in. As a result, LRFD BDS Eq. 5.7.3.3-4 can be used to calculate the contribution of steel transverse reinforcement by using the mechanical properties of SS stirrups. More detailed results are provided in Appendix B.
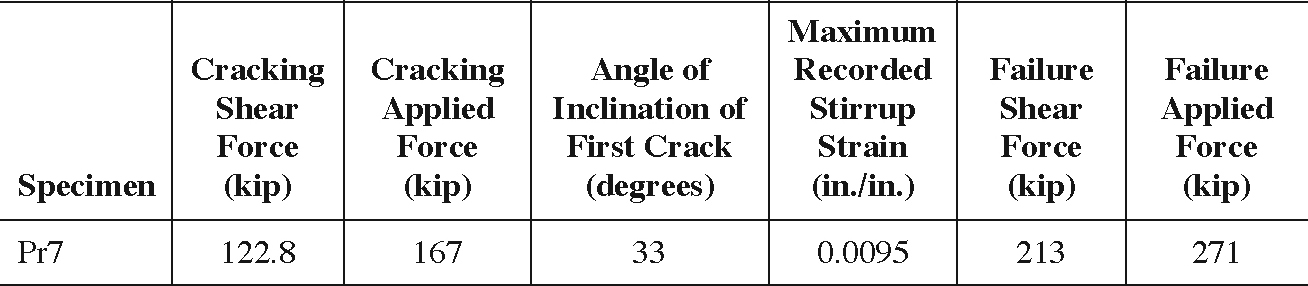
Long Description.
The table summarizes shear test results for Zone B of specimen P r 7. The cracking shear force is 122.8 kips, and the corresponding applied force at first crack is 167 kips. The angle of inclination of the first crack is 33 degrees. The maximum recorded stirrup strain is 0.0095 inches per inch. At failure, the shear force reaches 213 kips, and the applied force is 271 kips.
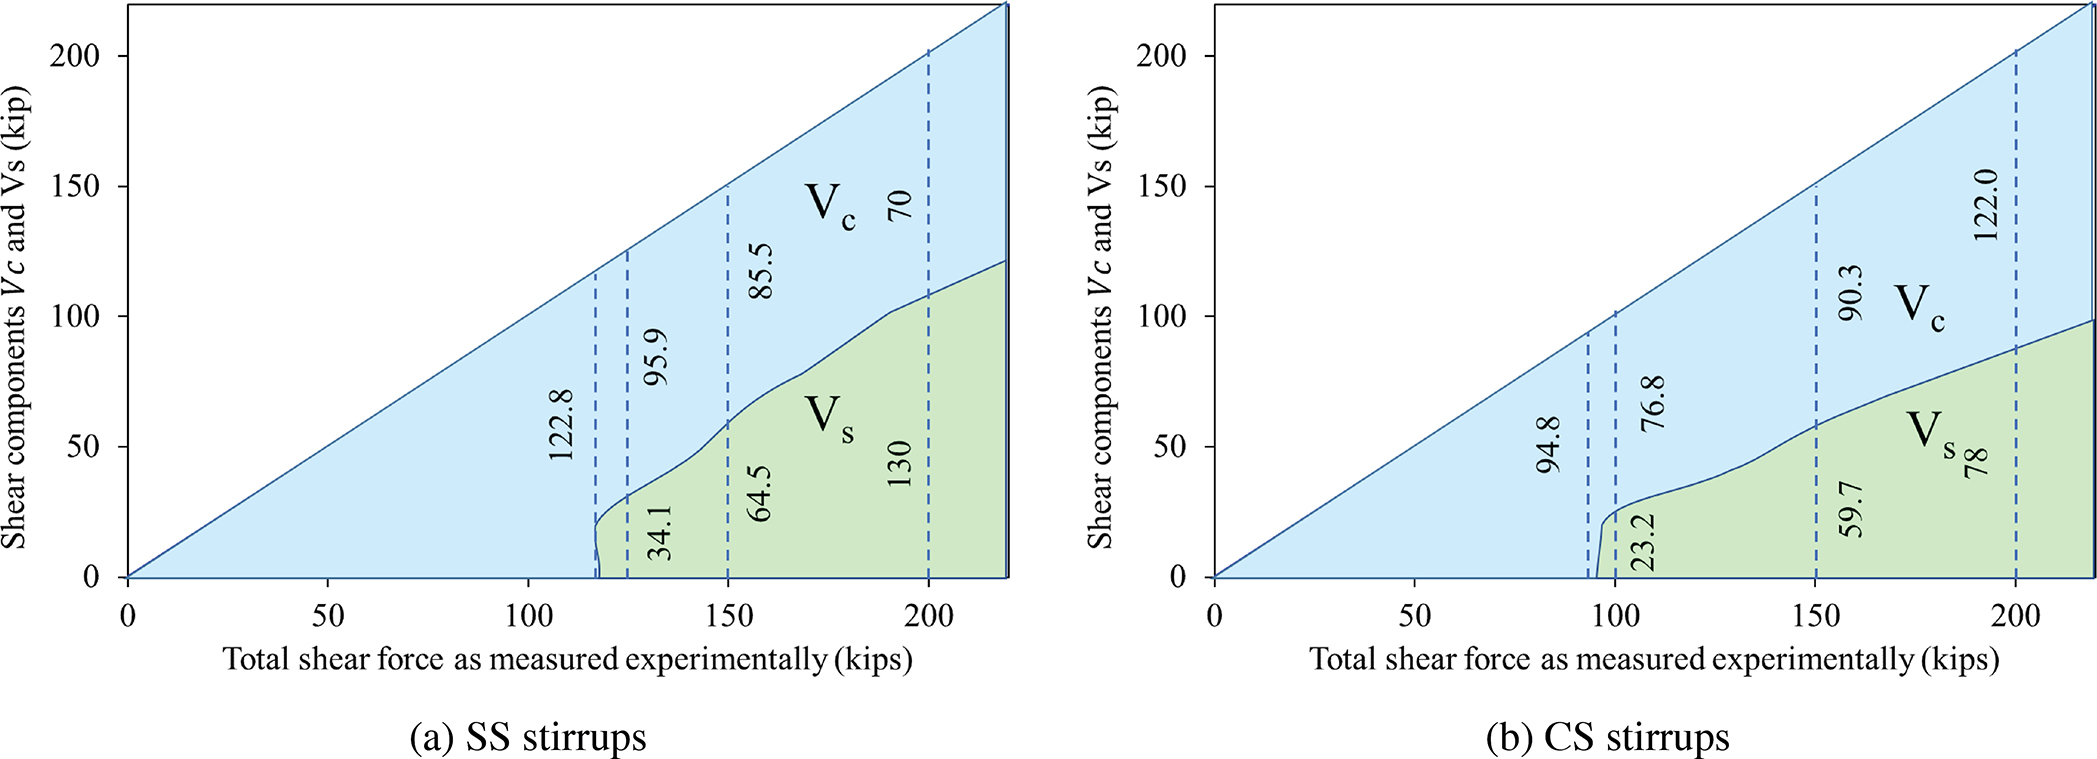
Long Description.
The left graph labeled a shows shear component V c from concrete and V s from stainless steel stirrups versus total measured shear force. The total shear force axis ranges from 0 to 200 kips. At 122.8 kips, concrete contributes 95.9 kips, and stirrups contribute 34.1 kips. At 150 kips, concrete contributes 85.5 kips, and stirrups contribute 64.5 kips. The right graph labeled b presents the same relationship for carbon steel stirrups. At 122.2 kips, concrete contributes 76.8 kips, and stirrups contribute 23.2 kips. At 150 kips, concrete contributes 90.3 kips, and stirrups contribute 59.7 kips. In both graphs, the blue area represents the concrete contribution and the green area represents the stirrup contribution. Vertical dashed lines indicate specific measured points along the increasing diagonal of total shear. Data is based on strain gauge measurements taken during testing.


