Offshore Renewable Energy Development on the West Coast: Understanding Effects on Shipping, Fisheries, and Maritime Activities (2026)
Chapter: 3 Uses of Offshore Areas: Fishing Activity
3
Uses of Offshore Areas: Fishing Activity
This chapter documents historical and current fishing activity off the West Coast as a foundation for understanding how ORE may affect and interact with fishing activities. It also considers how ongoing changes to fish stocks may affect ORE interactions with fishing activity in the future. The chapter provides an overview of West Coast fishing activity including commercial, Tribal, and recreational fisheries and their associated gear, and historical and current fishing ground locations. Next is a discussion of the CCE including the hydrodynamics which supports upwelling and primary production along the West Coast and affects potential future shifts in fish stocks. The chapter concludes by examining how fisheries may move or expand because of changing ocean conditions, possibly into areas with no historical or current fishing activity. The interactions between fisheries and ORE development are discussed in Chapter 7.
WEST COAST FISHERIES
Fisheries are often defined by the type of fishing gear they use, the geographic area they cover, and the species they target or harvest. Fisheries may be commercial, fishing for profit; recreational, fishing for pleasure or sport; or subsistence, which refers to fishing for personal consumption in support of families, individuals, or communities (NOAA Fisheries, n.d.-n).
The West Coast is home to diverse commercial, recreational, and Tribal fisheries targeting shellfish, salmon, a variety of bottom-dwelling species known as groundfish, highly migratory species (HMS; e.g., tuna, swordfish), coastal pelagic species (CPS; e.g., sardine, squid), and others. These fisheries are managed through complex systems involving international, federal, and state processes. They are managed for various purposes including providing a sustainable supply of seafood, protecting ecosystems, supporting economies, and maintaining community resilience.
Fisheries that operate within federal waters are managed by both NMFS and regional fisheries management organizations.1 Regional fisheries management organizations are guided by several laws, including the Magnuson-Stevens Fishery Conservation and Management Act (MSA),2 which outlines national standards for fisheries
___________________
1 Regional Fisheries Management Organizations are international bodies formed by countries with fishing interests in specific areas of the ocean. These organizations play a crucial role in ocean governance and sustainable fisheries management worldwide.
2 H.R.5103, 118th Congress.
management. These standards help establish sustainability within fisheries by fostering objectives such as habitat protection, prevention of overfishing, and the rebuilding of overfished stocks.
Fishing is a way of life and an important source of income and well-being for many people. It fosters a sense of community, supports local economies, and can be a tradition passed down through generations. The act of fishing requires a willing crew, a degree of skill and technical knowhow, and specialized gear. Within communities, fisheries are supported by businesses such as fuel docks, ice suppliers, fishing gear and marine suppliers, offloading stations and facilities, fish buying and processing facilities, and cold storage facilities.
Additionally, several Tribes on the West Coast have treaties reserving their right to fish in “usual and accustomed” fishing areas. Federal fisheries and Washington State fisheries in Pacific Ocean waters are co-managed with Tribes with treaty-reserved fishing rights (PFMC, n.d.-c).
Detailed descriptions of the primary West Coast commercial and recreational fisheries that may be impacted by ORE development in Pacific Ocean waters and more information on Tribal treaty rights, co-management, and Tribal fisheries are provided later in this chapter.
U.S. West Coast Fisheries Management
Federal fisheries within the EEZ off California, Oregon, and Washington are managed by the PFMC through fishery management plans (FMPs). The PFMC is one of eight regional management councils established by the MSA and has jurisdiction over the 3,200 miles of the EEZ off California, Oregon, and Washington (PFMC, n.d.-d). The MSA requires regional fishery management councils to set catch limits for each FMP-managed stock through their plans and include fishery goals, objectives, and policies to provide the framework for stock-specific catch limits and fishery-specific management regulations (NOAA Fisheries, n.d.-f). The PFMC also produces stock assessment and fishery evaluation reports for the fisheries it manages, including groundfish, salmon, CPS (e.g., sardine, anchovy, market squid), and HMS (e.g., tunas, swordfish, pelagic sharks; PFMC, n.d.-b). These reports summarize the status of the stocks managed under the FMP, socioeconomic conditions of the fishery and fishery participants, and the available data for each fishery. West Coast coordination for internationally managed fisheries, such as Pacific halibut, and international fishery management entities formed by treaties or agreements for stocks such as Pacific whiting, Pacific salmon (Chinook and coho), albacore tuna, and other tunas and billfish also occurs through the PFMC process (PFMC, n.d.-d).
Management of a fishery is often based on the size of the fish stock, its projected change (i.e., annual change incorporating catch, recruitment, other causes of mortality), and a rule on what fraction of that change should be caught (i.e., catch targets or quotas). Stock sizes and their change are often derived from data and data models. Fishery data includes both fishery dependent data and fishery independent data. Records of catch, landings and, ideally, effort, which may be sourced directly from fishery participants and/or observers are examples of fishery dependent data, while information collected and estimated through independent surveys would be fishery independent data. NOAA conducts a variety of U.S. West Coast–wide surveys (Table 3-1 and Figure 3-1). Fishery models use the data to reconstruct past and predict future stock sizes, which in turn helps management councils determine the future sustainable catch and fishing rules.
Commercial Fisheries
According to MSA provisions NMFS maintains a list of authorized fisheries and gear (commercial and recreational) allowed to operate on the west coast EEZ (NOAA Fisheries, n.d.-g). NMFS is additionally required to classify all U.S. commercial fisheries regarding the level of its interactions with marine mammals and produces a separate List of Fisheries by area. Not only is this list useful for understanding the likelihood of fishery-specific encounters with marine mammals, but it also includes the estimated number of vessels participating in federal- and state-managed commercial fisheries. Table 3-2 provides a list of West Coast commercial fisheries. Summary descriptions of these fisheries and gear types and potential interactions with ORE structures follow in the text.
TABLE 3-1 NOAA’s National Marine Fisheries Service Scientific Surveys along the U.S. West Coast
| Survey | Year Started | Informs Mandated Activities Under | |
|---|---|---|---|
| 1 | West Coast Groundfish Bottom Trawl Survey | 1998 | MSA, ESA |
| 2 | Integrated Ecosystem and Pacific Hake Survey | 1977 | MSA |
| 3 | West Coast Pelagic Fish Survey | 2006 | MSA |
| 4 | West Coast Marine Mammal Survey | 1991 | MMPA, ESA |
| 5 | Pacific Orcinus Distribution Surveys | 2015 | MMPA, ESA |
| 6 | Rockfish Recruitment and Ecosystem Survey | 1983 | MSA |
| 7 | Pre-Recruitment Survey | 2011 | MSA |
| 8 | Juvenile Salmon and Ocean Ecosystem Survey | 1998 | MSA, ESA |
| 9 | Trinidad Head Line | 2007 | MSA, ESA |
| 10 | CalCOFI Survey | 1949 | MSA, ESA |
| 11 | Newport Hydrographic Line | 1996 | MSA, ESA |
| 12 | Southern California Shelf Rockfish Hook and Line Survey | 2003 | MSA |
| 13 | Northern California Current Ecosystem Survey | 1996 | MSA |
NOTE: Numbers correspond to key in Figure 2-2. ESA = Endangered Species Act, MMPA = Marine Mammal Protection Act, MSA = Magnuson- Stevens Act.
SOURCE: Modified from Ise and Amiotte, 2025. Presentation to the committee.
West Coast Commercial Fisheries’ Management Structure and Regulations by Fishery
Every fishery is unique and often requires a distinct management process, fishing year,3 and specific regulations for gear types, fishing seasons, and other restrictions, such as area closures. The majority of fisheries operating off the West Coast are subject to license limitation programs in which fishing licenses or permits must be acquired from federal or state agencies and are limited in number. Other fisheries, such as groundfish (e.g., sablefish, lingcod) and HMS (e.g., tunas), are not limited to licenses, and permits and are considered open access. The total number of vessels participating in a fishery can vary from year to year with some fishermen regularly participating and others only engaging when other opportunities are constrained.
Some fisheries have existed for decades, and many were active before they were ever managed under an FMP. The types and sizes of vessels participating include a wide range and often depend on the targeted stock and gear utilized, with smaller vessels typically fishing closer to shore. Many larger West Coast-based vessels may also transit to Alaska to participate in fisheries in the North Pacific, such as pollock or halibut, or fish out on the high seas (i.e., further than 200 NM offshore) on a regular basis.
The largest West Coast commercial fisheries, with a target species landed weight of over 100 metric tons (mt) or that generated over $1 million in ex-vessel revenue in 2024, are listed in Table 3-3 (PSMFC, 2025). Landing and revenue in Table 3-3 do not capture Tribal fisheries data, but Tribes do participate in these fisheries. The respective fisheries and gear types are described in the following discussion.
Dungeness Crab Pot Fishery
The Dungeness crab pot fishery is a fishery managed at the state level. State management allows each state to adopt and enforce laws and regulations that apply to all vessels fishing for Dungeness crab off their coasts (with the exception of vessels exercising Tribal treaty rights).4 A Tri-State Dungeness Crab agreement exists between
___________________
3 “Fishing year” is a term used in fisheries management to define a period of activity for fishing certain species or in a particular region that does not align to a typical calendar year. For example, a fishing year can be April 1–March 31.
4 Magnuson-Stevens Fishery Conservation and Management Act, H.R.5946, 109th Congress 2005-2006.

NOTE: BOEM Call Areas (orange polygons) offshore Oregon were rescinded in 2024.
SOURCE: Ise and Amiotte, 2025. Presentation to the committee.
BOX 3-1
NOAA Fisheries Economics
Every year NMFS produces a report entitled Fisheries Economics of the United States (NMFS, 2024a). The most recent, published in November of 2024, outlines the 2022 Economic Impacts of the Pacific Seafood Industry in terms of jobs and dollars.
The Commercial Fishing Sector
The Pacific Region Commercial Seafood Industry (California, Oregon, and Washington), including imports, contributed:
- 1,041,235,000 pounds of seafood with revenues totaling $711,067,000
- 290,474 jobs
- $43,756,774,000 in sales
- $9,934,064,000 in income
- $16,110,887,000 in added value (contribution to the gross domestic product of the region)
The Recreational Fishing Sector
The Pacific Region Recreational Fishing Industry, accounted for
- 7,537 jobs
- $1,113,000,000 in sales
- $419,000,000 in income
- $663,000,000 in value added
- $807,000,000 in trip expenditures and durable goods (e.g., equipment costs)
Note that some participants in and representatives of the recreational fishing industry question whether these numbers adequately reflect the economic contributions of that sector.
California, Oregon, and Washington to effectively manage fishery policy issues and regulatory changes and to address public health issues resulting from harmful algal blooms (PSMFC, n.d.-b).
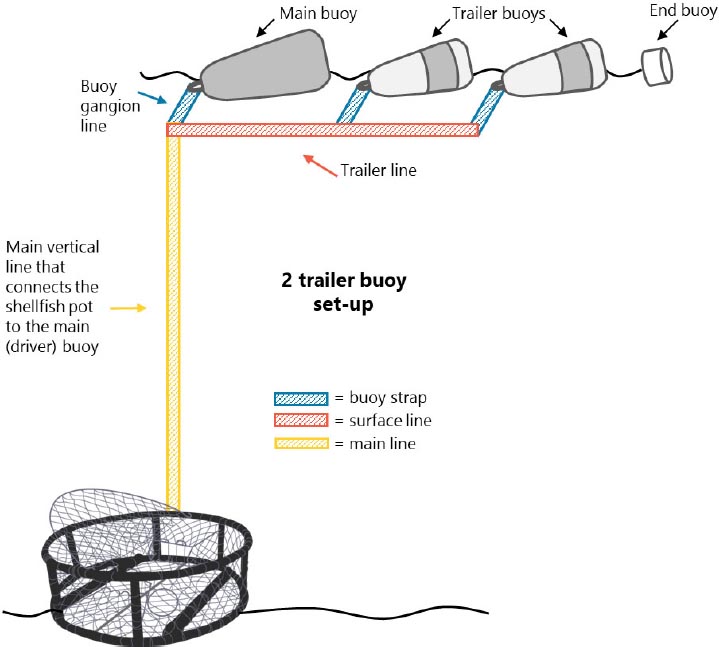
Participation in the Dungeness crab fishery is limited, and each state has adopted permit-specific limitations on the amount of gear (pots or crab traps) that can be fished (e.g., 200, 300, or 500 pots; NOAA Fisheries, n.d.-a, -h, -p). Gear types include crab pots and traps which, today, have a maximum volume of 13 cu ft and are mostly individually set with each pot connected to its own buoy (Figure 3-2). However, some fishermen in California have applied for experimental fishing permits to test pop-up gear or longline trap gear reducing the number of vertical lines in the water (National Marine Sanctuary Foundation, 2023). Gear requirements for individual pot and buoy tags and any marking of lines that connect pots to a main buoy are comparable between the states (NOAA Fisheries, n.d.-h).
In response to an increase in whale entanglements in crab gear during the 2014–2018 large marine heatwave event, the California Department of Fish and Wildlife has managed its Dungeness crab fishery under its risk assessment and mitigation program, and all three states have enacted measures to reduce entanglement risk (CDFW, n.d.-c; ODFW, n.d.; WDFW, 2024).
The Dungeness crab fishery occurs in Pacific Ocean waters in depths typically less than 50 fathoms (fms),5 with effort concentrated off Oregon and California in water depths between 10 and 40 fms. Seasons vary by region
___________________
5 A fathom is a nautical measure of depth and equals 6 feet.
| Target Species | Gear | Estimated Number of Vessels |
|---|---|---|
| Groundfish | trawl (bottom or midwater) | 118 |
| longline | 314 | |
| pot/trap | 144 | |
| hook and line | 689 | |
| Pacific whiting (hake) | trawl (midwater) | 34 |
| at-sea trawl | 6–7 (16 permits) | |
| Salmon | troll (surface hook and line) | 1,030 |
| Coastal pelagic species (CPS) —WA/OR sardine | purse seine | 6 |
| CPS—WA/OR herring/anchovy/smelt/squid | purse seine | 41 |
| CPS—CA squid | purse seine | 68 |
| CPS—CA anchovy/mackerel/sardine | purse seine | 53 |
| Highly migratory species (HMS) —Albacore tuna | troll (surface hook and line) | 556 |
| HMS—Swordfish | drift gillnet | 21 |
| harpoon | 21 | |
| HMS— CA Tuna | purse seine | 14 |
| HMS (other than albacore) | hook and line | 124 |
| Pacific halibut | longline | 130 |
| Dungeness crab (WA) | pot | 204 |
| Dungeness crab (OR) | pot | 323 |
| Dungeness crab (CA) | pot | 471 |
| Pink shrimp (WA/OR/CA) | trawl | 130 |
| Spot prawn/shrimp (WA/OR/CA) | pot/trap | 50 |
| Hagfish (WA/OR/CA) | pot/trap | 63 |
| Spiny lobster (CA) | pot/trap | 189 |
| Rock crab (CA) | pot/trap | 113 |
| Coonstripe shrimp (CA) | pot/trap | 9 |
| California halibut (CA) | trawl | 23 |
| CA halibut/white seabass (CA) | set gillnet | 39 |
| hook and line | 388 | |
| Yellowtail/barracuda/white seabass (CA) | drift gillnet | 20 |
| Nearshore finfish (CA) | trap | 42 |
| Sea cucumber (CA) | trawl | 11 |
| Dive fisheries (WA/OR/CA) | hand collection | 186 |
NOTE: U.S. federally regulated fisheries are bold, except Pacific halibut which are managed by the International Pacific Halibut Commission and coordinated through PFMC. CA = California, OR = Oregon, WA = Washington.
SOURCE: Marine Mammal Protection Act List of Fisheries for 2024, 89 FR 12257.
| Target Species | Landings (mt) | Revenue ($) |
|---|---|---|
| Groundfish | ||
| Pacific whiting* | 143,561.1 | $35,598,485 |
| Sablefish | 5,289.5 | $13,481,213 |
| Other groundfish | 24,972.2 | $29,616,170 |
| Salmon* | 9,625.9 | $29,877,558 |
| Coastal pelagic species | ||
| Market squid | 57,532.9 | $68,115,282 |
| Highly migratory species | ||
| Albacore tuna | 4,531.2 | $16,070,988 |
| Other Tuna (Bluefin, Bigeye, Yellowfin)* | 368.2 | $4,085,470 |
| Pacific halibut | 400.5 | $4,761,017 |
| Shellfish | ||
| Dungeness crab (WA/OR/CA) | 29,256.8 | $264,057,772 |
| Pink shrimp (WA/OR/CA) | 31,232.4 | $37,236,408 |
| Spiny lobster (CA) | 490.0 | $20,897,875 |
| Red sea urchin (CA) | 967.1 | $7,479,310 |
| Spot prawn (WA/OR/CA) | 252.2 | $9,660,726 |
| Rock crab (CA) | 430.4 | $2,200,363 |
| Other shrimp (WA/OR/CA) | 167.0 | $2,590,749 |
| California halibut (CA) | 460.3 | $5,755,676 |
| Total | 309,537.7 | $551,485,062 |
* Some data is withheld from the species catch report for confidentiality purposes. CA = California, OR = Oregon, WA = Washington.
NOTE: Federal fisheries are set in bold, except Pacific halibut which are managed by the International Pacific Halibut Commission and coordinated through PFMC.
SOURCE: PSMFC, 2025.
but typically fall between late fall and early winter through summer. Opening and closing dates for each season are affected by factors such as whale presence, crab shell conditions, and more. (NOAA Fisheries, n.d.-a, -h, -p).
Groundfish Bottom-Trawl Fisheries
Groundfish bottom-trawl fisheries, managed as a “catch share” fishery with individual fishing quotas, tow a net along the ocean floor (Figure 3-3) and target a mixture of stocks within the larger groundfish complex (e.g., petrale sole, flatfish, sablefish or black cod, rockfish; NOAA Fisheries, n.d.-i). Vessels participating in this fishery range in length from 35 to 95 ft, and fishing occurs year-round at various depths, primarily over 50 fms.
Pink Shrimp Trawl
The pink shrimp trawl fishery also uses bottom (or demersal) trawl gear and is managed by the states of Washington, Oregon, and California (NOAA Fisheries, n.d.-s). While each state has their own permit requirements, the fishery for all three states is closed from November 1 through March 31, with common fishery regulations for bycatch reduction and monitoring. Fishing generally occurs in federal waters at depths between 40 and 150 fms
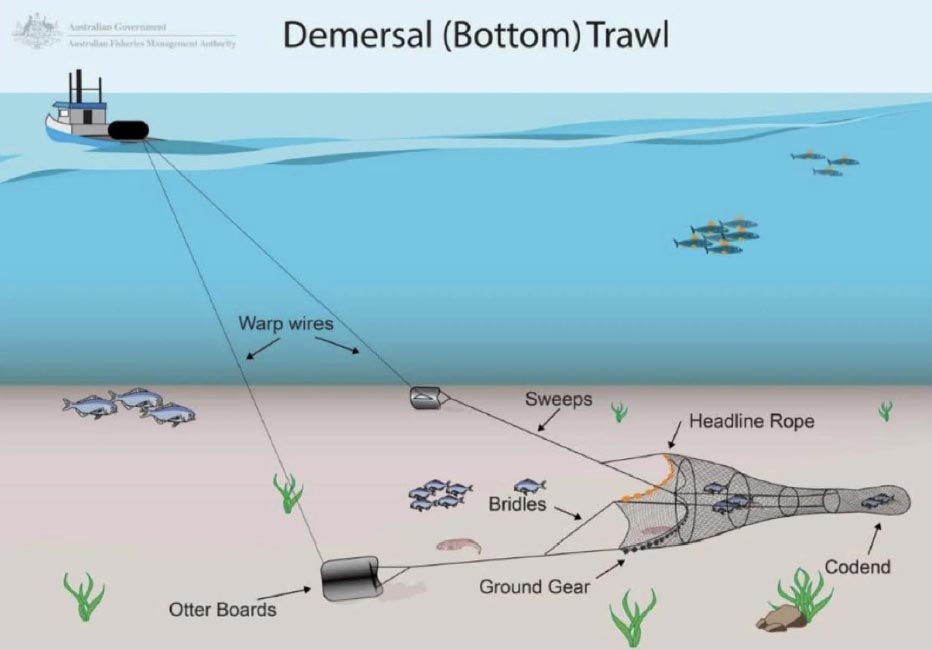
north of Point Conception, California. South of Point Conception there is no pink shrimp fishery, but there is a trawl fishery that primarily targets ridgeback prawn, which is caught at depths between 10 and 110 fms.
Groundfish Midwater Trawl
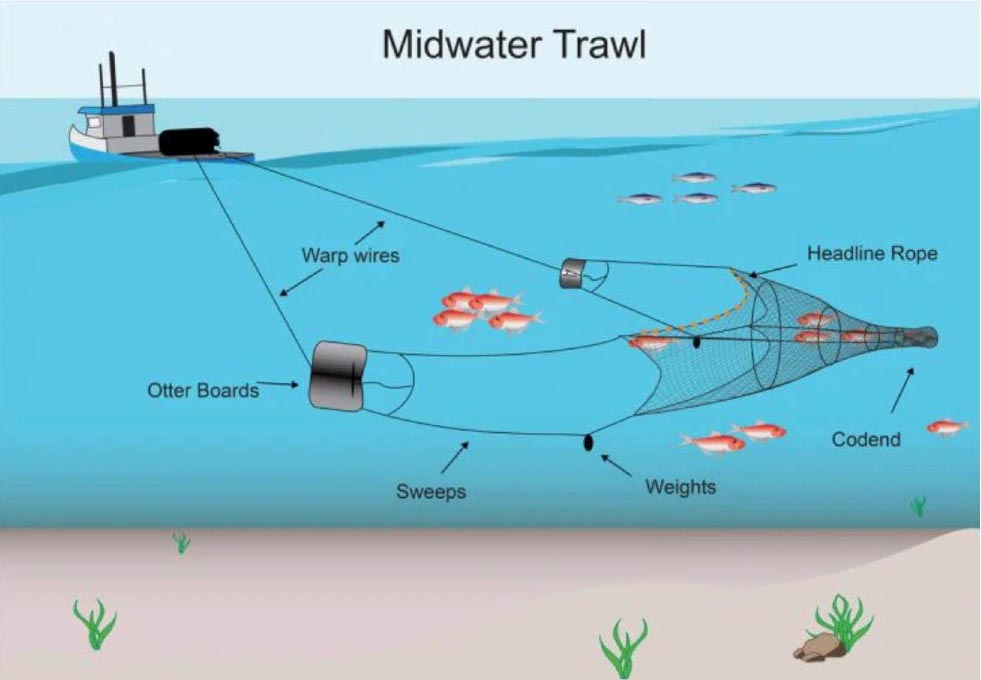
There are two federal groundfish midwater trawl fisheries off the West Coast—one targeting Pacific whiting (or hake) and the other targeting pelagic yellowtail rockfish and widow rockfish (NOAA Fisheries, n.d.-i). Midwater trawl vessels pull nets through the water column, rather than on the bottom as bottom trawlers do (Figure 3-4; NOAA Fisheries, n.d.-d).
Pacific Whiting Midwater Trawl
The Pacific whiting midwater trawl fishery is the highest volume commercial fishery on the West Coast with annual landings in excess of 140,000 mt in 2024 (Table 3-3). The Joint Management Committee for the U.S./ Canada Pacific Hake/Whiting Treaty develops recommendations for the total allowable catch or quota each year based on advice from the Joint Technical Committee, Scientific Review Group, and Advisory Panel (NOAA Fisheries, n.d.-e). The Pacific Hake/Whiting Treaty allocates the total allowable catch between the United States (73.88 percent) and Canada (26.12 percent).6 The Joint Management Committee’s recommendations are considered and discussed by the PFMC, which provides guidance to NMFS on implementing the annual total allowable catch.
SOURCE: Australian Fisheries Management Authority, n.d.-b.
___________________
6 Agreement between the Government of the United States of America and the Government of Canada on Pacific Hake/Whiting. Seattle, Washington. November 21, 2003, S. Treaty Doc No. 108-24.
The whiting fishery includes both an at sea process sector and a shoreside processing sector (NOAA Fisheries, n.d.-i). Shoreside processing occurs when fishing vessels deliver their catch to a facility onshore. The majority of whiting that landed shoreside were fished at depths of 50–200 fms (Somers et al., 2023).
At-Sea Whiting Trawl
The at-sea whiting trawl fishery has two sectors, the mothership sector and catcher-processor sector. In the mothership sector, catcher vessels catch the fish and transfer their codends at-sea to the mothership platform, which has a factory and processes the whiting onboard. In the catcher-processor sector, vessels both catch and process whiting in their onboard factory. Participation in the at-sea whiting fishery is limited and is only allowed in waters off Washington and Oregon. At-sea whiting vessels range in length from about 150 ft to over 300 ft and fish in depths of 50–200 fms (NOAA Fisheries, n.d.-i; Somers et al., 2023).
Groundfish Fixed-Gear Fishery
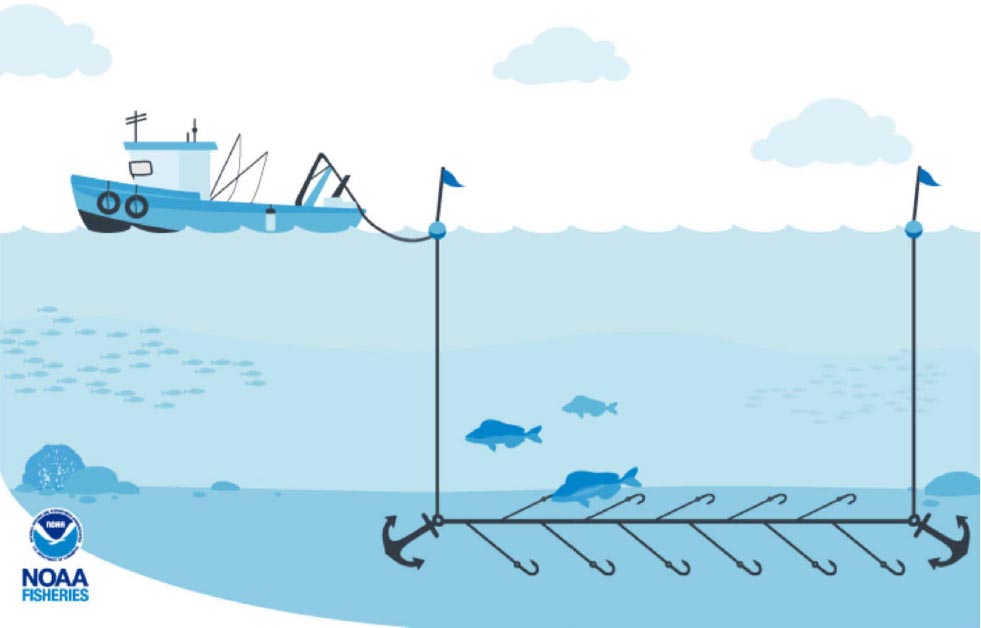
The federal groundfish fixed-gear fishery includes both bottom longline fisheries (Figure 3-5) and pot/trap fisheries with gear attached to a groundline (Figure 3-6). These gear types are primarily used to target sablefish, although rockfish and flatfish, such as Pacific halibut, are other targets (NOAA Fisheries, n.d.-i). The sablefish fishery includes a limited-entry sector with permits for individual catch limits, and an open-access sector, managed by trip limits. Sablefish fixed-gear vessels range in size from 33 to 95 ft. The groundfish pot fishery primarily
SOURCE: NOAA Fisheries, n.d.-u.

SOURCE: NOAA Fisheries, n.d.-v.
occurs in depths from 150–350 fms with a maximum depth of 600 fms while the majority of the longline fishery occurs in waters 200–250 fms deep but has occurred in depths up to 750 fms (Somers et al., 2023).
Pacific Halibut Longline
The International Pacific Halibut Commission (IPHC) sets the Pacific halibut longline fishery annual harvest limits for each of its management areas, which include waters off the U.S. West Coast, British Columbia, Canada, and Alaska (IPHC, n.d.). The U.S. West Coast is managed as IPHC Regulatory Area 2A, and annual harvest limits are allocated by PFMC via the Area 2A Pacific Halibut Catch Sharing Plan. Participation in the 2A commercial halibut fishery is not limited, but vessels are required to have a valid fishing license from the IPHC and a permit from NMFS. Similar to the groundfish longline fishery, vessels use a weighted ground-line that is set on the bottom with a 25 to 50 lb anchor at each end and hooks attached to the main line every 3–4 ft (NOAA Fisheries, n.d.-r). The halibut fishery occurs at depths of 15–150 fms.
Albacore Tuna Troll and Other HMS Fisheries
The albacore tuna troll fishery is managed by PFMC as part of the HMS FMP and is coordinated internationally, given the pan-Pacific migration of the stock. The Inter-American Tropical Tuna Commission and the Western and Central Pacific Fisheries Commission use resolutions and conservation and management measures to inform domestic management of albacore tuna in different areas of the Pacific Ocean (NOAA Fisheries, n.d.-j). The United States additionally has a treaty with Canada that allows vessels from each country to fish in each other’s waters beyond 12 NM from shore (NOAA Fisheries, n.d.-q).
Albacore troll vessels use surface hook-and-line gear, typically trolling 10-20 lines with artificial lures at a speed of 4–8 kts, to target schooling fish in the water column (NOAA Fisheries, n.d.-o). Some participants in the albacore tuna fishery also use pole and line gear, which are rigid rods with baited hooks. Participation in the albacore troll fishery is not limited but vessels are required to have permits from NMFS and be listed on the Inter-American Tropical Tuna Commission Vessel Registry. Albacore tuna fishing occurs both offshore, within the EEZ, and on the high seas (greater than 200 NM offshore) typically between June and October. Fishermen using trolling gear can spend extended periods offshore, ranging from 1–3 weeks for vessels less than 50 ft, to upward of 2 months for vessels over 50 ft (NOAA Fisheries, n.d.-q).
Other HMS fisheries include the drift gillnet swordfish fishery, a swordfish harpoon fishery, a limited entry fishery using deep-set buoy gear in the Southern California bight, a growing rod-and-reel fishery, and the tuna purse seine fishery (NOAA Fisheries, n.d.-o). Additionally, while pelagic longline gear is not allowed within the EEZ, some West Coast–based vessels participate in the longline fisheries on the high seas and Hawaii-based vessels offload their catch in California in the fall and winter.
Ocean Salmon Troll Fishery
The ocean salmon troll fishery primarily targets Chinook and coho salmon off Washington and Oregon, and Chinook salmon off California (NOAA Fisheries, n.d.-b). Pacific salmon are iconic species on the West Coast and some of the stocks that originate in the Pacific Northwest migrate northward to waters off Canada and Alaska before returning to spawn (PFMC, 2024d). To address management concerns of these transboundary stocks, in 1985 the United States and Canada entered into the Pacific Salmon Treaty,7 which is implemented by the Pacific Salmon Commission (PSC). The PSC receives advice from four regional panels of scientists and fishery experts from the United States and Canada and manages the commercial, sport, and subsistence fisheries in both countries, communicating management decisions to the PFMC (PSC, n.d.-a, -b).
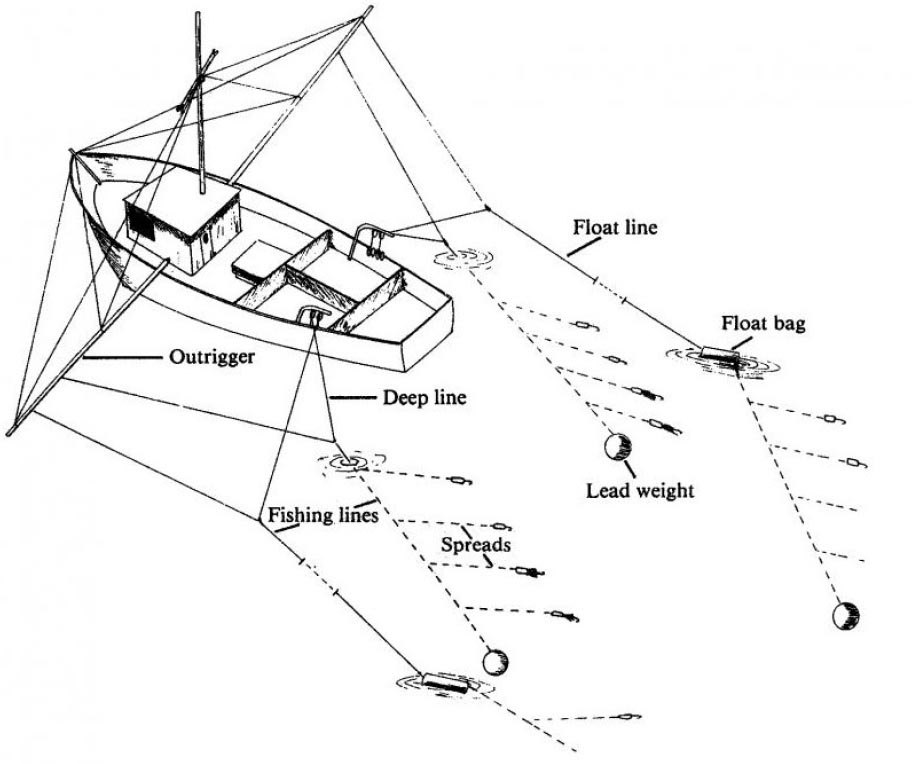
Federal permits are not required for the ocean salmon troll fishery, as it is managed by PFMC. The PFMC requires state licenses for vessels using troll or surface hook-and-line gear to target salmon; however, the gear configuration is different than the troll fishery targeting albacore tuna. Outriggers are used to avoid tangling the fishing lines, and up to six lines from each outrigger are trolled through the water at 1–4 knots (kts) with 10- to 50-lb weights (Figure 3-7) (NOAA Fisheries, n.d.-b). Fishing typically occurs from shore out to 15–20 NM, mostly in the summer and fall with limited opportunities in the spring in certain areas in some years.
Coastal Pelagic Species Purse Seine
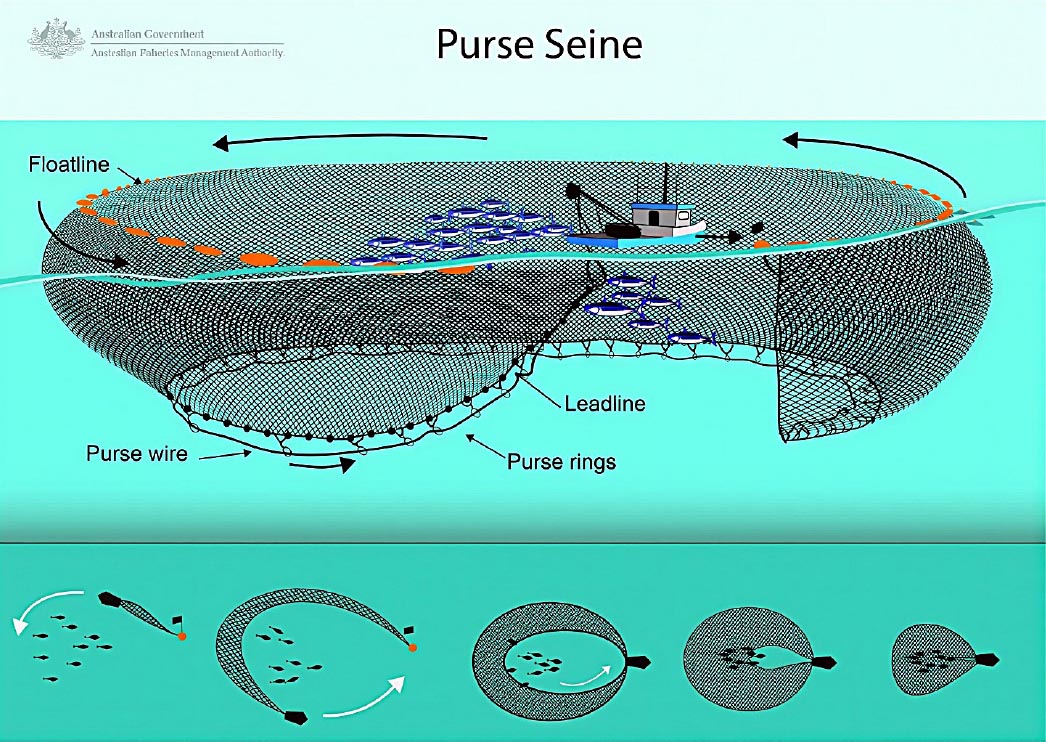
CPS purse seine fisheries target smaller forage fish, such as market squid, sardine, and mackerel (PFMC, n.d.-a). While these stocks are managed by PFMC as part of the CPS FMP, the California Department of Fish and Wildlife primarily manages the market squid fishery off California (NOAA Fisheries, n.d.-c). Purse seines are large nets with a float line attached to the top. A skiff holds the end of the net while the purse seine vessel encircles the school of fish with the net creating a wall, which is then “pursed” closed at the bottom to prevent fish from escaping (Figure 3-8). The squid purse seine fishery generally occurs at night, and vessels use large, bright lights to attract squid to the surface. In some cases, aerial surveys can assist fishermen and fish surveyors targeting other CPS, such as sardines. In these surveys a spotter plane locates schools of fish from the air and communicates their location with a partner vessel prepared to catch the school using a purse seine (NOAA Fisheries, 2017).
CPS-targeted fisheries typically occur in the nearshore area with state-specific regulations and seasons (NOAA Fisheries, n.d.-c). This fishery (excluding market squid) is divided into subareas for the regulation of fishing for CPS. The area south of Point Arena, California, requires a federally issued limited-entry permit, and north of Point Arena, Pacific sardine and mackerel are managed by PFMC and by the State Departments of Fish and Wildlife in Washington, Oregon, and California (PFMC, 2024a; NOAA Fisheries, n.d.-t). While the primary directed fishery for Pacific sardine has been closed since 2015, because the estimated biomass has been below the harvest cutoff specified in the FMP of 150,000 mt, incidental harvest of sardine is still allowed (NOAA Fisheries, n.d.-t).
Recreational Fisheries
Recreational anglers fish for a variety of species on the West Coast, including groundfish, salmon, tunas, and Pacific halibut, with fishing occurring in both state and federal waters. These fisheries are important socially, economically, and culturally to the coastal states and communities. In 2022, recreational fishing supported approximately 7,500 jobs and $1.1 billion in sales on the West Coast (NMFS, 2024a). Depending on the targeted stocks,
___________________
7 Public Law 99-5, enacted on March 15, 1985. 16 U.S.C. §§ 3631–3644.
SOURCE: California Sea Grant, n.d.
recreational fisheries are managed under a federal FMP, through a PFMC process, or by the individual states. Tables 3-4 and 3-5 outline recreational fishing effort in angler trips by state for groundfish and salmon, and Table 3-6 outlines the catches of albacore tuna, by state. The State Departments of Fish and Wildlife in Washington, Oregon, and California regulate the time, place, and manner of fishing for recreational fisheries, including license requirements and setting seasons and individual angler limits (e.g., daily bag limits; WDFW, 2025b; ODFW, 2025; CDFW, n.d.-b). While seasons for specific species are set based on various factors, including stock status, catch limits, and co-occurrence with other species, multiple recreational fishing opportunities are available on the West Coast throughout the year.
Charter Fishing
Charter fishing provides a unique opportunity for members of the public to fish for a variety of species on for-hire vessels. Depending on the species targeted, the vessel may be required to hold federal permits, such as when targeting HMS or Pacific halibut, and all states require licenses for charter boats (NOAA Fisheries, n.d.-l). Additionally, in most cases, vessels and states require participating anglers to purchase fishing licenses before departure (WDFW, 2025b; ODFW, 2025; CDFW, n.d.-b). California has additional requirements for commercial
SOURCE: Australian Fisheries Management Authority, n.d.-a.
passenger fishing vessels (CPFVs or charter vessels) to complete and submit logbooks, which include catch and effort information (CDFW, n.d.-a). Oregon and Washington also have logbook requirements which include catch and effort information.
Each state has its own recreational fishery sampling program, which collects data from recreational anglers and estimates catch and effort by mode (e.g., charter or private) and target species (e.g., salmon, bottomfish, tuna). State programs are then coordinated through the Pacific States Marine Fisheries Commission’s (PSMFC’s) Recreational Fishing Information Network program (PSMFC, n.d.-a). Recreational fishing data collection programs and priorities are outlined in the PSMFC’s Recreational Fishing Information Network/Marine Recreational Information Program Regional Implementation Plan, which uses dockside angler interviews to collect general fishing area information (NOAA Fisheries, 2023).
Historical, Current, and Migrating Fishing Grounds (Commercial and Recreational)
Identifying historical and current fishing grounds is a critical step in determining which fisheries may be impacted by ORE developments, although the amount of available information varies by fishery and fishery sector. Some commercial fisheries are required to use VMS, which can provide detailed information about historic and current fishing grounds. While VMS is not required for all vessel types, it is required for some, including certain
TABLE 3-4 Average Recreational Ocean Groundfish Trips by Mode (Charter or Private), 2019–2023
| Charter | Private | Combined | |
|---|---|---|---|
| Washington | 14,116 | 16,622 | 30,738 |
| Oregon | 47,773 | 57,546 | 105,319 |
| California | 395,172 | 186,313 | 581,485 |
| Total | 457,061 | 260,481 | 717,542 |
SOURCE: PFMC, 2024-b.
TABLE 3-5 Recreational Ocean Salmon Angler Trips by State and Year, 2022–2024, and 2019–2023 Average
| 2022 | 2023 | 2024 | 2019-2023 average | |
|---|---|---|---|---|
| Washington | 69,300 | 66,900 | 61,700 | 59,300 |
| Oregon | 96,400 | 76,400 | 77,400 | 84,500 |
| California | 98,900 | 0 | 0 | 70,200 |
| Total | 264,600 | 143,300 | 139,100 | 214,000 |
SOURCE: PFMC, 2025-b.
TABLE 3-6 Recreational Albacore Tuna Catch (Numbers of Fish) by State and Year, 2021–2023
| 2021 | 2022 | 2023 | |
|---|---|---|---|
| Washington | 10,732 | 51,363 | 33,813 |
| Oregon | 21,596 | 21,823 | 36,502 |
| California | 9,707 | 32,383 | 18,834 |
| Total | 42,035 | 105,569 | 89,149 |
SOURCE: PFMC, 2024-c.
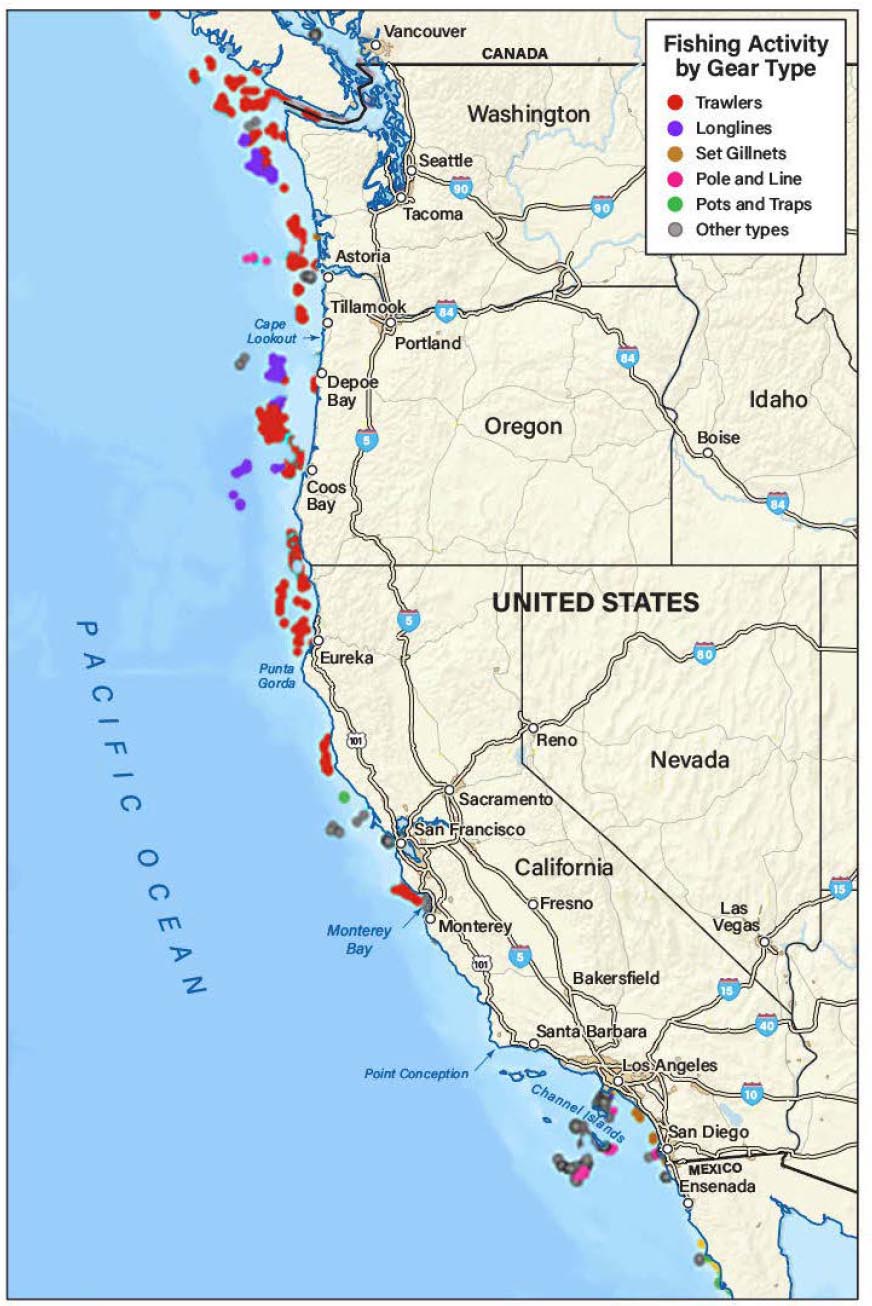
commercial vessels targeting groundfish (dependent on gear type), vessels using gillnets to target HMS, vessels larger than 24 m targeting tuna or tuna-like species, and U.S. vessels with a high seas permit (NOAA Fisheries, n.d.-m, n.d.-k). As discussed in Chapter 2, vessels’ AIS are another source of data to track vessel movements, but fishing vessels under 65 ft in length are not required to carry AIS equipment. Figure 3-9 provides a map of fishing activity by gear type of data derived from AIS and VMS sources from Global Fishing Watch. This map demonstrates the limitations of trying to identify fishing grounds utilizing these sources alone. Other kinds of fishing data for charter vessels or CPFVs are derived from logbooks which can lack spatially discrete information. There is little data on recreational fishing activity, and as noted in a letter to BOEM from the PFMC (2023b), the data that is available is generally at too coarse a scale to be used for identifying recreational fishing grounds. Box 3-2 provides examples of targeted commercial fishing mapping initiatives conducted during ORE development planning off California. Additionally, the next section describes an initiative to capture fisheries data off the Oregon coast through a collaboration between Oregon Department of Fish and Wildlife and NMFS.
Oregon Department of Fish and Wildlife/National Marine Fisheries Service Fishery Data Layers
The Oregon Department of Fish and Wildlife (ODFW) and NMFS worked together to develop fishery data layers for inclusion in NOAA’s National Centers for Coastal Ocean Science (NCCOS) spatial suitability model, which was used to identify wind energy areas (WEAs) off the Oregon Coast (Carlton et al., 2023). While 11 fisheries were initially considered for the model, only 9 were included as data layers. Salmon and halibut were
SOURCE: Created by International Mapping with data from Global Fishing Watch.
BOX 3-2
Commercial Fishing Mapping Initiatives
During the leasing process for the five leases off California, commercial fishing associations and local fishermen undertook efforts to map commercial fishing grounds in their local areas developing two projects within Central California and Northern California (MBCFO et al., n.d.; Humboldt Fishermen’s Marketing Association et al., n.d.).
The Central Coast Fishing Heritage Mapping Project (Central Coast Project)
Led by the Morro Bay Commercial Fisherman’s Organization (MBCFO), fishermen between Point Sur and Point Conception identified commercial fishing grounds and categorized them by factors such as species types, gear types, and level of safety (MBCFO et al., n.d.). Other considerations included seasonality, habitat, trip length, time of day, home and landing ports, and environmental or regulatory factors affecting the grounds.
The product of the Central Coast Project includes a map showing historic and current fishing grounds displayed as a story map that provides additional detail for fisheries of blackcod/sablefish and thornyhead, the nearshore rockfish complex, groundfish trawl, pink (ocean) shrimp, California halibut and white seabass, California halibut trawl, market squid, CPS, Dungeness crab, rock crab, slime eel/hagfish, surf perch, red sea urchin, salmon, spot prawn, and HMS.
The North Coast Fisheries Mapping Project (North Coast Project)
Three Northern California Commercial Fishermen’s Associations—the Humboldt Fishermen’s Marketing Association, Salmon Troller’s Marketing Association, and the Crescent City Commercial Fishermen’s Association—collaborated on the North Coast Project Fisheries Mapping Project (Humboldt Fishermen’s Marketing Association et al., n.d.). The goal of this mapping project was to map community fishing grounds by species or species complex, gear type, depth, seafloor substrate, and season.
Similarly, the North Coast presents a story map with identified fishing grounds and information for commercial fisheries operating along the North Coast including Chinook salmon, Dungeness crab, groundfish, coonstripe shrimp, Pacific halibut, hagfish (slime eel), market squid, HMS, spot prawn, red sea urchin, smelts, and CPS.
It is important to note that these projects do not fully reflect which species are expanding, declining, or limited by environmental conditions, regulation, or socioeconomic concerns.
excluded due to spatial data limitations and time constraints, which are further described in Table 3-7. Together with fishery specific data, the NCCOS Model utilized AIS in developing data layers for some marine uses. AIS data from fishing vessels was excluded as it did not paint a complete picture, as AIS is not common on recreational vessels and not all commercial vessels are required to carry it (PFMC, 2025).
Additional considerations
NOAA’s PSMFC Northwest Fisheries Science Center and collaborate to create the Pacific Fishing Effort Mapping project; a tool being created to provide access to fisheries spatial data for management activities and marine planning efforts along the West Coast (PFMC, 2023-a). Once this project is available, it will likely be another powerful data source for ORE planning. Several groups, including NOAA, have highlighted the need to consider how ORE development will impact the fisheries whose distribution is shifting due to changing ocean conditions or stock recovery (NOAA, 2023).
TABLE 3-7 Fisheries Data Used by ODFW and NMFS for NCCOS Data Layer
| Fishery | Data source time series | Data source |
|---|---|---|
| Groundfish bottom trawl (limited entry plus catch shares) | 2002–2020 | Logbooks from PacFIN via the NWFSC observer program database |
| At-sea hake midwater trawl (mothership and catcher/processor vessels) | a) 2011–2020 | a) NWFSC Observer Program, PacFIN |
| b) 2002–2019 | b) Logbooks from PacFIN via the NWFSC observer program database | |
| Shoreside hake mid-water trawl | a) 2011–2020 | a) NWFSC Observer Program, PacFIN |
| b) 2002–2020 | b) Logbooks from PacFIN via the observer program database for 2011–2019 and logbooks for 2002–2010 and 2020 from ODFW | |
| Groundfish fixed gear—pot | 2011–2020 | ODFW |
| Groundfish fixed gear—long-line | 2011–2020 | ODFW |
| Commercial albacore gear—troll/hook-and-line | a) 2011–2020 | a) SWFSC, PacFIN |
| b) 2005–2021 | b) SWFSC | |
| Recreational charter albacore—troll/hook-and-line | 2005–2021 | SWFSC |
| Pink shrimp trawl | 2011–2020 | ODFW logbook, PacFIN |
| Dungeness crab pot | a) 2011–2020 | ODFW logbook, PacFIN |
| b) 2007/08–2010/11 and | ||
| 2018/19–2019/20 seasons |
NOTE: PacFIN = Pacific Fisheries Information Network, NWFSC = Northwest Fisheries Science Center, SWFSC = Southwest Fisheries Science Center.
SOURCE: Modified from Table E-1 of the NCCOS Report (Carlton, et al., 2023).
TRIBAL FISHERIES
Some federally recognized Indian Tribes have reserved rights to fish in certain areas along the West Coast as identified in several treaties between the Tribes and the United States. These treaties were signed in 1854 and 1855 and are referred to as the Stevens Treaties.8 As a result of the treaties, the Tribes ceded large amounts of land and bordering offshore waters in what is currently Washington State. Some of the ceded areas include parts of the Olympic Peninsula and all of the Puget Sound watershed. Although the Tribes ceded these lands, the treaty language reserved rights to fish in their “usual and accustomed areas” as defined in article 5 of the Treaty of Point Elliott:
The right of taking fish at usual and accustomed grounds and stations is further secured to said Indians in common with all citizens of the Territory, and of erecting temporary houses for the purpose of curing, together with the privilege of hunting and gathering roots and berries on open and unclaimed lands. Provided however, that they shall not take shellfish from any beds staked or cultivated by citizens.9
By the 1950s the language about “usual and accustomed” fishing access was subject to dispute. The state of Washington began enforcing fishing regulations against Tribal members who were engaged in fishing practices pursuant to the treaties (Gallagher Law Library, n.d.). In 1970 the United States, as trustee for several Tribes, filed
___________________
8 United States v. Washington, 853 F.3d 946, 953 (9th Cir. 2017).
9 Treaty of Point Elliott, 12 Stat. 927 (Jan. 22, 1855).
a suit against the state of Washington. In 1974, Judge George Boldt issued his first decision interpreting fishing right in the Stevens Treaties and established a co-management requirement between the Tribes and the state. That landmark court decision became known as the Boldt Decision.10
Federal courts have also determined that the treaty Tribes are entitled to up to half of the harvestable surplus of fish stocks that reside in or pass through their usual and accustomed areas.11 Many stocks of fish that these Tribes have rights to can also be found in waters off Alaska, Canada, and other areas off the West Coast where they are harvested in ocean fisheries.
The Stevens Treaties have been incorporated into federal regulation at 50 CFR Part 300.6 and 300.95, regulations for Pacific Halibut and Sockeye and Pink Salmon fisheries, respectively. The regulations at 50 CFR Part 300.6 reflect the locations for current halibut fisheries in offshore waters where 13 Tribes are exercising their treaty rights. The regulations at 50 CFR 300.95 reflect the federal regulations for the Fraser River Sockeye and Pink Salmon fisheries and include specific language to reflect treaty fishing areas under federal regulations. The reserved Tribal fishing locations are identified with references to orders from federal court cases interpreting the Stevens Treaties and include specific geographical location markers. Tribal fishermen pursue annual offshore fisheries for halibut and salmon that could be impacted by ORE projects.
Fisheries management along the coast of Washington state is carried out by three governments: Tribal, state, and federal. This “co-management” regime means that Tribal governments participate in management decisions with state and federal regulators, including those related to hatchery production, habitat conservation, hydropower, and fisheries harvest. Tribes have inherent authority to regulate fisheries in their adjudicated “usual and accustomed” areas. Therefore, Tribal governments have direct regulatory authority over fisheries and Tribal fishermen. Tribal governments set fishing regulations like fishing openings, gear restrictions, and catch limits. Tribal governments are also involved in conservation management with state and federal governments.
Tribal Fisheries and Usual and Accustomed Fishing Areas
Twenty-six West Coast Indian Tribes have federally recognized fishing rights within their usual and accustomed fishing areas. These include 20 treaty Tribes in western Washington, 4 Columbia River treaty Tribes and 2 Klamath River Tribes in California with reservation-based fishing rights. The western Washington and Columbia River Tribes’ rights are based on treaties signed between the Tribes and the United States in the mid-1850s and each of these Tribes is entitled to harvest up to 50 percent of the harvestable surplus of fish residing in or passing through their “usual and accustomed” areas.12
All of the 26 Tribes harvest salmon within their usual and accustomed areas, which includes off-reservation marine areas for many of the Tribes, and the western Washington Tribes also retain rights to harvest a variety of marine species and shellfish. Thirteen western Washington Tribes, for example, have treaty rights to harvest Pacific halibut, which are managed federally and internationally.
The federal courts in United States v. Oregon,13 the Belloni Decision, for the Columbia River Tribes, and United States v. Washington,14 the Boldt Decision, for the western Washington Tribes, determined that the Tribes would co-manage their fisheries resources with their respective states. The U.S. secretary of commerce also recognizes sovereign status and co-management roles of treaty Tribes over shared federal and Tribal fishery resources.15
Four Washington coastal Tribes, Makah, Quileute, Hoh and Quinault, have fishing rights and usual and accustomed fishing areas in the Pacific Ocean including within federal waters. These treaty rights include allocations or set asides for salmon, groundfish, shellfish, halibut, CPS and HMS. Judge Boldt determined the northern and southern usual and accustomed area for each of the four Tribes in his original 1974 decision and in subsequent sub proceedings and the western boundaries in later sub proceedings. The current combined usual and accustomed area of the four Tribes extends from the U.S.–Canada boundary in the north to the southern end of Grays Harbor in the south and 40 mi from shore in the northern portion and 30 mi from shore in the south. Box 3-3 described the Makah Tribe’s usual and accustomed fishing area.
___________________
10 United States v. Washington, 384 F. Supp. 312 (W.D. Wash. 1974), aff’d 520 F.2d 676 (9th Cir. 1975).
11 Id. at pinpoint to first cite to Boldt Decision.
12 Id. at pinpoint to first cite to Boldt Decision.
13 302 F. Supp. 899.
14 Id. at pinpoint to first cite to Boldt Decision.
15 Pacific Coast Treaty Indian rights. 50 CFR § 660.706.
BOX 3-3
The Makah Tribe’s Usual and Accustomed Fishing Area
As an example, the Makah Tribe adjudicated their usual and accustomed fishing area in 1974 from Judge Boldt and established their grounds in the Pacific Ocean extending from the U.S./Canada boundary south. The Makah Tribe’s usual and accustomed can be seen in the provided map and is approximately 20 mi south from the U.S.–Canada border to 48° 02 minutes north latitude, extends west 40 mi from shore to 125° 44 minutes west longitude, and eastward in the Strait of Juan de Fuca approximately 60 mi to a location west of Port Angeles, Washington.
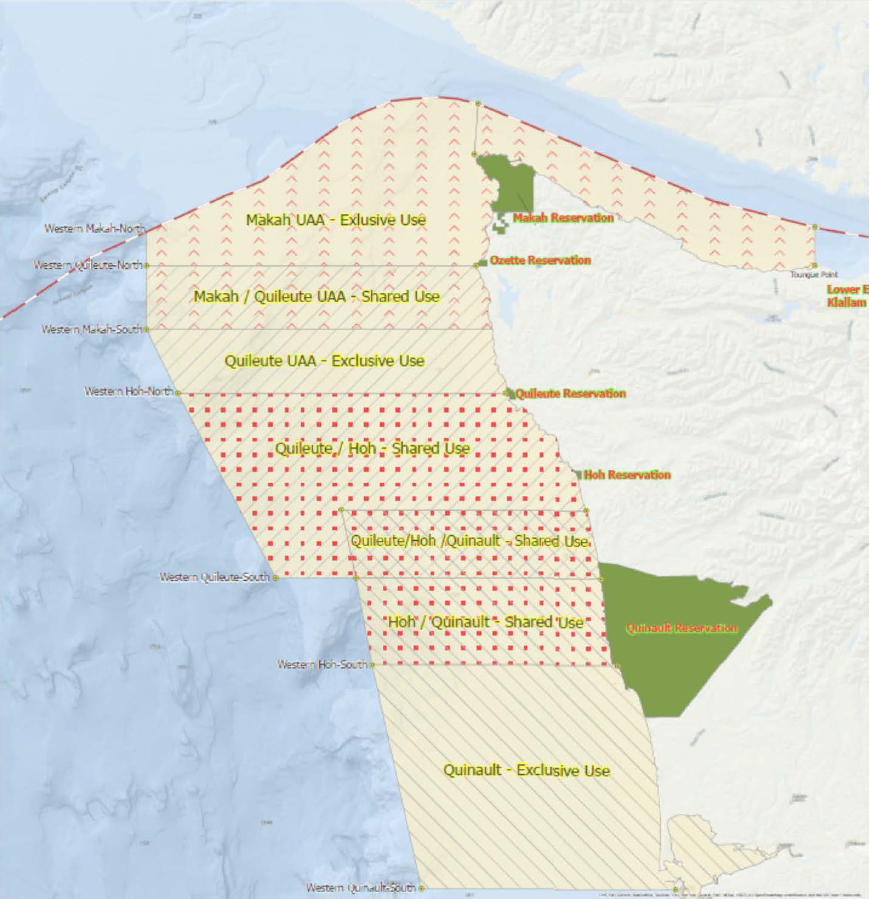
Following the establishment of the U.S. EEZ in 1976 and the subsequent federal fisheries management within the EEZ, it was necessary for the Tribes to establish western boundaries for their fishing areas. The Makah Tribe began that process in 1978, and in 1982 the court established the Makah western boundary 40 NM from shore based on evidence of their traditional fishing areas and practices. The western boundaries for the other three coastal Treaty Tribes—Quileute, Hoh and Quinault—were determined by subsequent court rulings.
NOTE: The above map was provided to the committee by the Makah Tribe in order to visually show an example of usual and accustomed fishing areas. This map was not created with, nor does it fully represent, the Quinault Nations’s, Hoh Tribe’s, and Quileute Tribe’s usual and accustomed fishing areas.
CALIFORNIA CURRENT ECOSYSTEM
Overview
The covered waters of this study, from the California-Mexico border to the Washington-Canada border, are part of the CCE. The Ecosystem is defined by the California Current (CC), which flows equatorward along the Pacific Coast of the United States from Canada to Mexico. The CC is a physically energetic system driven by winds that arise from variations in surface heating in the Northern Hemisphere and the Earth’s rotation. Winds from the north, particularly in spring and summer, cause upwelling of cold, nutrient-rich water coastally primarily off California, secondarily off Oregon and less so off Washington (Jacox et al., 2018). The cross-shelf change in wind and water temperature from cold, nearshore water to warmer, offshore water is balanced by the mean southward but varying flow of the CC in the upper 300 m (Marchesiello et al., 2003). A southward flowing coastal jet occurs close to shore, particularly at times of strong upwelling. Fall and winter winds from the south cause an onshore flow, a weakening of the CC and the occurrence of the poleward Davidson Current at the surface, particularly off California. Most of the year, the California Undercurrent flows poleward beneath the CC. A key characteristic of the CC system is its variability in space, along the coasts of Washington, Oregon and California, and time, from days to decades and beyond (Bograd et al., 2023).
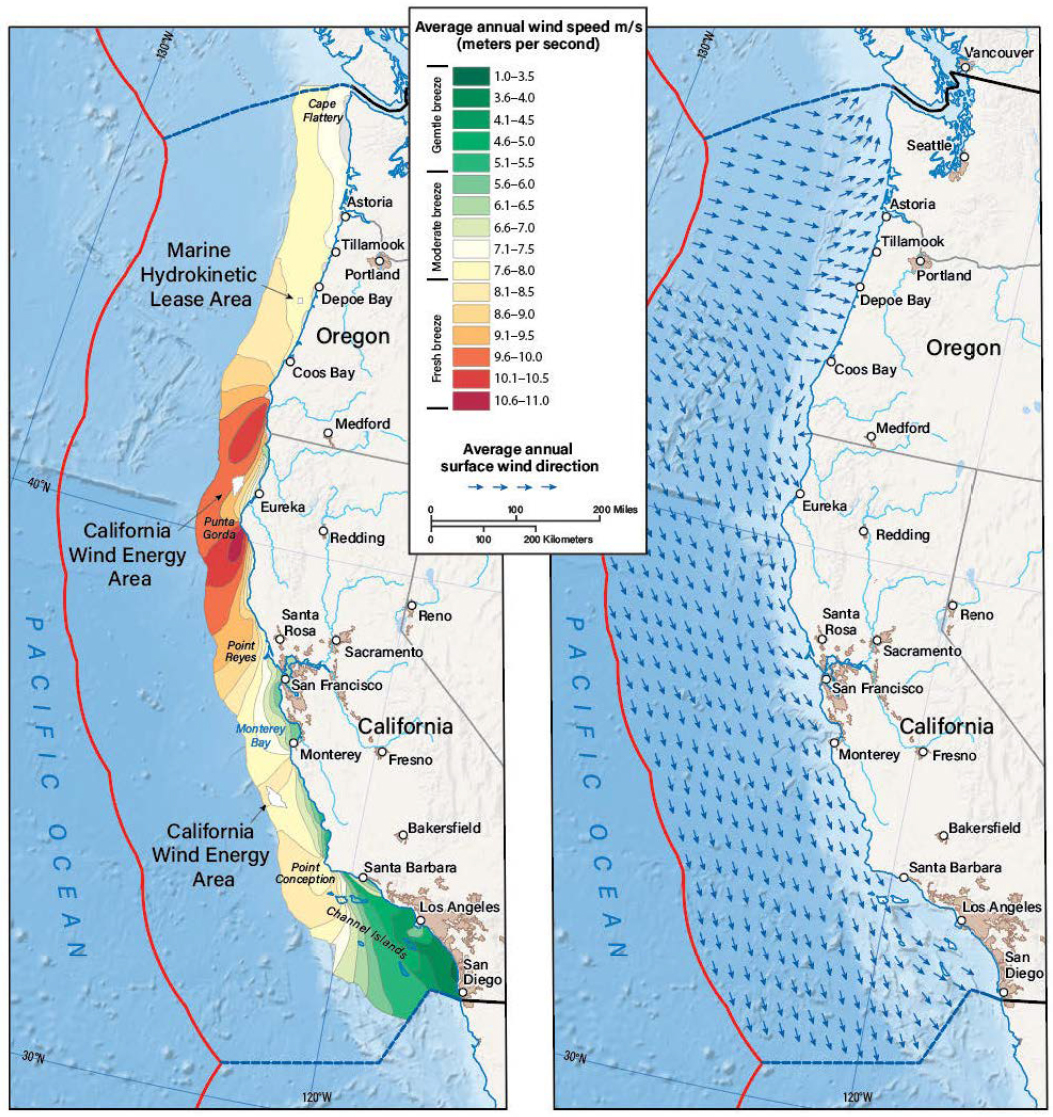
Wind that powers the CC is a potential source of ORE and affects marine traffic and safety along the West Coast. Annual average wind speeds are reliably strong along the West Coast from Point Conception in California north to Cape Flattery in Washington, with highest speeds found in northern California and southern Oregon (Figure 3-10). Winds vary in time and space along the West Coast. Monthly average wind speeds can reach over 10 m/s at 100 m above the surface (Draxl et al., 2015), with higher speeds during extreme events.
The California Current
The CC is, on average, approximately 250-350 km (135-190 NM) offshore of Washington and Oregon and, in California, 430 km (230 NM) off Cape Mendocino and 270 km (150 NM) off Point Conception (Hickey, 1979). Thus, the CC flows over and beyond bottom depths up to 1,300 m (Cooperman et al., 2024a). Areas optimal for wind turbines off the West Coast are, in general, shoreward of the average location of the maximal flow of the CC off southern Oregon and northern California (von Krauland et al., 2023). Locations most suitable for hydrokinetic energy installations are in shallower waters nearer to shore. Chapter 5 provides more information about offshore wind energy development and hydrokinetic energy development off the West Coast.
Ecosystem
The CCE is the ecosystem bounded by the CC to the west and shore to the east. The CCE includes a broad range of habitats, ranging from shallow waters nearshore to waters overlying basins, the continental slope and deep ocean offshore. Upwelling brings nutrients to the sunlit surface waters that nourish the plankton, nekton, seabirds and marine mammals which, in turn, support fisheries and other activities vital to coastal communities and Tribes.
Two types of wind-driven upwelling of nutrient-rich water occur off the U.S. West Coast (Rykaczewski and Checkley 2008, Jacox et al., 2018). Coastal upwelling occurs when equatorward wind parallel to the shore causes surface waters to move offshore and be replaced by cooler water from 50-200 m. Wind-stress curl-driven upwelling occurs when equatorward wind accelerates with distance offshore, causing a divergence in surface flow resulting in a slow but broadscale upwelling from similar depths as coastal upwelling. Upwelled nutrients are used by phytoplankton which, in turn, is consumed by zooplankton and fish. Coastal upwelling is faster and favors larger plankton and anchovy, while offshore upwelling is slower and favors smaller plankton and sardine. While coastal upwelling generally occurs within 20 km of the coast and curl-driven upwelling further offshore, both can co-occur (Jacox et al., 2018, Raghukumar et al., 2023).
The CC can be linear or include meanders, eddies, jets and filaments (Marchesiello et al., 2003). Such physical features can cause upwelling, downwelling, and transport, which affect the chemistry and biology of the CCE, including the production and distribution of plankton, fish, and other parts of the ecosystem. Variability is characteristic of the CCE. The topography and bathymetry of the West Coast affect local upwelling, currents,
SOURCE: Created by International Mapping, based on data from Draxl et al., 2015.
waves, productivity, and hence the living marine resources and their use. The locations of usual and accustomed resources used by Tribes and fishing communities are related to these spatial characteristics of the CCE. Winds, upwelling, water temperature, and dissolved oxygen vary over days to decades, including storms, El Niño, and the Pacific Decadal Oscillation, which again affect living marine resources (Checkley and Barth 2009). Heat waves are increasingly common (Marcos et al., 2025). Long-term changes in climate overlay all other variations. Poleward shifts in species and, hence, their availability to and use by humans are predicted (Liu et al., 2023).
FOW installations will extract wind energy from the CCE. A discussion of wind wake effect and the removal of energy by FOW is presented in Chapter 5. The energy extraction from FOW may further impact the variability of upwelling. See Chapter 7 for the potential impact of FOW projects on upwelling.
Conclusion 3-1: The high productivity of the CCE is dependent upon the predictable seasonal upwelling patterns, which affect nutrient availability, primary productivity, and species distribution. The upwelling patterns are subject to natural variability and longer-term changes in climate.
CURRENT AND FUTURE SHIFTS IN FISH STOCKS
Understanding species response to changing oceans is critical to understanding how ORE will influence fisheries access, catches, and yields. The establishment of ORE projects off the West Coast will shift fishing effort to other areas resulting in increased competition and pressure in those areas. To understand how ORE will impact West Coast fisheries requires an understanding of how West Coast species are responding to and will continue to respond to changing ocean conditions.
Marine species in the CCE exhibit substantial changes in response to short-term, episodic shifts, like marine heat waves, and longer-term shifts in ocean temperatures. All major species groups—groundfish, CPS, salmon and HMS—are experiencing these changes. The most readily observable responses to changing ocean conditions are species distributions, that is, where species are likely to be found at the surface or in the water column (Liu et al., 2023). However, species responses to changing ocean conditions can also lead to other less readily observable, but equally influential, changes, such as variation in abundance, shifts in weight at age, variability in maturity, or greater interspecific competition due to increased species overlap (Hinchliffe et al., 2025; Head et al., 2025; Daly et al., 2024). These impacts have been observed across a wide range of marine species, from myctophids to humpback whales, using an equally wide range of methodological approaches including retrospective forecasting, simulation modeling, climate vulnerability analyses, and climate projections. Changing ocean conditions may increase habitat availability for some species, while decreasing available habitat for others. Species responses to changes in ocean conditions have been found to have significant direct (changes in fishing areas and catch) and indirect (increased bycatch of protected species) effects on fisheries on the West Coast (Santora et al., 2020, Frawley et al., 2025, Lezama-Ochoa et al., 2024).
Conclusion 3-2: Many studies indicate that various fish species, including groundfish, coastal pelagic, salmon, and highly migratory stocks, are already responding to changing ocean conditions with shifts in distribution. Distribution shifts may be poleward, shoreward or seaward, or may occur within the water column, depending on the species and how their habitat availability is affected by ecological changes.
Conclusion 3-3: Further ongoing studies are needed to monitor how changing ocean conditions are affecting habitat availability for marine species and fisheries.
Future Stock Distributions
Consistent with climate impact analyses in other ocean regions (O’Leary et al., 2022, Vestfals et al., 2019), CCE system species have demonstrated significant changes in overall distribution, often reported as center of gravity, in response to changing ocean conditions. These observable changes are likely accompanied by other less readily detectable shifts in abundance, recruitment, and other demographic shifts. Analyses of data over the last
25 years have consistently found that fish species have already exhibited significant responses to both episodic and long-term shifts in ocean conditions. Box 3-4 describes how modeling is used to understand these shifts and predict changing climate conditions. Many, but not all, species have exhibited a northward shift in distribution, e.g., swordfish (Lezama-Ochoa et al., 2024). For some species, shoreward or deeper shifts have also been observed, particularly in response to episodic warming events. Over the past 25 years, commercially important juvenile sablefish have exhibited a significant nearshore expansion in Oregon and Washington (Daly et al., 2024). Humpback whales have exhibited episodic shoreward compression in response to marine heat wave (MHW) conditions between 2014-2016 (Santora et al., 2020). Similar shifts have been noted in the water column, e.g., mesopelagic forage species have been found to shift their vertical distributions in response to MHWs (Iglesias et al., 2024).
The combination of changing ocean conditions, increased variability and intensity of pulse climate events, recovering fish stocks and protected species populations, and active fishing fleets point to significant impacts on fisheries from changing climatic conditions. Shifting species distributions have been found to have a substantial impact on fisheries yield, although the direction of the effect differs among fleets (Liu et al., 2023). The impact
BOX 3-4
Modeling Approaches
Retrospective forecasting
Empirical ocean and species data collected since the mid-1990s have provided an opportunity to conduct retrospective forecasting of how species distributions, both at surface and at depth, and movement patterns have already changed over the past 25 years. Retrospective forecasting commonly uses species distribution models (SDMs) that explore relationships between species occurrences and ocean conditions. These retrospective analyses serve as a robust foundation for the projected shifts that are likely to occur in the upcoming decades based on global and downscaled regional climate models. A number of SDMs have been developed to characterize distributions of target, bycatch and protected marine species in the CCE system (Smith et al., 2023, Lezama-Ochoa et al., 2024).
Simulation models
Simulation models provide another way to incorporate data on ocean physics, species ecology, and fisheries dynamics. There is a CC system-specific, spatially-explicit simulation model that considers how species groups change dynamically in response to ocean conditions and evaluates how that influences the demography, recruitment, trophic interactions and fisheries catches of species (Liu et al., 2023).
Climate Vulnerability Assessments
Impacts of changing ocean conditions have also been assessed using climate vulnerability assessment (CVA) frameworks. CVAs adopt a synoptic approach to systematically evaluate the exposure, sensitivity, and adaptive capacity of species to projected changes in ocean conditions, leveraging all available information on a species life history, biology, and ecology (Frawley et al., 2025).
Climate Projection Models
Building on the strong foundation of historical data, climate projection models, which pair global or downscaled regional climate models with in-situ biological data, have also provided key insights into the impact of climate change on fisheries-relevant species. Downscaled regional climate models facilitate the integration of important and specific regional-scale features, which are usually missing or poorly represented when using global models (Pozo Buil et al., 2021). To account for uncertainty in projecting future climate conditions, it is common to use multiple climate models and compare output among the models, e.g., the Geophysical Fluid Dynamics Laboratory (GFDL) ESM2M, Institut Pierre Simon Laplace (IPSL) CM5A-MR and the Hadley Center HadGEM2-ES (Brodie et al., 2022).
of changing ocean conditions on fleets is both direct and indirect. Recent analyses indicate that some West Coast fisheries have been negatively affected by changing ocean conditions over the past 15 years (Wang et al., 2022). A review of groundfish response to climate change suggests some groundfish stocks are shifting northward and to deeper waters, which may negatively affect fishing access (Liu et al., 2023). Albacore and swordfish, two other commercially important HMS, have also shifted northwards which has had implications for fisheries catch (Lezama-Ochoa et al., 2024, Smith et al., 2023). A recent analysis suggests that albacore landings are likely to decrease in Southern California but may increase or remain stable in other West Coast areas (Smith et al., 2023). Swordfish distribution may have expanded in response to the changing ocean (Lezama-Ochoa et al., 2024). Many other target species of West Coast fisheries have been identified as highly vulnerable to climate impacts (Frawley et al., 2025). There have also been negative impacts of climate change on Dungeness crab fisheries in California (Santora et al., 2020). The shoreward compression of whale habitat and their forage species resulted in an unprecedented spike in the number of confirmed whale entanglements in fixed gear buoy lines from multiple fisheries, during the 2014–2016 MHW.
When analyzing fishery impacts from ORE development, consideration must be given to how distributions of commercially and recreationally important fish stocks will continue to change and shifts in response to ongoing changes in ocean conditions. For example, in 2014 the population of Pacific Bluefin tuna was estimated to be roughly 2.6 percent of its unfished biomass (Craig et al., 2017). Thanks to effective management measures, Pacific Bluefin achieved its rebuilding targets 10 years earlier than anticipated. Recovery of the stock and changing ocean conditions has resulted in it being commercially and recreationally available well outside its historic range. This example shows that fisheries with no historic activity within an area deemed suitable for ORE development may shift to occur in that area in the future.
How ongoing and intensifying shifts in ocean conditions and stocks will impact fisheries ultimately will depend on how fleets are able to respond to these changes. This ability to adapt and respond to changes may further be compromised by ORE development. For example, there may be different implications and impacts depending on whether vessels adapt in place to take advantage of changing portfolios or whether fleets can adapt by continuing to follow the shifting distributions (Samhouri et al., 2024; Frawley et al., 2021). These fleet responses will also be directly influenced or dictated by ORE development.
In 2024 NMFS published a strategic science plan for the West Coast that identifies their priorities for research to understand interactions between ORE development and fish, fisheries, and their habitats. Research priorities include ecosystem and climate interactions to distinguish between effects from ORE development and climate variability and change, impacts to fisheries and fishing communities, and species abundance and distribution (NMSF, 2024b). These research areas can help understand the impacts and opportunities for ecosystem monitoring as ORE projects are developed. Further discussion of ORE effects on fisheries and fishing activity can be found in Chapter 7.
REFERENCES
Australian Fisheries Management Authority. n.d.-a. “Purse seine.” https://www.bmis-bycatch.org/fishing-gear/purse-seine (accessed July 11, 2025).
Australian Fisheries Management Authority. n.d.-b. “Trawling.” Last Modified February 2, 2023. https://www.afma.gov.au/methods-and-gear/trawling. (accessed December 14, 2025).
Bograd, Steven J., Michael G. Jacox, Elliott L. Hazen, Elisa Lovecchio, Ivonne Montes, Mercedes Pozo Buil, Lynne J. Shannon, William J. Sydeman, and Ryan R. Rykaczewski. 2023. “Climate change impacts on eastern boundary upwelling systems.” Annual Review of Marine Science 15:303-328. doi: 10.1146/annurev-marine-032122-021945.
Brodie, Stephanie, James A. Smith, Barbara A. Muhling, Lewis A. K. Barnett, Gemma Carroll, Paul Fiedler, Steven J. Bograd, Elliott L. Hazen, Michael G. Jacox, Kelly S. Andrews, Cheryl L. Barnes, Lisa G. Crozier, Jerome Fiechter, Alexa Fredston, Melissa A. Haltuch, Chris J. Harvey, Elizabeth Holmes, Melissa A. Karp, Owen R. Liu, Michael J. Malick, Mercedes Pozo Buil, Kate Richerson, Christopher N. Rooper, Jameal Samhouri, Rachel Seary, Rebecca L. Selden, Andrew R. Thompson, Desiree Tommasi, Eric J. Ward, and Isaac C. Kaplan. 2022. “Recommendations for quantifying and reducing uncertainty in climate projections of species distributions.” Global Change Biology 28 (22):6586-6601. doi: 10.1111/gcb.16371.
California Sea Grant. n.d. “Fishing gear and methods.” https://caseagrant.ucsd.edu/california-commercial-fisheries/fishing-gear-and-methods (accessed July 11, 2025).
Carlton, Jessica L., Jonathan A. Jossart, Frank Pendleton, Necitas Sumait, Jennifer Miller, Jean Thurston-Keller, Desray Reeb, Lisa Gilbane, David Pereksta, Donna Schroeder, and James A. Morris Jr. 2023. A wind energy area siting analysis for the Oregon call areas. Bureau of Ocean Energy Management. https://www.boem.gov/boem_2024-015.
CDFW (California Department of Fish and Wildlife). n.d.-a. “California Recreational Fisheries Survey - Background.” https://wildlife.ca.gov/Conservation/Marine/CRFS/Background (accessed January 6, 2026).
CDFW. n.d.-b. “Sport Fishing Licenses and Report Cards.” https://wildlife.ca.gov/Licensing/Fishing#items (accessed January 6, 2026).
CDFW. n.d.-c. “Whale Safe Fisheries.” https://wildlife.ca.gov/Conservation/Marine/Whale-Safe-Fisheries (accessed January 6, 2026).
Checkley, David M., and John A. Barth. 2009. “Patterns and processes in the California Current System.” Progress in Oceanography 83 (1-4):49-64. doi: 10.1016/j.pocean.2009.07.028.
Cooperman, Aubryn, Matt Hall, Stein Housner, Cris Hein, Patrick Duffy, Daniel Mulas Hernando, Lucas Carmo, Felipe Moreno, and Walt Musial. 2024. Investigation of the challenges of offshore wind in ultradeep water. Golden, CO; National Renewable Energy Laboratory.
Craig, Matthew, Steven Bograd, Heidi Dewar, Michael Kinney, Hui-hua Lee, Barbara Muhling, and Barbara Taylor. 2017. Status review report of Pacific bluefin tuna (Thunnus orientalis). NOAA Technical Memorandum, National Marine Fisheries Service.
Daly, Elizabeth A., Brandon E. Chasco, Cheryl A. Morgan, Brian J. Burke, Kaitlyn E. Osborne, and Douglas L. Draper. 2024. “Implications of increased spatial and trophic overlap between juvenile Pacific salmon and Sablefish in the northern California Current.” Marine and Coastal Fisheries 16 (6). doi: 10.1002/mcf2.10325.
Draxl, Caroline, Bri-Mathias Hodge, Andrew Clifton, and Jim McCaa. 2015. “The Wind Integration National Dataset (WIND) Toolkit.” Applied Energy 151: 355366.
Frawley, Timothy H., Barbara A. Muhling, Stephanie Brodie, Mary C. Fisher, Desiree Tommasi, Gwendal Le Fol, Elliott L. Hazen, Stephen S. Stohs, Elena M. Finkbeiner, and Michael G. Jacox. 2021. “Changes to the structure and function of an albacore fishery reveal shifting social-ecological realities for Pacific Northwest fishermen.” Fish and Fisheries 22 (2):280-297. doi: 10.1111/faf.12519.
Frawley, Timothy, Mikaela Provost, Lyall Bellquist, Noah Ben-Aderet, Hannah Blondin, Stephanie Brodie, Mercedes Pozo Buil, Michael Jacox, Steven J. Bograd, Elliott L. Hazen, Huff McGonigal, and Kirsten Ramey. 2025. “A collaborative climate vulnerability assessment of California marine fishery species.” PLOS Climate 4 (2):e0000574. doi: 10.1371/journal.pclm.0000574.
Gallagher Law Library. n.d. “Introduction to United States v. Washington.” University of Washington. https://lib.law.uw.edu/indian-tribal/boldt (accessed December 14, 2025).
Head, Melissa A., Alicia A. Billings, Vanessa J. Tuttle, Kelli F. Johnson, Aaron M. Berger, and Scott A. Heppell. 2025. “Decade-scale spatio-temporal variability in maturity of Pacific hake, Merluccius productus, along the US West Coast.” Environmental Biology of Fishes 108 (3):317-338. doi: 10.1007/s10641-025-01671-1.
Hickey, Barbara M. 1979. “The California current system - hypotheses and facts.” Progress in Oceanography 8 (4):191-279. doi: https://doi.org/10.1016/0079-6611(79)90002-8.
Hinchliffe, Charles, Peter T. Kuriyama, André E. Punt, John C. Field, Andrew R. Thompson, Jarrod A. Santora, Barbara A. Muhling, Stefan Koenigstein, Pierre-Yves Hernvann, and Desiree Tommasi. 2025. “Long-term population trend of northern anchovy (Engraulis mordax) in the California Current system.” ICES Journal of Marine Science 82 (1). doi: 10.1093/icesjms/fsae177.
Humboldt Fishermen’s Marketing Association, Salmon Trollers Marketing Association, Crecent City Commercial Fishermen’s Association, Lindsay Bonito, Cassie Michel, Carrie Pomeroy, Marion Brady Design, and GHD. n.d. “North Coast Fisheries Mapping Project.” https://storymaps.arcgis.com/stories/ec90562aada545acb6bb1bf6f3c8f228 (accessed December 14, 2025)
Iglesias, Ilysa S., Jerome Fiechter, Jarrod A. Santora, and John C. Field. 2024. “Vertical distribution of mesopelagic fishes deepens during marine heatwave in the California Current.” ICES Journal of Marine Science 81 (9):1837-1849. doi: 10.1093/icesjms/fsae129.
IPHC (International Pacific Halibut Commission). n.d. “Commercial Fisheries.” https://www.iphc.int/fisheries/commercial-fisheries (accessed January 6, 2026).
Ise, Jennifer, and Lalena Amiotte. 2025. “Study Co-Sponsor Briefing NOAA’s National Marine Fisheries Service (NMFS).” [Presentation to a NASEM Committee.]
Jacox, Michael G., Christopher A. Edwards, Elliott L. Hazen, and Steven J. Bograd. 2018. “Coastal Upwelling Revisited: Ekman, Bakun, and Improved Upwelling Indices for the U.S. West Coast.” Journal of Geophysical Research: Oceans 123 (10):7332-7350. doi: 10.1029/2018JC014187.
Lezama-Ochoa, Nerea, Stephanie Brodie, Heather Welch, Michael G. Jacox, Mercedes Pozo Buil, Jerome Fiechter, Megan Cimino, Barbara Muhling, Heidi Dewar, Elizabeth A. Becker, Karin A. Forney, Daniel Costa, Scott R. Benson, Nima Farchadi, Camrin Braun, Rebecca Lewison, Steven Bograd, and Elliott L. Hazen. 2024. “Divergent responses of highly migratory species to climate change in the California Current.” Diversity and Distributions 30 (2):e13800. doi: 10.1111/ddi.13800.
Liu, Owen R., Eric J. Ward, Sean C. Anderson, Kelly S. Andrews, Lewis A. K. Barnett, Stephanie Brodie, Gemma Carroll, Jerome Fiechter, Melissa A. Haltuch, Chris J. Harvey, Elliott L. Hazen, Pierre-Yves Hernvann, Michael Jacox, Isaac C. Kaplan, Sean Matson, Karma Norman, Mercedes Pozo Buil, Rebecca L. Selden, Andrew Shelton, and Jameal F. Samhouri. 2023. “Species redistribution creates unequal outcomes for multispecies fisheries under projected climate change.” Science Advances 9 (33):eadg5468. doi: 10.1126/sciadv.adg5468.
Marchesiello, Patrick, James C. McWilliams, and Alexander Shchepetkin. 2003. “Equilibrium Structure and Dynamics of the California Current System.” Journal of Physical Oceanography 33 (4):753-783. doi: 10.1175/1520-0485(2003)33<753:ESADOT>2.0.CO;2.
Marcos, Marta, Angel Amores, Miguel Agulles, Jon Robson, and Xiangbo Feng. 2025. “Global warming drives a threefold increase in persistence and 1 °C rise in intensity of marine heatwaves.” Proceedings of the National Academy of Sciences 122 (16):e2413505122. doi: 10.1073/pnas.2413505122.
MBCFO (Morro Bay Commercial Fishermen’s Organization), Carrie Pomeroy, Brianna Haugen, Steve Scheiblauer, Jesse Lopez, Amber Shows, and Lindsay Bonito. n.d. “Central Coast Fishing Heritage Mapping Project.” ArcGIS Story Map. https://storymaps.arcgis.com/stories/b988489171bf4d908a804258cc45c958 (accessed December 14, 2025).
National Marine Sanctuary Foundation. 2023. “Experimental fishing permit approved to test innovative fishing gear.” https://marinesanctuary.org/news/experimental-fishing-permit-approved-to-test-innovative-fishing-gear (accessed December 14, 2025).
NMFS (National Marine Fisheries Service). 2024a. Fisheries Economics of the United States, 2022. U.S. Dept. of Commerce, NOAA Tech. Memo NMFS-F/SPO-248B.
NMFS. 2024b. NMFS West Coast Offshore Wind Energy Strategic Science Plan. National Marine Fisheries Service (NMFS) Northwest Fisheries Science Center, Seattle, Washington; Southwest Fisheries Science Center, La Jolla, California; West Coast Region, Long Beach, California. https://doi.org/10.25923/5dmm-8z74
NOAA (National Oceanic and Atmospheric Administration). 2023. Re: Draft Wind Energy Areas – Commercial Leasing for Wind Power Development on the Oregon Outer Continental Shelf (OCS) (Docket (BOEM-2023-0033)). Letter to the Bureau of Ocean Energy Management.
NOAA Fisheries. 2017. “2017 West Coast pelagic fish survey.” Science Blog. https://www.fisheries.noaa.gov/science-blog/2017-west-coast-pelagic-fish-survey (accessed December 14, 2025).
NOAA Fisheries. 2019. “West Coast region.” https://media.fisheries.noaa.gov/dam-migration/west_coast_rec_engage_2019-20_public_release.pdf (accessed December 14, 2025).
NOAA Fisheries. 2023. “Pacific recreational fisheries regional implementation plan.” https://www.fisheries.noaa.gov/resource/document/pacific-recreational-fisheries-regional-implementation-plan (accessed January 6, 2026).
NOAA Fisheries. n.d.-a. “California Dungeness crab pot fishery.” https://www.fisheries.noaa.gov/national/marine-mammal-protection/california-dungeness-crab-pot-fishery-mmpa-list-fisheries (accessed December 14, 2025).
NOAA Fisheries. n.d.-b. “CA/OR/WA salmon troll fishery.” https://www.fisheries.noaa.gov/marine-mammal-protection/ca-or-wa-salmon-troll-fishery-mmpa-list-fisheries (accessed December 14, 2025).
NOAA Fisheries. n.d.-c. “California squid purse seine fishery.” https://www.fisheries.noaa.gov/national/marine-mammal-protection/california-squid-purse-seine-fishery-mmpa-list-fisheries (accessed December 14, 2025).
NOAA Fisheries. n.d.-d. “Fishing gear: Midwater trawls.” https://www.fisheries.noaa.gov/national/bycatch/fishing-gear-mid-water-trawls (accessed December 14, 2025).
NOAA Fisheries. n.d.-e. “Joint Management Committee for the Pacific Hake/Whiting Treaty.” Last Modified 09/18/2023. https://www.fisheries.noaa.gov/west-coast/partners/joint-management-committee-pacific-hake-whiting-treaty (accessed December 14, 2025).
NOAA Fisheries. n.d.-f. “Laws & policies: Magnuson-Stevens Act.” https://www.fisheries.noaa.gov/topic/laws-policies/magnuson-stevens-act (accessed December 14, 2025).
NOAA Fisheries. n.d.-g. “Marine Mammal Protection Act list of fisheries.” https://www.fisheries.noaa.gov/national/marine-mammal-protection/marine-mammal-protection-act-list-fisheries (accessed December 14, 2025).
NOAA Fisheries. n.d.-h. “Oregon Dungeness crab pot fishery.” https://www.fisheries.noaa.gov/national/marine-mammal-protection/oregon-dungeness-crab-pot-fishery-mmpa-list-fisheries (accessed December 14, 2025).
NOAA Fisheries. n.d.-i. “Overview of observed West Coast fishery sectors.” https://www.fisheries.noaa.gov/west-coast/fisheries-observers/overview-observed-west-coast-fishery-sectors (accessed December 14, 2025).
NOAA Fisheries. n.d.-j. “Pacific albacore tuna.” https://www.fisheries.noaa.gov/species/pacific-albacore-tuna (accessed December 14, 2025).
NOAA Fisheries. n.d.-k. “Pacific highly migratory species permits.” https://www.fisheries.noaa.gov/permit/pacific-highly-migratory-species-permits (accessed December 14, 2025).
NOAA Fisheries. n.d.-l “Recreational fisheries on the West Coast.” https://www.fisheries.noaa.gov/west-coast/recreational-fishing/recreational-fisheries-west-coast#permits-and-licensing (accessed December 14, 2025).
NOAA Fisheries. n.d.-m. “Regional vessel monitoring information.” https://www.fisheries.noaa.gov/national/enforcement/regional-vessel-monitoring-information (accessed December 14, 2025).
NOAA Fisheries. n.d.-n. “Understanding fisheries management in the United States.” https://www.fisheries.noaa.gov/insight/understanding-fisheries-management-united-states (accessed December 14, 2025).
NOAA Fisheries. n.d.-o. “West Coast highly migratory species fisheries and gear.” https://www.fisheries.noaa.gov/west-coast/sustainable-fisheries/west-coast-highly-migratory-species-fisheries-and-gear (accessed December 14, 2025).
NOAA Fisheries. n.d.-p. “WA coastal Dungeness crab pot fishery.” https://www.fisheries.noaa.gov/national/marine-mammal-protection/wa-coastal-dungeness-crab-pot-fishery-mmpa-list-fisheries (accessed December 14, 2025).
NOAA Fisheries. n.d.-q. “WA/OR/CA albacore surface hook and line/troll fishery.” https://www.fisheries.noaa.gov/marine-mammal-protection/wa-or-ca-albacore-surface-hook-and-line-troll-fishery-mmpa-list-fisheries (accessed December 14, 2025).
NOAA Fisheries. n.d.-r. “WA/OR/CA Pacific halibut longline fishery.” https://www.fisheries.noaa.gov/national/marine-mammal-protection/wa-or-ca-pacific-halibut-longline-fishery-mmpa-list-fisheries (accessed December 14, 2025).
NOAA Fisheries. n.d.-s. “WA/OR/CA shrimp trawl fishery.” https://www.fisheries.noaa.gov/marine-mammal-protection/wa-or-ca-shrimp-trawl-fishery-mmpa-list-fisheries (accessed December 14, 2025).
NOAA Fisheries. n.d.-t. “WA/OR sardine purse seine fishery.” https://www.fisheries.noaa.gov/marine-mammal-protection/wa-or-sardine-purse-seine-fishery-mmpa-list-fisheries (accessed December 14, 2025).
NOAA Fisheries. n.d.-u. “Fishing Gear: Bottom Trawls.” Last Modified January 8, 2026. https://www.fisheries.noaa.gov/national/bycatch/fishing-gear-bottom-trawls. (accessed May 12, 2026).
NOAA Fisheries. n.d.-v. “Fishing Gear: Traps and Pots.” Last Modified May 12, 2025. https://www.fisheries.noaa.gov/national/bycatch/fishing-gear-traps-and-pots. (accessed December 14, 2025).
NREL (National Renewable Energy Laboratory). 2015. “Wind Integration National Dataset Toolkits.” [Dataset]. https://www.nrel.gov/grid/wind-toolkit (accessed January 6, 2026).
ODFW (Oregon Department of Fish and Wildlife). 2025. Oregon Sport Fishing Regulations. https://www.eregulations.com/assets/docs/resources/OR/25ORFW_LR.pdf (accessed December 14, 2025).
ODFW. n.d. “Commercial Crab Fishery - Dungeness Crab.” https://www.dfw.state.or.us/MRP/shellfish/commercial/crab/landings.asp (accessed December 14, 2025).
O’Leary, Cecilia A., Lukas B. DeFilippo, James T. Thorson, Stan Kotwicki, Gerald R. Hoff, Vladimir V. Kulik, James N. Ianelli, and André E. Punt. 2022. “Understanding transboundary stocks’ availability by combining multiple fisheries-independent surveys and oceanographic conditions in spatiotemporal models.” ICES Journal of Marine Science 79 (4):1063-1074. doi: 10.1093/icesjms/fsac046.
PFMC (Pacific Fishery Management Council). 2023a. Marine planning committee report on marine planning. Agenda Item C.3a. https://www.pcouncil.org/documents/2023/10/c-3-a-mpc-report-1-2.pdf.
PFMC. 2023b. Re: Recommendations for improving spatial suitability modeling and strengthening the offshore wind planning process. Letter to the Bureau of Ocean Energy Management. https://www.pcouncil.org/documents/2023/04/april-2023-letter-to-boem-on-offshore-wind-process-recommendations.pdf.
PFMC. 2024a. Coastal pelagic species fishery management plan. https://www.pcouncil.org/documents/2023/06/coastal-pelagic-species-fishery-management-plan.pdf.
PFMC. 2024b. Status of the Pacific Coast groundfish fishery stock assessment and fishery evaluation. https://www.pcouncil.org/documents/2024/08/status-of-the-pacific-coast-groundfish-fishery-stock-assessment-and-fishery-evaluation-july-2025.pdf/
PFMC. 2024c. Status of the U.S. West Coast Fisheries for Highly Migratory Species through 2023: Stock Assessment and Fishery Evaluation. https://www.pcouncil.org/documents/2024/10/h-3-attachment-1-status-of-the-u-s-west-coast-fisheries-for-highly-migratory-species-through-2023-electronic-only.pdf.
PFMC. 2024d. Pacific Coast salmon fishery management plan for commercial and recreational salmon fisheries off the coasts of Washington, Oregon, and California as revised through amendment 24. https://www.pcouncil.org/documents/2022/12/pacific-coast-salmon-fmp.pdf.
PFMC. 2025a. Re: Notice of availability of the California offshore wind draft programmatic environmental impact statement (Docket No. BOEM–2023 0061). Letter to the Bureau of Ocean Energy Management. https://www.regulations.gov/comment/BOEM-2023-0061-0298.
PFMC. 2025b. Review of the 2024 ocean salmon fisheries: Stock assessment and fishery evaluation document for the Pacific Coast salmon fishery management plan. https://www.pcouncil.org/documents/2025/02/review-of-2024-ocean-salmonfisheries.pdf.
PFMC. n.d.-a. “Coastal pelagic species.” https://www.pcouncil.org/managed_fishery/coastal-pelagic-species (accessed December 14, 2025)
PFMC. n.d.-b. “Fisheries Management Plans.” https://www.pcouncil.org/fishery-management-plans (accessed December 14, 2025).
PMFC. n.d.-c. “Tribes.” https://www.pcouncil.org/fishing-communities/tribes (accessed December 14, 2025).
PFMC. n.d.-d “Who are we and what we do.” https://www.pcouncil.org/about-the-council-2/ (accessed December 14, 2025).
PSC (Pacific Salmon Commission). n.d.-a. “About Us.” https://www.psc.org/about-us (accessed December 14, 2025).
PSC. n.d.-b. “Panels.” https://www.psc.org/about-us/structure/panels/ (accessed December 14, 2025).
PSMFC (Pacific States Marine Fisheries Commission). 2025. “Pacific Fisheries Information Network (PacFIN) Reports.” https://reports.psmfc.org/pacfin/f?p=501:1000 (accessed July 3, 2025)
PSMFC (Pacific States Marine Fisheries Commission). n.d.-a. “Recreational Fisheries Information Network (RecFIN).” https://www.psmfc.org/program/recreational-fisheries-information-network-recfin (accessed December 14, 2025).
PSMFC. n.d.-b. “Tri-State Dungeness Crab (TSDC).” https://www.psmfc.org/program/tri-state-dungeness-crab-tsdc/?pid=17 (accessed December 14, 2025).
Pozo Buil, Mercedes, Michael G. Jacox, Jerome Fiechter, Michael A. Alexander, Steven J. Bograd, Enrique N. Curchitser, Christopher A. Edwards, Ryan R. Rykaczewski, and Charles A. Stock. 2021. “A Dynamically Downscaled Ensemble of Future Projections for the California Current System.” Frontiers in Marine Science Volume 8 - 2021. doi: 10.3389/fmars.2021.612874.
Raghukumar, Kaustubha, Timothy Nelson, Michael Jacox, Christopher Chartrand, Jerome Fiechter, Grace Chang, Lawrence Cheung, and Jesse Roberts. 2023. “Projected cross-shore changes in upwelling induced by offshore wind farm development along the California coast.” Communications Earth & Environment 4 (1):116. doi: 10.1038/s43247-023-00780-y.
Rykaczewski, Ryan R., and David M. Checkley. 2008. “Influence of ocean winds on the pelagic ecosystem in upwelling regions.” Proceedings of the National Academy of Sciences 105 (6):1965-1970. doi: 10.1073/pnas.0711777105.
Samhouri, Jameal F., Blake E. Feist, Michael Jacox, Owen R. Liu, Kate Richerson, Erin Steiner, John Wallace, Kelly Andrews, Lewis Barnett, Anne H. Beaudreau, Lyall Bellquist, Mer Pozo Buil, Melissa A. Haltuch, Abigail Harley, Chris J. Harvey, Isaac C. Kaplan, Karma Norman, Amanda Phillips, Leif K. Rasmuson, Eric J. Ward, Curt Whitmire, and Rebecca L. Selden. 2024. “Stay or go? Geographic variation in risks due to climate change for fishing fleets that adapt in-place or adapt on-the-move.” PLOS Climate 3 (2):e0000285. doi: 10.1371/journal.pclm.0000285.
Santora, Jarrod A., Nathan J. Mantua, Isaac D. Schroeder, John C. Field, Elliott L. Hazen, Steven J. Bograd, William J. Sydeman, Brian K. Wells, John Calambokidis, Lauren Saez, Dan Lawson, and Karin A. Forney. 2020. “Habitat compression and ecosystem shifts as potential links between marine heatwave and record whale entanglements.” Nature Communications 11 (1):536. doi: 10.1038/s41467-019-14215-w.
Smith, James, Mercedes Pozo Buil, Barbara A Muhling, Desiree Tommasi, Stephanie Brodie, Timothy H. Frawley, Jerome Fiechter, Stefan Koenigstein, Amber Himes-Cornell, Michael A. Alexander, Steven J. Bograd, Nathalí Cordero Quirós, Larry B. Crowder, Enrique Curchitser, Stephanie J. Green, Natasha A. Hardy, Alan C. Haynie, Elliott L. Hazen, Kristin Hols-man, Gwendal Le Fol, and Michael G. Jacox. 2023. “Projecting climate change impacts from physics to fisheries: A view from three California Current fisheries.” Progress in Oceanography 211 (102973). doi: 10.1016/j.pocean.2023.102973.
Somers, K. A., C. E. Whitmire, K. E. Richerson, and V. J. Tuttle. 2023. Fishing Effort in the 2002-21 U.S. Pacific Coast groundfish fisheries. In NOAA Technical Memorandum NMFS-NWFSC-184: U.S. Department of Commerce.
Vestfals, Cathleen D., Franz J. Mueter, Janet T. Duffy-Anderson, Morgan S. Busby, and Alex De Robertis. 2019. “Spatiotemporal distribution of polar cod (Boreogadus saida) and saffron cod (Eleginus gracilis) early life stages in the Pacific Arctic.” Polar Biology 42 (5):969-990. doi: 10.1007/s00300-019-02494-4.
von Krauland, Anna-Katharina, Qirui Long, Peter Enevoldsen, and Mark Z. Jacobson. 2023. “United States offshore wind energy atlas: Availability, potential, and economic insights based on wind speeds at different altitudes and thresholds and policy-informed exclusions.” Energy Conversion and Management: X 20:100410. doi: 10.1016/j.ecmx.2023.100410.
Wang, Yi-Hui, Ryan K. Walter, Crow White, and Benjamin I. Ruttenberg. 2022. “Spatial and temporal characteristics of California commercial fisheries from 2005 to 2019 and potential overlap with offshore wind energy development.” Marine and Coastal Fisheries 14 (4). doi: 10.1002/mcf2.10215.
WDFW (Washington Department of Fish and Wildlife). 2024. Washington coastal Dungeness crab fishery newsletter (accessed December 14, 2025).
WDFW. 2025a. Washington Coastal Dungeness Crab Fishery Newsletter, 3rd Edition, 2024-2025. https://wdfw.wa.gov/sites/default/files/publications/02563/wdfw02563.pdf (accessed January 6, 2026).
WDFW. 2025b. Washington sport fishing rules. https://www.eregulations.com/assets/docs/resources/WA/25WAFW_LR4_2025-07-30-194306_loqp.pdf (accessed December 14, 2025).


