Public Transit Workforce Development for Zero-Emission Vehicles (2025)
Chapter: 1 Introduction

CHAPTER 1
Introduction
Public transportation agencies with zero-emission vehicles (ZEVs) require new skill sets for the frontline workforce that operates and maintains these vehicles. This report provides resources to assist transit agencies in building the skills of their frontline workforce. The ZEVs referred to in this report are confined battery-electric buses (BEBs) and fuel-cell buses (FCBs) used in public transit revenue service.
ZEVs use an energy storage system (ESS) consisting of battery cells that provide electrical energy to power the bus.
- BEBs require external charging, typically from the electrical grid, to keep the ESS batteries charged.
- FCBsʼ charging is done via a fuel cell that combines hydrogen, stored on board the bus in refillable tanks, with oxygen contained in the air to produce a chemical reaction that charges the batteries.
Although the focus of this report is on full-size transit BEBs and FCBs, much of the information can be applied to zero-emission (ZE) paratransit and support vehicles.
This research is focused exclusively on the skills and knowledge needed to operate and maintain ZEVs (i.e., vehicle operators and maintenance technicians). The report does not address any of the equipment used to replenish onboard hydrogen tanks in the case of FCBs, nor to recharge BEB batteries. It does not address other infrastructure for ZEVs.
While transit agencies will face challenges when they introduce ZEVs since they are highly complex vehicles, agencies with hybrid-electric vehicles, which essentially charge their batteries via an internal combustion engine (ICE), typically diesel, will have an easier time, as their technicians already have a certain degree of electric propulsion experience and skills.
Background: Introduction and Expansion of Zero-Emission Fleets
Adoption of ZEVs by public transportation agencies has grown considerably over the past decade. The FTAʼs National Transit Database (NTD) included 177 transit agencies with BEBs and seven transit agencies with hydrogen fuel-cell electric buses in service in 2022,11 as shown in Figure 1. These are small percentages (6.5% and 0.25% respectively) of the 2,737 transit agencies reporting to NTD, but the numbers have been growing every year. Continued growth, however, is not guaranteed and depends on long-term ZEV performance and future funding commitments, which are unknown at this time and are not addressed by this report.
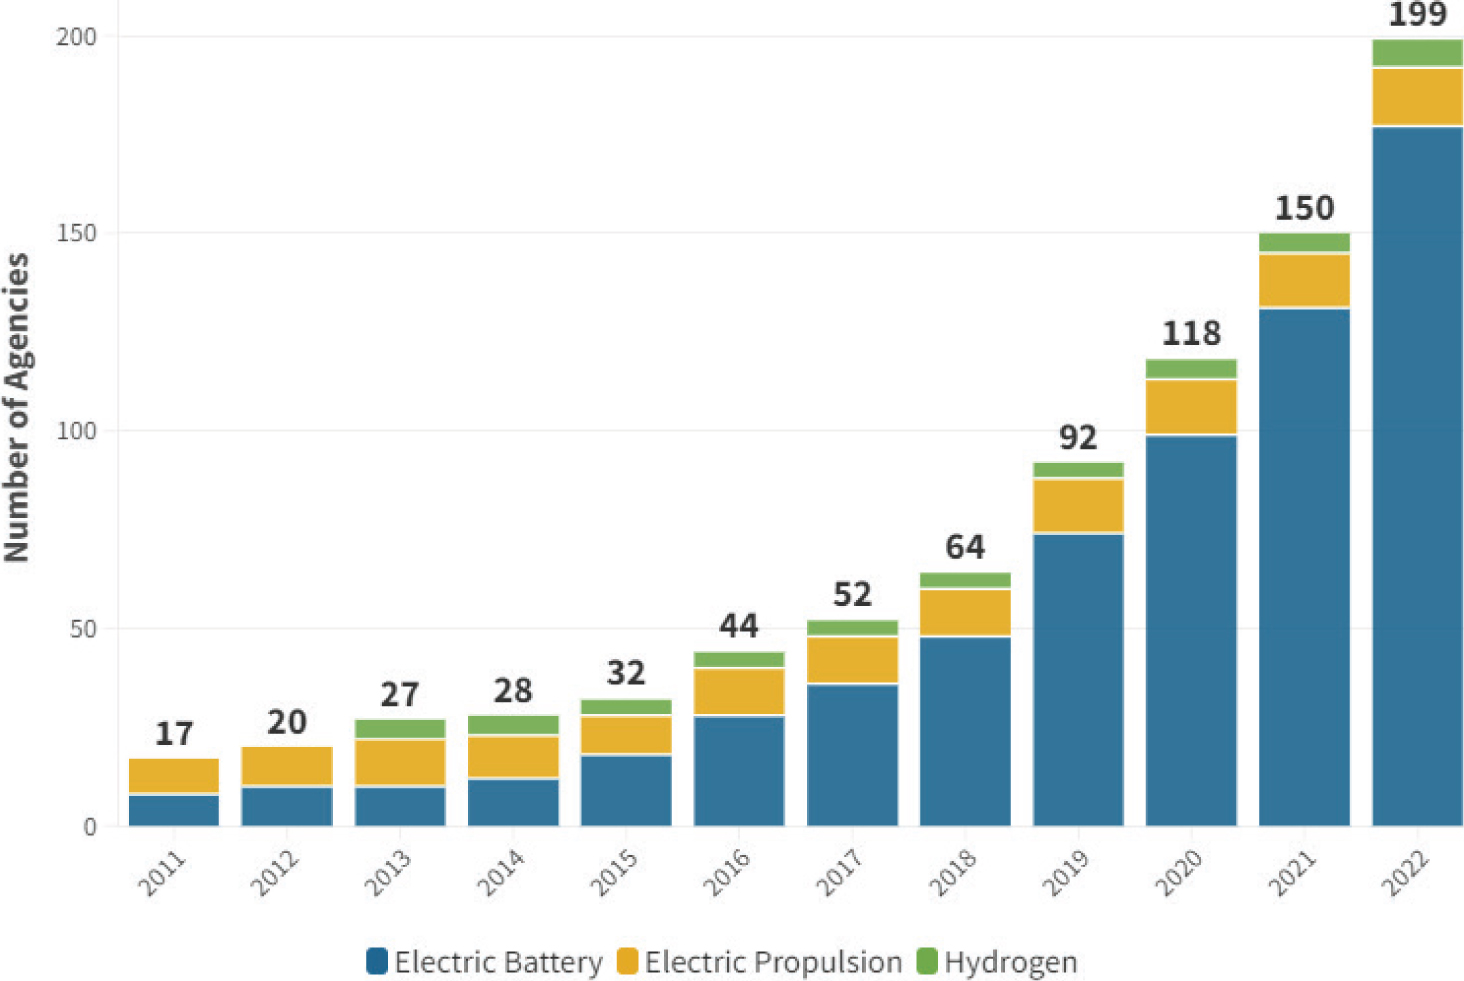
Transit agencies with multiple fuel types are counted in each category.
Source: Annual Database Revenue Vehicle Inventory, 2022. National Transit Database, FTA.
Long Description.
The horizontal axis represents the year, ranging from 2011 to 2022 in increments of 1 year. The vertical axis represents the number of agencies ranging from 0 to 200 in increments of 50. The data shows 2011, electric battery 0 to 10, electric propulsion 10 to 17, and total of 17; 2012, electric battery 0 to 12, electric propulsion 12 to 20 and total of 20; 2013, electric battery 0 to 12, electric propulsion 12 to 22, hydrogen 22 to 27 and total of 27; 2014, electric battery 0 to 13, electric propulsion 13 to 22, hydrogen 22 to 28 and total of 28; 2015, electric battery 0 to 15, electric propulsion 15 to 30, hydrogen 30 to 32 and total of 32; 2016, electric battery 0 to 29, electric propulsion 29 to 42, hydrogen 42 to 44 and total of 44; 2017, electric battery 0 to 33, electric propulsion 33 to 50, hydrogen 50 to 52 and total of 52; 2018, electric battery 0 to 50, electric propulsion 50 to 62, hydrogen 62 to 64 and total of 64; 2019, electric battery 0 to 70, electric propulsion 70 to 90, hydrogen 90 to 92 and total of 92; 2020, electric battery 0 to 94, electric propulsion 94 to 116, hydrogen 116 to 118 and total of 118; 2021, electric battery 0 to 138, electric propulsion 138 to 145, hydrogen 145 to 150 and total of 150; 2022, electric battery 0 to 180, electric propulsion 180 to 195, hydrogen 195 to 199 and total of 199. All the values are approximate.
Additionally, the impact on the transit industry of new, more optimized hybrid propulsion systems remains unclear. Unlike older hybrids, the new generation of buses have a zero-emission feature, where the diesel engine is switched completely off at stops and stays off during acceleration, relying solely on battery power. The bus can also be programmed using global positioning system (GPS) technology to use battery-only propulsion in areas like the city center, around hospitals and schools, and in other areas designated by the transit agency. Regardless of what the future may hold for these new hybrid vehicles, operators and technicians must be trained to operate and maintain these vehicles using many of the same skills applicable to ZEVs (e.g., high-voltage training, upscaling of basic electrical skills, and bus operator training).
Figures 2 and 3 show the increase in battery-electric and hydrogen fuel-cell electric bus use, collectively referred to as ZEVs, and also illustrate the comparative stagnation of wayside electric propulsion power, which in these charts is made up of trolleybuses and vintage trolleys reported to NTD.
The increase in transit ZEVs has occurred mostly with standard-sized 35- and 40-foot buses, although other types, including smaller vehicles, articulated buses, over-the-road buses, and support vehicles, have also experienced significant growth since 2012 (Figure 3). Figure 4 shows the wide variety of transit ZEVs in service in 2022.
In addition to vehicles already in service, many more transit ZEVs have been funded, ordered, or delivered and are awaiting preparation for service. Including these vehicles, CALSTART estimates that there were a total of 5,480 zero-emission buses (ZEBs), including BEBs and FCBs, in some stage of adoption in the United States in 2022—an increase of 66% from 3,297 in 2021. California has by far the most ZEBs, with 1,977 buses funded, ordered, or delivered. Eleven other states have more than 100 ZEBs in various stages of procurement and deployment, and three states have yet to use any BEBs as of 2022.12
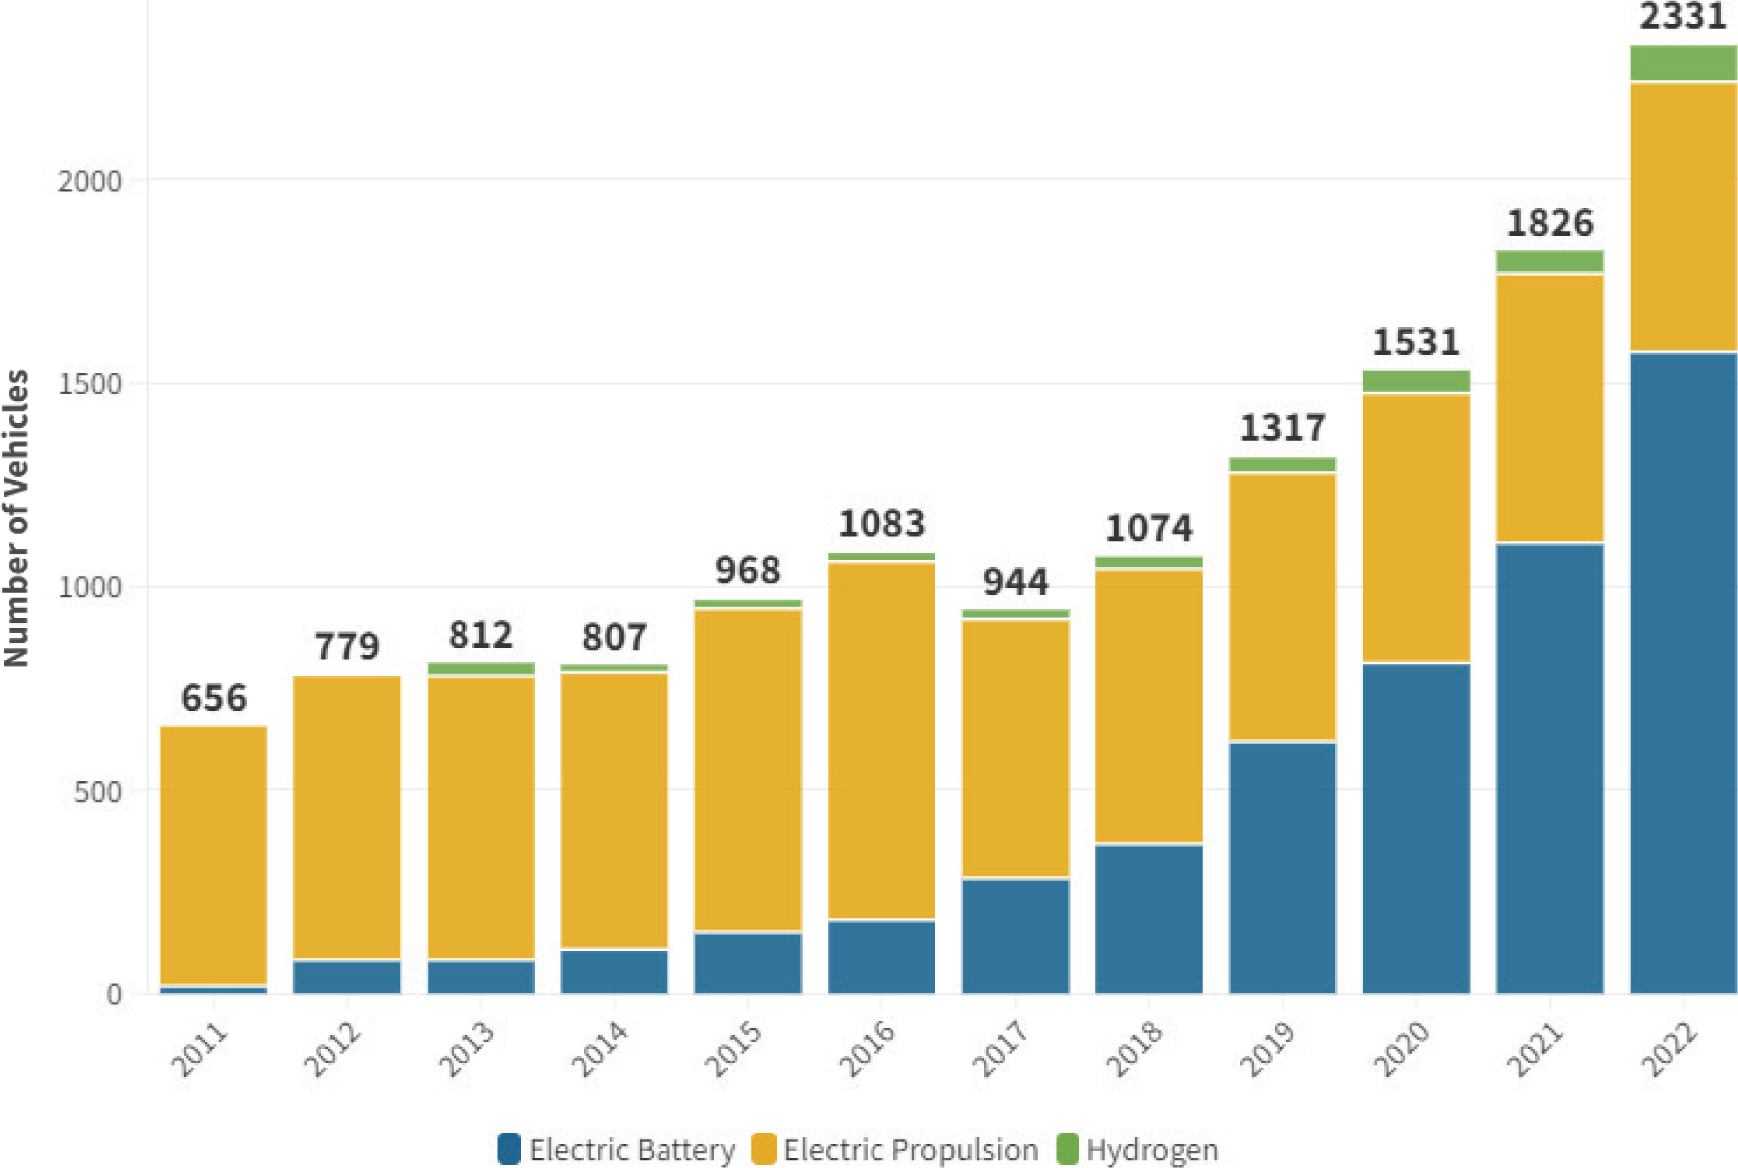
Source: Annual Database Revenue Vehicle Inventory, 2022. National Transit Database, FTA.
Long Description.
The horizontal axis represents years ranging from 2011 to 2022 in increments of 1 year. The vertical axis represents vehicles ranging from 0 to 2000 in increments of 500. The data shows 2011, electric battery 0 to 50, electric propulsion 50 to 656, and a total of 656; 2012, electric battery 0 to 100, electric propulsion 100 to 779, and a total of 779; 2013, electric battery 0 to 100, electric propulsion 100 to 800, hydrogen 800 to 812, and a total of 812; 2014, electric battery 0 to 120, electric propulsion 120 to 800, hydrogen 800 to 807, and a total of 807; 2015, electric battery 0 to 150, electric propulsion 150 to 960, hydrogen 960 to 968, and a total of 968; 2016, electric battery 0 to 160, electric propulsion 160 to 1075, hydrogen 1075 to 1083, and a total of 1083; 2017, electric battery 0 to 200, electric propulsion 200 to 935, hydrogen 935 to 944, and a total of 944; 2018, electric battery 0 to 250, electric propulsion 250 to 1065, hydrogen 1065 to 1074, and a total of 1074; 2019, electric battery 0 to 600, electric propulsion 600 to 1300, hydrogen 1300 to 1317, and a total of 1317; 2020, electric battery 0 to 750, electric propulsion 750 to 1490, hydrogen 1490 to 1531, and a total of 1531; 2021, electric battery 0 to 1100, electric propulsion 1100 to 1800, hydrogen 1800 to 1826, and a total of 1826; 2022, electric battery 0 to 1600, electric propulsion 1600 to 2200, hydrogen 2200 to 2331, and a total of 2331. All the values are approximate.
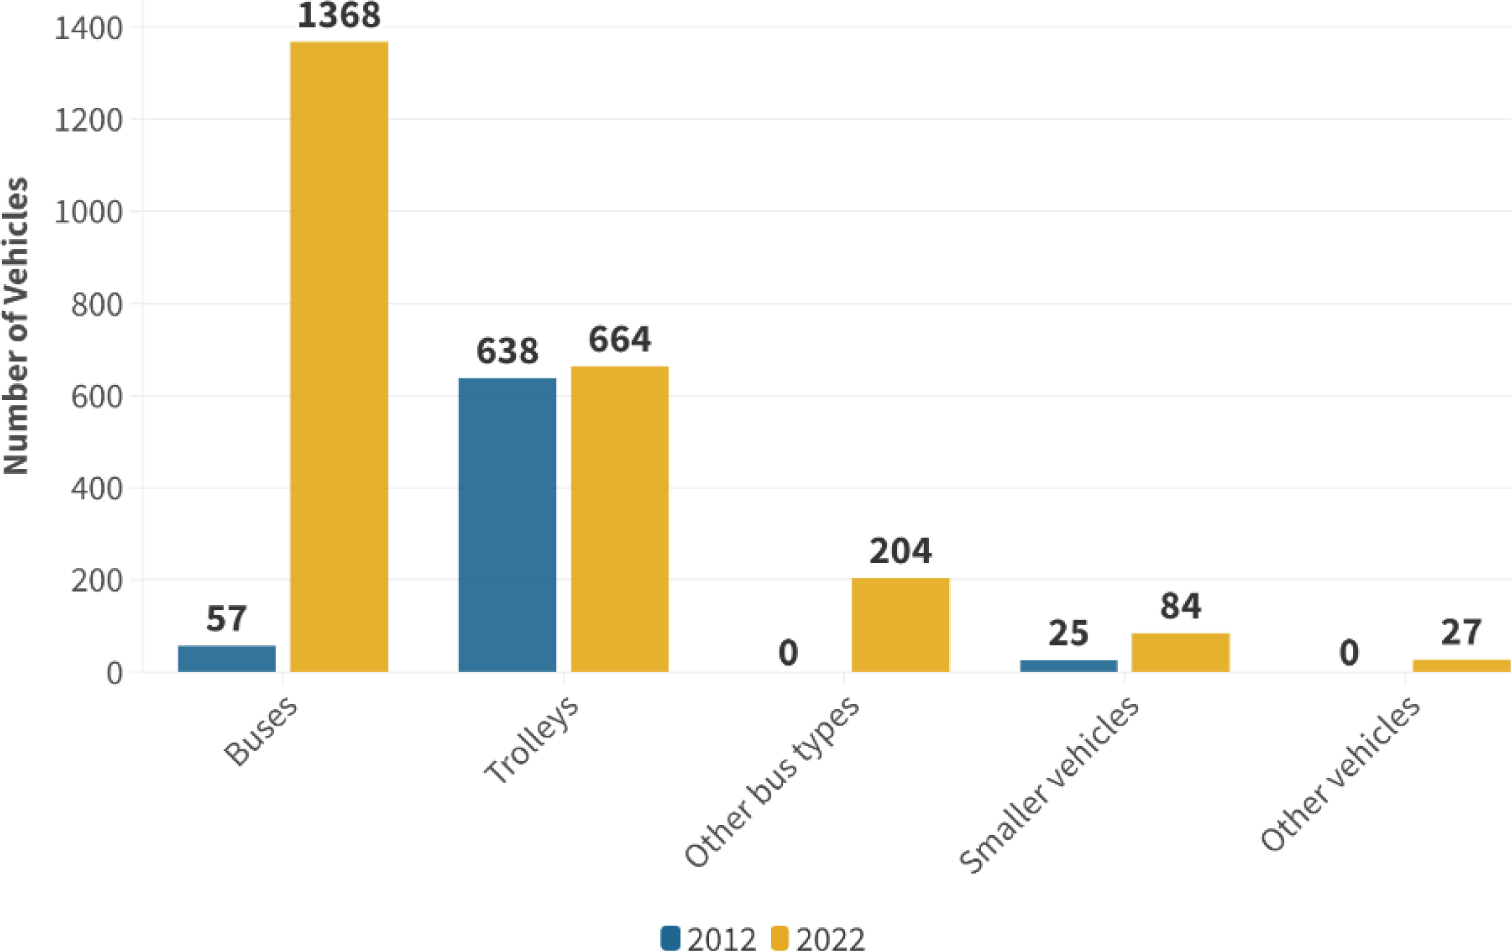
Source: Annual Database Revenue Vehicle Inventory, 2022. National Transit Database, FTA.
Long Description.
The horizontal axis represents vehicle type: buses, trolleys, other bus types, smaller vehicles, and other vehicles. The vertical axis represents the number of vehicles ranging from 0 to 1400 in increments of 200. The data shows: Buses 2012, 57, and 2022, 1368; Trolleys 2012, 638, and 2022, 664; Other bus types 2012, 0, and 2022, 204; Smaller vehicles 2012, 25, and 2022, 84; and other vehicles 2012, 0, and 2022, 27.
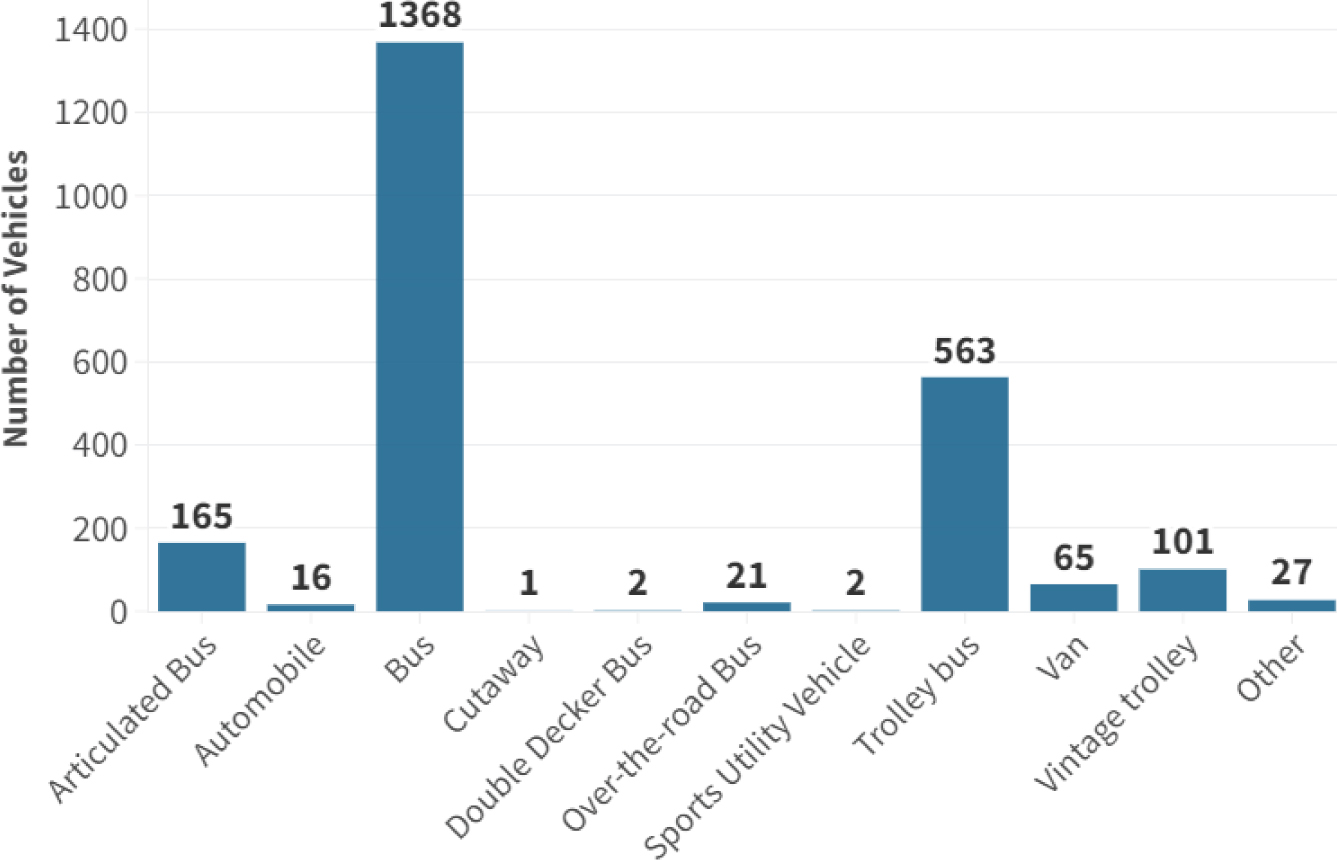
Source: Annual Database Revenue Vehicle Inventory, 2022. National Transit Database, FTA.
Long Description.
The horizontal axis represents vehicle type. The vertical axis represents the number of vehicles ranging from 0 to 1400 in increments of 200. The data shows articulated bus, 165; automobile, 16; bus, 1368; cutaway, 1; double-decker bus, 2; over the road bus, 21; sports utility vehicle, 2; trolley bus, 563; van, 65; vintage trolley, 101; and other, 27.
FTA Funding
As of 2024, the FTAʼs Low or No Emission (Low-No) Grant Program and Grants for Buses and Bus Facilities had funded the purchase of over 3,750 ZEBs.13,14,15 Grant recipients for the Low-No and Buses and Bus Facilities projects received an additional 5% of funding set aside for workforce development activities unless the transit agency demonstrated in its application that workforce development funding was not needed. For example, a transit agency that was awarded $1 million for the purchase of a single ZEV received an additional $50,000 to be spent on workforce development.16 This was a large increase from prior rounds of funding, which allowed for 0.5% of any award to be used for workforce development activities, and for 0.5% to be used to purchase training through the National Transit Institute.
State Commitment to ZEVs
Fourteen states, as well as the District of Columbia and Puerto Rico, have adopted 100% clean energy goals,17 and 14 states aim to achieve net-zero goals by 2050, many with earlier interim goals.18 As part of these policies, some states have begun instituting transit-specific regulations to move toward net-zero goals.
In 2020, 15 states and the District of Columbia announced a joint memorandum of understanding (MOU) committing to a goal that 100% of all new medium- and heavy-duty vehicle sales be ZEVs by 2050, with an interim target of 30% ZEV sales by 2030. The states that signed the MOU are California, Connecticut, Colorado, Hawaii, Maine, Maryland, Massachusetts, New Jersey, New York, North Carolina, Oregon, Pennsylvania, Rhode Island, Vermont, and Washington.19
Additional examples of state commitment to ZEVs are discussed in the following:
- California. In December of 2018, the California Air Resources Board instituted a regulation for all California transit agencies to operate all zero-emission vehicles by 2040. This means that more than 150 transit agencies in the state must upskill their workforce to operate and maintain a fleet of zero-emission vehicles.
- Colorado. In 2021, the Colorado Department of Transportation (CDOT) released the Transit Zero Emission Vehicle Roadmap. Two of its major objectives are that (1) 1,000 transit vehicles will be zero-emission by 2030, and (2) all transit fleets will operate 100% zero-emission by 2050. CDOT included an overview of the anticipated curriculum for the affected workforce, along with the financial modeling showing the cost of meeting its goal.
- New York. New York followed the path that California has forged where transit agencies are required to meet the ZEV standard by 2045.20
Transit Agency Goals for ZEVs
Individual transit agencies have set goals for ZEV fleets. For example, as of 2024:
- AC Transit, in Oakland, California, had a climate action plan that includes a goal of achieving a full zero-emission bus fleet by 2040.21
- Houston Metro committed to purchasing only ZEBs by 2030.22
- San Francisco Municipal Transportation Authority (SFMTA) planned to have the entire bus fleet become zero-emission by 2037, 3 years earlier than required by the state mandate.23
- SEPTA, in Philadelphia, is required to comply with the stateʼs goal of having 100% of bus purchases be ZEBs and has further committed to converting all buses to ZEBs by 2040.24
- TriMet, in Portland, Oregon, has a goal of having an entirely ZEB fleet by 2040.25
As mentioned previously, future funding commitments for ZEVs are uncertain at this time.
Methodology and Report Structure
This report is the result of research completed over an 18-month period. The research approach included:
- A literature review,
- Industry input and feedback, and
- Case studies and profiles.
The research methodology is provided in more detail in Appendix A. The case studies and profiles are included in Appendix B, focus group summaries are presented in Appendix C, and industry survey findings are in Appendix D. Appendix E contains an example skills-gap analysis, which is a strategy that will be further described in this report, particularly in Chapter 2.
The introduction of ZEV technology into public transit fleets brings with it new workforce challenges. Based on the research findings, this report presents seven essential tasks to support vehicle operators and technicians in safely and effectively operating and maintaining ZEVs. These tasks, when carried out appropriately, will help overcome the challenges facing ZEV vehicle operators and technicians. While the order of the tasks does not imply prioritization, it does follow a logical progression:
- Identify needed ZEV skills for operators and technicians,
- Assess workforce readiness, and
- Develop a systematic process for building skills.
These initial tasks then lead to implementation:
- Cultivate original equipment manufacturer (OEM) support,
- Establish training resources,
- Build fundamental electrical skills, and
- Recruit and retain workforce to operate and maintain ZEVs.
The following chapters focus on the essential tasks and include background information that reinforces the importance of each task. The background information is followed by the approaches and resources that transit agencies found to be useful in introducing zero-emission vehicles to their fleets. While an individual transit agency may need to focus on certain tasks more than others, each of the seven tasks are important to consider.
Throughout the report, sidebars provide specific examples of transit agency approaches to the tasks being discussed.


