Automated Traffic Signal Performance Measures: Management, Operation, and Maintenance (2026)
Chapter: 1 Introduction

CHAPTER 1
Introduction
Background
Automated traffic signal performance measures (ATSPMs) are developed using high-resolution controller data, which is based on signal state (i.e., red, green, yellow) and detector events that are collected up to 10 times every second. This high degree of granularity and wealth of information allow for continuous and proactive monitoring of traffic flow, traffic signal operations, and maintenance. ATSPMs provide a means for monitoring trends in traffic signal performance and have been used in support of proactive traffic signal system management. This allows signal operators to identify signal timing and maintenance-related issues before the public calls to report them and gives operators the capability of remotely diagnosing issues and developing solutions, thereby addressing them almost in real time. Additionally, ATSPMs provide real-time signal performance data that can be used to determine the impacts of signal timing changes and whether additional signal timing adjustments are needed.
ATSPMs have been used at signalized intersections to support proactive data collection, monitoring, and analysis. Several studies have shown that ATSPMs can help DOTs considerably improve intersection performance by providing information needed to improve signal timing (Day et al., 2014; Day, Bullock, et al., 2015). Additionally, the FHWA and AASHTO have included ATSPMs in recent initiatives aimed at supporting data-driven traffic signal management practices. In 2013, AASHTO selected ATSPMs as a focus technology for the AASHTO Innovation Initiative, and FHWA included ATSPMs in the fourth round of the Every Day Counts (EDC) initiative that promotes technology use by agencies to more proactively support safety and mobility goals.
Despite the well-documented benefits of ATSPMs, their use varies considerably among state departments of transportation (DOTs) in the United States. While some DOTs have already integrated ATSPMs into their day-to-day practices across many locations, others have limited their use to key corridors or small-scale pilot projects or have not used them at all. This is because state DOTs sometimes face challenges with implementation, maintenance, and operation/expansion of the system. Some of these challenges include securing funding to support or expand deployment, meeting staffing requirements to operate and maintain the system, and upgrading physical equipment. Therefore, there is a need to assess the current state of the practice and develop guidance for state DOTs that currently have ATSPMs and plan to expand their system or that are considering a new implementation. While there is a wealth of information related to the operational benefits of ATSPMs, there is relatively little documentation related to the institutional challenges that are often experienced by state DOTs. This synthesis addresses that gap by identifying factors that lead to sustained ATSPM deployment and by identifying barriers to further adoption and use of ATSPMs. Additionally, this synthesis documents how technology has been adopted by state DOTs, using ATSPMs as an example, along with the challenges the DOTs experienced during the adoption and expansion of the system.
It should be noted that in addition to ATSPMs, which use high-resolution data from signal controllers and detectors, state DOTs have also utilized new datasets developed from crowdsourced records of vehicle movement. These new datasets do not rely on high-resolution signal controller data and detector data, but instead utilize emerging datasets such as from probe vehicles and connected vehicles (CVs), as well as other data from moving detectors. For the context of this document, these solutions are defined as crowdsourced ATSPMs, while ATSPMs that use high-resolution signal controller and detector data are defined as traditional ATSPMs. Additionally, systems that use either crowdsourced ATSPMs or traditional ATSPMs are defined as signal performance measure (SPM) solutions. This synthesis primarily focuses on traditional ATSPMs; however, given the increasing use of crowdsourced ATSPMs by DOTs, the authors also examined these solutions and their use by state DOTs in the literature review, agency survey, and case examples.
Definitions
Different ATSPM terminology is sometimes used by different authors and DOTs. To ensure consistency, the following definitions are used in this report.
- Traditional ATSPMs. Platforms to evaluate effectiveness and efficiency of traffic signal operations in an ongoing fashion based on high-resolution signal controller and detector data. These platforms typically include Utah DOTʼs open-source ATSPM software, vendor-provided platforms, or even custom-made platforms based on high-resolutions signal and detector data.
- Crowdsourced ATSPMs. Unlike traditional ATSPMs, crowdsourced ATSPMs are not exclusively based on high-resolution signal controller and detector data. Emerging datasets such as from probe vehicles and CVs have recently been used by agencies to develop crowdsourced ATSPMs.
- SPM solutions. Systems that use either traditional ATSPMs or crowdsourced ATSPMs.
- High-resolution signal controller data. Time-stamped events of signal controller and detector data that are typically recorded at the nearest 1/10th of a second by the traffic signal controller.
- UDOT open-source ATSPM software. Open-source ATSPM software that was developed by the Utah Department of Transportation (UDOT) for downloading high-resolution data, calculating ATSPMs, and publishing reports and charts online.
Overview of ATSPM Components
Traditional ATSPMs requires physical equipment and software to collect and process high-resolution signal controller data and generate signal performance measures. The main components required to effectively use traditional ATSPMs include the following:
- Communication. While communication is not strictly required for traditional ATSPMs since data can be collected during periodic field visits, communication to a central location allows data to be collected automatically and in real time. This allows scalable deployment of traditional ATSPMs.
- Detection. While detection is also not required to use traditional ATSPMs, without detection, only a subset of signal performance measures can be generated (i.e., performance measures that only rely on signal state data). Detection is necessary to generate performance reports that include information about traffic flow [e.g., Purdue Coordination Diagram (PCD), Purdue Split Failure].
- Controllers with data-logging capability. To be able to generate high-resolution signal controller data, signal controllers are required to have high-resolution data-logging capability.
- Data storage. Data storage is required (either a server or cloud-based solutions) to be able to store high-resolution data and generate signal performance measures.
- Software. Software is needed to process the relevant data into signal performance measures. Open-source software that is developed by UDOT can be downloaded by practitioners and installed at no cost, although it may require staff time to implement (sometimes from the IT department). Vendor-developed software is also available for reporting and analytics of signal performance measures.
Figure 1 illustrates the basic flow of information at intersections used to produce traditional ATSPMs.
Communication
Communication systems are an important element of traditional ATSPM frameworks because real-time information about intersection performance cannot be easily retrieved without reliable communication. These systems enable automated retrieval of data from the field to the traffic management center. While it is possible to retrieve data manually from the field, this is not a scalable solution. In urban areas, fiber-optic communication networks have increasingly been used, while cellular communication networks are common both in urban and more remote locations.
Detection
As noted earlier, while detection is not required to generate certain signal performance measures, more metrics can be derived from high-resolution data with robust detection. For traditional ATSPMs, there is no requirement for a particular detection technology. It has been documented in the literature that traditional detection devices such as inductive loops (Day et al., 2014), radars (Taylor and Mackey, 2016), and video cameras (Jin et al., 2019) have been used to generate traditional ATSPMs. In essence, any detection technology that is used to actuate signal phases can provide information about detection status and can be used to generate traditional ATSPMs.
To extract the most information from high-resolution data, it is essential to document the detector layout and configure the ATSPM system with the corresponding information. The detector configuration defines the number of detectors and their spatial layout. The detector
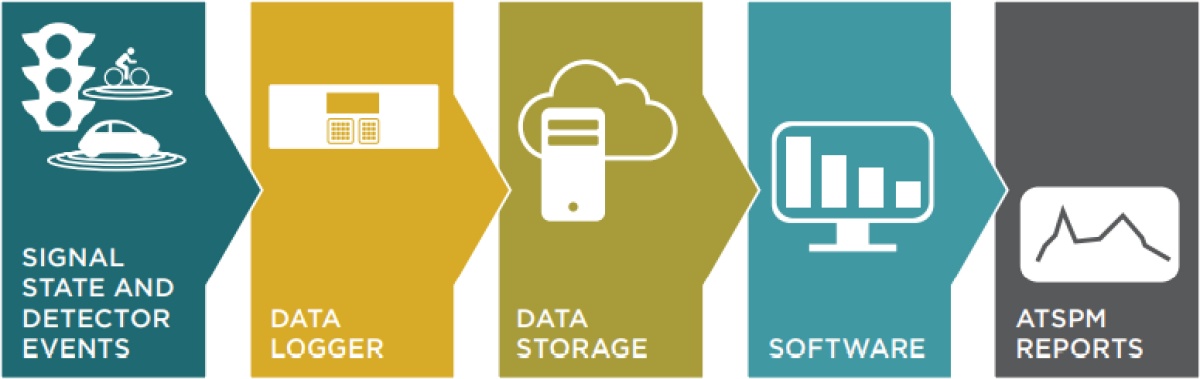
Long Description.
The flowchart depicts a sequence of stages starting with signal state and detector events, followed by data logger, data storage, software, and concluding with ATSPM reports. Each stage is represented by an icon: a traffic signal for events, a device for logging, a cloud for storage, a monitor for software, and a graph for reports.
configuration affects the types of performance measures that can be reported, and it can sometimes affect their accuracy. For example, lane-by-lane detection typically yields more accurate measures of capacity utilization than detectors that span multiple lanes. Figure 2(a) illustrates a recommended layout that allows for generation of a full suite of performance measures, and Figure 2(b) illustrates a lane-by-lane detector configuration layout prepared for Connecticut DOT. More details about performance measure detection requirements can be found in NCHRP Research Report 954: Performance-Based Management of Traffic Signals (Nevers et al., 2020).
Traffic Signal Controllers
In the past, traffic signal controllers were not capable of reporting high-resolution data on their own. To overcome this challenge, several efforts were undertaken to develop custom devices that would allow for retrieval of such data. One of the earliest efforts, back in 2004, was carried out by researchers in Indiana (Sturdevant, 2016), where a patch panel in the test cabinet was connected to the main signal control cabinet to route detector inputs and signal outputs. This setup enabled integration with autoscope/cameras for data collection and video verification, serving as a key component in the testing configuration. Later, researchers in Minnesota (Liu and Ma, 2008) developed high-resolution data decoder to support data retrieval. Figure 3 shows a high-resolution data decoder developed by the researchers from Minnesota.
Research supported by the U.S. DOTʼs Connected Vehicle Program and Purdueʼs Joint Transportation Research Program, in partnership with Indiana DOT, has demonstrated the value of high-resolution data for signal performance measures, traffic operations, and connected vehicle applications. As a result, traffic controller vendors began incorporating native support for high-resolution data logging into their firmware around the mid-to-late 2010s. This shift allowed agencies to access rich operational data directly from controllers without needing additional hardware in the cabinet, streamlining both deployment and maintenance while enhancing data-driven decision-making capabilities.
Data Storage
With traditional ATSPMs, high-resolution data are collected in an ongoing fashion, which requires storage for data archival. In 2018, it was estimated that 24 hours of data from a single intersection with a full detection layout required about 19 MB of storage (UDOT, 2018). Recent advancements in data compression techniques indicate that data storage requirements could be reduced by up to 90% (Taylor and Bassett, 2025). While there are several options available for data storage, in-house servers hosted by agencies and cloud-based solutions are the most common methods used.
Software for Traditional ATSPMs
The last component required to generate traditional ATSPMs is software that can process high-resolution data and produce signal performance measures. UDOT developed an open-source system for downloading high-resolution data, calculating traditional ATSPMs, and publishing reports and charts online. UDOTʼs website and its source code are publicly accessible (UDOT, 2025). In addition to UDOTʼs open-source system, vendors have also developed software that can generate traditional ATSPMs, primarily following the performance measures and the source code developed by UDOT. These vendorsʼ products are typically integrated into central system software or through web-based platforms.

Long Description.
The illustration shows a four-way intersection with detailed traffic flow and sensor placements. Lanes are marked with arrows indicating direction. Sensors are labeled for presence, advance count, advance speed, stop bar count, exit count, and yellow and red actuation. Distances of 65 feet and 400 feet are marked on the roads. The layout includes colored sections representing different sensor types and their positions relative to the intersection.

Long Description.
The aerial map displays an intersection with detailed annotations for traffic management. It includes detector channels, movement types, and lane numbers. Phases are marked as Phase 1, Phase 2, Phase 4, and Phase 6, indicating traffic light phases. Lanes are labeled with numbers such as 29 L.2, 30.T.2, 32. TL.2, 31. TR.2, 33.R.2, 34.L.2, 35.T.2, 36.TR.2 and 37.LTR.2. Overlap areas are noted, and approach speeds are given in miles per hour, like 20 MPH. The map also shows distances from the stop bar and includes a scale of 20 meters for reference. Hashtag hashtag: Detector Channel, Hashtag hashtag: Detector Channel (Detector not programmed for ATSPM), LTR: Movement Type, hashtag hashtag: Lane Number, ph hashtag Phase, OVX hashtag hashtag: Overlap (Phase + Phase), Hashtag hashtag hashtag: Distance from Stop Bar, hashtag hashtag MPH: Approach Speed, hashtag hashtag hashtag: Distance from Stop Bar (Detector Not Programmed for ATSPM), Hashtag hashtag MPH: Approach Speed (Detector Not Programmed for ATSPM).
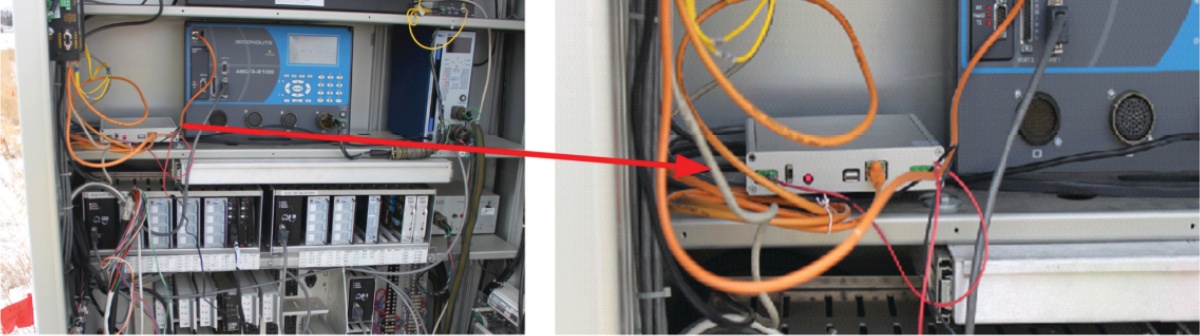
Long Description.
The illustration shows an electrical equipment setup featuring multiple interconnected devices and cables. On the left, a cabinet contains various electronic components, including a digital display and several switches. A red arrow points to a specific connection leading to another device on the right, which is part of a different setup. The right section includes additional equipment with visible ports and cables, indicating a network or power connection between the two setups.
Synthesis Objective and Scope
The objective of this synthesis is to document the current practices of state DOTs in managing, operating, and maintaining SPM solutions. The synthesis documented several aspects of SPM solutions:
- State DOT practices, including the organizational structure and deployment process;
- Funding strategies and return on investment;
- Staff capabilities, resource allocation, and institutional aspects related to SPM solutions;
- The use of SPM solutions for signal monitoring, optimization, maintenance, and performance measurement; and
- The systems and technology required that support SPM solutions.
Report Organization
This report contains five chapters and four appendices:
- Chapter 1: Introduction includes a background on traditional ATSPMs, provides key terminology and definitions, describes components required to generate traditional ATSPMs, and provides synthesis objectives and scope.
- Chapter 2: Literature Review provides a history of SPM solutions, discusses SPM solutions use cases, and presents state of the practice related to the integration of SPM solutions into agency businesses.
- Chapter 3: Survey Results presents key findings of the survey conducted among state DOTs.
- Chapter 4: Case Examples presents the five case examples conducted and discusses key findings and experience gained.
- Chapter 5: Summary of Findings provides key conclusions of the study and suggestions for future research.
- Appendices A through D include the survey questions (A), individual responses (B), interview questions for case examples (C), and additional resources (D).
Study Methodology
The study methodology for this synthesis included the following three tasks:
- A detailed review of the literature, including peer-reviewed articles, published studies, ATSPM monthly calls that are led by the FHWA, and published case studies by agencies;
- A survey of state DOTs in the United States, including those that use traditional ATSPMs or crowdsourced ATSPMs and those that do not use any SPM solutions; and
- In-depth case examples from five state DOTs with different levels of deployment of traditional and crowdsourced ATSPMs.
The authors acknowledge that portions of this document were proofread using a large language model (GPT-4.5).


