Automated Traffic Signal Performance Measures: Management, Operation, and Maintenance (2026)
Chapter: 2 Literature Review

CHAPTER 2
Literature Review
The literature review included a range of materials collected from the Transport Research International Documentation (TRID) database and Google Scholar: peer-reviewed journal articles, research reports, government documents, conference papers and proceedings, gray literature, and websites. This chapter is organized into six sections that cover the following topics:
- History and development of traditional ATSPMs,
- Development of performance measures for traditional ATSPMs and the objectives of these measures,
- Benefits and costs associated with deployment of traditional ATSPM technology,
- Integration of traditional ATSPMs into agency businesses and processes for day-to-day operation and maintenance of traffic signals,
- History and development of crowdsourced ATSPMs and relevant performance measures, and
- Additional resources pertaining to SPM solutions.
ATSPM Development
The concept of ATSPMs emerged from the realization that data already stored in traffic signal controllers, such as detector activations and phase state changes, could be leveraged to support data-driven traffic signal management. Although digital controllers have recorded such information since the 1970s, analytical use of these data only gained attention in the early 2000s.
Initial efforts to extract and analyze high-resolution controller data occurred independently at Texas A&M, Purdue University, and the University of Minnesota. Researchers at Texas A&M conducted simulation and field studies to develop early performance measures such as time to service, queue service time, and phase failure rate (Balke et al., 2005). Around the same time, Purdue University developed a prototype for retrieving high-resolution data and introduced several operational metrics, including volume-to-capacity ratio, percent arrivals on green, arrival type, and delay estimation (Smaglik, Sharma, et al., 2007; Sharma et al., 2007). In parallel, researchers in Minnesota focused on estimating queue lengths and travel times using virtual probe techniques (Liu and Ma, 2008; Liu et al., 2009).
The term high-resolution data was introduced to describe detailed, time-stamped event records, in contrast to earlier reporting methods that relied on aggregated or averaged detector data. A key advancement occurred in 2006 with the integration of data loggers into signal controllers, which eliminated the need for external data-collection devices. Industry collaboration followed, leading to a standardized event-logging format. The original event list included 45 codes in 2008 and was gradually expanded to 117 codes by 2019, incorporating additional data such as detector faults, logic outputs, and transit signal priority (TSP) events (Haseman, 2010; Sturdevant et al., 2012; Li et al., 2019). Figure 4 shows an example of high-resolution data.

Long Description.
The table presents data for intersection ID 4 b 2394 a a-d254, recorded on January 12, 2021. It includes columns for date, time, event code, and parameter. The times ranges from 1:28:51.3 to 1:29:30.3. Event codes 1, 81, and 82 are listed, with parameters ranging from 2 to 63.
Building on these technical foundations, UDOT led the development of a scalable ATSPM platform. Between 2012 and 2018, UDOT invested in implementing and refining an open-source system that supports configuration management and standardized performance reporting. Now in Version 5.0, the platform continues to evolve based on agency needs and field experience. Figure 5 shows the interface of UDOTʼs open-source ATSPM software Version 5.0.
Development of Performance Measures for Traditional ATSPMs
The purpose of this section is to present an overview of the development of performance measures for traditional ATSPMs and their objective of supporting proactive management, operation, and maintenance of traffic signals.
In an early attempt to classify ATSPM systems using the Open Systems Interconnection (OSI) model, which explains the functionality of networked computer systems, Day, Bullock, et al. (2015) defined a simplified hierarchy of signal system needs inspired by the OSI model but with a focus on the roles played by engineers and technicians in traffic signal operations. These five levels were further tied to an agencyʼs signal system objectives in NCHRP Research Report 954: Performance-Based Management of Traffic Signals (Nevers et al., 2020) and are listed here:
- Communication. Maximize the number of connected intersections.
- Detection. Maximize the number of functioning detectors.
- Intersection level/uncoordinated timing. Minimize delay for transportation system users (e.g., vehicles, bicycles, pedestrians) and improve safety.
- System-level/coordinated timing. Improve the service of priority movements by enhancing progression.
- Advanced systems and applications. Minimize delay for modes with preferential treatment (e.g., rail, emergency vehicles, transit, trucks).
To address these objectives, the rest of this section is organized along the lines of this list and discusses performance measures and use cases found in the literature.
Communication and Detection Health
Several studies have proposed performance measures to address communication and detection health, also known as equipment health. For instance, Li et al. (2013) looked at data retrieval from intersections (i.e., successful intersection pinging) in Indiana on a daily basis to better understand how consistently controllers responded to pings and whether data were successfully

Long Description.
The ATSPM interface displays the map centered on Salt Lake City, highlighting various performance measures with numbered markers. A sidebar on the left lists options like Performance Measures, Time-Space Diagrams, Link Pivot, and Aggregate Charts. A date selection tool on the right is set for May 22 to May 23, 2025. The interface is powered by the Utah Department of Transportation, as indicated by the UDOT logo at the bottom.
coming through the system. A controller that is set up to log and upload data to a central management system can exhibit four different states, as discussed in the following:
- A controller for which both ping and data collection have been successful is online.
- A controller that responds to ping tests but has missing data is likely to be experiencing a configuration error [e.g., data logging is disabled or the File Transfer Protocol (FTP) application is unresponsive].
- If the ping test is unsuccessful, but data are present, it is possible that data have been manually uploaded to the server (e.g., by transferring using a flash drive), or otherwise the ping application has stopped working.
- An intersection that both fails the ping test and has no data is offline.
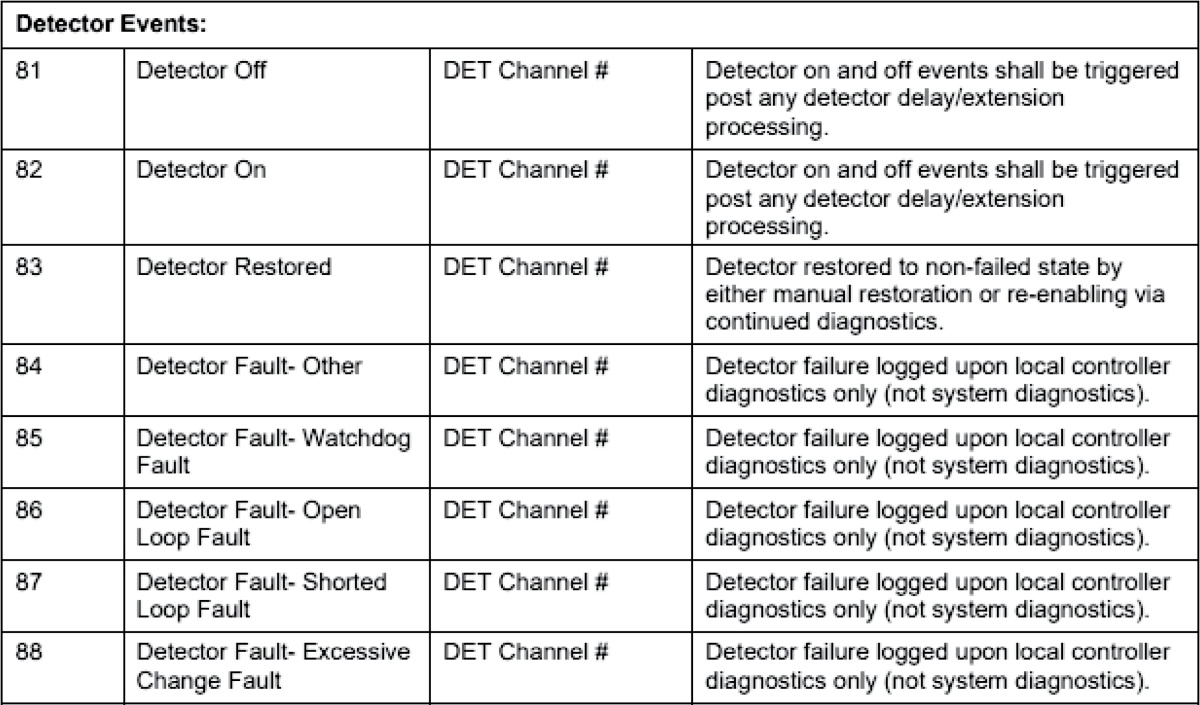
In another study, Zhao et al. (2015) looked at high-resolution data logs from intersection controllers to investigate intersection downtime with the aim of providing a method for identifying appropriate investment priorities for traffic signal battery backup systems. Signal controllers and detection systems typically feature some functions for reporting a variety of errors. Bullock et al. (2011) looked at temporal distribution of reported detector error status at a real intersection in Indiana to uncover malfunction errors. In the latest version of the high-resolution data enumerations, there is a series of data related to detector health that could be used to investigate detection health quality. No additional follow-up research was found in the literature on the exploration of these event codes. Figure 6 shows enumeration events for detector faults.
Another way to investigate detector health is to analyze the values reported for detector occupancy or the reason for signal phase termination. For example, if an actuated phase maxes out repeatedly during known low-volume periods, this is likely an indication of a malfunctioning detector, with max outs resulting from placement of a constant call (Day, Bullock, et al., 2015). These and similar observations were defined by traffic engineers and coded into a feature called “watchdog alerts,” an automated alert that is available in the UDOT open-source ATSPM software.
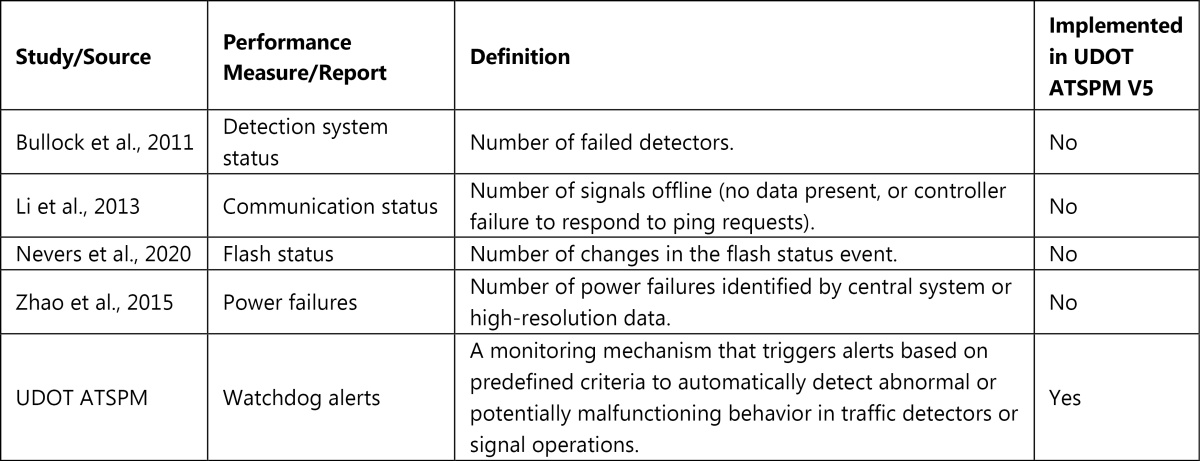
Table 1 shows various performance measures found in the literature, along with source, definition, and whether they are integrated into the UDOT open-source ATSPM software.
Long Description.
The table presents a list of detector events with corresponding codes, channels, and detailed descriptions. It includes events such as Detector Off, On, and Restored, each associated with a DET Channel number. Fault types are detailed, including Detector Fault - Other, Watchdog Fault, Open Loop Fault, Shorted Loop Fault, and Excessive Change Fault. Each fault description notes that failures are logged upon local controller diagnostics, not system diagnostics. The table provides a structured overview of how each event is triggered or restored, emphasizing the diagnostic process involved.
Long Description.
The column headers of the table are Study or Source, Performance Measure or Report, Definition, and Implemented in UDOT ATSPM v5. The row headers of the table are Bullock et al. 2011, Li et al. 2013, Nevers et al. 2020, Zhao et al. 2015, and UDOT ATSPM. The data given in the table row-wise are as follows: Row 1: Detection System Status, Number of failed detectors, No. Row 2: Communication Status, Number of signals offline (no data present, or controller failure to respond to ping requests), No. Row 3: Flash Status, Number of changes in the flash status event, No. Row 4: Power Failures, Number of power failures identified by central system or high-resolution data, No. Row 5: Watchdog Alerts, A monitoring mechanism that triggers alerts based on predefined criteria to automatically detect abnormal or potentially malfunctioning behavior in traffic detectors or signal operations, Yes.
Mobility
The review of the literature showed that the evaluation of mobility performance was the first use case for signal performance measures based on high-resolution data. The following subsections discuss signal performance measures and use cases of traditional ATSPMs related to vehicle mobility at three spatial levels: local intersection, coordinated system, and overall network.
Local Intersection Level
One of the earliest studies on traffic signal performance estimation using high-resolution data was conducted by researchers at Texas A&M (Balke et al., 2005). In that study, novel performance indicators, including time to service, queue service time, and phase failure rate, were developed. Shortly thereafter, researchers at Purdue used high-resolution data to address a long-standing goal of enabling real-time estimation of performance measures traditionally described in engineering references such as the Highway Capacity Manual (HCM). These measures include volume-to-capacity ratio, percent arrivals on green, arrival type, platoon ratio (Smaglik, Sharma, et al., 2007; Smaglik, Bullock, et al., 2007), and delay (Sharma et al., 2007). Day et al. (2008) proposed an approach for estimating intersection degree of saturation. These early research efforts were consolidated in the contractorʼs final report from NCHRP Project 3-79A, “Arterial Performance Measures,” which provided guidance on high-resolution data processing techniques and documented key findings (Day and Bullock, 2010).
In parallel, researchers in Minnesota conducted studies using high-resolution data to estimate queue lengths (Liu and Ma, 2008), the intersection oversaturation index, and delay (Liu et al., 2009; Wu et al., 2010). Estimation of intersection split failure, initially discussed by Balke et al. (2005), was further enhanced by Freije et al. (2014). In that study, the authors introduced a method for estimating split failures based on detector occupancy data during green and red intervals, focusing particularly on the first 5 seconds of the red phase (Freije et al., 2014). Performance measure development progressed further through the Pooled Fund Study TPF-5(258), which produced two reports that summarize available performance measures (Day et al., 2014) and discuss their integration into agency business processes (Day et al., 2015).
More recent studies have focused on movement-level and intersection-level capacity utilization. Guadamuz et al. (2022) proposed new green time utilization metrics, while Dobrota et al. (2023) introduced several performance measures to improve capacity utilization estimation. These included queued vehicles in volume-to-capacity ratio (QViV/C), cycle utilization (CLU), and
volume-occupancy capacity utilization (VOCU), which aim to provide more detailed insights into capacity usage than traditional indicators do.
Some performance measures incorporated into traditional ATSPMs originate from adaptive traffic signal control systems. For example, the green occupancy ratio that was examined by Smaglik et al. (2011) was originally developed as part of an adaptive traffic control system called ACS-Lite (Luyanda et al., 2003). In a more recent evaluation, Dobrota et al. (2023) analyzed the degree of saturation metric used by the SCATS (Sydney Coordinated Adaptive Traffic System), as documented in Pascale et al., 2015, and compared its effectiveness to the green occupancy ratio.
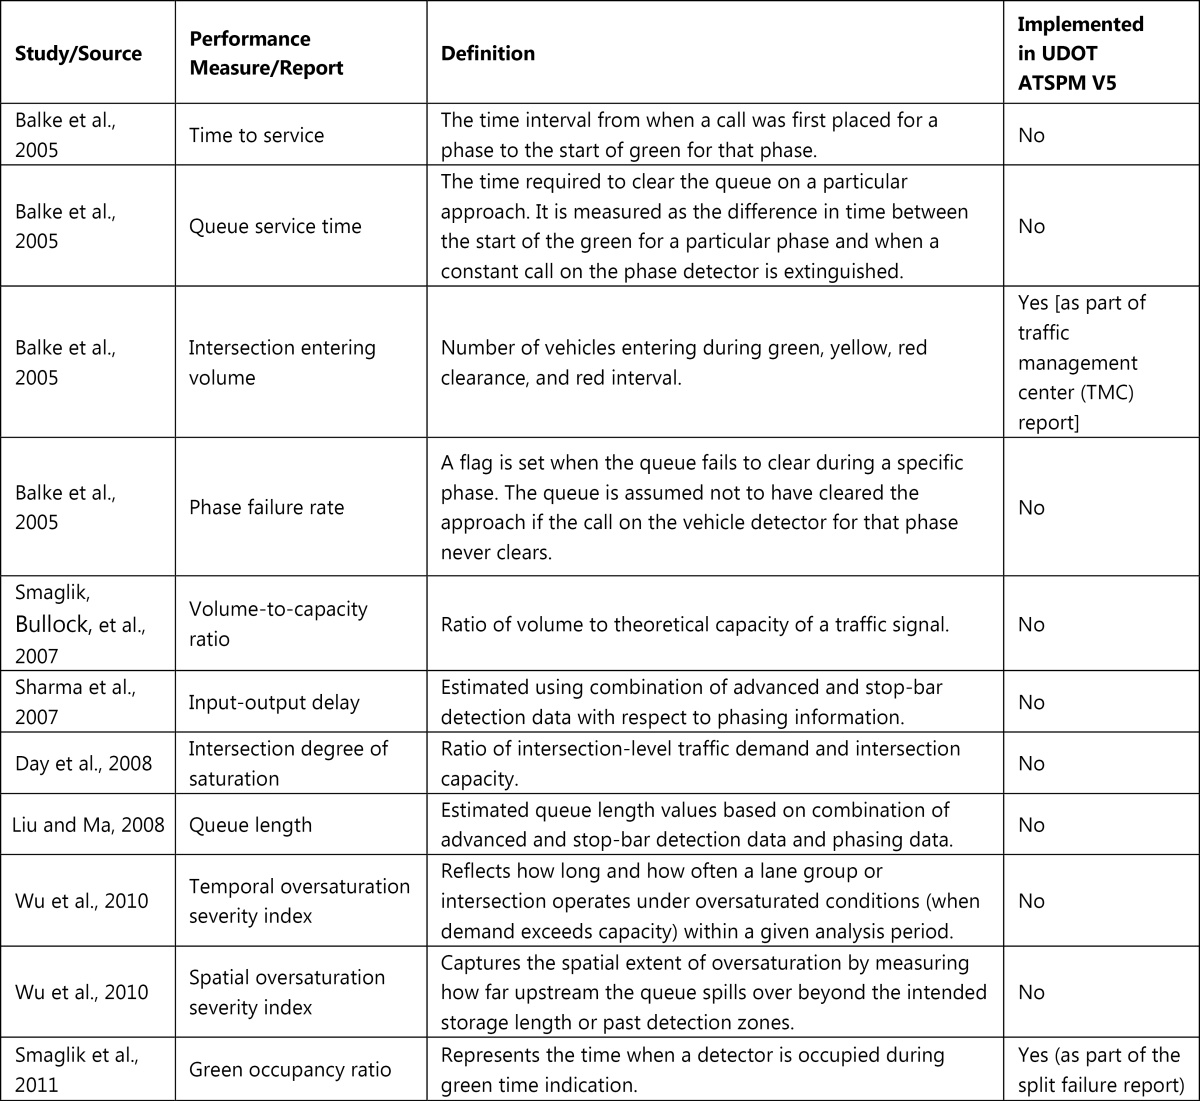
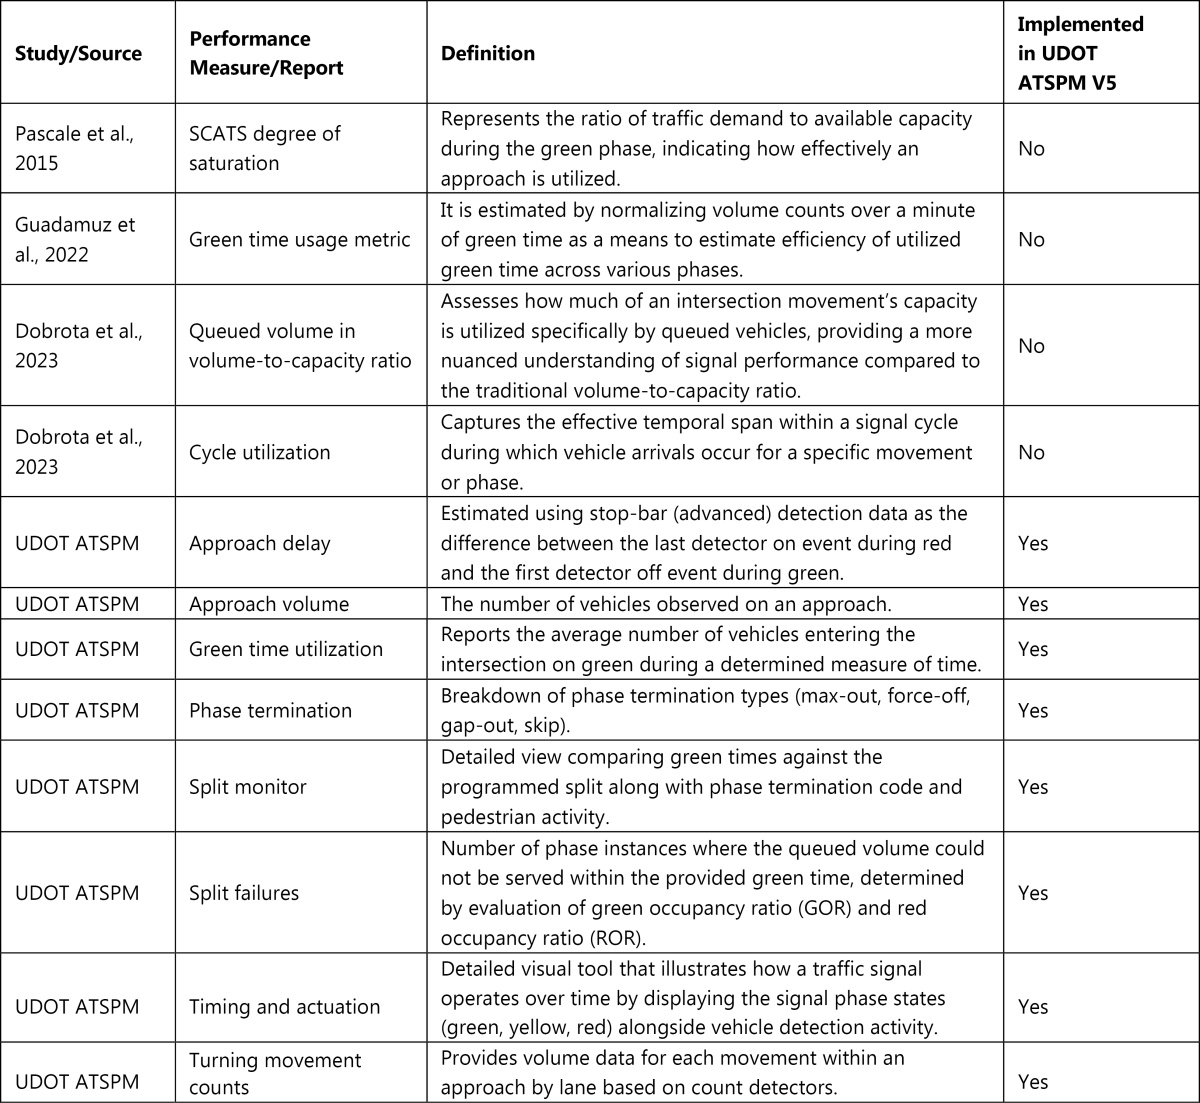
Table 2 summarizes the most relevant performance measures developed to date with a focus on vehicle mobility, including definitions and whether they are incorporated into the UDOT ATSPM platform.
(continued on next page)
Long Description.
The column headers of the table are Study or Source, Performance Measure or Report, Definition, and Implemented in UDOT ATSPM v5. The row headers of the table are Balke et al. 2005, Balke et al. 2005, Balke et al. 2005, Balke et al. 2005, Smaglik et al. 2007, Sharma et al. 2007, Day et al. 2008, Liu et al. 2008, Wu et al. 2010, Wu et al. 2010, Smaglik et al. 2011, Pascale et al. 2015, Guadamuz et al. 2022, Dobrota et al. 2023, Dobrota et al. 2023, UDOT ATSPM, UDOT ATSPM, UDOT ATSPM, UDOT ATSPM, UDOT ATSPM, UDOT ATSPM, UDOT ATSPM, UDOT ATSPM. The data given in the table row-wise are as follows: Row 1: Time to service, The time interval from when a call was first placed for a phase to the start of green for that phase, No. Row 2: Queue service time, the time required to clear the queue on a particular approach. It is measured as the difference in time between the start of the green for a particular phase and when a constant call on the phase detector is extinguished, No. Row 3: Intersection entering volume, Number of vehicles entering during green, yellow, red clearance, and red Interval, Yes (as part of traffic management center (TMC) report). Row 4: Phase failure rate, A flag is set when the queue fails to clear during a specific phase. The queue is assumed not to have cleared the approach if the call on the vehicle detector for that phase never clears, No. Row 5: Volume to capacity ratio, Ratio of volume to theoretical capacity of a traffic signal, No. Row 6: Input-Output delay, Estimated using a combination of advanced and stop bar detection data with respect to phasing information, No. Row 7: Intersection degree of saturation, Ratio of intersection-level traffic demand and intersection capacity, No. Row 8: Queue length, Estimated queue length values based on a combination of advanced and stop-bar detection data and phasing data, No. Row 9: Temporal oversaturation severity index, It reflects how long and how often a lane group or intersection operates under oversaturated conditions (when demand exceeds capacity) within a given analysis period, No. Row 10: Spatial oversaturation severity index, Captures the spatial extent of oversaturation by measuring how far upstream the queue spills over beyond the intended storage length or past detection zones, No. Row 11: Green occupancy ratio, represents the ratio between the time when a detector is occupied during green time indication and green time indication, Yes (as part of the Split Failure report). Row 12: SCATS degree of saturation, represents the ratio of traffic demand to available capacity during the green phase, indicating how effectively an approach is utilized, No. Row 13: Green time usage metric, It is estimated by normalizing volume counts over a minute of green time as a means to estimate efficiency of utilized green time across various phases, No. Row 14: Queued volume in volume to capacity ratio, Assesses how much of an intersection movementʼs capacity is utilized specifically by queued vehicles, providing a more nuanced understanding of signal performance compared to the traditional volume to capacity ratio, No. Row 15: Cycle utilization, Captures the effective temporal span within a signal cycle during which vehicle arrivals occur for a specific movement or phase, No. Row 16: Approach delay, Estimated using stop bar (advanced) detection data as the difference between the last detector on event during red and the first detector off event during green, Yes. Row 17: Approach volume, The number of vehicles observed on an approach, Yes. Row 18: Green time utilization, Reports the average number of vehicles entering the intersection on green during a determined measure of time, Yes. Row 19: Phase termination, Breakdown of phase termination types (max-out, force-off, gap-out, skip), Yes. Row 20: Split monitor, Detailed view comparing green times against the programmed split along with phase termination code and pedestrian activity, Yes. Row 21: Split failures, Number of phase instances where the queued volume could not be served within the provided green time, determined by evaluation of green occupancy ratio (GOR) and red occupancy ratio (ROR), Yes. Row 22: Timing and actuation, Detailed visual tool that illustrates how a traffic signal operates over time by displaying the signal phase states (green, yellow, red) alongside vehicle detection activity, Yes. Row 23: Turning Movement Counts, provides volume data for each movement within an approach by lane based on count detectors, Yes.
Coordinated System Level
A coordinated system reflects the operation of multiple signals functioning together with a common cycle length to provide progression along a corridor. Therefore, performance measurement of such systems should ideally be conducted using a single metric that captures the performance of the entire system. While several system-level measures and graphical tools exist, such as travel time and time–space diagrams, from the perspective of traditional ATSPMs, a multitude of metrics have been developed to assess progression quality or coordinated system quality at the local, intersection level.
Similar to intersection-level performance metrics, early measures related to coordinated systems stemmed from the desire to estimate key metrics introduced in the HCM. For example, Smaglik, Sharma et al. (2007) and Smaglik, Bullock, et al. (2007) estimated the percentage of arrivals on green, arrival type, and platoon ratio. Later, Day and Bullock (2010) introduced tools such as the cyclic flow profile and the PCD. Researchers in Minnesota employed high-resolution data to
estimate arterial travel times, as seen in the work of Liu and Ma (2009), and to generate time–space diagrams with traffic flow visualizations, as demonstrated by Zheng et al. (2014).
Dakic et al. (2017) proposed the average arrivals on green ratio, which incorporates factors such as cycle length, the number of vehicles passing during green, the total number of vehicles on the approach, and the green time, to estimate the percentage of vehicles traversing the intersection per second of green. Stevanovic et al. (2017) introduced two new signal performance measures: movement progression throughput and movement progression index to address the shortcomings of traditional metrics such as percentage of arrivals on green and platoon ratio. More recently, Li et al. (2020) developed a measure based on the bandwidth concept, which considers the duration of green for coordinated movements. They introduced the arrivals in coordination metric, which compares the number of arrivals within a green band to the total arrivals in a cycle. Dobrota (2022) introduced another progression-related measure called movement free-flow efficiency, which assesses the ratio of arrival flow rates during different signal phases, specifically the comparison between free-flowing arrivals during green and arrivals occurring during red.
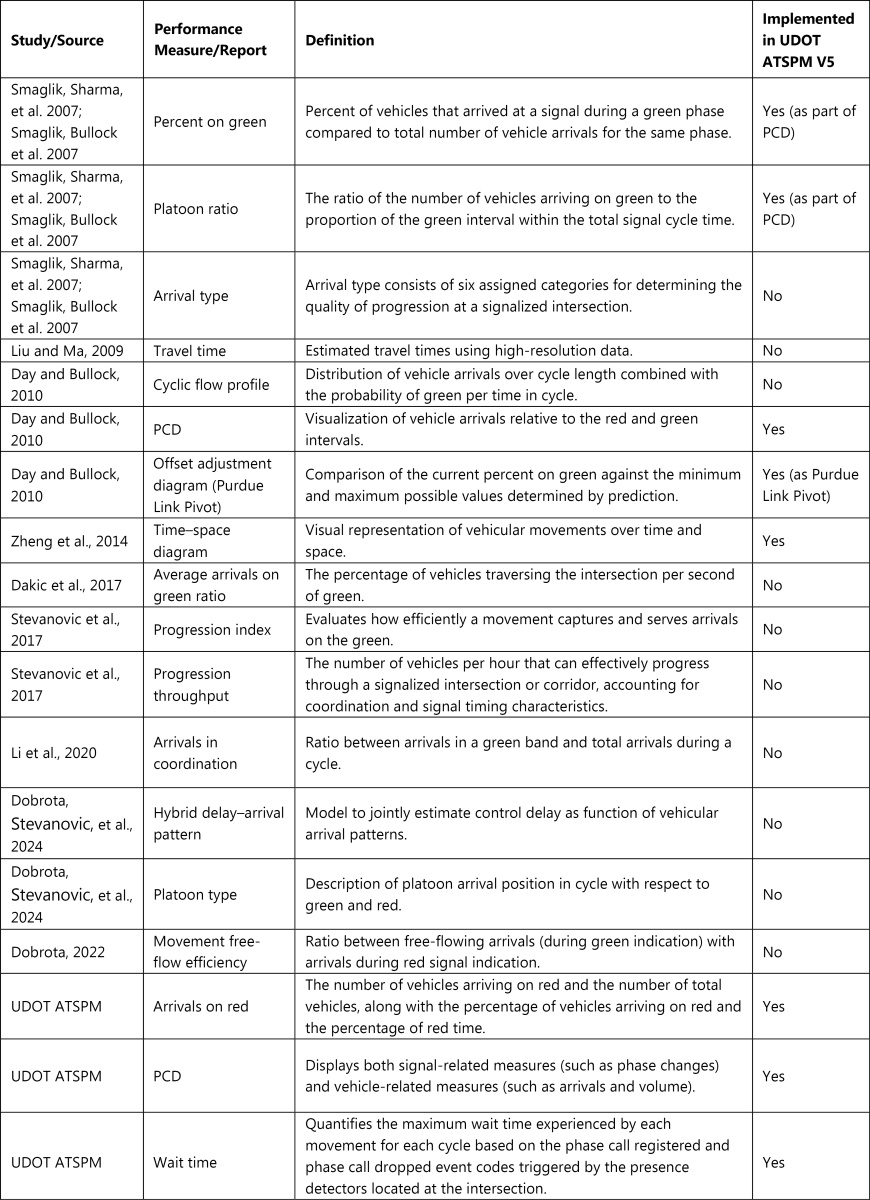
Many of these recent measures serve as calibration tools for the original concepts introduced in the HCM, since those original metrics do not fully account for the complexity of modern signal operations, such as adaptive traffic control, or the detailed variation within a signal cycle, such as the specific timing during the cycle (e.g., queue discharge time). Table 3 summarizes coordinated system-level performance measures.
Overall Network Level
At the network level, the performance of traffic signal systems is typically assessed without the use of aggregate measures that capture system-wide operations. Most traditional ATSPM metrics are reported at a granular level, typically per movement or per intersection, without a standardized method for summarizing them across corridors or regions. This becomes particularly problematic when trying to evaluate long-term trends or compare performance across different seasons or years.
Several studies have explored methods to quantify system-wide performance. Day et al. (2018) introduced a scorecard approach that covered key operational areas such as communication reliability, detector health, capacity allocation, progression, and safety. Communication was evaluated based on the number of online intersections. Detector issues were flagged using heuristics for common errors like missing data or faulty inputs. The remaining aspects were graded using thresholds mapped to letter scores. The overall score for a corridor was determined by the lowest sub-score across all categories.
Schultz et al. (2020) proposed a performance scoring framework that uses four key metrics: platoon ratio, split failures, arrivals on green, and red-light actuations. They applied k-means clustering to define thresholds for each measure and combined the scores using a weighted average. The weights were refined through expert input. For corridor-level aggregation, statistical methods such as mean and median scores were evaluated, with both showing practical utility. Wang et al. (2024) developed a ranking method for intersections based on traditional ATSPM data. They used metrics such as arrivals on green, arrival on coordination, green time percentage, and total vehicle arrivals. After applying min-max normalization, they employed a Pareto front analysis to identify low-performing intersections. The results were validated using probe vehicle and connected vehicle datasets.
Although some ATSPM methodologies have not yet been implemented at scale, several vendors and agencies have developed proprietary or customized approaches to aggregate performance data at the system level. These efforts aim to bridge the gap between highly granular, intersection-level metrics and broader, network-wide insights, enabling more effective performance monitoring, trend analysis, and operational decision-making.
Long Description.
The column headers of the table are Study or Source, Performance Measure or Report, Definition, Implemented in UDOT ATSPM v5. The data given in the table row–wise are as follows: Row 1: Smaglik and Sharma 2007, Smaglik, Bullock et al. 2007: Percent on green, Percent of vehicles that arrived at a signal during a green phase compared to the total number of vehicle arrivals for the same phase, Yes (as part of PCD). Row 2: Smaglik 2007a, 2007b: Platoon ratio, The ratio of the number of vehicles arriving on green to the proportion of the green interval within the total signal cycle time, Yes (as part of PCD). Row 3: Smaglik and Sharma 2007, , Smaglik, Bullock, et al. 2007: Arrival type, Arrival type consists of six assigned categories for determining the quality of progression at a signalized intersection, No. Row 4: Liu and Ma 2009: Travel time, Estimated travel times using high-resolution data, No. Row 5: Day and Bullock 2010: Cyclic flow profile, Distribution of vehicle arrivals over cycle length combined with the probability of green per time in cycle, No. Row 6: Day and Bullock 2010: Purdue Coordination Diagram, Visualization of vehicle arrivals relative to the red and green intervals, Yes. Row 7: Day and Bullock 2010: Offset adjustment diagram (Purdue link pivot), Comparison of the current percent on green against the minimum and maximum possible values determined by prediction, Yes (as Purdue Link Pivot). Row 8: Zheng et al. 2014: Time space diagram, Visual representation of vehicular movements over time and space, Yes. Row 9: Dakic et al. 2017: Average arrivals on green ratio, The percentage of vehicles traversing the intersection per second of green, No. Row 10: Stevanovic et al. 2017: Progression index, Evaluates how efficiently a movement captures and serves arrivals on the green, No. Row 11: Stevanovic et al. 2017: Progression throughput, The number of vehicles per hour that can effectively progress through a signalized intersection or corridor, accounting for coordination and signal timing characteristics, No. Row 12: Li et al. 2020: Arrivals in coordination, Ratio between arrivals in a green band and total arrivals during a cycle, No. Row 13: Dobrota , Stevanovic, et al. 2024: Hybrid delay-arrival pattern, Model to jointly estimate control delay as a function of vehicular arrival patterns, No. Row 14: Dobrota, Stevanovic, et al. 2024: Platoon type, Description of platoon arrival position in cycle with respect to green and red, No. Row 15: Dobrota 2022: Movement free-flow efficiency, Ratio between free-flowing arrivals (during green indication) with arrivals during red signal indication, No. Row 16: UDOT ATSPM: Arrivals on red, The number of vehicles arriving on red and the number of total vehicles, along with the percentage of vehicles arriving on red and the percentage of red time, Yes. Row 17: UDOT ATSPM: Purdue coordination diagram, Displays both signal-related measures (such as phase changes) and vehicle-related measures (such as arrivals and volume), Yes. Row 18: UDOT ATSPM: Wait time, Quantifies the maximum wait time experienced by each movement for each cycle based on the phase call registered and phase call dropped event codes triggered by the presence detectors located at the intersection, Yes.
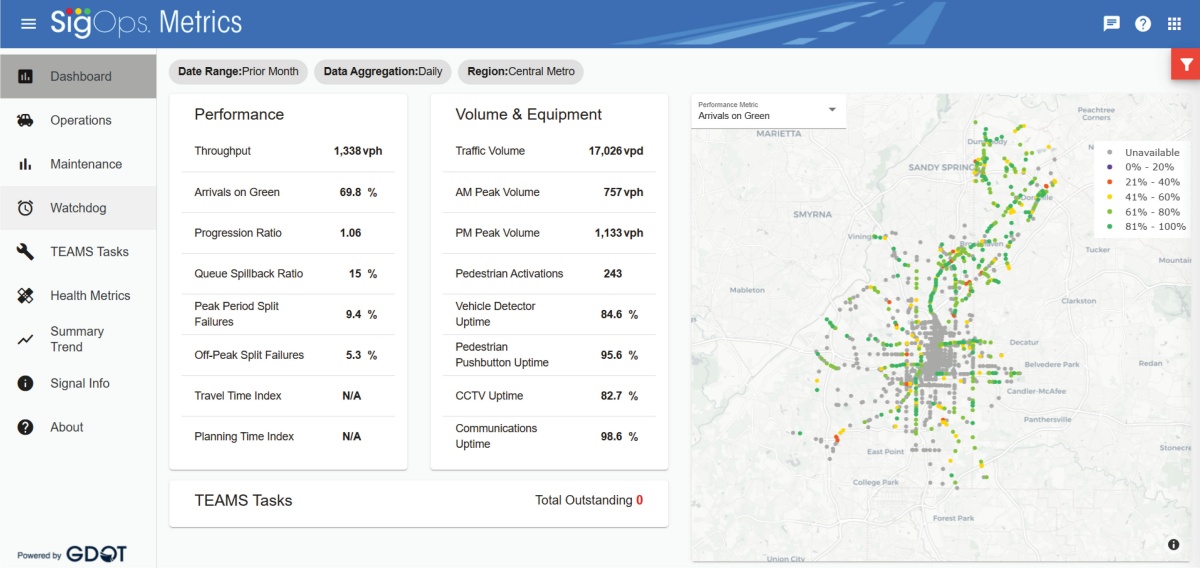
The Georgia Department of Transportation (GDOT) SigOps platform is an example of a system used for comprehensive statewide traffic signal monitoring. Central to this system is MARK 1 (Measurement, Accuracy, and Reliability Kit), an open-source analytics suite developed by GDOT. In addition to high-resolution signal data, MARK 1 incorporates real-time analytics to support the monitoring of arrivals on green, split failures, and corridor travel times, which are not always available in traditional ATSPM implementations. It also integrates features such as anomaly detection (“Watchdog”), closed-circuit television (CCTV) and roadside unite (RSU) uptime tracking, and maintenance ticket monitoring (Kimely-Horn, 2023). Figure 7 shows a screenshot of the dashboard view of the SigOps tool. While such a platform is still not part of the UDOT open-source ATSPM platform, there were plans to integrate it in the next release of Version 5.0 (Taylor and Bassett, 2025).
Multimodal
Assessing multimodal performance at signals through traditional ATSPMs has been explored by researchers, although not as extensively as using them for vehicle mobility. One of the earlier studies in this area examined turning vehicle and pedestrian conflicts using high-resolution data (Hubbard et al., 2008). In this study, the researchers analyzed turning movement flow rate during pedestrian intervals, along with other pedestrian-related performance measures, to assess pedestrian service under different conditions and for different signal timing plans. Day, Premachandra, et al. (2011) investigated pedestrian phase actuations per hour over an 18-month period at a signalized intersection in Indiana to estimate pedestrian volumes. They identified patterns in pedestrian activity based on time of day, day of the week, weather, seasonal effects, special events, and changes to the pedestrian phase configuration.
A number of studies have demonstrated the potential of high-resolution traffic signal data, particularly pedestrian push-button actuations, for accurately estimating pedestrian volumes. Initial studies by Blanc et al. (2015) and Kothuri et al. (2017) validated this concept at a single intersection in Oregon, showing strong correlations between actuations and observed pedestrian counts and developing adjustment factors for volume estimation. Singleton et al. (2020) expanded the scale of analysis using 1 year of data across 90 intersections in Utah, introducing multiple models and activity metrics to estimate pedestrian volumes with low error rates. This methodology was later extended to unsignalized intersections using statistical modeling based on signalized location characteristics (Singleton et al., 2021). Li and Wu (2021) focused on mid-block crossings, modeling pedestrian arrivals as a Poisson process and using maximum likelihood estimation to account for multiple actuations and noncompliant crossings. Most recently, Kothuri et al. (2024) evaluated several statistical models across 65 intersections in Oregon and identified a quadratic model as the most effective approach for estimating pedestrian volumes using various high-resolution data variables.
Pedestrian delay was introduced as a measure and included in the UDOT ATSPM open-source software. This measure represents the time between when a pedestrian button is pushed and when the pedestrian phase is served (Taylor, 2016), which represents an upper bound on pedestrian delay because it estimates the delay for the first pedestrian since some pedestrians may arrive later in the red period (and therefore experience lower delay) or arrive during the walk internal. Long estimated pedestrian delays may indicate locations where crossing against the pedestrian indication is more likely, although this has not been substantiated by field observation. Karimpour et al. (2022) proposed a finite-mixture modeling method to estimate pedestrian delay at signalized intersections using high-resolution event-based data from smart sensors. This method addresses the limitations of traditional methods, such as in the HCM, that rely on uniform pedestrian arrival assumptions. Applied to four intersections in Pima County, Arizona, the model demonstrated strong accuracy, with average errors of 10 and 13 seconds for mean absolute error and root mean square error, respectively, and outperformed three conventional delay-estimation methods.
Long Description.
The dashboard image displays SigOps Metrics for the Central Metro region. It includes performance metrics such as throughput at 1,338 vehicles per hour, arrivals on green at 69.8 percent, and a progression ratio of 1.06. Volume and equipment data show traffic volume at 17,026 vehicles per day, with AM and PM peak volumes at 757 and 1,133 vehicles per day, respectively. Pedestrian activations are 243, and detector uptime is 84.6 percent. The map on the right visualizes traffic signal availability with color-coded indicators, ranging from unavailable to 81 to 100 percent availability.
Feng et al. (2015) evaluated traffic signal priority (TSP) effectiveness in Portland, Oregon, using SCATS, TSP logs, probe vehicle data, and automated passenger counts. They proposed performance measures including TSP frequency, response type (early green or green extension), response timeliness, and effectiveness in terms of passenger time savings and non-transit travel time impacts. Jackson et al. (2024) used high-resolution data to assess TSP at a Boston intersection serving two bus routes. Measures included the number of priority requests, approvals or rejections, bus travel time, delay at red lights, and arrivals on green. These were derived from detectors and phase events, with check-in and check-out detectors used to calculate travel times. Visual tools were also employed to analyze TSP operations in detail.
More recently, Cesme et al. (2023; 2025) advanced multimodal signal timing design and evaluation. In 2023, they introduced a signal retiming framework using multimodal measures such as vehicle delay, crosswalk delay, crossing stress, and bus delay. Although not initially based on high-resolution data, the framework was designed for future adaptation. In 2025, they evaluated a next-generation, cloud-based TSP system that used machine learning to estimate bus arrival times up to 2 minutes in advance (Cesme et al., 2025). As part of that study, they estimated first bicycle delay and first pedestrian delay using high-resolution data. Bicycle delay was defined as the time from the first bike detection during a red signal to the start of the next green. Table 4 summarizes relevant performance measures developed to date.

Long Description.
The column headers of the table are Study or Source, Performance Measure or Report, Definition, and Implemented in UDOT ATSPM v5. The data given in the table row–wise are as follows: Row 1: Day et al. 2010: Pedestrian volumes, The number of pedestrians as determined from either pedestrian button pushes or pedestrian detector data where available, Yes. Row 2: Hubbard et al. 2008: Estimated pedestrian conflicts, The amount of right-turn traffic conflicting with a pedestrian movement, No. Row 3: Mackey 2016: Priority details, A view of priority request events showing the time of the priority request and time to service, Yes. Row 4: Jackson et al. 2024: Bus arrivals on green, Number of buses that arrived during signal green indication, No. Row 5: Jackson et al. 2024: Bus travel time, Time difference between the check-in timestamp at the upstream detector zone and the check-out timestamp at the stop bar detector zone, No. Row 6: Jackson et al. 2024: Bus delay on red, Delay on red is determined based on the number of seconds of delay for a bus at a red signal phase after priority is granted, No. Row 7: Jackson et al. 2024: Number of received or approved or rejected TSP requests, Number of TSP requests that were received, approved, or rejected during period of observation, No. Row 8: Cesme et al. 2025: Bicycle delay, The time interval from when a call was first placed for a phase to the start of green for that phase, No. Row 9: UDOT ATSPM: Pedestrian phase actuation and service, A visualization similar to the Purdue Coordination Diagram that shows the pedestrian detector or button actuation time relative to the pedestrian phase times, Yes. Row 10: UDOT ATSPM: Estimated pedestrian delay, The time between pedestrian button actuation and start of Walk, Yes.
Safety
While traditional traffic signal safety research is extensive, the use of high-resolution signal data for evaluating safety outcomes is relatively recent. Only a limited number of studies have explicitly investigated their impact on safety; nevertheless, growing interest in using traditional ATSPMs for proactive safety management has led to the development of novel methodologies and performance indicators.
One of the earliest applications of high-resolution signal data for safety analysis was by Lu et al. (2015), who evaluated yellow-light running (YLR) behavior using 8 months of detector data from a signalized intersection in Minnesota. The study identified over 30,000 YLR events and classified them based on driver position during the onset of yellow (e.g., “should-go zone,” “should-stop zone,” “dilemma zone”). The results showed that most drivers made appropriate decisions, but approximately 2.5% ran through the intersection during the yellow when they should have stopped. Factors such as higher approach speeds and adverse weather conditions (e.g., snow) significantly increased YLR frequency. A regression analysis demonstrated a strong correlation between traffic volume and YLR events (R² = 0.953).
Lavrenz et al. (2016a) used high-resolution controller data to estimate red-light-running (RLR) occurrences and evaluate the effect of split changes. Their methodology flagged vehicles as RLR if the stop-bar detector was activated and deactivated after the red interval began, indicating the arrival and departure of a vehicle during red. The method was validated with field video, and results showed that increasing the green split on the side street from 20% to 24% of the cycle reduced average RLR rates by approximately 34%. This work laid the foundation for estimating RLR using traditional ATSPM reports like the yellow and red actuation chart.
In 2016, Robertson examined how the use of pedestrian actuation at signalized intersections in the city of College Station, Texas, could improve pedestrian safety (Robertson, 2016). The study analyzed the number of pedestrian actuations throughout the day to develop several pedestrian treatment strategies. It was found that between 7 a.m. and 7 p.m., 87% of signal cycles included pedestrian calls. This observation supported the development of strategies such as a pedestrian-only phase and protected-only left turns, which were projected to reduce the expected number of crashes by 73%.
Chen et al. (2017) examined RLR frequency at five intersections in Minneapolis using loop detector data. The study found that RLR was more likely to occur during peak weekday periods with high demand and long cycle lengths. Vehicles traveling in short headways during phase changes were also more prone to violations. The study used both stop-bar and exit detectors to estimate vehicle speed, which enhanced RLR estimation accuracy. Essa and Sayed (2019) developed conflict-based safety performance functions (SPFs) at signalized intersections using high-resolution cycle-by-cycle data. The study used metrics such as platoon ratio, queue length, and shockwave speed and area, and conflict indicators like time to collision (TTC), modified TTC, and deceleration rate to avoid crash (DRAC). The results indicated that the highest conflict severity occurred during the first third of the red interval, likely due to dilemma zone conditions. Furthermore, conflict severity was inversely correlated with platoon ratio, suggesting that improved coordination reduces conflict risk.
Kidando et al. (2021) analyzed crash injury severity using real-time event-based detection data and crash records from 22 intersections in Tallahassee, Florida. Data from the 15 minutes prior to each crash were used to model risk factors. The study found that injury severity was higher at intersections with low delays (due to increased speeding and potential red-light violations) and that left-turn split failures were more strongly associated with injury-involved crashes than through-movement failures. Yuan et al. (2020) developed cycle-level crash risk models using high-resolution data, weather, and crash records. The study analyzed signal timing
variables (green duration, cycle length, green ratio), traffic progression (platoon ratio), shockwave characteristics (queue length, shockwave speed and area), and traffic variation (occupancy and headway deviation). The results showed that longer cycles and lower green ratios increased crash risk, and that higher arrivals on yellow were correlated with crash occurrence, which reinforced earlier findings by Lu et al. (2015).
Kabir et al. (2021) linked signal performance with crash frequency using data from 121 intersections in Columbus, Ohio. The study used ATSPM-based measures such as percent arrivals on green (POG) and level of travel time reliability (LOTTR), in conjunction with roadway and traffic variables. Findings indicated that a 1% increase in POG was associated with a 1.12% reduction in total crashes, suggesting that improved progression can enhance safety outcomes. Li et al. (2021) extended earlier work by Yuan et al. (2020) by developing real-time crash risk prediction models using high-resolution cycle-level data and weather information. Crashes were aligned with abnormal detection patterns to estimate time of occurrence. The study confirmed that high shockwave speeds, longer queues, low green ratios, and greater detector variability increased crash risk. Arrivals on yellow again emerged as a key contributing factor. A recent addition to the UDOT open-source ATSPM software is the left-turn gap analysis tool, which evaluates the distribution of gaps in opposing traffic for permitted left-turn movements (Bassett et al., 2022). This measure uses stop-bar detection in a lane-by-lane configuration.
Railroad preemption performance was explored, both from the perspective of safety and operations, by Brennan et al. (2009; 2010). The authors used detailed visual examination of event logs and calculations based on event times. These early measures closely resemble those later incorporated into the open-source ATSPM software. Chou and Nichols (2016) applied high-resolution data to evaluate emergency vehicle preemption using a “signal phase spectrum” plot, which visualizes phase states, detector actuations, and coordination events. From these visualizations, key metrics such as preemption duration, transition duration, and total interruption time of normal operations were derived.
At the time of this writing, NCHRP Project 17-109, “Crash Modification Factors for Automated Traffic Signal Performance Measures,” was developing Crash Modification Factors (CMFs) for ATSPMs (NCHRP Research Report 1170, anticipated in 2026). This effort is expected to offer formal methodologies for quantifying the safety impacts of ATSPM deployment and provide guidance for integrating safety-focused performance measures into agency workflows. Table 5 shows safety-related traffic signal performance measures along with definitions and integration status with respect to UDOT open-source ATSPM software Version 5.0.
Benefits and Costs
The economic efficiency of deployment of traditional ATSPMs can be investigated by using a benefit–cost analysis. Costs associated with deployments of traditional ATSPMs can range from malfunctioning detector replacement to improvement in communication media, upgrades of traffic signal controllers, and changes in signal timings, while benefits result from overall improved traffic operations quantified either through mobility or safety measures. Figure 8 summarizes the identified benefits and costs associated with traditional ATSPMs.
Traditional ATSPMs enable active management of traffic signals, and several studies have quantified the benefits of signal timing adjustments that use high-resolution data. Day, Brennan, et al. (2011) evaluated offset optimization on an eight-signal arterial corridor and estimated annual user cost savings and environmental benefits of approximately $470,000. Lavrenz et al. (2016b) conducted a 5-year corridor study, applying retiming every 2 to 3 years amid a 36% volume increase, resulting in a 41% rise in vehicles arriving on green, a 5% travel time reduction, a net present

Long Description.
The column headers of the table are Study or Source, Performance Measure or Report, Definition, and Implemented in UDOT ATSPM v5. The data given in the table row-wise are as follows: Row 1: Brennan et al. 2009: Preemption details, A view of preemption instances showing latency, track clearance green, and dwell time, along with detector presence, Yes. Row 2: Lu et al. 2015: Yellow light running, Frequency and conditions under which vehicles enter the intersection during the yellow interval, Yes (as part of the yellow and red actuation report). Row 3: Lavrenz et al. 2016: Yellow and red actuations, Visualization of stop bar detector actuations relative to change and clearance intervals on the relevant phase, including time after the start of the next phase green, Yes. Row 4: Essa and Sayed 2019: Conflict-based safety performance functions, Safety functions based on surrogate conflict measures (e.g., Time to Collision, Deceleration), No. Row 5: Yuan et al. 2020: Real-time crash risk (cycle-level), Crash likelihood models based on high-resolution cycle data and signal timing characteristics, No. Row 6: Bassett et al. 2022: Left turn gap analysis, Distribution of gaps in opposing traffic for permitted left turns, Yes.

Long Description.
Costs include controller procurement, firmware upgrades, external data collection, communications system investments, communication system maintenance, detection system investments, detector system maintenance, detector reconfiguration, detector documentation, new server procurement, server maintenance, software license, software installation, maintenance or troubleshooting, business process integration, and the active use of ATSPMs. Benefits cover replacing manual data collection, avoiding unnecessary retiming and maintenance activities, reduce response time to public service calls, value of performance documentation, fix failed detectors, fix broken communication, fix equipment failures, improving inefficient green distribution, improve poor coordination, resolve pedestrian issues, resolve preemption issues, and improve safety.
value of $3.7 million, and a benefit–cost ratio of 52. Li et al. (2015) assessed clock synchronization and offset optimization, finding $423,000 in annual benefits from minor adjustments and $2.99 million from improved progression. Lavrenz et al. (2017) analyzed detector repairs on US 421 in Indiana and estimated up to $300,000 in annual savings and a benefit–cost ratio as high as 226. Replacing seven amplifiers led to approximately $900,000 in user benefits, with a 1-year benefit–cost ratio ranging from 75 to 680.
Following these studies, in 2018 the FHWA commissioned a benefit–cost study on ATSPMs with two goals (Day et al., 2020). The first goal was to develop a methodology for estimating costs and benefits, which was intended to be flexible enough to permit analysts to determine
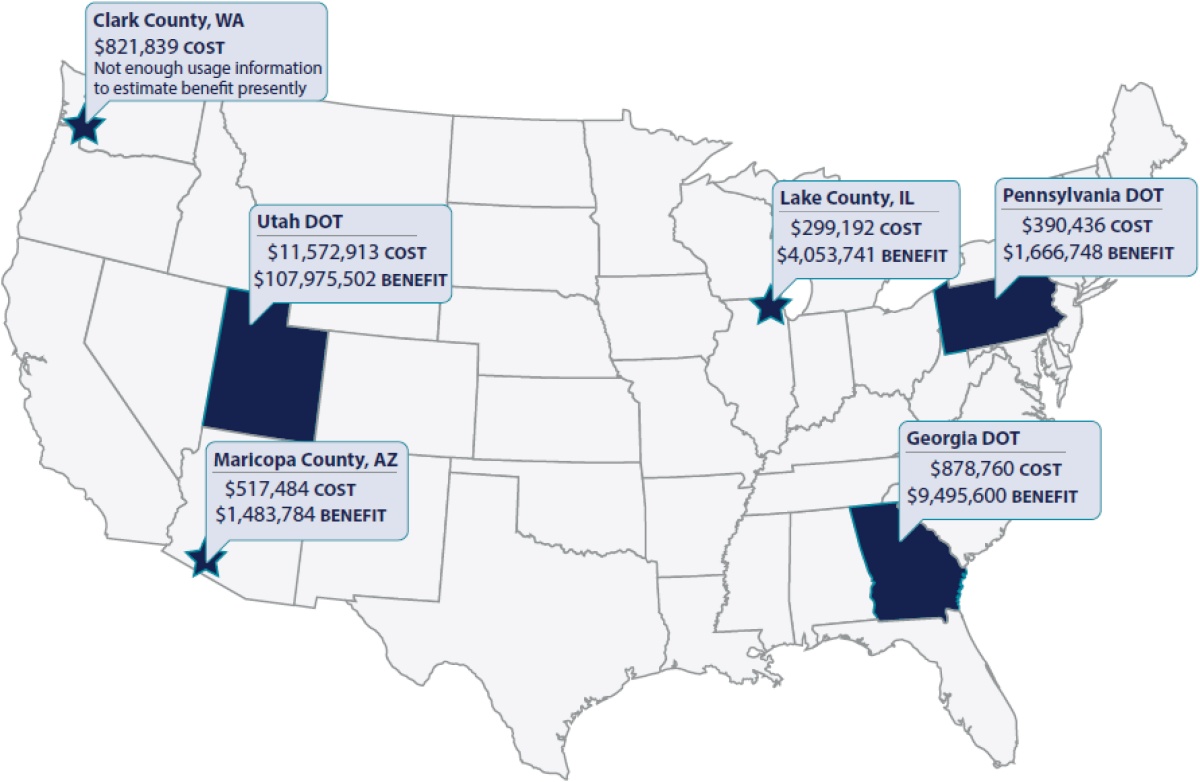
certain cost and benefit elements to include based on their system. The research also conducted case studies with six different agencies that were using traditional ATSPMs with different levels of deployment at the time. The agencies were three state DOTs (UDOT, GDOT, and Pennsylvania DOT) and three local agencies (in Lake County, IL; Clark County, WA; and Maricopa County, AZ). Among other findings, it was determined that UDOTʼs investment in traditional ATSPMs, including development of the open-source software, had cost about $11.6 million but had yielded $108 million in benefits. The implementation cost for other agencies was much lower since they were able to leverage the previously developed ATSPM systems. For example, GDOT was estimated to have spent about $880,000 but received a benefit of about $9.5 million. More details on each case study, costs, and benefits associated with deployment of traditional ATSPMs and operations can be found in the original study (Day et al., 2020). Figure 9 shows overall costs and benefits estimated for the participating agencies.
Integration into Agency Business
From the inception of traditional ATSPMs to their streamlined use by agencies, an important process for ensuring the success of deployment of traditional ATSPMs is integration into agency business. One of the first studies that provided guidance on how to integrate traffic signal performance measures within agency operations was authored by researchers from Purdue University (Day, Bullock, et al., 2015). In their work, they outlined the following integration objectives:
- Reliability of field infrastructure
- Minimization and balancing of congestion
Long Description.
The map of the United States highlights specific counties with Department of Transportation projects. Clark County, Washington, shows a cost of 821,839 dollars, with not enough usage information to estimate the benefit presently. Utah Department of Transportation reports a cost of 11,572,913 dollars and a benefit of 107,975,502 dollars. Maricopa County, Arizona, has a cost of 517,484 dollars and a benefit of 1,483,784 dollars. Lake County, Illinois, shows a cost of 299,192 dollars and a benefit of 4,053,741 dollars. The Georgia Department of Transportation reports a cost of 878,760 dollars and a benefit of 9,495,600 dollars. Pennsylvania Department of Transportation indicates a cost of 390,436 dollars and a benefit of 1,666,748 dollars.
- Smooth traffic flow
- Consistent and predictable response
- Signal timing versatility
The authors paired each of the identified objectives with relevant traffic signal performance measures that can be used to achieve desired objectives. In addition, the authors identified the main audience for each operational objective (e.g., engineers, technicians, vendors, consultants, administrators, and users).
In 2017, traditional ATSPMs were selected as a focus technology for the fourth round of the FHWA Every Day Counts program. This program included a series of 17 workshops hosted in 15 different states in 2017 through 2019 (Lattimer and America, 2020). These workshops included some discussion of use cases for traditional ATSPMs and described methods to integrate them into agency processes. One of the main talking points in these workshops was the importance of understanding the objectives of the operation, and another was the use of performance measures as a means of evaluating the degree to which those objectives are being attained. The use of performance measures for evaluating objectives also relates to the GcOST (goals, context, objectives, strategies, and tactics) framework developed by the FHWA Resource Center personnel in the 2010s, as outlined in Figure 10.
NCHRP Research Report 954: Performance-Based Management of Traffic Signals developed a roadmap for implementing signal performance measures within transportation agencies (Nevers et al., 2020). It presents a comprehensive view of these measures, including their benefits, the roles of various stakeholders, required hardware and software, and process for implementation, validation, and application. The report included:
- A “roadmap to performance measures” outlining the steps needed for successful implementation;
- Information about selection of performance measures based on available system components;
- A listing of 26 different performance measures as well as descriptions and examples;
- Information about system needs such as detection and communication requirements;
- A guide to the configuration, verification, and validation of ATSPM systems; and
- Strategies to integrate signal performance measures into agency management practices.
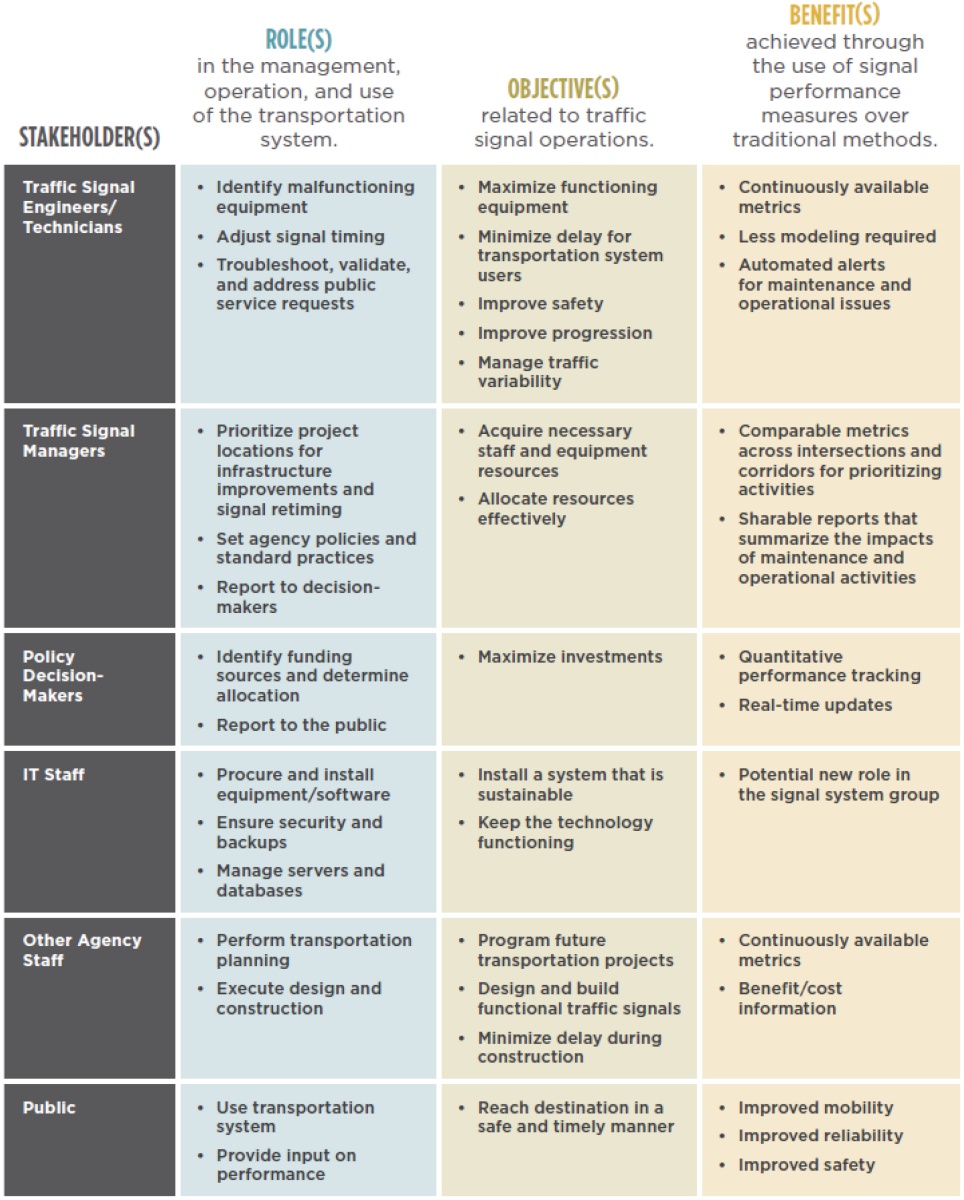
Figure 11 shows various stakeholder roles, objectives, and signal performance measures discussed in NCHRP Research Report 954 (Nevers et al., 2020). To integrate these measures into agency business processes, the report emphasizes the importance of starting with a traffic signal management plan (TSMP). ATSPMs help agencies attract resources by demonstrating system needs, prioritizing activities, and defining the concept of a “basic service” as it relates to traffic signal

Long Description.
The illustration represents a hierarchical structure starting with goals at the top, indicating the desired end state. Below are context, objectives, strategies, and tactics, each level detailing its role. Context involves the physical or operational situation affecting choices. Objectives are what must be attained by agency programs. Strategies are programs that will attain objectives, and tactics are day-to-day decisions that carry out strategies. An arrow labeled ‘Performance Measures’ points from tactics to objectives, indicating the influence of performance measures across all levels.
Long Description.
The chart outlines roles, objectives, and benefits for various stakeholders in transportation system management. Stakeholders include Traffic Signal Engineers or Technicians, Traffic Signal Managers, Policy Decision-Makers, IT Staff, Other Agency Staff, and the Public. Each stakeholder group has specific The roles in the management, operation, and use of the transportation system are to identify malfunctioning equipment, adjust signal timing, troubleshoot, validate, and address public service requests, prioritize project locations for infrastructure improvements and signal retiming, set agency policies and standards, report to decision-makers, identify funding sources and determine allocation, report to the public, procure and install equipment or software, ensure security and backups, manage servers and databases, perform transportation planning, execute design and construction, use transportation system, and provide input on performance. The objectives related to traffic signal operations are to maximize functioning equipment, minimize delay for transportation system users, improve safety, improve progression, manage traffic variability, acquire necessary staff and equipment resources, allocate resources effectively, maximize investments, install a system that is sustainable, keep the technology functioning, program future transportation projects, design and build functional traffic signals, minimize delay during construction, and reach destination in a safe and timely manner. The benefits achieved through the use of signal performance measures over traditional methods are continuously available metrics, less modeling required, automated alerts for maintenance and operational issues, comparable metrics across intersections and corridors for prioritizing activities, sharable reports that summarize the impacts of maintenance and operational activities, quantitative performance tracking, real-time updates, potential new role in the signal system group, continuously available information, benefit or cost information, improved mobility, improved reliability, and improved safety.
operations. Additional information on basic service models can be found in Denney and Olsen (2013). Once agencies have created their TSMP, they can use signal performance measures to:
- Identify how well they are meeting expectations,
- Determine where they need to invest in the traffic signal system, and
- Communicate this information to policymakers and elected officials.
A UDOT use case examples report (Seegmiller et al., 2020) addresses the integration of performance measures into traffic signal operations and management through the UDOT open-source ATSPM software. This document is divided into two main sections: signal system monitoring and signal coordination. It covers specific use cases such as alerts management (e.g., max outs, skipped phases), controller diagnostics, pedestrian delay analysis, and progression evaluation. Case studies from agencies in Salt Lake City, Georgia, and Pennsylvania demonstrate the practical application
of traditional ATSPMs for enhancing mobility, safety, and system efficiency. For instance, Figure 12 shows how Pennsylvania DOT used the split failure report to support time-of-day scheduling that aligns better with traffic demand. By offering actionable methods and real-world examples, the report serves as a technical reference for agencies transitioning to performance-based traffic signal management.
Several manuals and documents have been developed to support the deployment, configuration, and operational use of ATSPM systems, particularly through UDOT and its partners, that are hosted at the UDOT open-source website. The UDOT ATSPM User Case Manual (Pinetop Engineering, 2020) serves as a practical guide that illustrates how high-resolution ATSPM data can be used for signal diagnostics and coordination improvements using tools like Purdue charts and pedestrian delay metrics. The ATSPM Component Details Manual (Atkins North America, 2025a) provides detailed guidance on system features, performance measures, chart types, and administrative functions within the ATSPM web platform. The ATSPM Reporting Details Manual (Atkins North America, 2025b) explains how to interpret and apply graphical and tabular ATSPM reports, making it a valuable tool for operational analysis and diagnostics.
Since 2022, the National Highway Institute (NHI) has been offering a two-part training series on traditional ATSPMs that is aimed at signal engineers and operators. The introductory web-based course (FHWA-NHI-133129) provides foundational knowledge on traditional ATSPM

Long Description.
The graph titled ‘ATSPM: Split Failure’ displays occupancy percentage on the y-axis and time from 12 AM to 3 PM on the x-axis. It includes multiple colored lines representing different plans, with a suggestion to start Plan 4 earlier than 7:15 AM. The graph is dated 9.13.2018 and includes a clock image showing 10:10. Key data points indicate varying occupancy levels throughout the day, with notable changes around early morning hours.
concepts, including data collection, system configurations, performance measure generation, and real-world applications to support performance-based traffic signal management. The follow-up course (FHWA-NHI-133130) builds on this foundation by focusing on practical applications such as using traditional ATSPM tools to evaluate signal operations, validate objectives, and integrate them into daily agency practices. Together, these courses provide in-depth educational material for signal engineers and traffic operators who do not have prior knowledge of traditional ATSPMs, and they provide context for more advanced users and stakeholders. The courses also include discussions about integration into agency business.
Sunkari and Chaudhary (2023) developed a guidelines document for the implementation of a statewide ATSPM system for Texas DOT. The authors provide detailed functional and technical requirements to support the development of formal specifications to procure an ATSPM system. The guidelines discuss identifying champions in the agency who will encourage the use of the system; assess the available resources, which include infrastructure, personnel, and financial resources; suggest prioritization of available resources to maximize the benefits of an ATSPM system; and finally recommend a step-by-step strategy to implement and operate the system.
Lastly, in addition to relevant documentation and course materials on integrating traditional ATSPMs into agency operations, in 2017 the FHWA began hosting a series of recurring online webinars and meetings known as ATSPM monthly calls. These calls cover a wide range of topics related to signal performance measurement and help agencies adopt and improve traditional ATSPM practices. A listing of the topics of calls archived since 2022 can be found on GitHub (FHWA, 2025). These calls have featured numerous presenters reporting on different use cases for traditional ATSPMs, advanced and related applications, and uses of emerging data types and concepts. A summary of ATSPM monthly calls is available in Appendix D.
Crowdsourced ATSPMs
Crowdsourced data on vehicle position and speed began to be used in research and practice about two decades ago. Early sources included GPS applications, freight and commercial vehicle fleets, and cellular phones. Using speed and location data, vehicle travel times along mapped segments were recorded and aggregated in minute or multi-minute intervals (Remias et al., 2013). At that time, two main limitations of crowdsourced data for traffic signal performance measurement compared to traditional ATSPMs were low temporal resolution and limited penetration rates. Despite these limitations, crowdsourced data attracted interest because it provided measurements of delay, travel time, and travel time reliability—metrics that can be estimated without requiring physical field infrastructure (Day et al., 2015; Mathew et al., 2017). Over the years, improvements in cellular devices and data-collection methods have increased the quality of crowdsourced datasets. Third-party providers began offering data with higher spatial and temporal resolution. Beyond corridor travel-time estimation, bottleneck identification also became possible (FHWA, 2020). The development of third-party CV data further increased data granularity. The Pooled Fund Study TPF-5(377), launched in 2018, built upon previous probe data work using high-resolution vehicle trajectory data (Day, Remias, et al., 2015; Mathew et al., 2017). Subsequent studies applied CV data to enhance traffic signal performance reporting through new visualizations such as the Purdue Probe Diagram (PPD; Saldivar-Carranza, Li, Mathew, et al., 2021), turning movement counts (Saldivar-Carranza, Li, and Bullock, 2021), and corridor travel times and system-level performance analysis (Saldivar-Carranza, Li, Mathew, Gayen, et al., 2023).
The increasing use of cloud-based analytics platforms has further supported the use of crowdsourced data for traffic signal performance measurement. These tools integrate probe data feeds
to generate dashboards, trends, and corridor-level summaries designed for agency use. Pilot deployments have shown that these platforms can complement traditional ATSPMs or serve independently where physical infrastructure is unavailable or impractical (INRIX, 2025). Multiple vendors now offer products combining traditional and crowdsourced ATSPM data. Some agencies, such as Oregon DOT (ODOT), have developed custom tools based on third-party crowdsourced data (ODOT, 2024). These platforms reduce the need for major hardware investments or specialized in-house expertise and increase accessibility for agencies with limited resources. However, crowdsourced ATSPMs have limitations. They do not provide direct insight into signal timing details, infrastructure health, or nonmotorized user movements. Phase-level performance analysis, detector fault identification, and pedestrian delay estimation remain areas addressed primarily by traditional ATSPMs. Additionally, as noted earlier, penetration rate may remain a concern for certain intersections or agencies.
Crowdsource-Based Performance Measures
Many studies have focused on crowdsourced data and their use in traffic signal systems. This section focuses on some of the relevant studies that have evaluated the performance of traffic signal systems.
One of the earliest studies was conducted by Day et al. (2014), where corridor vehicle travel times and reliability measures such as travel time index were estimated. Mathew et al. (2017) introduced additional reliability performance measures based on probe data (e.g., normalized interquartile range). In their 2020 study, researchers from Michigan used vehicle location data from three locations in Michigan to estimate arrivals on green, which had previously only been estimated with high-resolution data (Waddell et al., 2020a). This study showed that with proper aggregation of low-penetration-probe data, arrivals on green could be estimated (Waddell et al., 2020a). In a follow-up study, the authors showed that vehicular delays could be reliably estimated using the same probe-vehicle data (Waddell et al., 2020b).
Wang (2020) proposed several performance measures to quantify arterial-wide performance, such as attainability of ideal progression (AIP) and attainability of user satisfaction (AUS). The AIP represents the ratio of average realized speed and designed progression speed. The AUS describes the probability that travelers would rate the quality of arterial signal timing as the best. The AUS considers stop characteristics (i.e., number of stops along the corridor and duration of each stop) and, for optimal user satisfaction, specifies that “vehicles make no stops at any of the signals involved in the evaluation” (Wang, 2020). In addition, based on these measures, the signal performance index (SPI) was introduced to estimate which intersections are good candidates for retiming (Tian et al., 2020; Yue et al., 2021).
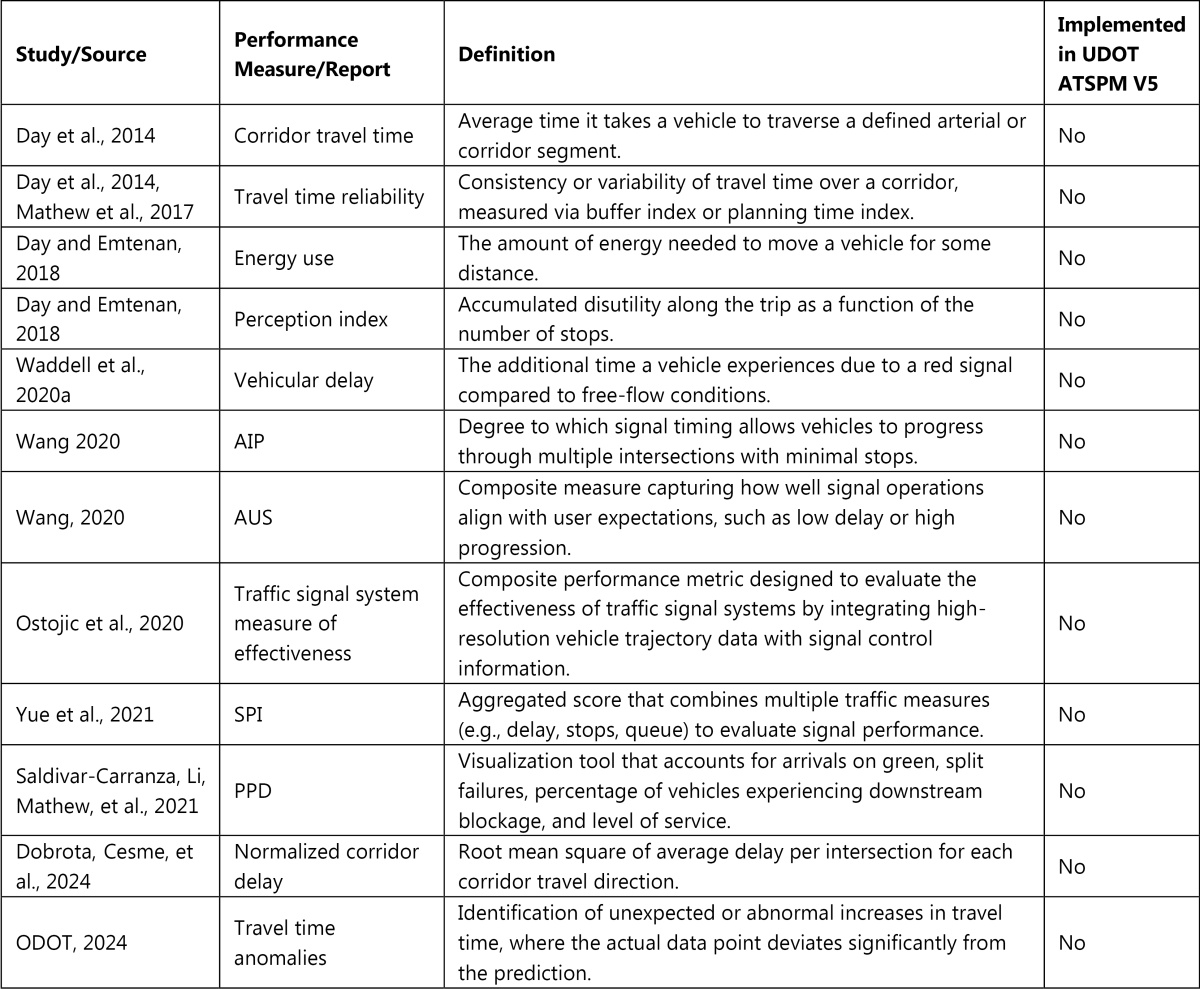
Ostojic et al. (2020) introduced a composite performance metric designed to evaluate the effectiveness of traffic signal systems by integrating high-resolution vehicle trajectory data with signal control information. The proposed composite measure accounts for utilization of green time and space by accounting for observed demand patterns, quality of progression, green time efficiency, and impact of oversaturation. Saldivar-Carranza, Li, Mathew, et al. (2021) introduced the PPD using commercially available CV data. The PPD is a graphical tool that shows arrivals on green, split failures, percentage of vehicles experiencing downstream blockage, and level of service. Dobrota, Cesme, et al. (2024) introduced normalized corridor delay metrics that report on root mean square of average delay per intersection for each corridor travel direction using crowdsourced data (Dobrota, Cesme, et al., 2024). Lastly, ODOT proposed a travel time anomalies detection method based on Z-score and GEH score statistics between predicted and actual travel time (ODOT, 2024). Table 6 shows some of the crowdsourced ATSPMs developed to date.
Long Description.
The column headers of the table are Study or Source, Performance Measure or Report, Definition, and Implemented in UDOT ATSPM v5. The data given in the table row-wise are as follows: Row 1: Day et al. 2015: Corridor Travel Time, Average time it takes a vehicle to traverse a defined arterial or corridor segment, No. Row 2: Day et al. 2015, Mathew et al. 2017: Travel Time Reliability, Consistency or variability of travel time over a corridor, measured via buffer index or planning time index, No. Row 3: Day and Emtenan, 2018: Energy Use, The amount of energy needed to move a vehicle for some distance, No. Row 4: Day and Emtenan, 2018: Perception Index, Accumulated disutility along the trip as a function of number of stops, No. Row 5: Waddell et al. 2020a: Vehicular Delay, The additional time a vehicle experiences due to signal control compared to free-flow conditions, No. Row 6: Wang 2020: Attainability of Ideal Progression, Degree to which signal timing allows vehicles to progress through multiple intersections with minimal stops, No. Row 7: Wang 2020: Attainability of User Satisfaction, Composite measure capturing how well signal operations align with user expectations, such as low delay or high progression, No. Row 8: Ostojic and Mahmassani 2020: Traffic Signal System Measure of Effectiveness, Composite performance metric designed to evaluate the effectiveness of traffic signal systems by integrating high-resolution vehicle trajectory data with signal control information, No. No. Row 9: Yue et al. 2021: Signal Performance Index, Aggregated score that combines multiple traffic measures (e.g., delay, stops, queue) to evaluate signal performance, No. Row 10: Saldivar-Carranza, Li, Mathew, et al. 2021: Purdue Probe Diagram, Visualization tool that accounts for arrivals on green, split failures, percentage of vehicles experiencing downstream blockage, and level of service, No. Row 11: Dobrota, Cesme, et al. 2024: Normalized Corridor Delay, Root mean square of average delay per intersection for each corridor travel direction, No. Row 12: Oregon DOT, 2024: Travel Time Anomalies, Identification of unexpected or abnormal increases in travel time, where the actual data point deviates significantly from the prediction, No.
Key Findings of the Literature Review
Some of the key findings from the literature review include the following:
- Over the past two decades, traffic signal performance reporting has evolved considerably, from early studies focused on data extraction to the emergence of various monitoring solutions that use high-resolution controller data as well as new platforms and analytical approaches.
- The benefits and costs of these systems have been documented in multiple studies, generally indicating a favorable benefit–cost ratio. However, fully quantifying all associated costs remains somewhat challenging.
- A wide range of traffic signal performance measures have been developed to support key operational goals. These include infrastructure health monitoring, mobility, safety, and multimodal operations. Fewer studies were found that focused on leveraging ATSPMs for safety and multimodal operations than for other key operational goals.
- Despite the availability of these measures, there remains a gap in methodologies for assessing performance at the overall network level since most efforts are focused on leveraging ATSPMs at the intersection level.
- Several research efforts have explored how to integrate ATSPMs into agency workflows and planning processes. Despite these efforts, a gap remains in how to streamline the use of ATSPMs on a day-to-day basis considering the range of agency circumstances (e.g., funding availability, staff resources, type of systems deployed, agency traffic signal management approaches).
- Crowdsourced ATSPMs have been introduced as alternatives to traditional ATSPMs, particularly where detection infrastructure or communications are limited. While crowdsourced ATSPMs provide measures based on vehicle delay and other travel characteristics, they typically do not allow for direct assessment of infrastructure health and are not able to generate multimodal performance measures.


