Automated Traffic Signal Performance Measures: Management, Operation, and Maintenance (2026)
Chapter: 3 Survey Results

CHAPTER 3
Survey Results
This chapter presents the findings from a survey distributed to 50 state DOTs and the DOT of the District of Columbia. The survey focused on the use of traditional and crowdsourced ATSPMs. The survey questions were developed based on the information gathered in the literature review and in discussions with the project panel and other DOT professionals. The survey was designed with skip logic to optimize data collection based on respondent answers. Skip logic is a feature that dynamically shows or hides questions based on the respondentsʼ answers to previous questions. Therefore, the total number of questions appears different for each respondent based on the selected answer choices. The survey was distributed to the DOTs on February 10, 2025.
Responses were received from 42 DOTs, which correspond to an approximately 82% response rate. These responses included DOTs that use traditional ATSPMs with varying levels of deployment, DOTs that use crowdsourced ATSPMs, and DOTs that do not use either. Although further attempts were made with the nine state DOTs that did not respond to survey requests, no additional responses were obtained. Figure 13 illustrates the DOTs that participated in the survey. Dark blue indicates DOTs that provided responses, light blue represents non-participating DOTs, and orange indicates DOTs that both responded to the survey and participated in the case examples. Please note that each figureʼs or tableʼs caption references the question number from the survey (labeled as Q) and the number of DOTs responding to the question (labeled as N).
Survey Design
The survey was designed to identify, document, and summarize state DOT practices on planning, management, operation, and maintenance of SPM solutions. Additionally, the survey was designed to allow state DOTs to report their reasons for not using SPM solutions. To collect the desired information, the survey was divided into six parts:
- Organizational structure and deployment overview;
- Funding sources, strategies, and return on investment;
- Staff capabilities, operational challenges, and institutional support;
- Signal monitoring, optimization, maintenance, and performance measurements with the use of SPM solutions;
- Systems and technology, including security challenges; and
- Open-ended questions for additional insights and feedback.
Appendix A shows the survey questionnaire distributed to the DOTs. The next sections provide key findings from the survey responses.

Long Description.
The map of the United States categorizes states into three groups: non-participating, survey-participating, and survey and case example participant states. Non-participating states are shown in one color, survey-participating states in another, and survey and case example participant states in a third color. The states of Minnesota, Utah, North Carolina, Maryland, and Georgia are highlighted as survey and case example participants.
State DOT Structure and Deployment Overview
The team distributed the survey to traffic signal engineers at the state level; these engineers were typically located in central offices. In two cases, responses were provided by individual districts within a state DOT rather than the central office by the agency. The response from Alaska DOT represents only the central region, which manages approximately three-quarters of all traffic signals in the state. The Missouri DOT response reflects practices specific to the southwest district.
Recognizing that the organizational structure of state DOTs can vary significantly, which also typically affects the use of technologies such as SPM solutions, the team aimed to determine the different ways in which DOTs manage traffic signals. In certain cases, state DOTs own the signals but delegate operational responsibilities to other entities, such as counties or local jurisdictions. In other cases, they may not own the signals but are still responsible for their operation. To capture the extent of each DOTʼs involvement, the survey asked respondents to report the number of traffic signals located within the DOT right-of-way. Table 7 shows the survey results and illustrates the wide range of scenarios related to traffic signal operations across different DOTs as well as the significant variation in the total number of signals the agencies manage. Some DOTs are responsible for operating several thousand traffic signals (e.g., Florida DOT, GDOT, New Jersey DOT, North Carolina DOT), while others operate a relatively small number of signals (e.g., Pennsylvania DOT, North Dakota DOT). These differences are largely the result of varying organizational structures and policy approaches within the states.
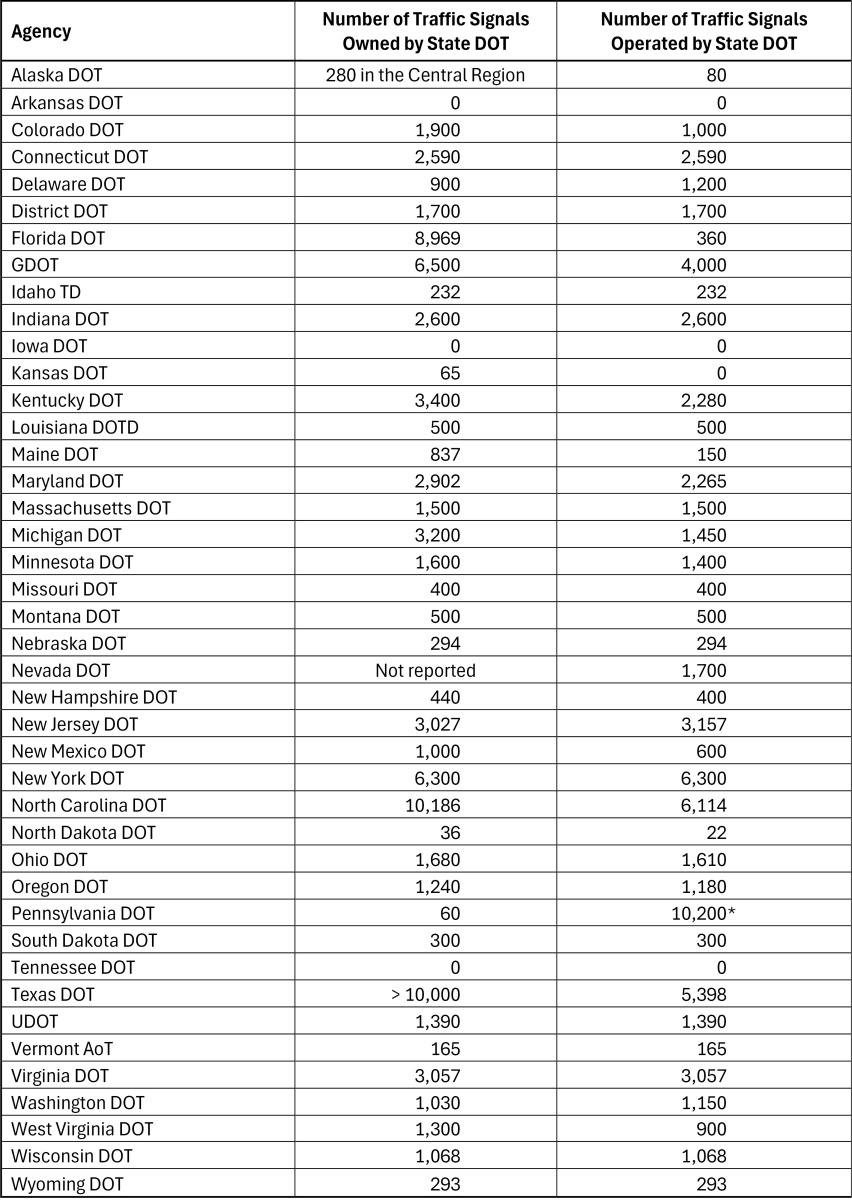
* Pennsylvania DOT issues permits to local municipalities that define the operation.
Note: TD = Transportation Department.
Long Description.
The column headers of the table are Agency, Number of traffic signals owned by state DOT, and Number of traffic signals operated by state DOT. The data given in the table row-wise are as follows: Row 1: Alaska DOT: 280 in the Central Region, 80. Row 2: Arkansas DOT: 0, 0. Row 3: Colorado DOT: 1,900, 1,000. Row 4: Connecticut DOT: 2,590, 2,590. Row 5: Delaware DOT: 900, 1,200. Row 6: District DOT: 1,700, 1,700. Row 7: Florida DOT: 8,969, 360. Row 8: Georgia DOT: 6,500, 4,000. Row 9: Idaho DOT: 232, 232. Row 10: Indiana DOT: 2,600, 2,600. Row 11: Iowa DOT: 0, 0. Row 12: Kansas DOT: 65, 0. Row 13: Kentucky DOT: 3,400, 2,280. Row 14: Louisiana DOT and D: 500, 500. Row 15: Maine DOT: 837, 150. Row 16: Maryland DOT: 2,902, 2,265. Row 17: Massachusetts DOT: 1,500, 1,500. Row 18: Michigan DOT: 3,200, 1,450. Row 19: Minnesota DOT: 1,600, 1,400. Row 20: Missouri DOT: 400, 400. Row 21: Montana DOT: 500, 500. Row 22: Nebraska DOT: 294, 294. Row 23: Nevada DOT: Not reported, 1,700. Row 24: New Hampshire DOT: 440, 400. Row 25: New Jersey DOT: 3,027, 3,157. Row 26: New Mexico DOT: 1,000, 600. Row 27: New York DOT: 6,300, 6,300. Row 28: North Carolina DOT: 10,186, 6,114. Row 29: North Dakota DOT: 36, 22. Row 30: Ohio DOT: 1,680, 1,610. Row 31: Oregon DOT: 1,240, 1,180. Row 32: Pennsylvania DOT: 60, 10,200 Asterisk. Row 32: South Dakota DOT: 300, 300. Row 33: Tennessee DOT: 0, 0. Row 34: Texas DOT: Greater than 10,000, 5,398. Row 35: Utah DOT: 1,390, 1,390. Row 36: Vermont AoT: 165, 165. Row 37: Virginia DOT: 3,057, 3,057. Row 38: Washington DOT: 1,030, 1,150. Row 39: West Virginia DOT: 1,300, 900. Row 40: Wisconsin DOT: 1,068, 1,068. Row 41: Wyoming DOT: 293, 293.
Some DOTs indicated that they do not own or operate their traffic signals. The distribution of DOTs with and without ownership of traffic signals is shown in Figure 14. The DOTs that do not own any of their traffic signals are Tennessee DOT, Arkansas DOT, and Iowa DOT. The survey responses in Appendix B show more information on DOT ownership of traffic signals as well as DOT responsibilities for traffic signals.
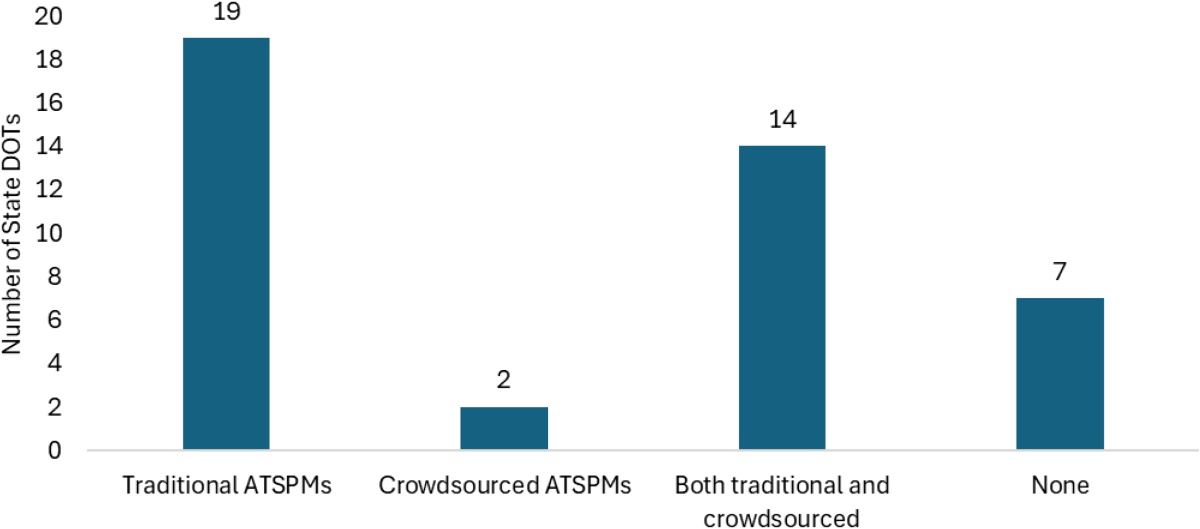
Because the focus of this synthesis is both on traditional and crowdsourced ATSPMs and their implementation within DOTs, the team examined the types of SPM solutions currently deployed by DOTs. Figure 15 illustrates the distribution of SPM solutions that were reported.
Of the 42 state DOTs that responded to the survey, 35 reported deploying traditional ATSPMs, crowdsourced ATSPMs, or both. Seven state DOTs indicated that they currently do not use any SPM solutions. Additionally, 33 state DOTs (19 using traditional ATSPMs only and 14 using both) indicated that they are in some phase of deploying traditional ATSPMs, representing almost 80% of the DOTs surveyed. Regarding crowdsourced ATSPMs, two DOTs have deployed only this type of solution, while 14 have implemented it in combination with traditional ATSPMs.
Out of the 42 DOTs that responded to the survey, 33 indicated that they currently operate traditional ATSPMs. The survey asked those DOTs to describe the extent of their deployment using one of the following categories:
- Pilot phase/few intersections traditional ATSPM deployment with planned future expansion
- Pilot phase/few intersections traditional ATSPM deployment with no planned future expansion

Long Description.
The bar chart illustrates the number of state Departments of Transportation (DOTs) responding Yes or No. The vertical axis represents the number of state DOTs, ranging from 0 to 45 in increments of 5. The horizontal axis shows two categories: No and Yes. The Yes category has a significantly higher count with 39 state DOTs, while the No category has only 3 state DOTs.
Long Description.
The bar chart illustrates the number of state Departments of Transportation (DOTs) using various Signal Performance Measures (SPM) methods. The vertical axis represents the number of state DOTs, ranging from 0 to 20 in increments of 2. The horizontal axis lists four categories: Traditional ATSPM with 19 DOTs, Crowdsourced ATSPM with 2 DOTs, Both traditional and crowdsourced with 14 DOTs, and None with 7 DOTs.
- Critical intersections/corridors traditional ATSPM deployment with planned future expansion
- Critical intersections/corridors traditional ATSPM deployment with no planned expansion
- Almost all traffic signals integrated with ATSPM deployment
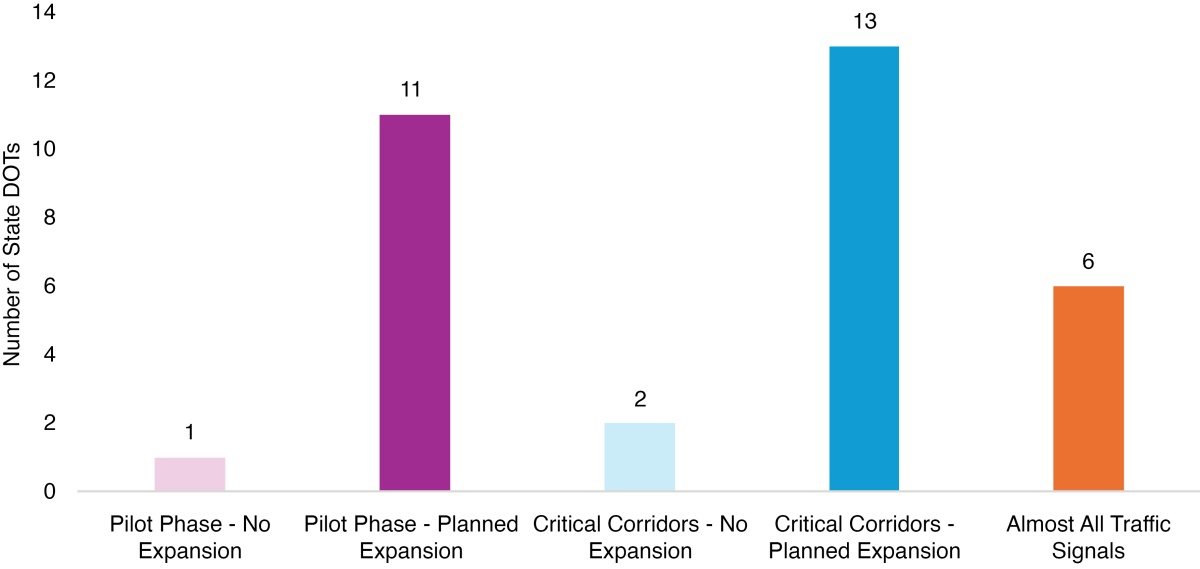
Figure 16 presents the reported status of deployment (including expansion) of traditional ATSPMs. Six DOTs (corresponding to roughly 14% of total survey respondents) indicated full deployment, meaning that nearly all traffic signals are equipped with ATSPMs. Fifteen DOTs, representing about 36% of total survey respondents, reported deployment of ATSPMs at critical intersections or critical corridors. Among those, 13 DOTs plan to continue expanding their systems, while the other two do not have any expansion plans. An additional 12 DOTs, or about 29% of total respondents, reported deployment of ATSPMs in a pilot phase or at a few intersections. Eleven of those DOTs indicated plans for future expansion. A total of 24 DOTs (57% of total DOTs surveyed) are planning to expand their systems; this includes pilots and deployments at critical corridors.
For those DOTs that have not deployed traditional ATSPMs at all traffic signals, the follow-up survey question inquired about the primary factors hindering full deployment. The results are shown in Figure 17 and show that those DOTs that are planning to expand the system share common reasons for incomplete deployment regardless of their current state of ATSPM deployment. The most common obstacle is limited staff resources, followed by outdated detection technologies, challenges related to integration with existing infrastructure, limited communication media, and high up-front costs and ongoing maintenance. Other reasons that agencies listed were time for setup and firewall and IT challenges. For state DOTs that are not planning system expansion, several reasons were selected, including limited staff resources, inadequate or absent communication media, and high up-front costs and ongoing maintenance. These reasons align with the challenges faced by DOTs that are planning to expand their traditional ATSPMs.
As noted earlier, seven DOTs stated that they have not deployed any SPM solutions. Of those, one agency indicated that it is not considering SPM solutions in the future, whereas six indicated that they were considering some level of SPM solutions for future deployments. The survey inquired about the reasons for not implementing SPM solutions. Figure 18 illustrates the distribution of these reasons. As with the responses from DOTs planning system expansions, the primary reasons for not deploying SPM solutions are limited staff resources, outdated detection
Long Description.
The bar chart illustrates the number of state Departments of Transportation (DOTs) across various phases. The y-axis represents the number of state DOTs, ranging from 0 to 14 in increments of 2. The x-axis includes categories: Pilot phase - No Expansion with 1 DOT, Pilot phase - Planned Expansion with 11 DOTs, Critical corridors - No Expansion with 2 DOTs, Critical corridors - Planned Expansion with 13 DOTs, and Almost all traffic signals with 6 DOTs. The chart highlights the distribution of DOTs in each phase, with the highest number in the Critical Corridors - Planned Expansion category.

Long Description.
The bar chart illustrates various challenges encountered by State Departments of Transportation (DOTs) during the adoption of new technologies. The horizontal axis represents the number of State DOTs, ranging from 0 to 13 in increments of 1. The vertical axis lists challenges such as ‘Challenges during the adoption of new technologies,’ ‘Concerns about data privacy or security,’ ‘High upfront costs and ongoing maintenance,’ ‘Integration challenges with existing infrastructure,’ ‘Lack of clear operational benefits,’ ‘Limited or lack of communication media,’ ‘Limited staff resources,’ ‘Other,’ ‘Outdated detection and signal controller technology,’ ‘Political or policy constraints,’ ‘Uncertainty about Return on Investment,’ and ‘Waiting for better or cheaper options.’ Each challenge is represented by bars in four categories: ‘Pilot phase - No expansion,’ ‘Pilot phase - Planned Expansion,’ ‘Critical corridors - No expansion,’ and ‘Critical corridors - Planned Expansion.’ Key data points include ‘Limited staff resources’ with the highest count of 12 in ‘Critical corridors - Planned Expansion.’ Waiting for better or cheaper options has the lowest of 1 in ‘Critical corridors - Planned Expansion.’ Limited or lack of communication media and Uncertainty about Return on Investment has ‘Critical corridors - No expansion’ of 1. Limited staff resources have the highest of 11 for ‘Pilot phase - Planned Expansion.’ Concerns about data privacy or security, Lack of clear operational benefits, and Political or policy constraints have scores of 1 in ‘Critical corridors - Planned Expansion’

Long Description.
The bar chart illustrates various challenges faced by state Departments of Transportation (DOTs) in adopting Safety Performance Measure (SPM) solutions. The horizontal axis represents the number of state DOTs, ranging from 0 to 13 in increments of 1. The vertical axis lists challenges such as ‘Challenges during the adoption of new technologies,’ ‘Concerns about data privacy or security,’ ‘High upfront costs and ongoing maintenance,’ ‘Integration challenges with existing infrastructure,’ ‘Limited or lack of communication media,’ ‘Limited staff resources,’ ‘Other,’ ‘Outdated detection and signal controller technology,’ ‘Political or policy constraints,’ ‘Uncertainty about Return on Investment,’ Each challenge is represented by two bars: one for SPM solutions not used but considered, and another for SPM solutions not used nor considered. Key data points include ‘Limited staff resources’ with 4 DOTs not using nor considering SPM solutions, and ‘Integration challenges with existing infrastructure’ and ‘Outdated detection and signal controller technology’ with 3 DOTs, ‘Challenges during the adoption of new technologies,’ ‘Concerns about data privacy or security,’ ‘High upfront costs and ongoing maintenance,’ ‘Limited staff resources,’ ‘Other,’ ‘Political or policy constraints’ with 1 DOT not using but considering SPM solutions. ‘Challenges during the adoption of new technologies,’ ‘High upfront costs and ongoing maintenance,’ ‘Limited or lack of communication media,’ ‘Limited staff resources,’ ‘Uncertainty about Return on Investment,’ with 1 DOT in SPM solutions not used, not considered.
and signal controller technology, challenges with integration into existing infrastructure, and limited or lack of communication media.
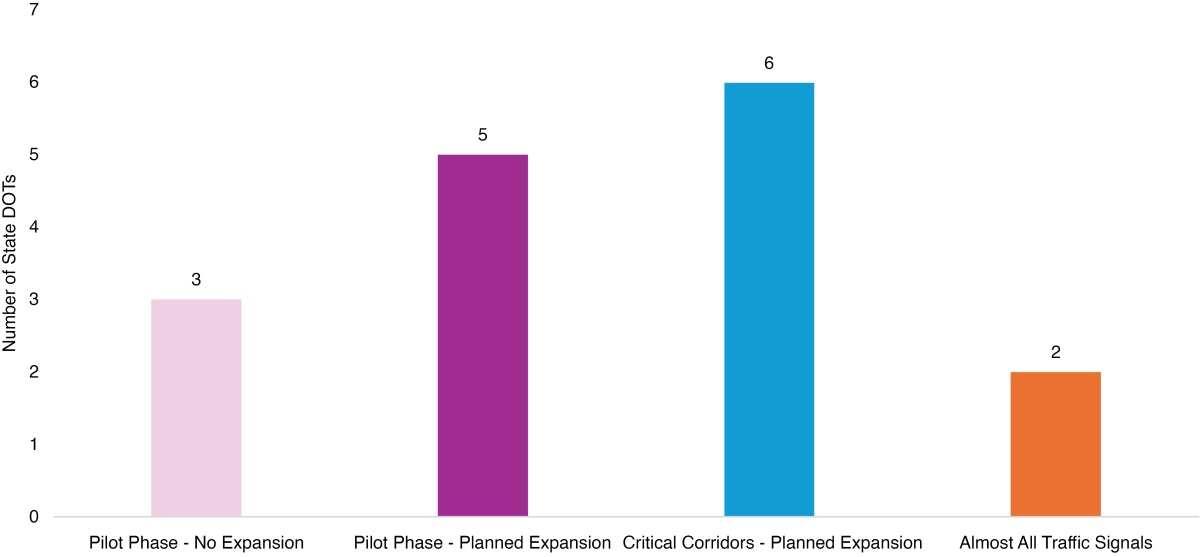
Figure 19 shows the distribution of responses to a question inquiring about the status of deployment (including expansion) of crowdsourced ATSPMs. Two state DOTs (Oregon DOT and GDOT) indicated that they have full/statewide deployment of crowdsourced ATSPMs. Eleven DOTs out of 16 stated that they are planning to further expand crowdsourced ATSPMs, and three DOTs indicated that they are not planning to expand the current system.
For DOTs that would like to expand their crowdsourced ATSPMs, the survey inquired about the main reasons for deploying crowdsourced ATSPMs at pilot locations or critical corridors instead of almost all traffic signals. Figure 20 shows that there are no significant differences between the level of deployment and the reasons selected. Overall, as with traditional ATSPMs, the greatest obstacle is identified as limited staff resources. The second most important factor is the challenge of adopting new technologies, followed by high up-front costs. Among other responses, some DOTs reported that the most relevant locations or corridors have already been covered with crowdsourced ATSPMs, making the expansion to almost all signals unnecessary in terms of added benefit.
As shown in Figure 19, three DOTs reported having pilot implementation of crowdsourced ATSPMs with no future expansion plans. The survey examined their responses to identify the underlying reasons for this decision. Figure 20 illustrates the distribution of reasons for not planning to expand these systems. All three state DOTs identified limited staff resources and uncertainty about return on investment (ROI) as the primary factors preventing further expansion. These observations are generally consistent with the challenges faced by DOTs planning to expand their systems.
Since state DOTs may use multiple SPM solutions, the team asked whether they use a single solution/vendor or multiple solutions/vendors. Figure 21 shows that out of 35 responding state DOTs, 12 DOTs (approximately 34%) use a single solution, while 23 DOTs (around 66%) operate more than one. These results are consistent with earlier findings, particularly the fact that 14 DOTs indicated that they operate both traditional and crowdsourced ATSPMs. Additionally, some DOTs, while utilizing the open-source ATSPM software from UDOT, have opted
Long Description.
The status of crowdsourced ATSPM deployment, divided into four categories: ‘Pilot phase - No expansion’ with 3 state DOTs, ‘Pilot phase - Planned Expansion’ with 5 state DOTs, ‘Critical corridors - Planned Expansion’ with 6 state DOTs, and ‘Almost all traffic signals’ with 2 state DOTs. The vertical axis represents the number of state DOTs, ranging from 0 to 7 in increments of 1.

Long Description.
The bar chart illustrates various challenges faced by State Departments of Transportation (DOTs) during technology adoption. The horizontal axis represents the number of State DOTs, ranging from 0 to 13 in increments of 1. The vertical axis lists challenges such as ‘Challenges during the adoption of new technologies,’ ‘High upfront costs and ongoing maintenance,’ ‘Integration challenges with existing infrastructure or signal systems,’ ‘Lack of clear operational benefits or data to support implementation,’ ‘Limited staff resources,’ ‘Other,’ and ‘Uncertainty about return on investment.’ Each challenge is represented by three bars indicating ‘Pilot phase - No expansion,’ ‘Pilot phase - Planned Expansion,’ and ‘Critical corridors - Planned Expansion.’ Key data points include ‘Limited staff resources’ with the highest planned expansion at 5 State DOTs, and ‘Challenges during the adoption of new technologies’ with 4 State DOTs. With the lowest of 1 State DOTs in ‘Lack of clear operational benefits or data to support implementation in the Pilot phase - planned expansion phase. ‘Limited staff resources’ and ‘Other’ with the highest 3 State DOTs and the lowest of 1 State DOT in ‘Integration challenges with existing infrastructure or signal systems,’ ‘Lack of clear operational benefits or data to support implementation,’ and ‘Uncertainty about return on investment.’ in Critical corridors- Planned Expansion. ‘Limited staff resources’ and ‘Uncertainty about return on investment’ with the highest 3 State DOTs and the lowest of 1 State DOTs in ‘Integration challenges with existing infrastructure or signal systems’ in Pilot phase - No expansion.
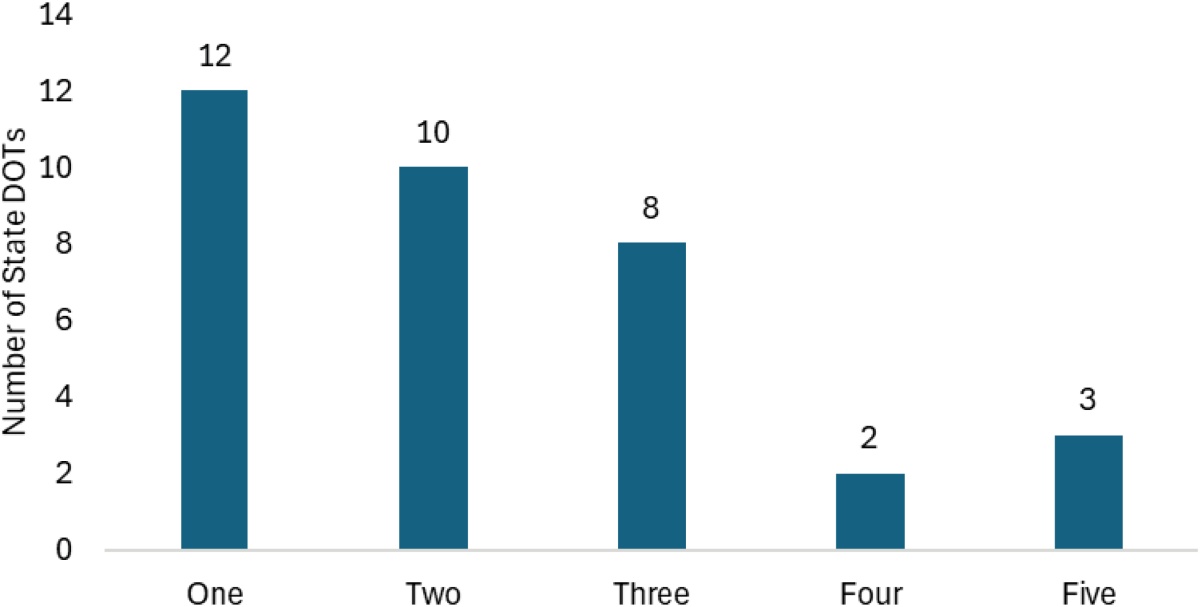
Long Description.
The bar chart illustrates the number of SPM solutions used by State Departments of Transportation (DOTs) categorized from one to five. The vertical axis represents the number of State DOTs, ranging from 0 to 14 in increments of 2. The horizontal axis lists categories: One, Two, Three, Four, and Five. The bars show that category One has twelve DOTs, Two has ten, Three has eight, Four has two, and Five has three.
for vendor-based platforms to reduce setup effort and to benefit from enhanced user flexibility, technical support, and advanced reporting capabilities.
Shortly after the release of the UDOT open-source ATSPM software, many signal controller vendors recognized an opportunity to develop similar versions and integrate them into their respective central signal systems. At the time of the writing of this report, the team identified 11 different SPM solutions (considering both traditional and crowdsourced ATSPMs). Figure 22 illustrates the distribution of these various deployments. The results show that the most widely adopted solution is the UDOT open-source ATSPM software.
The survey asked whether state DOTs use traffic management resources other than ATSPMs, such as advanced traffic management systems (ATMSs), traffic management centers (TMCs), or central traffic signal systems (CTSSs). For clarity, while TMCs support traffic operations, traffic signal management is typically handled through ATMSs or CTSSs, not directly by the TMC. Figure 23 shows that four out of 42 surveyed state DOTs (approximately 10%) do not have a
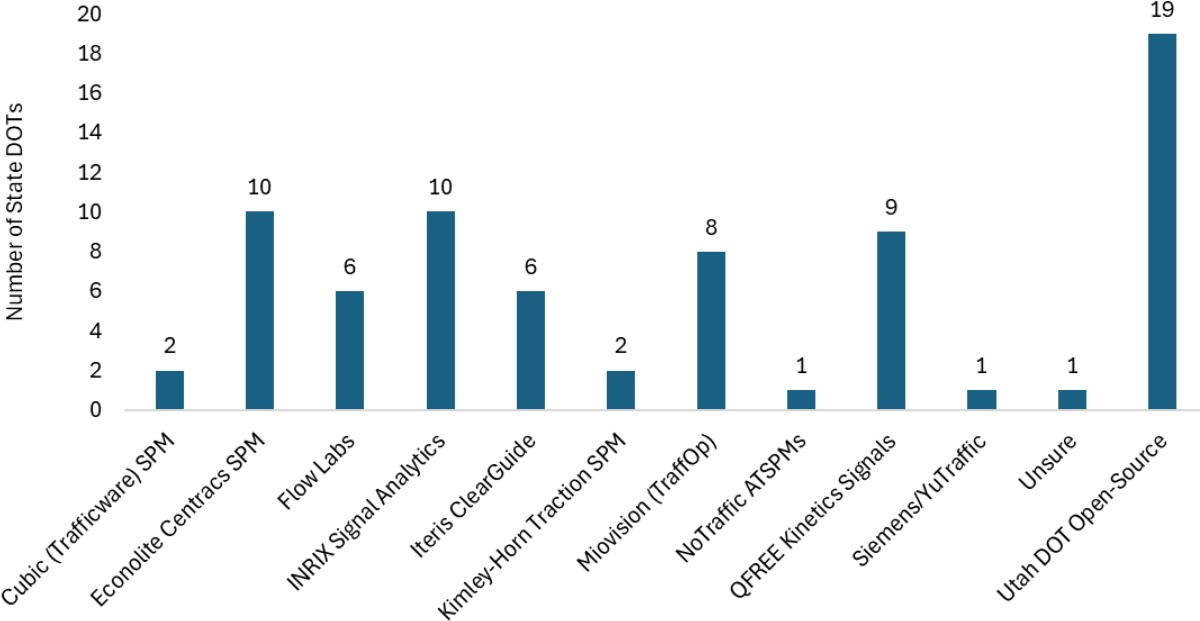
Long Description.
The bar chart illustrates the number of state Departments of Transportation (DOTs) utilizing different traffic management systems. The x-axis lists the systems, including Cubic (Trafficware) SPM, Econolite Centracs SPM, Flow Labs, INRIX Signal Analytics, Iteris ClearGuide, Kimley-Horn Traction SPM, Miovision (Traffop), NoTraffic ATSPMs, QFREE Kinetics Signals, Siemens or YuTraffic, Unsure, and Utah DOT Open-Source. The y-axis represents the number of state DOTs, ranging from 0 to 20 in increments of 2. Utah DOT Open-Source leads with 19 DOTs, followed by Econolite Centracs SPM, and INRIX Signal Analytics, each with 10. Miovision (Traffop) has 8, QFREE Kinetics Signals has 9, and others have fewer, with some systems only having 1 or 2.
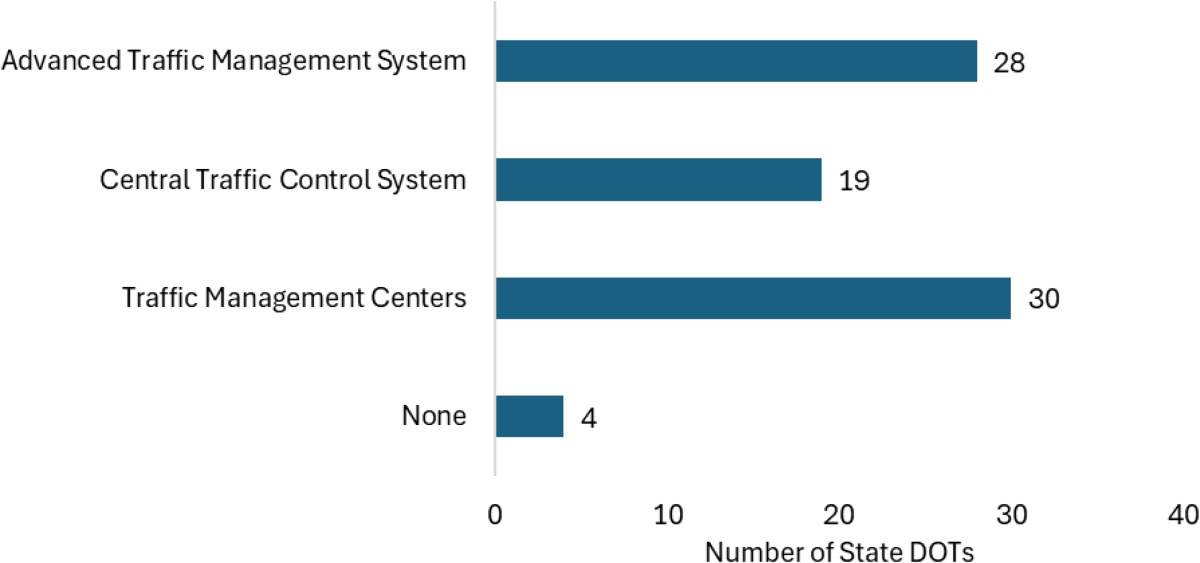
Long Description.
The bar chart illustrates the number of state Departments of Transportation (DOTs) utilizing different traffic systems. The x-axis represents the number of state DOTs, ranging from 0 to 40 in increments of 10. The y-axis lists four categories: Advanced Traffic Management System, Central Traffic Control System, Traffic Management Centers, and None. Traffic Management Centers are used by 30 state DOTs, the Advanced Traffic Management System by 28, the Central Traffic Control System by 19, and 4 state DOTs use none of these systems.
central system, which aligns with the DOTs that have not deployed traditional ATSPMs. Note that this survey question was multiple choice since many DOTs typically operate multiple systems.
As mentioned earlier, 33 DOTs have deployed traditional ATSPMs. For those DOTs, the survey asked whether ATSPMs have been integrated into their central traffic management platforms. Figure 24 presents the distribution of responses. Out of 33 responses, 18 reported having traditional ATSPMs integrated into their central platforms. Among these, 14 use vendor-based platforms, while the remaining four use the UDOT open-source ATSPM software. Also, 15 state DOTs reported that their ATSPMs are not integrated into a central traffic management platform.
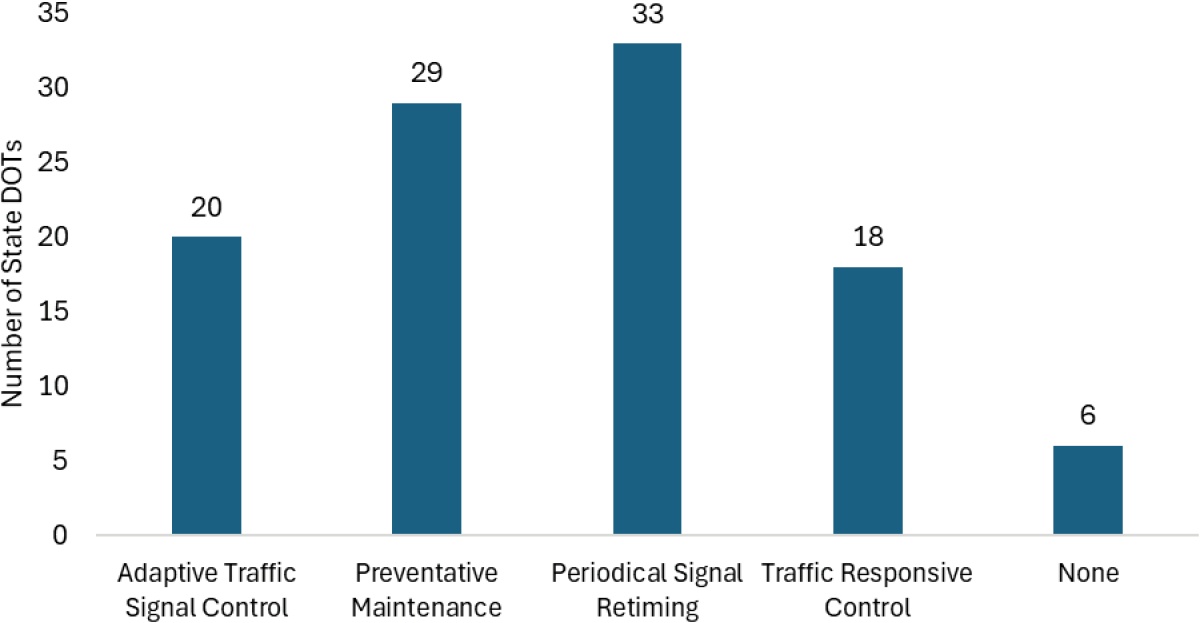
In addition to managing traffic signals through traditional or crowdsourced ATSPMs, DOTs also rely on various other strategies. The survey asked whether DOTs use some other approaches for signal management. Figure 25 shows the distribution of these strategies. The most frequently reported strategies are periodic signal retiming and preventative maintenance. Out of the 42 state DOTs surveyed, 20 DOTs (approximately 48%) indicated use of adaptive traffic signal control,
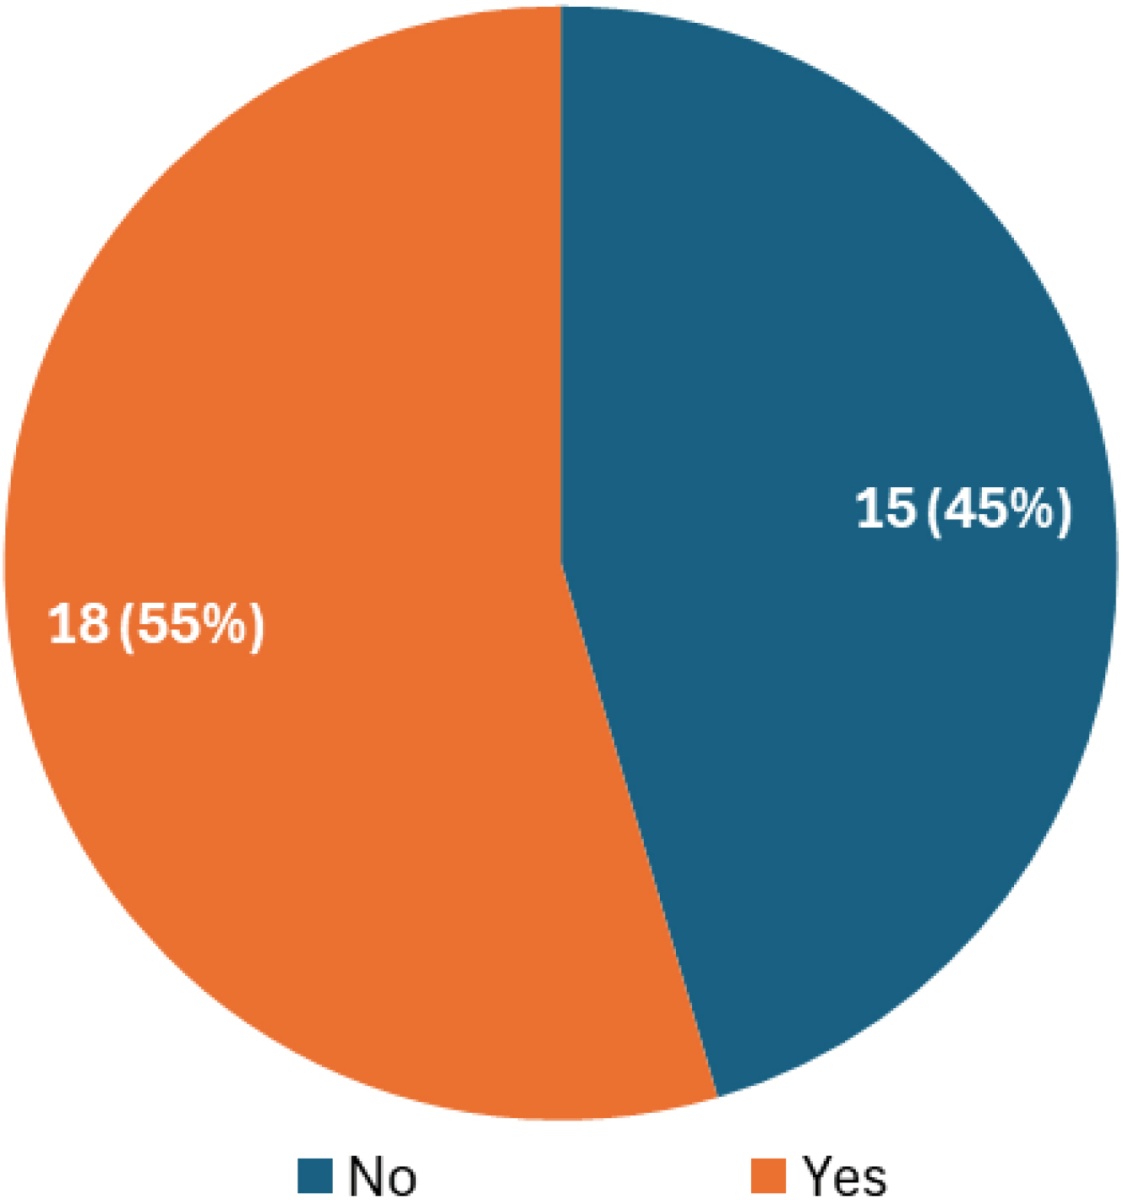
Long Description.
The pie chart illustrates survey results of integration of ATSPMs into central traffic signal systems with two segments. The ‘No’ segment represents 55 percent with 18 responses, while the ‘Yes’ segment accounts for 45 percent with 15 responses.
Long Description.
The bar chart illustrates the number of state Departments of Transportation (DOTs) employing different traffic signal strategies. The y-axis represents the number of state DOTs, ranging from 0 to 35 in increments of 5. The x-axis lists five strategies: Adaptive Traffic Signal Control with 20 DOTs, Preventative Maintenance with 29 DOTs, Periodical Signal Retiming with 33 DOTs, Traffic Responsive Control with 18 DOTs, and None with 6 DOTs.
which is lower than the adoption rate of traditional ATSPMs, which are used by about 79% of state DOTs. Traffic-responsive strategies were also reported and were often used alongside adaptive systems.
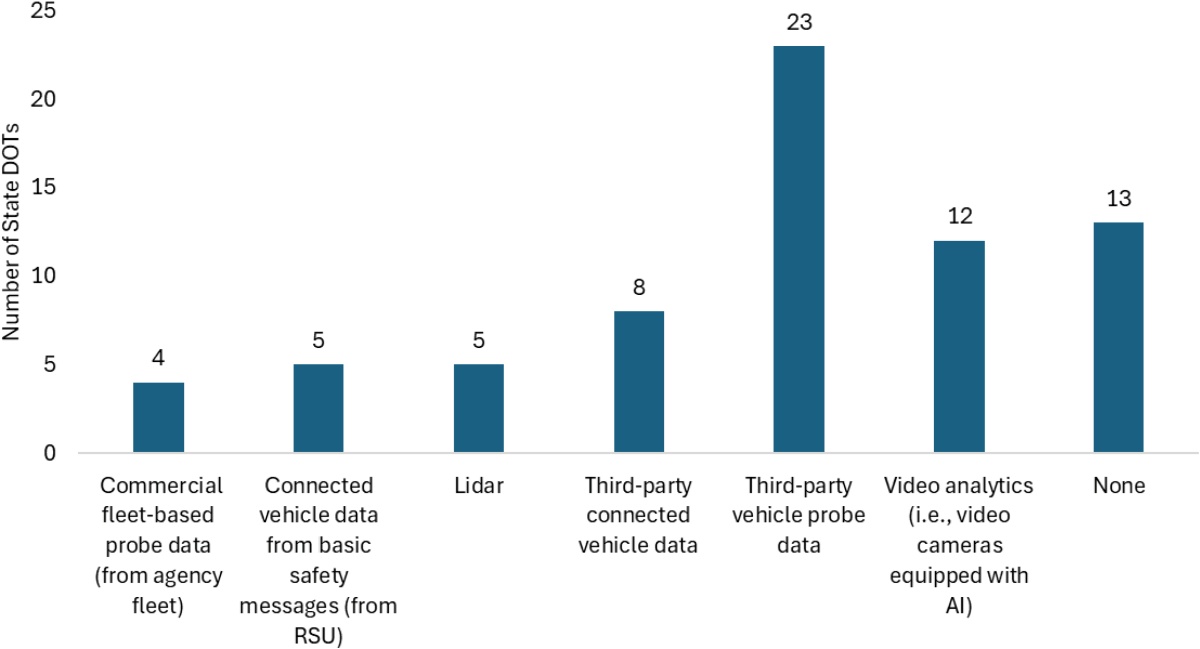
To support traffic signal maintenance and operations, some DOTs have also used emerging data sources. The survey asked how frequently these technologies have been used by DOTs. Figure 26 presents the distribution of responses regarding the use of emerging data sources. It is important to note that the DOTs were allowed to select multiple data sources since many often utilize a combination of various data sources. The most commonly used source, reported by 23 out of 42 surveyed DOTs, is third-party vehicle probe data. Also, 13 DOTs reported not using any of the emerging data sources. Another relatively common technology is video analytics.
Funding and Return on Investment
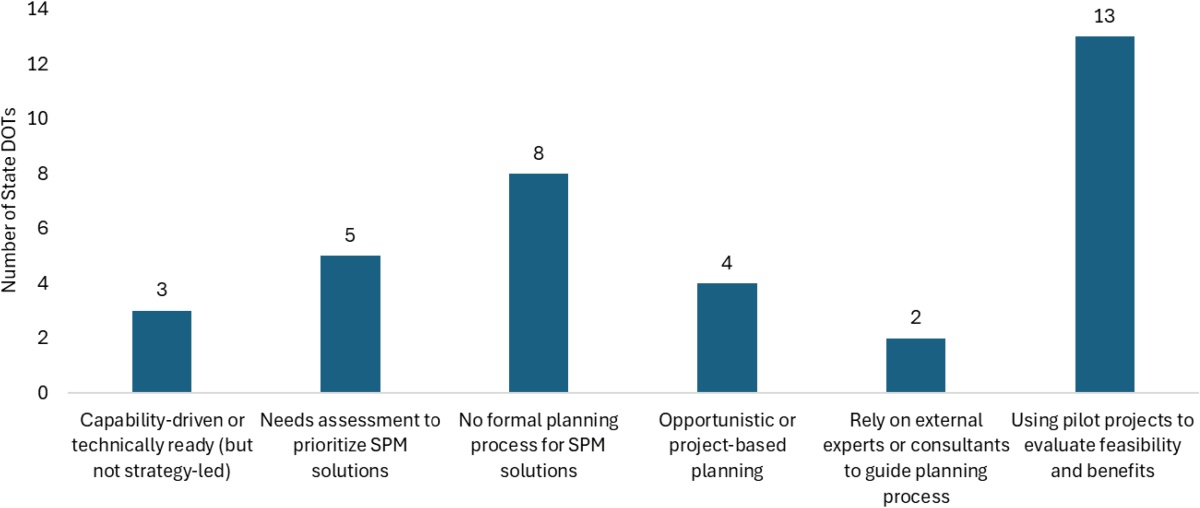
This rest of this chapter presents survey responses and key findings from DOTs that primarily use traditional ATSPMs. This synthesis primarily focuses on traditional ATSPMs, so many of the questions are more relevant to these systems than to crowdsourced ATSPMs, although information about crowdsourced ATSPMs is included where applicable. When planning for the deployment of new technologies, DOTs may follow a variety of approaches. Some DOTs may introduce new systems through capital improvement projects, while others may use pilot projects to test, evaluate, and determine the feasibility of broader implementation. The survey identified several reasons and strategies for planning for SPM solutions. Figure 27 shows the distribution of responses among DOTs that have deployed traditional and crowdsourced ATSPMs. The most common approach, reported by 13 out of 35 DOTs (approximately 37%), is implementation through pilot projects. The second most common approach, reported by eight DOTs (around 23%), involves no formal planning process. These DOTs adopted SPM solutions in an ad hoc manner, likely guided by emerging best practices. Other planning approaches are prioritization of operational needs, integration with broader infrastructure projects, and alignment with ongoing statewide upgrades such as signal controller replacements. Five DOTs (about 14%) cited
Long Description.
The bar chart illustrates the number of state Departments of Transportation (DOTs) utilizing different data sources. The x-axis lists data sources: Commercial fleet-based probe data, Connected Vehicle data from Basic Safety Messages (from RSU), Lidar, Third-party Connected Vehicle data, Third-party vehicle probe data, Video analytics (i.e., video cameras equipped with AI), and None. The y-axis represents the number of state DOTs, ranging from 0 to 25 in increments of 5. Key data points include 23 DOTs using third-party vehicle probe data, 13 using no data source, and 12 using video analytics. Other sources have fewer than 10 DOTs each, such as 4 DOTs using Commercial fleet-based probe data, 5 DOTs using Connected Vehicle data from Basic Safety Messages (from RSU), 5 DOTs using Lidar, and 8 DOTs using Third-party Connected Vehicle data.
Long Description.
The bar chart illustrates the number of state Departments of Transportation (DOTs) across six planning categories. The y-axis represents the number of state DOTs, ranging from 0 to 14 in increments of 2. The categories on the x-axis include: ‘Capability-driven or technically ready (but not strategy-led)’ with 3 DOTs, ‘Needs assessment to prioritize SPMs solutions’ with 5 DOTs, ‘No formal planning process for SPMs solutions’ with 8 DOTs, ‘Opportunistic or project-based planning’ with 4 DOTs, ‘Rely on external experts or consultants to guide planning process’ with 2 DOTs, and ‘Using pilot projects to evaluate feasibility and benefits’ with 13 DOTs. The chart highlights that the most common approach is using pilot projects.
such strategies. Additionally, three DOTs implemented SPM solutions because the necessary infrastructure was already in place, and two DOTs relied on external consultants or experts to guide their implementation efforts.
Among the six state DOTs that reported full deployment of traditional ATSPMs, two indicated they did not follow any formal planning process. Two others described their approach as capability-driven or based on technical readiness rather than a formal strategy. One agency followed an opportunistic or project-based planning model, and one conducted a needs assessment to identify where traditional ATSPMs would have the greatest impact. These findings suggest that the scale of deployment of traditional ATSPMs does not necessarily correlate with the presence of a formal planning process but rather has someone at the agency championing the use of the technology.
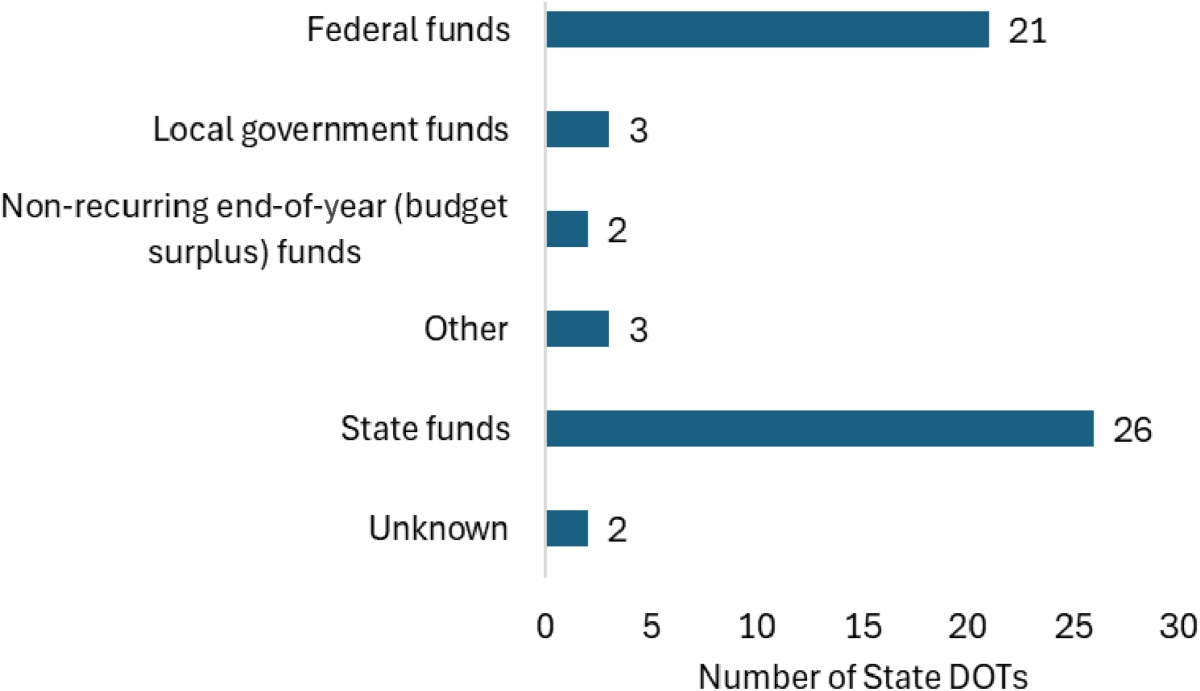
The survey inquired about funding sources used to support the initial deployment of traditional ATSPMs. Note that selecting multiple answers was possible for this question. Figure 28 shows that the most reported source was state funds, cited by 26 state DOTs (approximately 78%
Long Description.
The bar chart illustrates the number of state Departments of Transportation (DOTs) utilizing different funding sources. The horizontal axis represents the number of state DOTs, ranging from 0 to 30 in increments of 5. The vertical axis lists funding sources: Federal funds, Local government funds, Non-recurring End-of-Year (Budget Surplus) funds, Other, State funds, and Unknown. State funds are used by 26 DOTs, Federal funds by 21, Local government and Other funds by 3 each, Non-recurring End-of-Year funds by 2, and Unknown by 2.
of all traditional ATSPM-deploying state DOTs). This is followed by federal funding, reported by 21 state DOTs (around 64% of all deploying state DOTs). The significant use of federal funds may be linked to the Every Day Counts Round 4 initiative, which was promoted by the FHWA in 2018. Other reported funding sources were research grants and innovation funds, and in two cases, state DOTs indicated that the specific funding source was unknown.
The survey also asked whether there was a correlation between the number of funding sources and the scale of deployment for traditional ATSPMs. Among the six state DOTs that classified their deployment as full scale, three used only a single funding source (state funding), while the other three used two or more funding sources. Therefore, no clear relationship can be established between the number of funding sources and the outcome of DOTs having full ATSPM deployment. Figure 29 shows the distribution of funding sources used for initial ATSPM implementation. The results show that almost half of the state DOTs used more than one source to fund initial implementation of traditional ATSPMs.
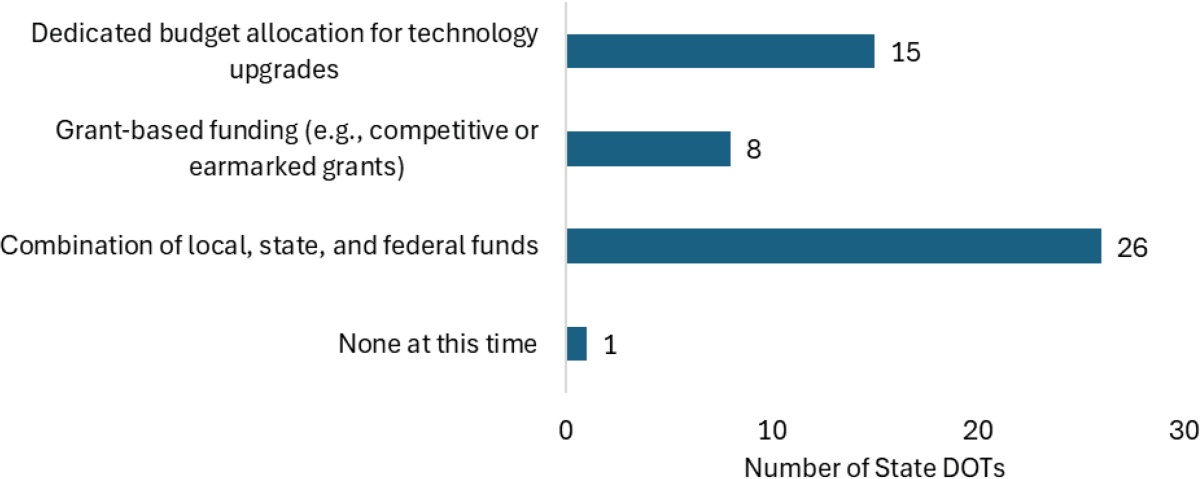
In addition to covering implementation cost for initial deployments, DOTs that desire to expand their system must also plan for funding future ATSPM initiatives, such as system expansion, configuration of additional intersections, and infrastructure upgrades (e.g., communication media improvements). Figure 30 presents the distribution of funding sources identified for these efforts. DOTs were allowed to select multiple options. The most common response, reported by 26 out of 33 ATSPM-deploying DOTs (approximately 79%), was a combination of local, state, and

Long Description.
The bar chart illustrates the number of state Departments of Transportation (DOTs) categorized by their funding sources for traditional ATSPM implementation. The vertical axis represents the number of state DOTs, ranging from 0 to 20 in increments of 2. The horizontal axis lists the categories: Single Funding Source, Two Funding Sources, and Three Funding Sources. The chart shows 18 state DOTs with a single funding source, 12 with two funding sources, and 5 with three funding sources.
Long Description.
The bar chart illustrates the number of state Departments of Transportation (DOTs) using different funding sources for traditional ATSPM initiatives. The horizontal axis represents the number of state DOTs, ranging from 0 to 30 in increments of 10. The vertical axis lists funding sources: dedicated budget allocation for technology upgrades, grant-based funding (e.g., competitive or earmarked grants), a combination of local, state, and federal funds, and none at this time. The combination of local, state, and federal funds is the most used source, with 26 DOTs, followed by dedicated budget allocation for technology upgrades with 15 DOTs, grant-based funding (e.g., competitive or earmarked grants) with 8 DOTs, and none at this time with 1 DOT.
federal funds. The second most frequent response, selected by 15 DOTs (about 45%), was the use of dedicated budget allocations for technology upgrades. Additionally, eight responding DOTs indicated that they plan to rely on grant-based funding to support future ATSPM initiatives.
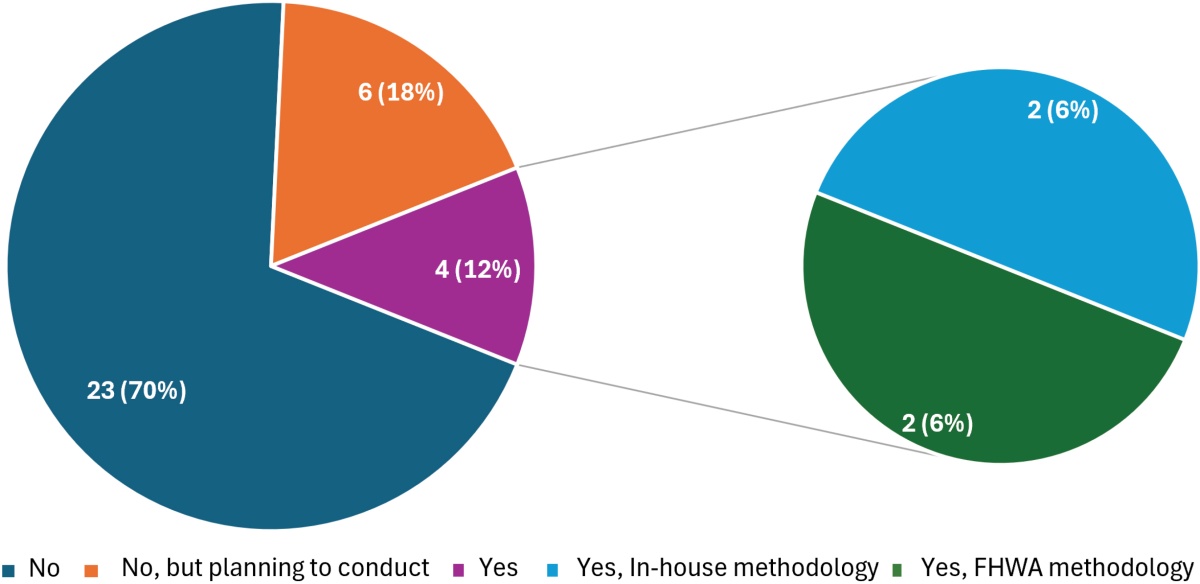
Lastly, the survey asked DOTs whether they have conducted an ROI analysis for implemented traditional ATSPMs. Figure 31 shows the distribution of responses. Most responding DOTs, approximately 70% (or 23 out of 33), have not conducted an ROI analysis, while 18% (six out of 33) are planning to do so, and the remaining 12% (four out of 33) have completed a benefit–cost analysis.
Staff Capabilities, Resource Allocation, and Institutional Support
An agencyʼs ability to effectively implement and sustain SPM solutions is closely tied to its staffing capacity, internal resources, and institutional support. While quantitative indicators such as the number of full-time employees or staff qualifications provide some context, they often fall short of capturing the practical readiness needed to manage complex, data-driven systems like SPM solutions. Because of this limitation, the survey asked DOT representatives to self-assess their organizationʼs capability to support ongoing SPM operations using existing staff. This approach offers a more nuanced understanding of operational readiness than what traditional metrics can reveal and allows for comparison between perceived capabilities and actual system deployment levels.
Figure 32 presents the distribution of agency staff capabilities for supporting SPM solutions. For traditional ATSPMs, responses were almost equally distributed across limited, moderate, and full capability, with 12, 11, and 10 state DOTs responding, respectively. This contrasts with the deployment data shown earlier (see Figure 16), which indicated that fewer DOTs had achieved full deployment than had achieved pilot or critical-corridor deployment. Also, DOTs that reported limited capabilities often noted the need for additional staff or consultant support to effectively monitor and act on signal performance measure data.
The distribution of staff capabilities for crowdsourced ATSPMs is also shown in Figure 32. Of the 16 DOTs responding, 10 (approximately 63%) reported being somewhat equipped to support these systems, while four indicated full capability, and two reported limited capability. Looking back to Figure 19, one can observe that 11 DOTs with pilot or deployment at critical
Long Description.
The pie chart illustrates survey responses regarding return of investment analysis usage. The largest segment, 23 responses (70 percent), indicates no current use. 6 responses (18 percent) are planning to conduct, while 4 responses (12 percent) report use. Of the 4, 2 responses (6 percent) employ an FHWA methodology, and 2 responses (6 percent) employ an in-house methodology.

Long Description.
The bar chart illustrates the number of state Departments of Transportation (DOTs) equipped to support traditional and crowdsourced Automated Traffic Signal Performance Measures (ATSPM). The x-axis represents three categories: fully equipped, somewhat equipped, and limited capability. The y-axis shows the number of state DOTs, ranging from 0 to 14 in increments of 2. In the ‘fully equipped’ category, 10 state DOTs support traditional ATSPM, while 4 support crowdsourced ATSPM. In the ‘somewhat equipped’ category, 12 state DOTs support traditional ATSPM, and 10 support crowdsourced ATSPM. In the ‘limited capability’ category, 13 state DOTs support traditional ATSPM, and 2 support crowdsourced ATSPM.
corridors are planning system expansions. This is followed by three DOTs with pilot deployment and no expansion plans, and two DOTs with full deployment. In the case of deployment of crowdsourced ATSPMs, there appears to be a strong correlation between the level of deployment and staffing capability.
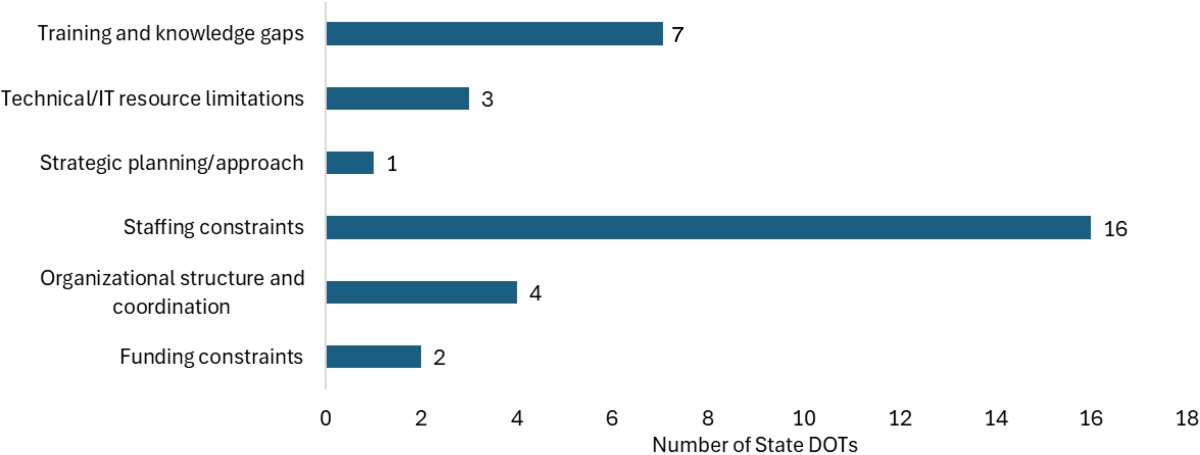
A total of 23 DOTs reported not being fully equipped to support either traditional or crowdsourced ATSPMs. These 23 DOTs were asked to identify the primary challenges contributing to this limitation, and the distribution of responses is shown in Figure 33. The most cited reason was staffing constraints, selected by 16 DOTs (approximately 70% of the respondents). All 16 of these DOTs are deployers of traditional ATSPMs, and six of them also implemented crowdsourced ATSPMs. Many noted that they do not have dedicated personnel for SPM solutions and often have existing staff balancing multiple responsibilities. DOTs also reported concerns over staff retirement, limited access to training, and insufficient funding for system maintenance and future expansion. Other frequently cited challenges were training and knowledge gaps as well as organizational structure, both of which are closely tied to staffing limitations. Also, three state DOTs (about 13%) cited technical or IT resource constraints.
The survey responses in Appendix B provide insights into the staffing levels of the 35 state DOTs that reported deploying SPM solutions. Included are the number of full-time equivalent
Long Description.
The bar chart illustrates challenges faced by state Departments of Transportation, with the x-axis representing the number of state DOTs from 0 to 18 in increments of 2, and the y-axis represents training listing knowledge gaps, technical or IT resource limitations, strategic planning or approach, Staffing constraints, Organizational structure, and coordination and funding constraints. Staffing constraints are the highest at 16, followed by training and knowledge gaps at 7, organizational structure and coordination at 4, technical or IT resource limitations at 3, funding constraints at 2, and strategic planning or approach at 1.
(FTE) employees dedicated to traffic signal operations and maintenance, the number of FTEs specifically assigned to SPM solutions, and whether the implementation of SPM solutions has led to adjustments in staffing levels or resource allocation. The data reveal significant variation in agency staffing structures. Also, 11 DOTs reported having no staff specifically dedicated to SPM solutions, while an additional eight DOTs indicated having fewer than one FTE assigned, meaning that related tasks are handled only periodically by staff with other primary responsibilities. Together, these 19 DOTs account for approximately 55% of all respondents. Of the six DOTs that classified themselves as full deployers of traditional ATSPMs, two reported less than one FTE dedicated to operations, while the remaining four had one or more FTEs.
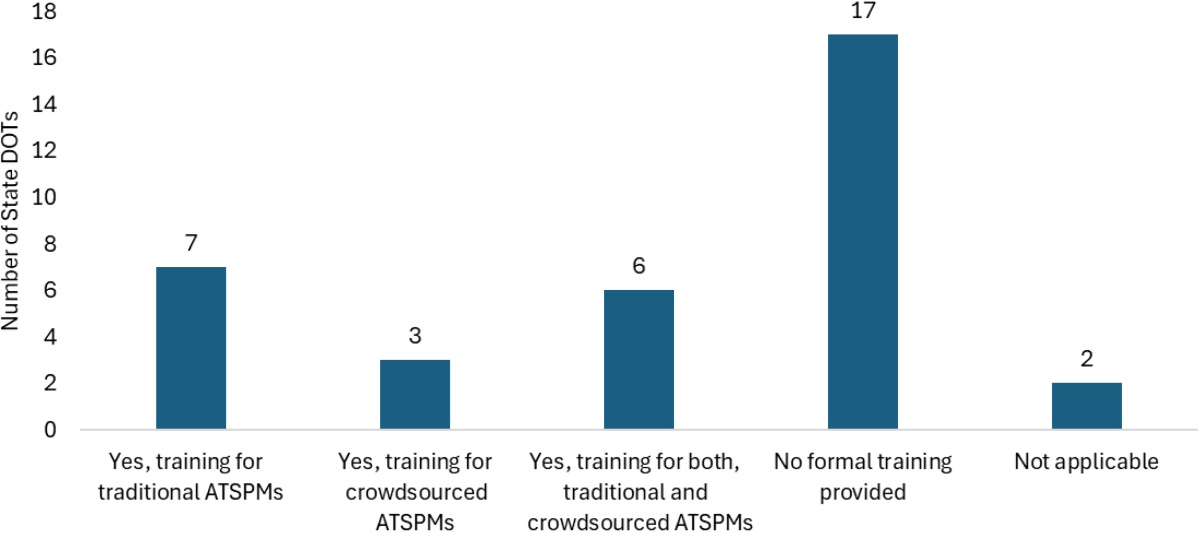
Figure 34 illustrates the distribution of DOTs that have provided formal training for any type of SPM solution. Among the 35 state DOTs that have deployed SPM solutions, 17 (approximately 49%) reported not offering any formal training. Seven DOTs provided training exclusively for traditional ATSPMs, six offered training for both traditional and crowdsourced ATSPMs, and three provided training solely for crowdsourced ATSPMs. Two DOTs indicated that the question was not applicable, one because the agency has a small staff and training is conducted on an ad hoc basis, and the other because the agency uses vendor-led webinars. Among the six DOTs that identified as full deployers of traditional ATSPMs, responses were split: three reported providing formal training, while the other three did not.
While deploying SPM solutions provides value in monitoring signal performance and informing signal timing decisions, these benefits are unlikely to be realized if the systems are not fully integrated into an agencyʼs daily operations. Traditional ATSPM systems generate highly detailed data, often at the individual intersection movement level, and can be difficult to manage and apply at a system-wide scale. To better determine the extent to which these tools are embedded in routine practices, the survey asked whether DOTs integrate traditional ATSPMs into their day-to-day workflows. Figure 35 presents the distribution of responses. It was reported that 16 out of 35 (approximately 45%) DOTs have limited integration; substantial challenges were often cited. Eleven DOTs indicated moderate integration, although with some challenges. Three DOTs (UDOT, GDOT, and Connecticut DOT) reported strong integration supported by well-established procedures. Meanwhile, five DOTs stated that they have not yet integrated traditional ATSPMs into their operations. Of these, three have only limited deployment of traditional ATSPMs, one has moderate deployment, and one has full deployment.
Long Description.
The bar chart illustrates the number of state Departments of Transportation (DOTs) receiving different types of training for Automated Traffic Signal Performance Measures (ATSPM). The x-axis lists training categories: traditional ATSPM, crowdsourced ATSPM, both traditional and crowdsourced ATSPM, no formal training, and not applicable. The y-axis represents the number of state DOTs, ranging from 0 to 18 in increments of 2. The highest bar, representing 17 DOTs, indicates no formal training provided. 7 DOTs received training for traditional ATSPM, 3 for crowdsourced ATSPM, 6 for both types, and 2 are not applicable.

Long Description.
The bar chart illustrates the number of State Departments of Transportation (DOTs) categorized by their level of integration. The x-axis lists four categories: ‘No integration at this time’, ‘Limited integration with noticeable challenges’, ‘Moderate integration with some challenges’, and ‘Strong Integration with Established Procedures’. The y-axis represents the number of State DOTs, ranging from 0 to 18 in increments of 2. The chart shows 5 DOTs with no integration, 16 with limited integration, 11 with moderate integration, and 3 with strong integration.
Signal Monitoring, Optimization, Maintenance, and Performance Measurement
SPM solutions can support a wide range of applications, including infrastructure health monitoring and signal timing analysis and optimization. Figure 36 presents the distribution of responses from the DOTs regarding their current use of SPM solutions. The most common use cases, each cited by 26 DOTs, were handling public service calls and making signal timing adjustments. This was followed by 23 responses indicating the use for active traffic signal performance monitoring and intersection operations evaluation. The next most frequent use cases, with 21 responses, were active signal infrastructure health monitoring and signal timing adjustments. Full signal timing optimization was reported by 20 DOTs. Less common uses were safety

Long Description.
The bar chart illustrates the number of State Departments of Transportation (DOTs) engaged in different traffic signal operations. The horizontal axis represents the number of State DOTs, ranging from 0 to 30 in increments of 5. The vertical axis lists activities such as active signal infrastructure health monitoring, active traffic signal performance monitoring, evaluation of intersection operations, full signal timing optimization, handling public service calls, multi-modal operations analysis, safety performance analysis, signal timing adjustments, and signal timing schedule adjustments. Key data points include handling public service calls and signal timing adjustments, both with 26 State DOTs, while multi-modal operations analysis involves only 3 State DOTs. Active signal infrastructure health monitoring, signal timing schedule adjustments with 21 State DOTs, active traffic signal performance monitoring and evaluation of intersection operations with 23 State DOTs, full signal timing optimization with 20 State DOTs, and safety performance analysis with 10 State DOTs.
performance analysis (10 DOTs) and multimodal operations (three DOTs, representing fewer than 10% of respondents).
While the previous question focused on various applications of SPM solutions, the next part of the analysis examined how frequently DOTs use SPM reports to inform potential signal timing adjustments. To identify any notable differences in responses, the survey distinguished between DOTs deploying traditional ATSPMs and those using crowdsourced ATSPMs.
As indicated in Figure 37, of the 33 DOTs using traditional ATSPMs, 26 DOTs (approximately 78%) reported reviewing ATSPM reports on an ad hoc basis. Three DOTs indicated reviewing data on a daily basis, two on a yearly basis, and just one each on a weekly or monthly basis. The relatively low frequency of regular reviews may reflect challenges related to staffing, integration into daily workflows, the large amounts of available data, and the movement-level granularity of many performance measures.
Figure 38 shows the distribution of review frequency for crowdsourced ATSPMs used in potential signal retiming activities. Out of 16 deploying DOTs, 10 (approximately 63%) reported

Long Description.
The bar chart illustrates the frequency of reviews by state Departments of Transportation (DOTs). The vertical axis represents the number of state DOTs, ranging from 0 to 30 in increments of 5. The horizontal axis lists the frequency categories: ‘Ad hoc or as needed’, ‘Daily’, ‘Monthly’, ‘Weekly’, and ‘Yearly’. The ‘Ad hoc or as needed’ category has the highest count with 26 state DOTs, followed by ‘Daily’ with 3, ‘Monthly’ and ‘Weekly’ each with 1, and ‘Yearly’ with 2.

Long Description.
The bar chart illustrates the frequency of reviews by state Departments of Transportation (DOTs). The x-axis represents the frequency categories: ‘Ad hoc or as needed’, ‘Daily’, ‘Monthly’, and ‘Weekly’. The y-axis shows the number of state DOTs, ranging from 0 to 12 in increments of 2. ‘Ad hoc or as needed’ is the most frequent, with 10 state DOTs, while ‘Daily’, ‘Monthly’, and ‘Weekly’ each have 2 state DOTs.
using these reports on an ad hoc basis. The remaining six DOTs indicated more structured usage: two review the data daily, two weekly, and two monthly. Compared to traditional ATSPM users, a slightly higher proportion of crowdsourced ATSPM users engage in routine review practices.
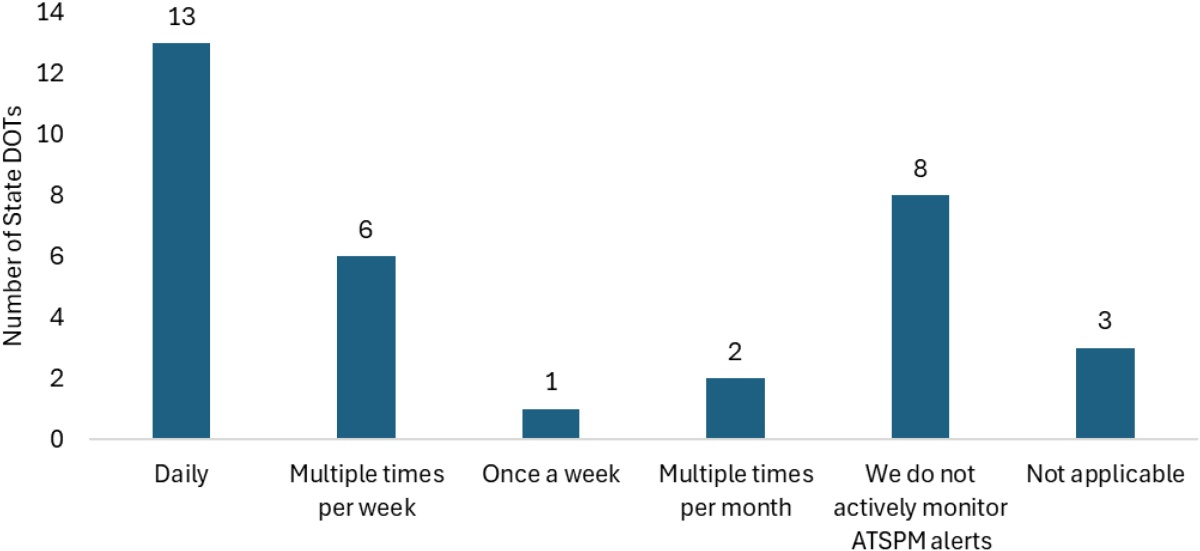
Figure 39 illustrates how frequently DOTs monitor and respond to traditional ATSPM alerts related to infrastructure health, such as detector malfunctions or communication issues. Among the 33 responding DOTs, 13 reported daily monitoring. Six DOTs review alerts multiple times per week, while two do so multiple times per month, and one on a weekly basis. However, eight DOTs stated that they do not actively monitor ATSPM alerts, and three indicated that this function is not applicable to their operations (e.g., reports are triggered daily but not necessarily reviewed, or they review alerts when they are notified by area staff).
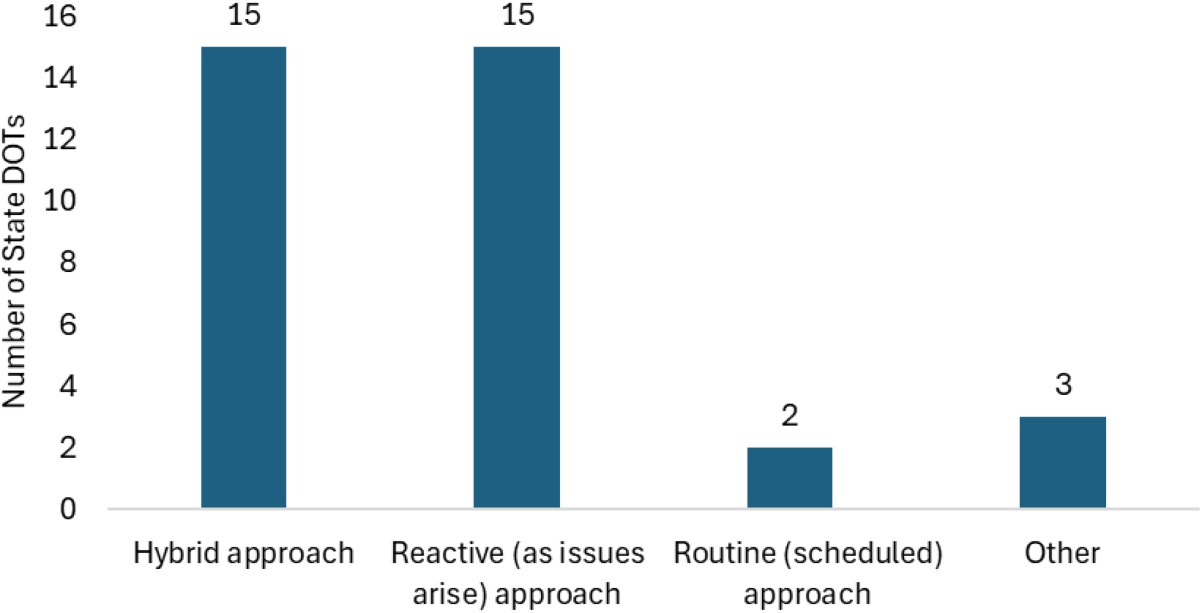
Figure 40 summarizes DOTsʼ signal maintenance practices for using SPM solutions. Of the 35 responding DOTs, 15 DOTs reported using a hybrid approach, which combines elements of routine, reactive, or predictive maintenance based on ATSPM data. An equal number indicated using a reactive approach, meaning maintenance is triggered only when issues are identified through ATSPM alerts (such as watchdog alerts) or through external sources like citizen
Long Description.
The bar chart illustrates the frequency at which state Departments of Transportation (DOTs) responds to ATSPM alerts. The y-axis represents the number of state DOTs, ranging from 0 to 14 in increments of 2. The x-axis includes categories: Daily, Multiple times per week, Once a week, Multiple times per month, We do not actively monitor ATSPM alerts, and Not applicable. The highest number, 13 DOTs, monitor daily, while 8 do not actively monitor. Other frequencies include 6 for multiple times per week, 1 for once a week, 2 for multiple times per month, and 3 for not applicable.
Long Description.
The bar chart illustrates the number of state Departments of Transportation (DOTs) using various maintenance approaches. The y-axis represents the number of state DOTs, ranging from 0 to 16 in increments of 2. The x-axis lists four approaches: Hybrid, Reactive (as issues arise), Routine (scheduled), and Other. Both the Hybrid and Reactive approaches have 15 state DOTs each. The Routine approach is used by 2 state DOTs, while 3 state DOTs use Other approaches.
complaints, with ATSPMs used to confirm the problem. Two DOTs reported following a routine (scheduled) approach, in which ATSPM reports are reviewed at fixed intervals (e.g., monthly or quarterly) to guide maintenance. There was no agency that explicitly selected predictive maintenance, which would involve analyzing ATSPM performance data to proactively identify and resolve potential failures before they occur. Three DOTs selected “other,” suggesting unique or developing strategies not captured by the predefined categories and indicating that agencies are deploying crowdsourced ATSPMs.
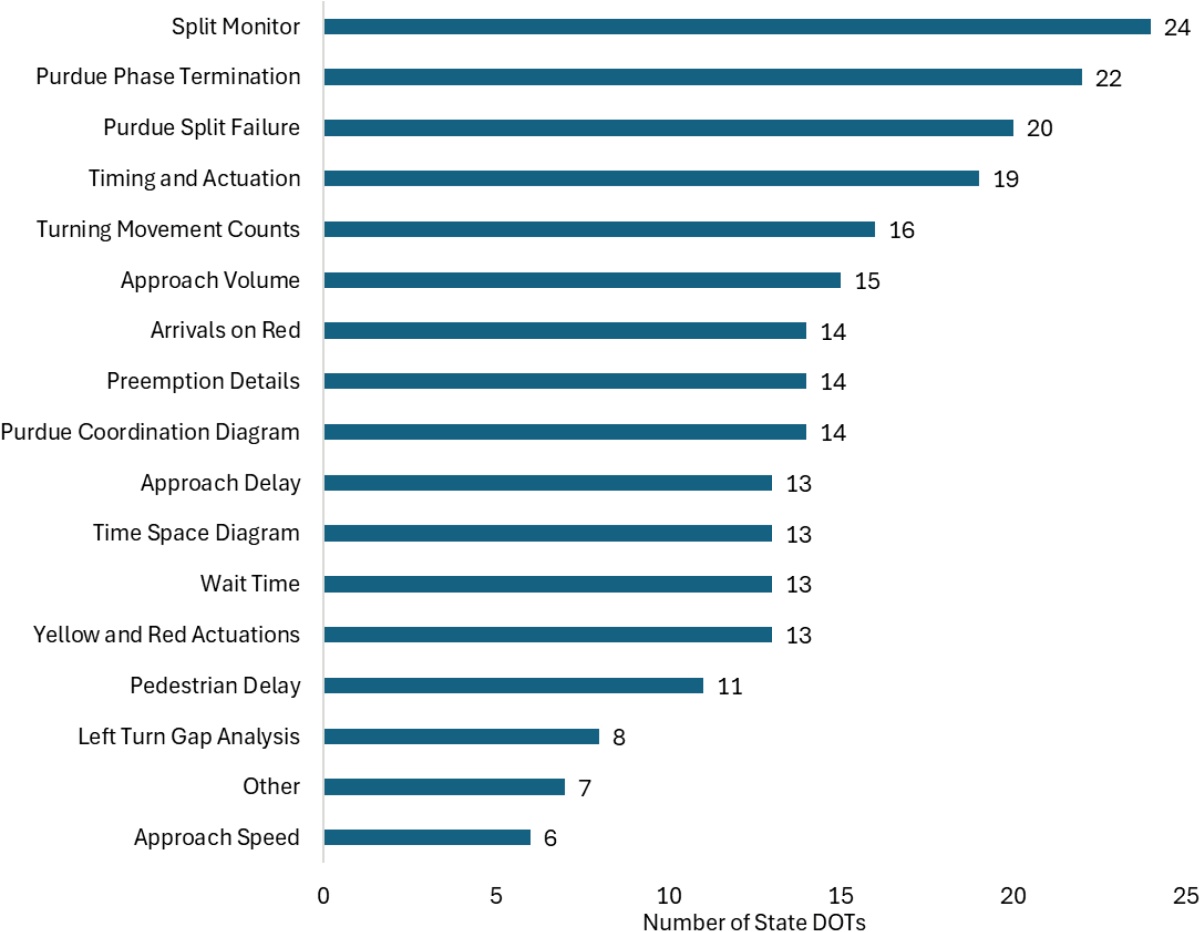
As discussed in detail in Chapter 2, a wide range of SPM solutions have been developed to date. Agency representatives were asked to identify which measures were primarily used by their respective DOTs. Figure 41 illustrates the types of SPM reports (including both traditional and crowdsourced ATSPMs) regularly used by state DOTs. Among the most frequently used reports were the Split Monitor (24 DOTs), Purdue Phase Termination (22), Purdue Split Failure (20), and Timing and Actuation (19), all of which help DOTs analyze phase efficiency and allocation of green time. Reports such as Turning Movement Counts (16), Approach Volume (15), Arrivals on Red (14), Preemption Details (14), Purdue Coordination Diagram (14), Approach Delay (13), Wait Time (13), Time Space Diagram (13), and Yellow and Red Actuations (13) also have moderate levels of usage and support both operations and safety assessments. Reports with fewer responses were Pedestrian Delay (11), Left-Turn Gap Analysis (8), and Approach Speed (6), likely due to data availability or reporting complexity. Seven DOTs cited “other” reporting types. These included specialized signal timing visualizations (e.g., histograms, cycle-length distributions), custom dashboards outside of traditional ATSPMs, travel time anomaly detection, and integration with third-party optimization tools.
Long Description.
The bar chart illustrates the number of state Departments of Transportation (DOTs) utilizing different SPM reports. The x-axis represents the number of state DOTs, ranging from 0 to 25 in increments of 5. The y-axis lists the tools, including Split Monitor, Purdue Phase Termination, Purdue Split Failure, Timing and Actuation, Turning Movement Counts, Approach Volume, Arrivals on Red, Preemption Details, Purdue Coordination Diagram, Approach Delay, Time Space Diagram, Wait Time, Yellow and Red Actuations, Pedestrian Delay, Left Turn Gap Analysis, Other, and Approach Speed. The data in the graph are provided in descending order. Split Monitor is the most used tool with 24 state DOTs, followed by Purdue Phase Termination with 22, and Purdue Split Failure with 20. Timing and Actuation with 19 DOTs, Turning Movement Counts with 16 DOTs, Approach Volume with 15 DOTs, Arrivals on Red with 14 DOTs, Preemption Details with 14 DOTs, Purdue Coordination Diagram with 14 DOTs, Approach Delay with 13 DOTs, Time Space Diagram with 13 DOTs, Wait Time with 13 DOTs, Yellow and Red Actuations with 13 DOTs, Pedestrian Delay with 11 DOTs, Other with 7 DOTs, Approach Speed and Left Turn Gap Analysis are used by fewer DOTs, with 6 and 8 respectively.
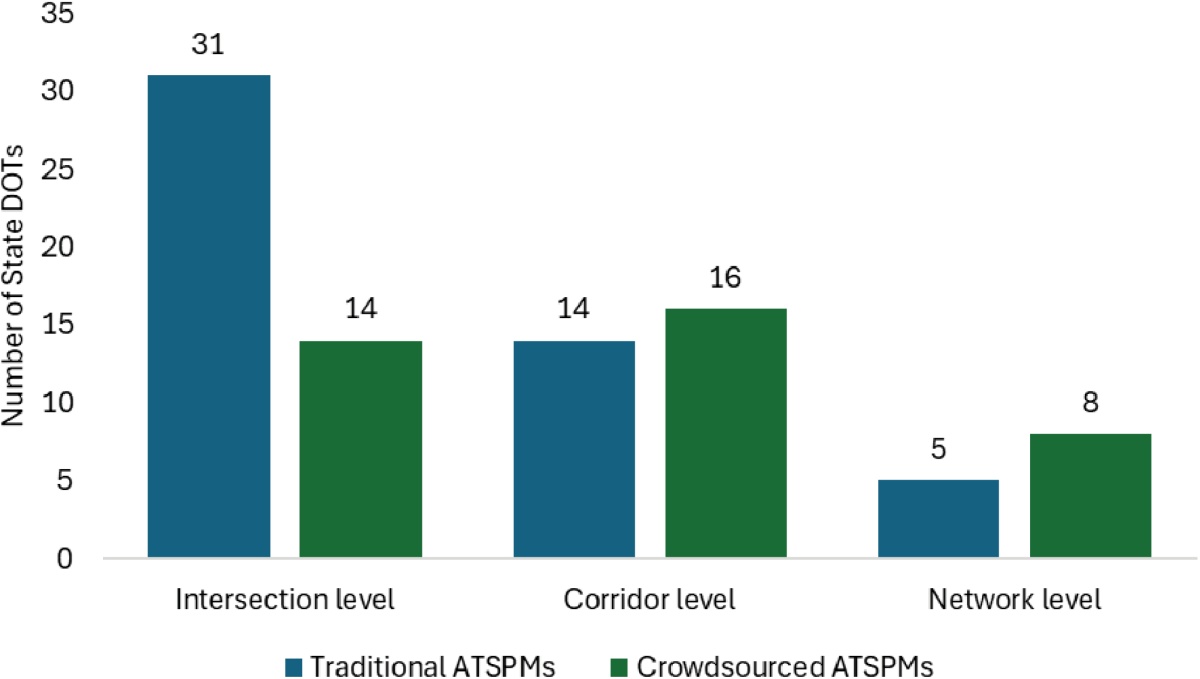
In addition to exploring how frequently DOTs use ATSPMs, the survey also asked about the spatial levels (i.e., intersection, corridor, network) at which signal performance is monitored. Figure 42 shows the results of DOT use of SPM solutions across these spatial levels. The results indicate that 31 DOTs out of 33 responding (approximately 94%) use traditional ATSPMs at the intersection level. The results also show that 14 DOTs (or 42% of responding DOTs) use traditional ATSPMs for corridor-level analysis and five (15%) use them for network-level analysis. Traditional ATSPMs were most frequently reported for intersection-level analysis, with fewer DOTs indicating use for broader spatial aggregation. In contrast, crowdsourced ATSPMs showed a more even distribution across spatial levels: 14 DOTs (out of 16 responding) at the intersection level (approximately 88%), 16 (100%) at the corridor level, and eight (50%) at the network level. While traditional and crowdsourced tools were both used for intersection-level monitoring, reported use of crowdsourced tools at the corridor and network levels was more common among respondents.
The survey also asked about the way DOTs aggregate traditional ATSPM data beyond the intersection level. Figure 43 shows the distribution of responses. Fourteen DOTs (out of 33 responding, about 42%) reported that they do not currently perform any aggregation or reporting beyond the intersection level. Four DOTs rely on manual reporting methods, while eight use automated reporting provided by ATSPM platforms. Another four DOTs have developed their own in-house automated reporting system based on ATSPM data. The remaining three DOTs selected “other” and described a mix of approaches: one noted using a combination of manual and automated reporting depending on the site, another described the use of custom dashboards and corridor-level PCDs developed in Indiana, and a third cited the use of automated arterial progression reports through its adaptive system.
To determine the barriers DOTs encounter when adopting more proactive traffic signal management practices, the survey included a question about the challenges experienced when transitioning from traditional reactive timing methods to those supported by traditional ATSPMs. Figure 44 summarizes the distribution of responses. The most frequently reported challenge, cited by 27 DOTs (out of 33), was limited staff resources. Time required for full system configuration was noted by 14 DOTs. Other commonly reported challenges included integration with existing signal systems and technologies (12), data collection and quality issues (12), and difficulties related to adopting new technologies (12). High up-front costs and ongoing maintenance were noted by
Long Description.
The bar chart illustrates the number of state Departments of Transportation (DOTs) using Traditional and Crowdsourced Automated Traffic Signal Performance Measures (ATSPM) across three levels: Intersection, Corridor, and Network. The y-axis represents the number of state DOTs, ranging from 0 to 35 in increments of 5. At the Intersection level, 31 state DOTs use Traditional ATSPM, while 14 use Crowdsourced ATSPM. At the Corridor level, both Traditional and Crowdsourced ATSPM are used by 14 and 16 state DOTs, respectively. At the Network level, 5 state DOTs use Traditional ATSPM, and 8 use Crowdsourced ATSPM.

Long Description.
The bar chart illustrates the number of State Departments of Transportation (DOTs) using various aggregation and reporting methods. The x-axis represents the number of State DOTs, ranging from 0 to 15 in increments of 5. The y-axis lists reporting methods: ‘Automated reporting developed in-house using ATSPM s report results’ with 4, ‘Automated reporting provided by ATSPM s platforms’ with 8, ‘Manual reporting’ with 4, ‘No aggregation or reporting beyond the intersection level’ with 14, and ‘Other’ with 3. The chart highlights that ‘No aggregation or reporting beyond the intersection level’ is the most utilized method.

Long Description.
The bar chart illustrates various challenges encountered by State Departments of Transportation (DOTs). The horizontal axis represents the number of State DOTs, ranging from 0 to 30 in increments of 5. The vertical axis lists challenges such as ‘Limited staff resources’ with 27 DOTs, ‘Time required for complete configuration’ with 14, and ‘Challenges during the adoption of new technologies’ with 12. ‘Data collection and quality issues’ and ‘Integration with existing signal systems and technologies,’ both at 12, and ‘High upfront costs and ongoing maintenance’ at 10. ‘Others’ and ‘Practical utility of ATSPM reports,’ each with 2, and ‘No challenges’ with 1.
10 DOTs. Fewer DOTs cited the practical utility of ATSPM reports (2) or selected “other” (2), while one agency reported no challenges.
Lastly, the survey asked whether DOTs use SPM solutions for planning purposes. Figure 45 shows the distribution of obtained responses. Out of 35 responding DOTs, 27 reported that they do not currently use SPM solutions for planning projects, which indicates that integration of these tools into broader planning processes is still limited. Among the DOTs that do use SPM solutions for planning purposes, seven indicated supporting future planning by forecasting traffic volumes and trends. Other uses included enhancing multimodal planning through pedestrian and bicycle data (4), prioritizing signal upgrades via infrastructure and resource assessment (4), and collaborating with other DOTs for regional traffic management (4). Also, DOTs noted using traditional ATSPMs to justify projects and funding through evidence-based policy support (3). Two DOTs selected “other” and described the use of traditional ATSPMs for determining construction lane-closure schedules and for origin–destination studies and identifying congestion hot spots.

Long Description.
The bar chart illustrates the number of state Departments of Transportation (DOTs) using SPM solutions for different planning purposes. The horizontal axis represents the number of state DOTs, ranging from 0 to 30 in increments of 5. The vertical axis lists Our DOT does not use ATSPMs for planning purposes yet with 27 DOTs, Supporting future planning by forecasting traffic volumes or trends with 7 DOTs, Prioritizing signal upgrades through infrastructure and resource assessment with 4 DOTs, Collaborating with other agencies for regional traffic management with 4 DOTs, Enhancing multimodal planning by incorporating data on pedestrian and bicycle traffic with 4 DOTs, Justifying projects and funding with evidence-based policy support with 3 DOTs, and Others with 2 DOTs. The data in the graph are provided in descending order.
Systems and Technology
This section presents survey responses related to the technology and systems used to support SPM solutions. Figure 46 shows the distribution of various detection technologies employed by state DOTs to support traditional ATSPMs. Since a single agency may use multiple detection types, the DOTs were allowed to provide more than one response. The most reported technologies were video cameras (26 responses) and radar (25), followed by inductive loop detectors, which were cited by 24 DOTs. Lidar was mentioned by four DOTs. One agency selected “other,” specifying the use of wireless magnetometers and hemispherical cameras, which are technologies that represent alternative or specialized solutions.
Another component to establishing traditional ATSPMs is the presence of communication media. Figure 47 shows the distribution of communication media used for traditional ATSPMs.
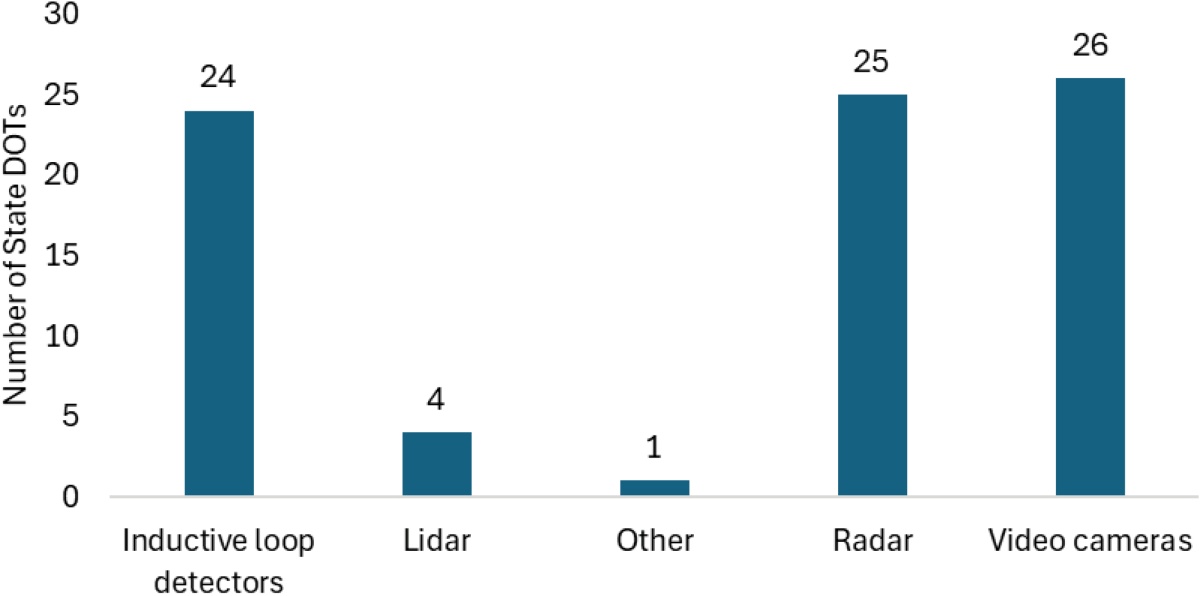
Long Description.
The bar chart illustrates the number of state Departments of Transportation (DOTs) utilizing various detection technologies. The y-axis represents the number of state DOTs, ranging from 0 to 30 in increments of 5. The x-axis lists the technologies: inductive loop detectors, LiDAR, other, radar, and video cameras. Inductive loop detectors are used by 24 state DOTs, LiDAR by 4, other technologies by 1, radar by 25, and video cameras by 26.
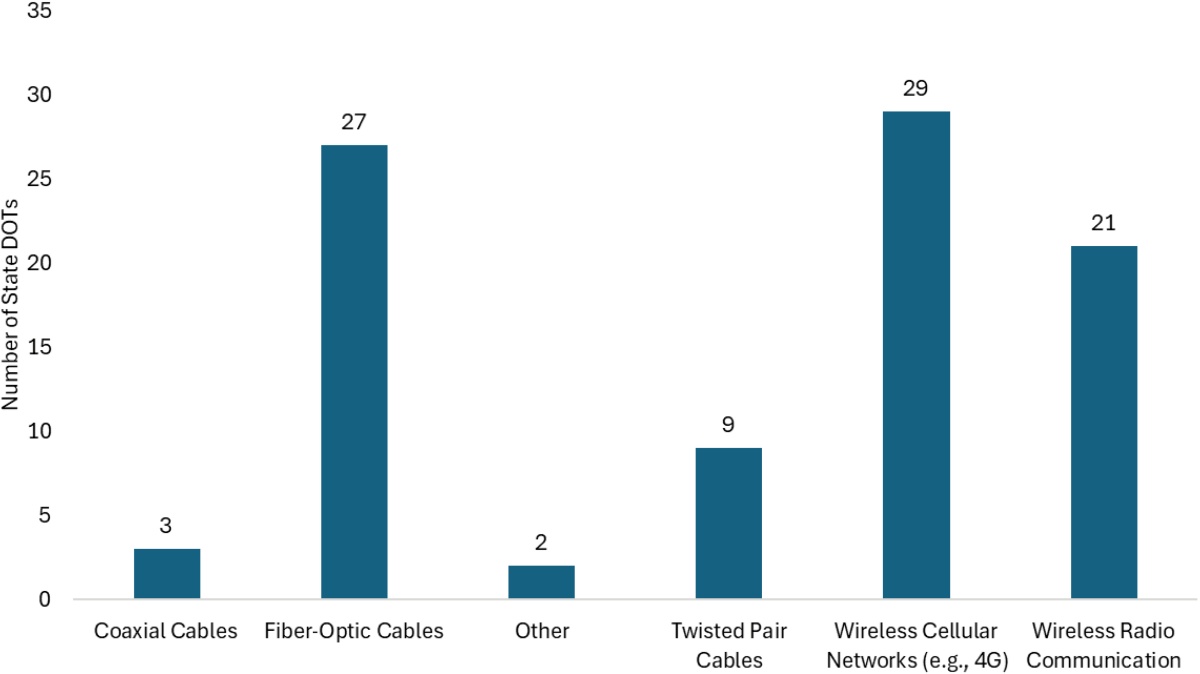
Long Description.
The bar chart illustrates the number of state Departments of Transportation (DOTs) utilizing various communication technologies. The x-axis lists the technologies: Coaxial Cables, Fiber Optic Cables, Other, Twisted Pair Cables, Wireless Cellular Networks (e.g., 4G), and Wireless Radio Communication. The y-axis represents the number of state DOTs, ranging from 0 to 35 in increments of 5. Wireless Cellular Networks are the most used, with 29 DOTs, followed by Fiber Optic Cables at 27, and Wireless Radio Communication at 21. Twisted Pair Cables are used by 9 DOTs, Coaxial Cables by 3, and Other by 2.
The most used communication technology reported by DOTs was wireless cellular networks (such as 4G), which were cited by 29 respondents. Fiber-optic cables were also widely used, with 27 DOTs indicating their deployment. Wireless radio communication followed with 21 responses, showing continued use in field-to-controller and controller-to-central-system communication. Twisted pair cables were used by nine DOTs, while coaxial cables were the least common, reported by three. Two DOTs selected “other” and specified the use of GPS and leased circuits such as multiprotocol label switching (MPLS) and T-1 lines.
Figure 48 shows the distribution of data storage types used by state DOTs. Fourteen DOTs reported using in-house servers to manage and store traditional ATSPM data. Eight DOTs indicated that they rely on cloud-based storage. Twelve DOTs reported using a combination of both in-house and cloud-based storage, which suggests a hybrid approach that balances flexibility with control. One agency reported not using any data storage for traditional ATSPMs.

Long Description.
The bar chart illustrates the number of state Departments of Transportation (DOTs) using various storage types. The vertical axis represents the number of state DOTs, ranging from 0 to 16 in increments of 2. The horizontal axis lists server types: in-house servers, cloud-based, both, and none. In-house servers are used by 14 state DOTs, cloud-based by 8, both by 12, and none by 1.
The survey also asked how long DOTs retain data from their SPM solutions. The responses, shown in Figure 49, indicate that many DOTs do not yet have formalized data-retention practices, with 13 having no data-retention policy in place. Nine DOTs store data for up to several years but not indefinitely. Four DOTs retain data indefinitely, while other DOTs store data for shorter periods: up to 1 year (4), up to 2 years (1), and up to 3 years (2). Two DOTs selected “other,” with one noting that data-retention varies by data type and another indicating that it was unsure of the policy.
Those state DOTs that indicated having a data-retention policy in place were further asked to report what factors influenced their data-retention policy. Please note that agency representatives were allowed to select multiple factors. Figure 50 shows the distribution of factors influencing these policies. Data storage capabilities or limitations were a cited factor, influencing nearly all retention durations, particularly among DOTs storing data for up to 1 year (4), up to 3 years (2), and several years (4). Best practices were also a common driver, especially for DOTs storing data up to several years (5). State regulations were cited, particularly among those storing data up to several years (3) or indefinitely (2). Public records requests appeared to also have impact, influencing one agencyʼs 1-year retention policy. Two DOTs selected “other” and noted either variability based on data type or uncertainty about their policy.

Long Description.
The bar chart illustrates the data retention policies of state Departments of Transportation (DOTs). The horizontal axis represents the number of state DOTs, ranging from 0 to 15 in increments of 5. Categories on the vertical axis include ‘Data stored indefinitely’ with 4 states, ‘Data stored up to several years (not indefinitely)’ with 9 states, ‘Data stored for up to one year’ with 4 states, ‘Data stored for up to two years’ with 1 state, ‘Data stored for up to three years’ with 2 states, ‘No data retention policy in place’ with 13 states, and ‘Other’ with 2 states. The chart highlights that the majority of states have no data retention policy in place.

Long Description.
The bar chart illustrates the number of state Departments of Transportation (DOTs) categorized by data storage duration and criteria. The x-axis represents different storage durations: Data stored indefinitely, Data stored up to several years (not indefinitely), Data stored for up to one year, Data stored for up to two years, Data stored for up to three years, and Other. The y-axis shows the number of state DOTs, ranging from 0 to 6 in increments of 1. Categories include best practices, state regulations, data storage capabilities or limitations, and public records requests. Key data points Data stored indefinitely with 2 DOTs each for Best Practices, State Regulations, and Data Storage Capabilities or Limitations; Data stored up to several years (not indefinitely) with 5 DOTs for Best Practices, 3 DOTs for State Regulations, and 4 DOTs for Data Storage Capabilities or Limitations; Data stored for up to one year with 1 DOT each for Best Practices, State Regulations, and Public Records Request, and 4 DOTs for Data Storage Capabilities or Limitations; Data stored for up to two years with 1 DOT each for State Regulations and Data Storage Capabilities or Limitations; Data stored for up to three years with 1 DOT for Best Practices and 2 DOTs for Data Storage Capabilities or Limitations; and Other with 1 DOT each for Best Practices and State Regulations.
The survey asked the DOTs to select specific security challenges faced during the implementation of traditional ATSPMs. Note that crowdsourced ATSPMs are typically delivered as software-as-a-service. As a result, security concerns are less common, and thus the question is mainly relevant to traditional ATSPMs. Figure 51 shows the distribution of the most frequent responses provided by agency representatives. The most cited challenge was integrating traditional ATSPM systems with existing infrastructure, which was reported by 16 DOTs. Cybersecurity vulnerabilities were noted by nine DOTs. Data privacy concerns were cited by four DOTs. Twelve DOTs reported no significant security challenges. Two DOTs selected “other”—one of these expressed concern about service accessibility and reliability with off-site (cloud) servers, including issues like data accessibility and network prioritization, while the other indicated uncertainty.
Closing Takeaways from the Survey
Lastly, the survey asked the DOT representatives about any final closing observations. Original responses can be found in Appendix B. Based on the responses gathered, several topic areas were identified. The takeaways are presented in the following.
1. Implementation Status and Progress
DOTs are at different stages of implementing traditional ATSPMs. Some, like Indiana DOT (INDOT), are transitioning from custom tools to standardized systems (e.g., UDOT ATSPM Version 5.0) and have extensive statewide signal coverage. Others, such as Montana DOT and Massachusetts DOT, are just beginning their efforts and have pilot corridors or early deployment underway. Consultants have also been engaged in some states (e.g., Utah) to facilitate implementation. While enthusiasm for ATSPMs is high, DOTs often expressed that they are still learning how to best integrate them into their traditional operations.
2. Staffing and Organizational Structure
Organizational structure and staffing resources influence traditional ATSPM adoption. DOTs like Missouri DOT and Alaska DOT illustrate regional disparities in staff capacity and signal coverage, which affect the extent of ATSPM use. In Alaska, for instance, the central region manages the majority of the stateʼs signals. Meanwhile, regions with fewer full-time employees or technical staff face greater challenges. Lack of centralized management (e.g., a traffic management center or trained signal staff) can also hinder planning and implementation, particularly in more rural or decentralized state DOTs.
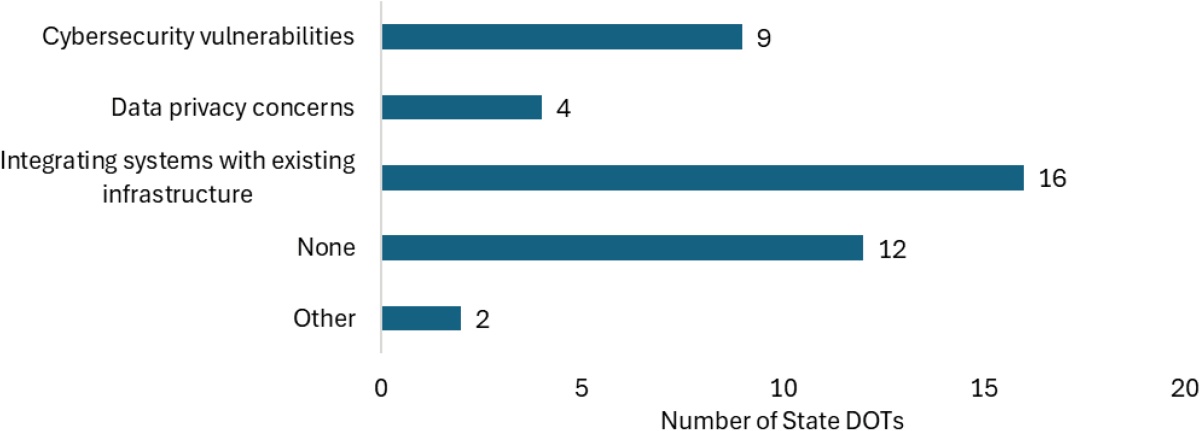
Long Description.
The bar chart illustrates security challenges faced by state Departments of Transportation (DOTs). The horizontal axis represents the number of state DOTs, ranging from 0 to 20 in increments of 5. The vertical axis lists challenges: cybersecurity vulnerabilities, data privacy concerns, integrating systems with existing infrastructure, none, and other. Integrating systems with existing infrastructure is the most reported challenge with 16 DOTs, followed by none with 12, cybersecurity vulnerabilities with 9, data privacy concerns with 4, and other with 2.
3. Infrastructure and Technical Barriers
Several DOTs identified infrastructure as a critical hurdle to deployment of traditional ATSPMs. Washington State DOT, for example, noted that the most substantial barrier is not software or operations, but the need for additional physical infrastructure to support data collection. Rising costs and the need to adopt new devices through various contracts also create complications. Another point raised was the need for guidance on minimum and maximum thresholds for performance measures that define optimal signal operations.
4. Data Usage and Analysis
ATSPM data are being used to varying degrees. Florida DOT (FDOT), for instance, relies on local DOTs for daily review but uses the data for broader trend analysis and project selection. Other DOTs, like those using crowdsourced ATSPMs, have adapted alternative data sources for before/after studies and remote monitoring, citing advantages in cost and granularity but also noting limitations, such as delayed data. Some DOTs distinguish between traditional ATSPMs and crowdsourced ATSPMs, which suggests that different data types may serve different operational purposes. Some states mentioned that, in rural areas, the applicability of crowdsourced ATSPMs can be limited by sample size.
5. Experience Level and Coverage
A number of DOTs reported having limited or no experience with traditional ATSPMs. Some, like Arkansas DOT and New Mexico DOT, have used related technologies or adopted ATSPMs in a limited capacity (e.g., a few corridors or specific measures). Others reported no current use but expressed interest or that they would continue ongoing evaluation.
Key Survey Findings
The objective of the survey was to identify, document, and summarize state DOT practices on planning, management, operation, and maintenance of SPM solutions, and to collect information about deploying agency signal system practices. In this section, key findings from the survey results are summarized.
For deploying state DOTs, the survey identified several key findings:
- Out of the 42 participating state DOTs, 35 (83%) indicated using SPM solutions to manage their traffic signals.
- Of the 35 DOTs that reported using SPM solutions, 19 use only traditional ATSPMs, two use only crowdsourced ATSPMs, and the remaining 14 use both.
- Of the 33 DOTs that reported using traditional ATSPMs, 6 (18% of responding DOTs) noted that almost all traffic signals are within ATSPM reporting capabilities, whereas others indicated deployment in a pilot phase (11 DOTs) or at critical corridors (13 DOTs), both with indication of planned system expansion. The remaining three DOTs reported not being interested in expanding the system.
For planning and funding for SPM solutions, the survey identified the following key findings:
- Of the 35 DOTs surveyed, 13 (37%) implemented SPM solutions through pilot projects, eight (23%) had no formal planning process, five (14%) cited other strategies, four (11%) reported leveraging funding from other projects, three (9%) leveraged existing infrastructure, and two (6%) relied on consultants.
- For initial deployment of traditional ATSPMs, the most reported source was state funds, cited by 26 state DOTs (approximately 78% of all traditional ATSPM-deploying state DOTs). This is followed by federal funding, reported by 21 state DOTs (around 64% of all deploying state DOTs). Other reported funding sources were research grants and innovation funds. DOTs were allowed to select multiple responses.
- For funding sources for future traditional ATSPM initiatives, 26 out of the 33 deploying DOTs (79%) reported relying on a combination of local, state, and federal funds, followed by the use of dedicated budget allocations for technology upgrades, selected by 15 DOTs (about 45%). Eight (24%) reported relying on grant-based funding. DOTs were allowed to select multiple responses.
- For ROI analysis, approximately 70% (or 23 out of 33) reported not conducting an ROI analysis, while 18% (six out of 33) were planning to do so, and the remaining 12% (four out of 33) had completed an ROI analysis.
For staff capabilities, resource allocation, and institutional aspects of the deploying state DOTs, the following findings emerged:
- Among the 35 DOTs deploying SPM solutions, 13 reported limited capability to support traditional ATSPMs with existing staff, 12 reported moderate capability, and 10 reported full capability.
- For crowdsourced ATSPMs, out of 16 DOTs, 10 reported being somewhat equipped, four reported full capability, and two reported limited capability.
- Staffing constraints were the most frequently cited challenge among the DOTs that were not fully equipped to support SPM solutions, followed by training gaps, organizational structure, and limited IT resources.
- Of the 35 state DOTs that deployed SPM solutions, 11 indicated having no staff specifically dedicated to SPM solutions, while eight had fewer than one full-time equivalent assigned.
- Of the six DOTs that classified themselves as full deployers of traditional ATSPMs, two reported less than one FTE dedicated to operations, while the remaining four had one or more FTEs.
- Out of 35 DOTs, 17 (49%) reported not offering formal training on SPM solutions; seven (20%) provided training only for traditional ATSPMs, six (17%) provided training for both types, and three (9%) provided training for crowdsourced ATSPMs only.
Regarding the way SPM solutions are used for signal monitoring, optimization, and performance measurement, the survey identified the following key findings:
- For 35 responding state DOTs, the most reported use cases for SPM solutions were handling public service calls and making signal timing adjustments, each cited by 26 DOTs, followed by 23 DOTs using them for performance monitoring and operations evaluation, and 21 using them for health monitoring and timing review. DOTs were allowed to select multiple responses.
- Of the 33 DOTs using traditional ATSPMs, 26 (79%) reported reviewing performance reports on an ad hoc basis, with very few conducting regular reviews (three DOTs reported daily review, one reported weekly review, one reported monthly review, and two reported yearly review).
- Of the 16 DOTs using crowdsourced ATSPMs, 10 (63%) review reports on an ad hoc basis, while the remaining six engage in more structured review schedules (two daily, two weekly, and two monthly).
- For monitoring infrastructure health alerts from traditional ATSPMs, of the 33 DOTs that deployed traditional ATSPMs, 13 reported daily monitoring, six reported monitoring several times per week, two reported monitoring multiple times per month, and one reported monitoring on a weekly basis. Eight DOTs indicated that they do not actively monitor alerts, and three reported that the function was not applicable.
- Traditional and crowdsourced ATSPMs were both used for intersection-level monitoring; however, reported use of crowdsourced ATSPMs at the corridor and network levels appeared more common among respondents.
- The most frequently reported challenge in adopting proactive signal management with traditional ATSPMs, cited by 27 DOTs (out of 33), was limited staff resources. Time required for full system configuration was noted by 14 DOTs. Other commonly reported challenges were integration with existing signal systems and technologies (12), data collection and quality issues (12), and difficulties related to adopting new technologies (12).
The following key findings emerged related to systems, technologies, and data management supporting SPM solutions:
- For data storage, of the 35 DOTs that responded, 14 reported using in-house servers, eight reported using cloud storage, and 12 reported using a hybrid model. One DOT reported not storing traditional ATSPM data at all.
- Thirteen DOTs reported having no formal data-retention policy in place. Four DOTs retain data indefinitely, while others store data for 1 year (4), 2 years (1), 3 years (2), or several years but not indefinitely (9).


