Coordination of Highway Safety Improvement Program and Highway Safety Office Activities (2026)
Chapter: 2 Literature Review

CHAPTER 2
Literature Review
This chapter presents the results of the review of literature on HSIP and HSO coordination. The existing literature from many different sources (e.g., guidance documents—both general and DOT-specific, research reports, SHSPs, HSIP reports, HSPs, HSO annual reports, and HSO annual grant applications) was reviewed. The chapter explores general and state-specific resources for HSIP and HSO coordination. Tabular summaries of literature and state resources for HSIP and HSO coordination are provided in Appendix D, which can be found by searching nationalacademies.org/publications for NCHRP Synthesis 661.
Although there is much documentation discussing HSIP and HSO resources and practices (both general and state specific), few resources specifically discussing coordination between the HSP and HSO were found. Some of the literature presented here does not directly relate to the scope and objectives of this synthesis but is provided to present the current state of the practice and opportunities for enhanced coordination.
General Literature on HSIP and HSO Coordination
This section provides an overview of the general literature for HSIPs and HSOs and general resources for interagency coordination.
General Literature on HSIPs
HSIP resources and tools are available from FHWA and other entities. FHWAʼs website provides an overview of the HSIP (FHWA 2025b, FHWA 2025c) and links to various HSIP resources, training materials, services, and state HSIP manuals (FHWA 2024). An FHWA brochure presents an overview of HSIP procedures and tools and provides information on four steps for the roadway safety management process: (1) analyze data, (2) identify potential countermeasures, (3) prioritize projects, and (4) select projects (FHWA 2015).
A guidance document on developing HSIP implementation plans is available from FHWA (FHWA 2017). The document provides direction and clarification on requirements for the HSIP implementation plan and covers topics such as schedule and frequency, decision support framework, and content and structure. The document also presents examples for project allocation and a template for developing a project list. An example funding allocation is shown in Figure 1.
Other HSIP resources provide guidance on HSIP self-assessments and evaluating HSIP projects. An HSIP self-assessment tool is available from FHWA (Tang 2015). The tool presents guidance for agencies to conduct HSIP self-assessment based on five primary assessment areas: leadership, administration, planning, implementation, and evaluation. Lowry, Ward, and Brasier (2023) developed a method and a geographic information systems (GIS) tool to help the Idaho Transportation

Long Description.
The flowchart shows two top boxes labeled Hot Spot 50 percent and Systemic 50 percent. A line links these boxes to three lower boxes labeled Roadway Departure 50 percent, Intersection 36 percent, and Bike or Ped 14 percent.
Department (ITD) assess the safety effectiveness of HSIP projects. The GIS tool calculates four safety performance measures based on available data: crash frequency, crash rate, annual economic cost, and severe crash proportion.
Multiple studies have looked at various aspects of HSIP practices. For example, FHWA (2011a) presents case studies from different states on various HSIP-related topics (e.g., revisiting SHSP emphasis areas; HSIP project evaluation; application of HSIP flexible funding provisions; HSIP project identification; SHSP stakeholder involvement; and collection, analysis, and sharing of safety data). An FHWA national scan tour on HSIP conducted in 2016 covered seven states: Alaska, Illinois, Massachusetts, New Hampshire, North Carolina, Oregon, and Utah (Kuznicki et al. 2016). Results from the scan tour showed five HSIP initiatives common to all the states: (1) easy access to crash data and information in crash reports, (2) extensive documentation of screening and project selection processes, (3) opportunities for local involvement and project nominations, (4) high level of use of road safety audits (RSAs), and (5) processes for project evaluation. A peer exchange hosted by Montana DOT (MDT) in 2011 discussed HSIP practices of five rural states (i.e., Idaho, Montana, North Dakota, South Dakota, and Wyoming) related to HSIP development, project prioritization, coordination with local agencies, flexibility, and other topics (FHWA 2011b).
Two NCHRP synthesis projects and a synthesis study from South Dakota DOT investigated DOTsʼ practices for HSIP prioritization, evaluation, and plan integration through literature reviews, DOT surveys, and DOT interviews. NCHRP Synthesis 592 documented DOT practices for the identification, prioritization, and evaluation of HSIP projects (Gross, Zhou, and Brasier 2022). Results uncovered few state DOTs with documented approaches to systemic HSIP projects. Benefit-cost ratio is the most used method for project prioritization, and simple before-and-after study is the most used method for project evaluation. NCHRP Synthesis 631 compiled DOT practices for the integration of federally required performance-based plans (e.g., SHSPs and HSIPs) into state Long-Range Transportation Plans and State Transportation Improvement Programs (STIPs) (Grant et al. 2024). Results indicated that states use various integration practices (e.g., top-down and bottom-up). In addition, many states have developed their own performance measures and use different methods to communicate performance data (e.g., individual performance-based plans, online dashboards, newsletters, and other media). In a research study sponsored by South Dakota DOT, Steever (2022) reviewed DOT practices for evaluating completed HSIP projects and suggested use of (1) Empirical Bayes methods for safety improvements implemented at multiple locations and (2) simple before-and-after analysis in all other cases.
General Literature on HSOs
Various HSO-related resources are available from GHSA and NHTSA. GHSA provides links to HSO webpages (GHSA 2025b) and various HSO-related resources (GHSA 2025a). Users can
search and filter by resource type (e.g., annual reports, newsletters, and state showcases) or topic (e.g., alcohol-impaired driving, distracted driving, and seatbelt use). GHSA has also developed direction on preparing the annual HSO report that includes a checklist and descriptions of required and optional report elements (Mercer Consulting Group LLC 2020). In addition, GHSA presents guidance for agencies interested in partnering with HSOs (GHSA n.d.). Topics covered include an overview of HSOs and their activities, ways agencies can partner with HSOs, and an overview of the grant application system. A checklist for partnering with HSOs is provided.
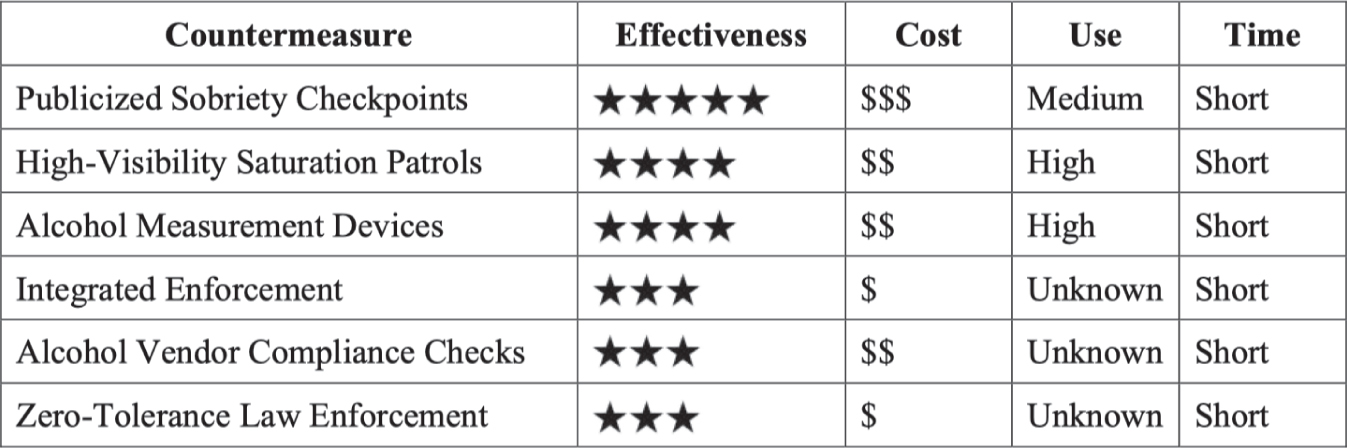
A NHTSA document presents guidance for HSOs in the selection of countermeasures in 11 major areas: alcohol-impaired driving, drug-impaired driving, seat belts and child restraints, speeding and speed management, distracted driving, motorcycle safety, young drivers, older drivers, pedestrian safety, bicycle safety, and drowsy driving (Kirley et al. 2023). Information provided for countermeasures includes descriptions; references to research studies; and summaries of use, effectiveness, costs, and time for implementation. Example information for alcohol-impaired-driving countermeasures for enforcement is shown in Figure 2.
General Literature on Interagency Coordination
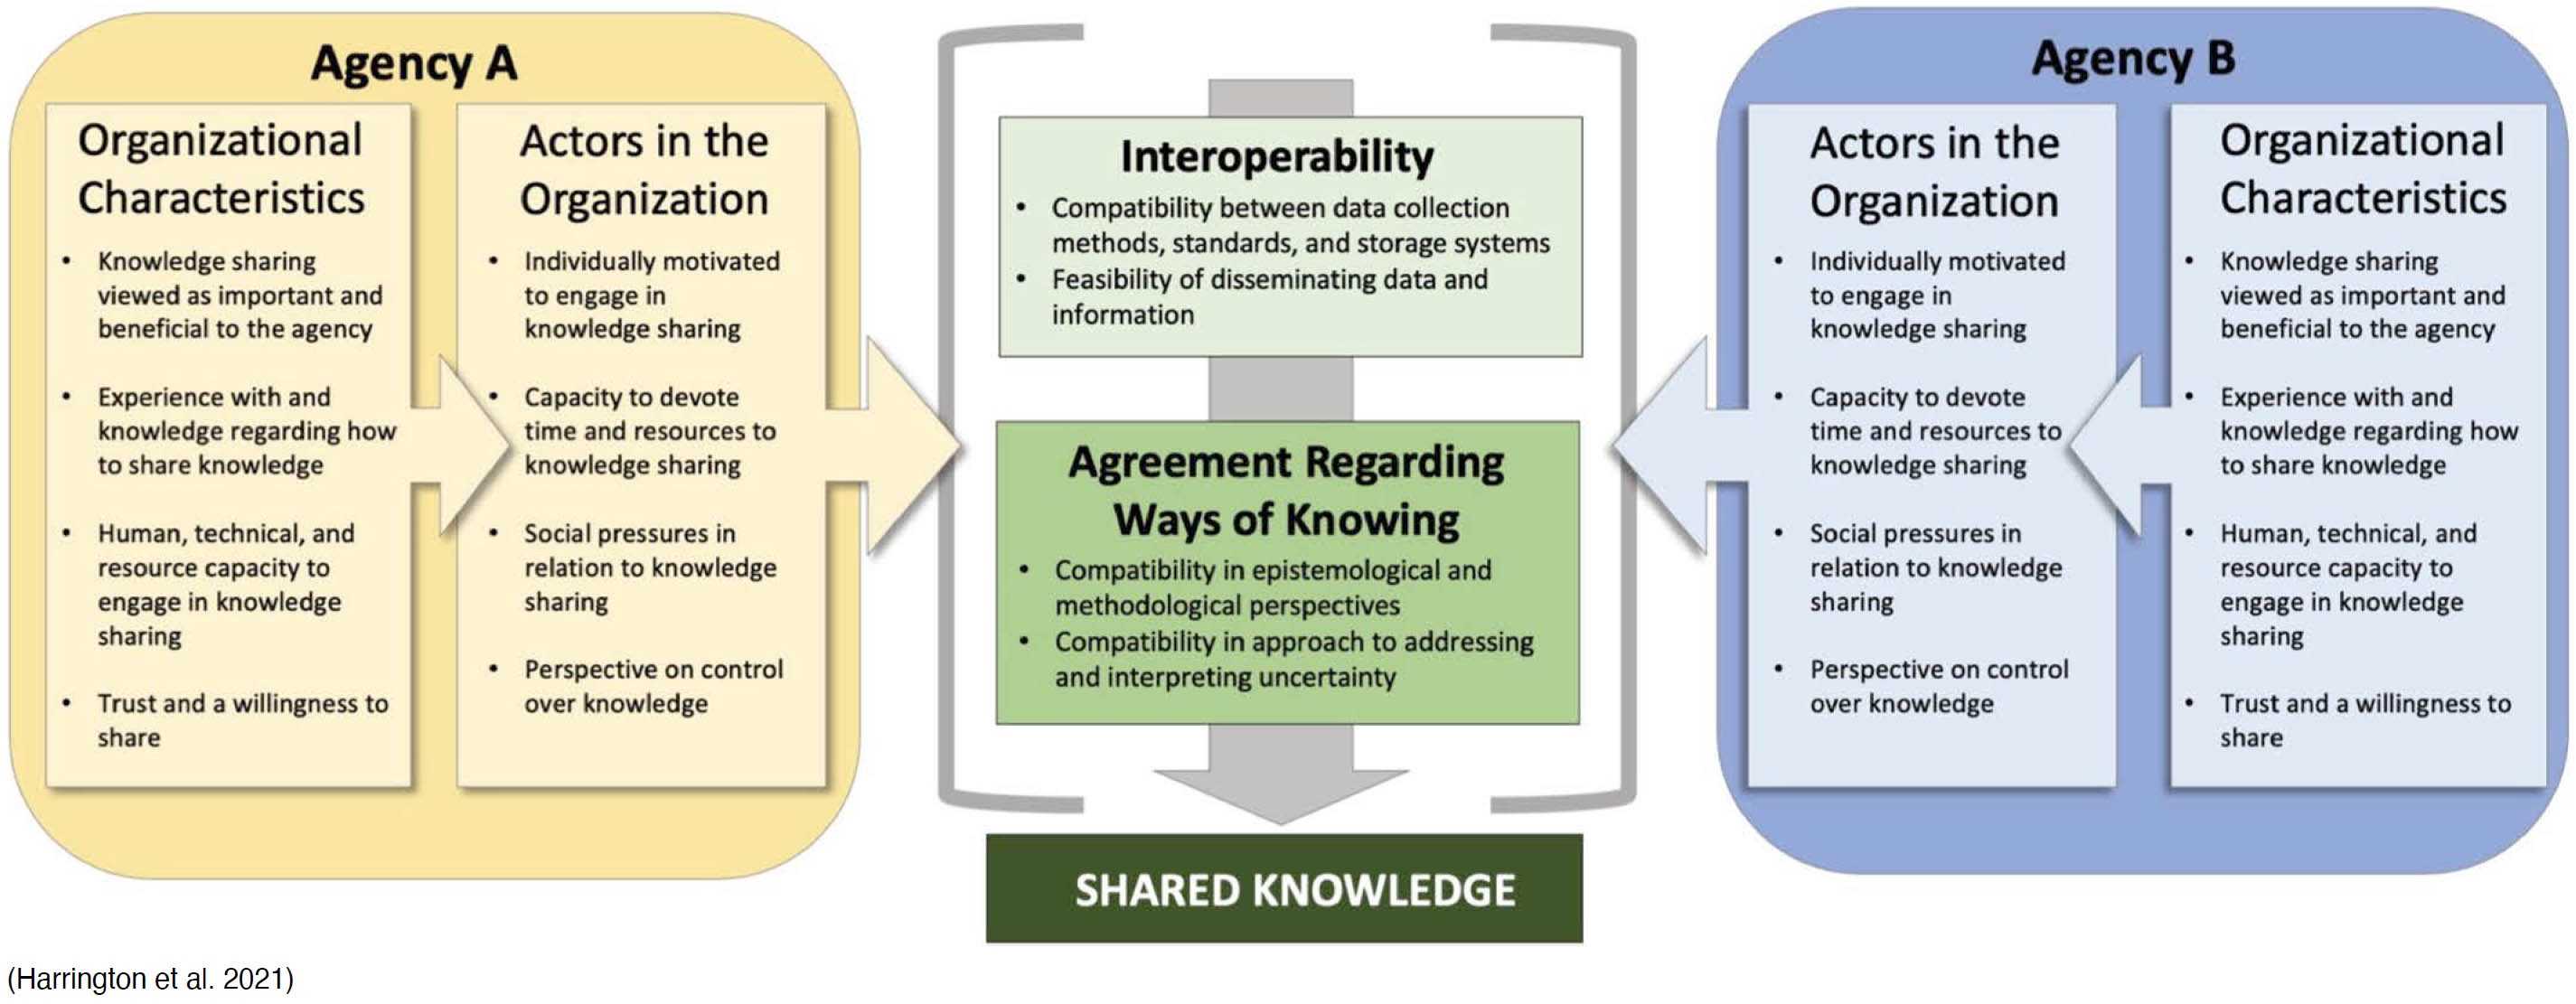
Other resources provide direction on interagency coordination and the sharing of data between agencies. A handbook by Harrington et al. (2021) provides guidance on coordination between agencies. Topics covered include the benefits of coordination, formalizing coordination, coordinating administrative practices, and coordinating knowledge. The handbook notes that coordination can help agencies be more efficient by sharing resources. A graphic showing the factors affecting coordination of knowledge across agencies is presented as Figure 3.
A report from the Chief Data Officer Councilʼs Data Sharing Working Group provides guidance on ways to enhance access to and sharing of data between federal agencies (Ipiotis et al. 2021). Suggestions presented in the report include developing a process for expedited data use agreements and enhancing data awareness and data trustworthiness. Brainstorming sessions were conducted to discuss challenges to data sharing and developing an action plan. A screenshot from the session on the challenges of sharing data is shown in Figure 4.
State Resources on HSIP and HSO Coordination
This section presents the results of the literature review of existing state-specific documents, policies, and guidance for HSIPs and HSOs. Sources compiled for the literature review include SHSPs, HSIP reports, HSPs, HSO annual reports, HSO annual grant applications, and other resources. SHSPs, HSIP reports, and HSPs for each state were reviewed. Tabular summaries of
Long Description.
The table has 5 columns and 7 rows. The column headers in Row 1 are Countermeasure, Effectiveness, Cost, Use, and Time. Row 2: Publicized Sobriety Checkpoints; 5 stars; 3 dollar signs; Medium; Short. Row 3: High Visibility Saturation Patrols; 4 stars; 2 dollar signs; High; Short. Row 4: Alcohol Measurement Devices; 4 stars; 2 dollar signs; High; Short. Row 5: Integrated Enforcement; 3 stars; 1 dollar sign; Unknown; Short. Row 6: Alcohol Vendor Compliance Checks; 3 stars; 2 dollar signs; Unknown; Short. Row 7: Zero Tolerance Law Enforcement; 3 stars; 1 dollar sign; Unknown; Short.
Long Description.
The diagram shows Agency A on the left and Agency B on the right with shared knowledge at the bottom. Agency A includes Organizational Characteristics with points on knowledge sharing viewed as important and beneficial, experience with knowledge sharing, human and technical capacity to engage in knowledge sharing, and trust and willingness to share. Agency A also includes Actors in the Organization with points on individual motivation to engage in knowledge sharing, capacity to devote time and resources to knowledge sharing, social pressures in relation to knowledge sharing, and perspective on control over knowledge. The center section lists Interoperability with points on compatibility between data collection methods, standards, and storage systems and feasibility of disseminating data and information. The center section also lists Agreement Regarding Ways of Knowing with points on compatibility in epistemological and methodological perspectives and compatibility in approach to addressing and interpreting uncertainty. Agency B includes Actors in the Organization with points on individual motivation to engage in knowledge sharing, capacity to devote time and resources to knowledge sharing, social pressures in relation to knowledge sharing, and perspective on control over knowledge. Agency B also includes Organizational Characteristics with points on knowledge sharing viewed as important and beneficial, experience with knowledge sharing, human and technical capacity to engage in knowledge sharing, and trust and willingness to share. All sections point toward the label Shared Knowledge at the bottom followed by the text Harrington et al. 2021.

Long Description.
A set of colored notes, numbered 1 through 24, from a brainstorming session on challenges in sharing data across agencies. Each note contains a short statement and a number. The notes list challenges such as cultural differences in data sharing, lack of centralized memorandum of understanding and memorandum of agreement repositories, time needed to draft and execute data use agreements, privacy and legal concerns, repeated processes, multiple authorities in place, difficulties with secondary use of data, unclear ownership, lack of knowledge about available data, misaligned information systems, slow updating of agreements, limited repositories or inventories, lack of universal data classification, and the need for cost-effective ways to share data. The author details, Ipiotis et al. 2021, appears below the notes.
literature and state resources for HSIP and HSO coordination are provided in Appendix D, which can be found by searching nationalacademies.org/publications for NCHRP Synthesis 661.
Although many states have documentation discussing their SHSP, HSIP, and HSO practices, few resources specifically discuss a stateʼs coordination between the HSIP and HSO. Information summarizing statesʼ SHSP, HSIP, and HSO report components, collaboration efforts, and how the various documents align are discussed in the following sections.
Summary of Information about the DOT SHSP
The SHSP is used to guide safety plans and programs such as the HSIP and HSP (FHWA n.d.). In most instances, both HSIP and HSP strategies and performance measures align with the SHSP. Examples follow:
- In Iowa, SHSP goals align with HSIP performance measures (Iowa DOT 2024).
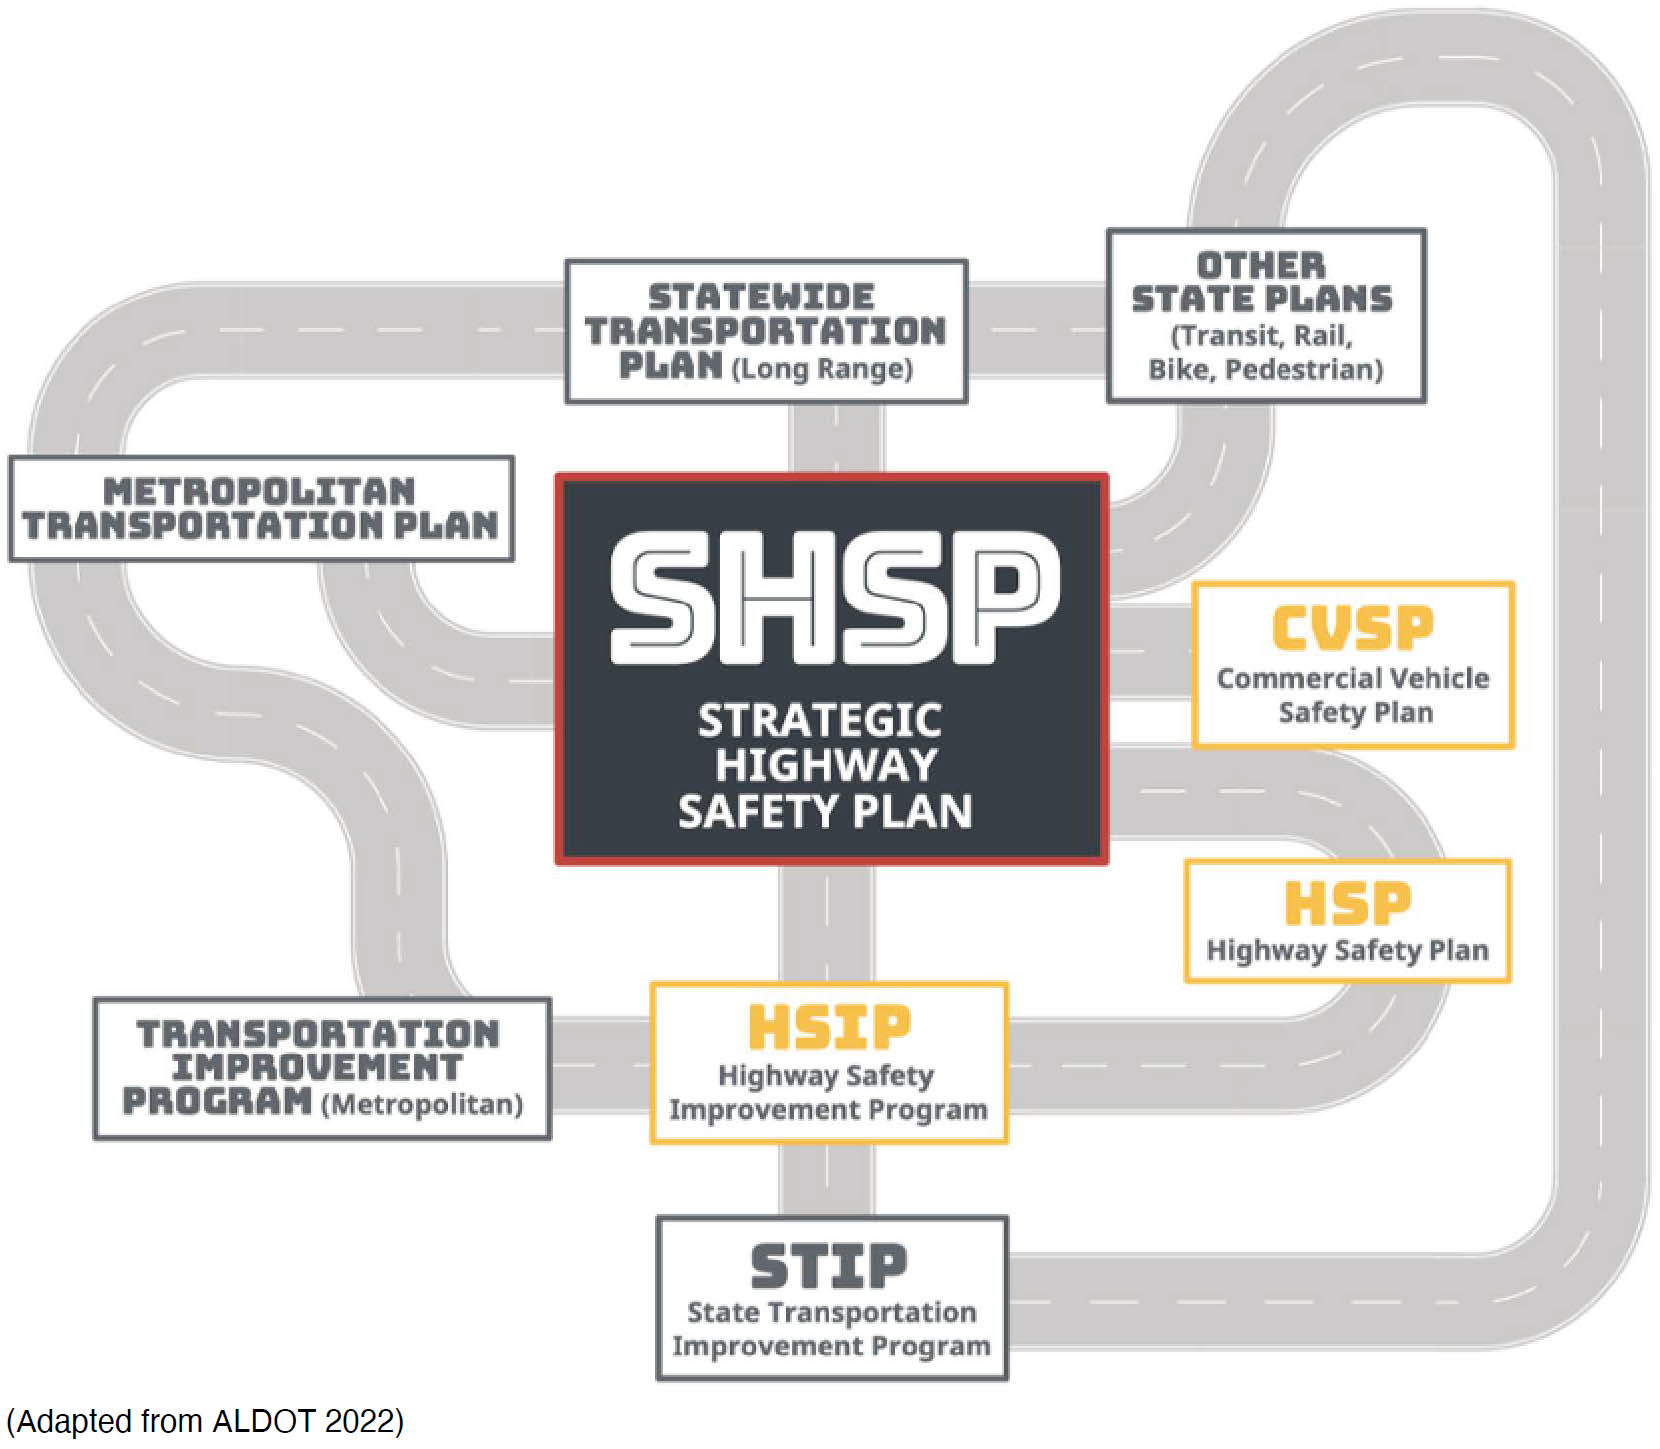
- As shown in Figure 5, Alabamaʼs SHSP coordinates with other safety plans, including the HSIP, HSP, Commercial Vehicle Safety Plan (CVSP), STIP, and others (ALDOT 2022).
- The New Jersey SHSP explicitly states that HSIP projects are consistent with the SHSP (NJDOT 2020).
- Figure 6 demonstrates how safety plans and programs stem from the SHSP in Texas. The Texas SHSP is the overarching plan for the HSIP, HSP, and Traffic Incident Management (TxDOT 2022).
- Figure 7 shows the coordination of safety plans in Delaware (DelDOT 2020).
- Figure 8 shows the relationship between safety plans in Maryland (FHWA 2014).
Long Description.
The diagram shows the Strategic Highway Safety Plan in the center with the label SHSP. Roads connect this central label to several surrounding planning documents. At the top is the Statewide Transportation Plan labeled Long Range. At the top right is Other State Plans labeled Transit, Rail, Bike, Pedestrian. At the top left is the Metropolitan Transportation Plan. At the lower left is the Transportation Improvement Program labeled Metropolitan. At the lower center is the Highway Safety Improvement Program labeled HSIP. At the bottom is the State Transportation Improvement Program labeled STIP. At the bottom right is the Highway Safety Plan labeled HSP. At the middle right is the Commercial Vehicle Safety Plan labeled CVSP. All items connect by roadway paths to the central Strategic Highway Safety Plan. The text, Adapted from Alabama DOT 2022, appears below the diagram.

Long Description.
The diagram shows the Strategic Highway Safety Plan at the top with text on engineering, education, and enforcement and roadway and behavioral factors. Three boxes appear below it. The first box is the Highway Safety Improvement Program labeled HSIP with text on engineering and roadway factors. The second box is the Highway Safety Plan labeled HSP with text on education and enforcement and behavioral factors. The third box is Traffic Incident Management labeled TIM with text on post crash care. Lines link the top box to the three lower boxes. The text Texas DOT 2022 appears below the diagram.

Long Description.
The diagram presents coordinated transportation and safety planning in Delaware. At the center is the Strategic Highway Safety Plan, shown within a ring labeled coordinated transportation and safety planning. Surrounding this central plan are several related statewide and regional plans that contribute to coordinated planning efforts. These include the Statewide Long Range Transportation Plan, MPO Regional Transportation Plans, MPO Transportation Improvement Programs labeled TIPs, the Capital Transportation Program labeled CTP, the Highway Safety Improvement Program labeled HSIP, the Highway Safety Plan labeled HSP, the Commercial Vehicle Safety Plan labeled CVSP, and other state plans and programs. The text Delaware DOT 2020 appears below the diagram.

Long Description.
The diagram shows Maryland’s integration of transportation and safety plans. At the center is the State Strategic Highway Safety Plan labeled SHSP. Several planning documents connect to this plan as part of an integrated process. These include Metropolitan Transportation Plans, the Statewide Transportation Plan labeled Long Range, the Highway Safety Plan labeled HSP, the Commercial Vehicle Safety Plan labeled CVSP, and other state plans such as freight, pedestrian, and bike plans. The Highway Safety Improvement Program labeled HSIP connects to both the SHSP and programming documents. The Transportation Improvement Program labeled Metropolitan links to programming and planning activities. The Statewide Transportation Improvement Program labeled STIP connects these elements at the programming level. A note states that some listed plans are not safety plans but include a safety element. The text FHWA 2014 appears below the diagram.
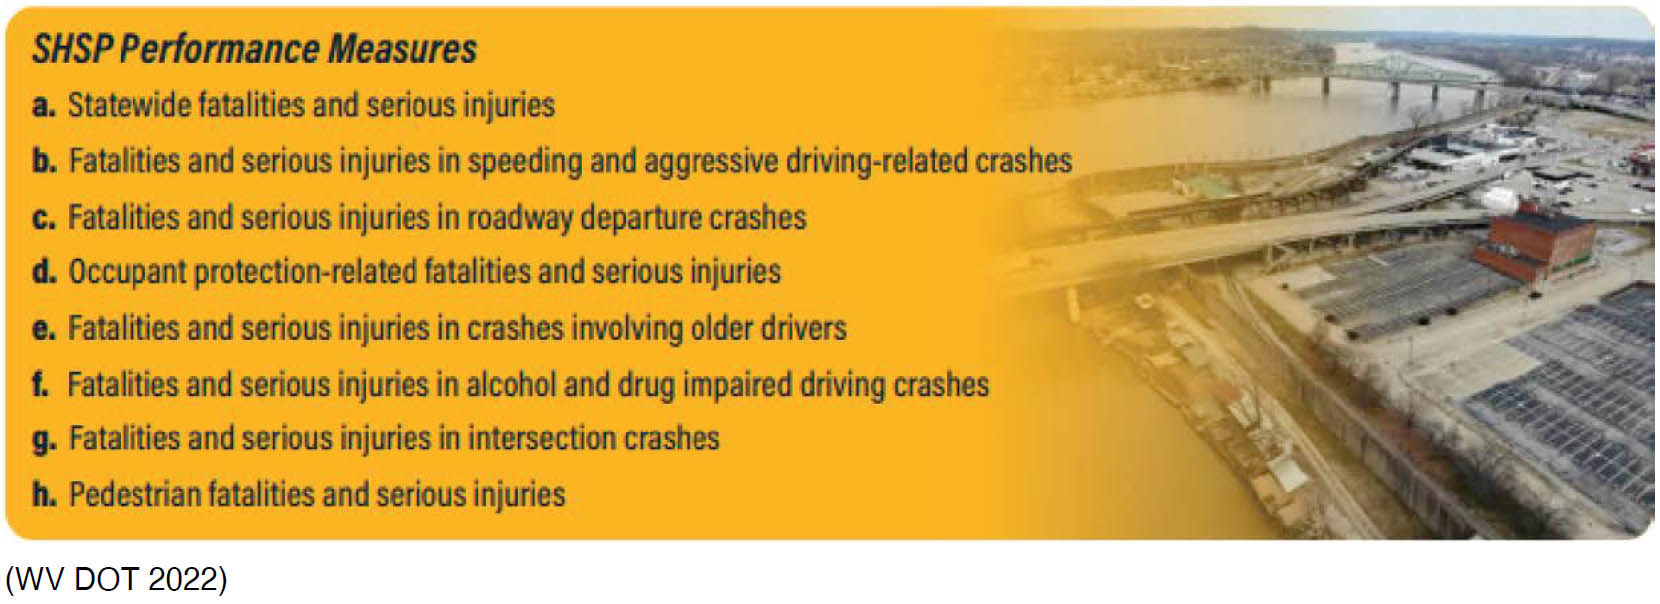
For the HSIP report, states are required to set specific annual performance measures regarding number of fatalities, rate of fatalities per 100 million vehicle miles traveled (VMT), number of serious injuries, rate of serious injuries per 100 million VMT, and number of nonmotorized fatalities and serious injuries combined (FHWA 2018). States are required to report on these measures, however, additional performance measures can be provided. For example, West Virginia has set the performance measures shown in Figure 9 (WV DOT 2022).
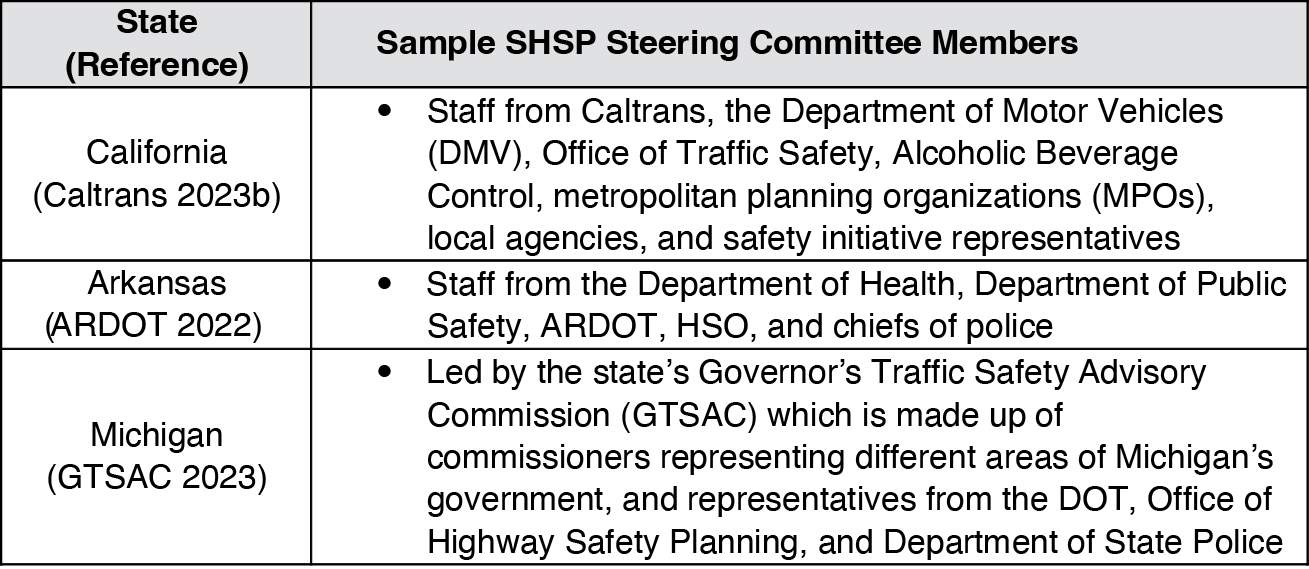
Many states have developed committees to lead their SHSP and other safety plans (see Table 1 for examples).
For several states, developing the SHSP involves collaborating with other stakeholders such as regional metropolitan planning organizations (MPOs) and local municipalities. Examples of stakeholder involvement follow:
- The Nebraska Interagency Safety Committee, which helps develop the Nebraska SHSP, is made up of federal, state, and local agencies (Nebraska DOT 2023c).
- The Washington SHSP is developed using other safety plans from WSDOT, Washington Traffic Safety Commission, and local agencies (Washington Traffic Safety Commission 2024a).
Long Description.
The illustration shows the Strategic Highway Safety Plan performance measures for West Virginia. The list includes statewide fatalities and serious injuries, fatalities and serious injuries in speeding and aggressive driving related crashes, fatalities and serious injuries in roadway departure crashes, occupant protection related fatalities and serious injuries, fatalities and serious injuries in crashes involving older drivers, fatalities and serious injuries in alcohol and drug impaired driving crashes, fatalities and serious injuries in intersection crashes, and pedestrian fatalities and serious injuries. The text West Virginia DOT 2022 appears below.
Long Description.
The table has 2 columns and 4 rows. The column headers in Row 1 are State Reference and Sample SHSP Steering Committee Members. Row 2: California, Caltrans 2023 b; staff from the Department of Transportation, Department of Motor Vehicles, Office of Traffic Safety, Alcoholic Beverage Control, metropolitan planning organizations, local agencies, and safety initiative representatives. Row 3: Arkansas, Arkansas DOT 2022; staff from the Department of Health, Department of Public Safety, Department of Transportation, HSO, and chiefs of police. Row 4: Michigan GTSAC 2023; led by the state Governor’s Traffic Safety Advisory Commission which is made up of commissioners representing different areas of Michigan government and representatives from the Department of Transportation, Office of Highway Safety Planning, and Department of State Police.
- Safety partners responsible for Georgiaʼs HSP, HSIP, CVSP, and MPO safety plans coordinate on developing the SHSP (Georgia GOHS and GDOT 2021).
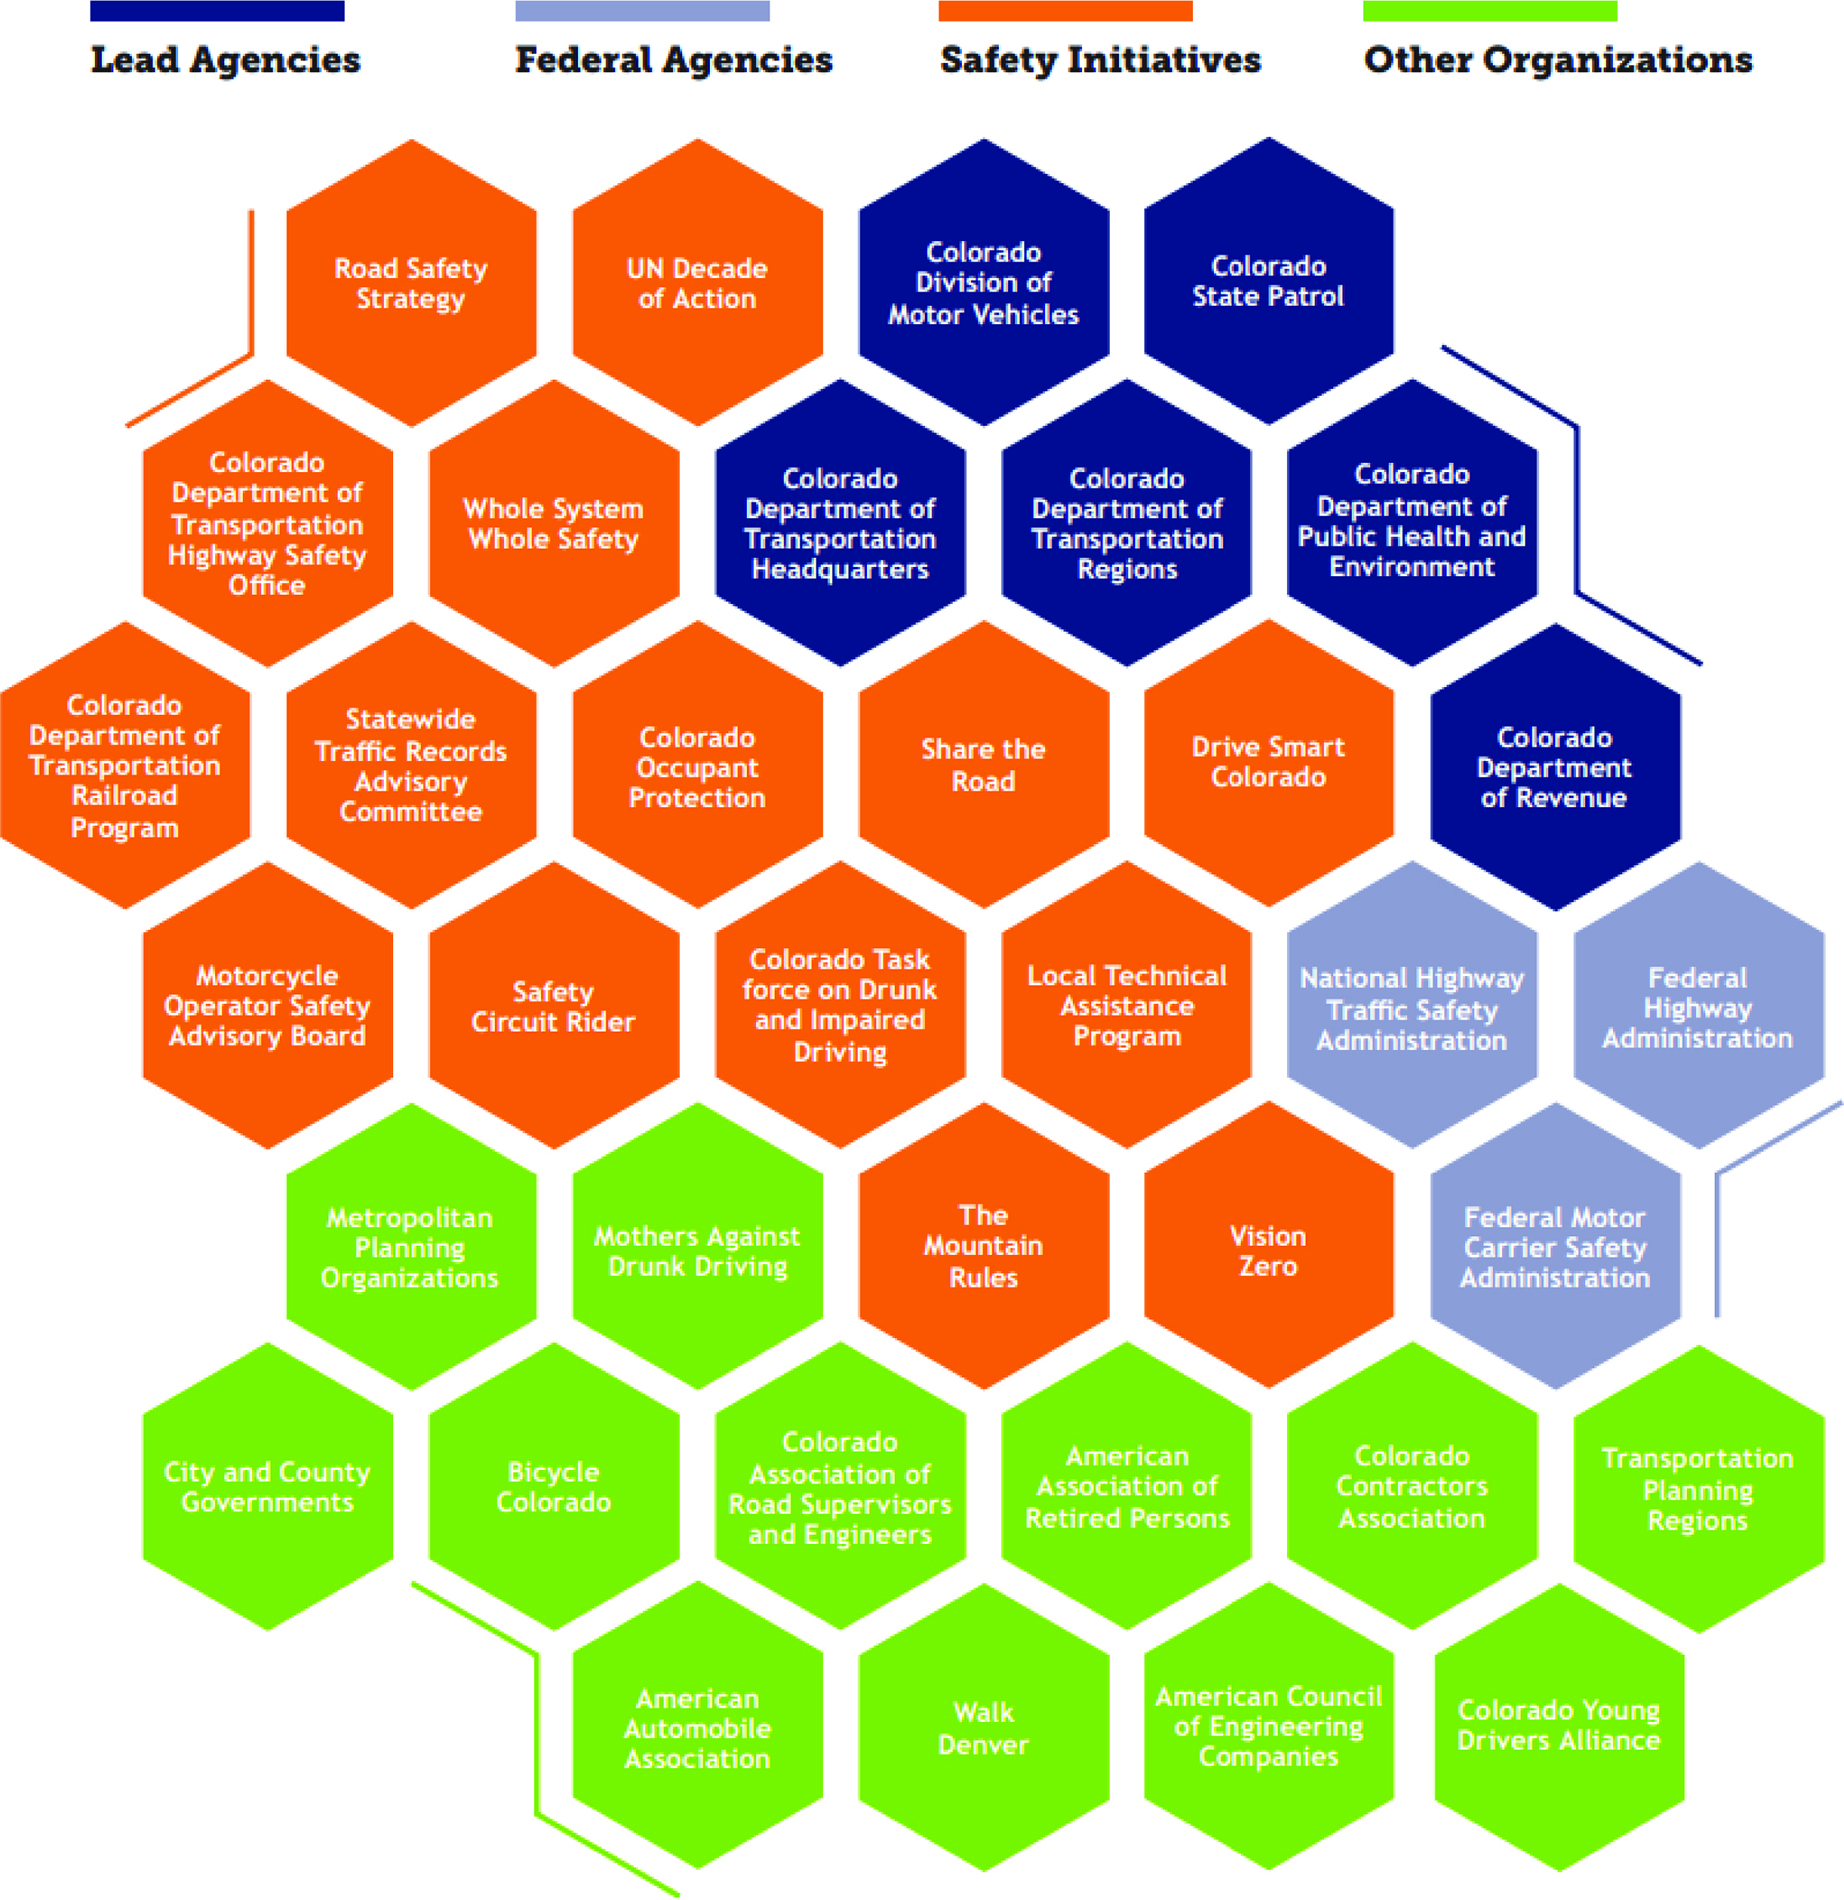
- Figure 10 shows connections among Colorado agencies, initiatives, organizations, and stakeholders (CDOT 2020).
States use emphasis area teams to champion specific safety priority topics and develop strategies. In West Virginia, emphasis area team meetings involve reviewing crash data and developing strategies. The emphasis area team leaders are highway safety partners with expertise in the emphasis area (WV DOT 2022). In Montana, the emphasis area team leaders have extensive knowledge of the emphasis area and ability to lead team meetings (MDT 2020). Maryland emphasis area team heads are from the HSO and help coordinate the emphasis area team (Maryland DOT 2020).
As shown in Figure 11, the Montana Comprehensive Highway Safety Plan (CHSP) has a three-level approach to implementation where emphasis area teams implement the CHSP with oversight by an advisory committee, which then reports to the executive leadership team (MDT 2020). The executive leadership team consists of agency directors from entities such as MDT, Governorʼs Representative for Highway Safety, and Montana Association of Counties. The executive leadership team meets a few times a year to provide leadership in high-level areas. Advisory Committee members include safety partners such as the Montana Division FHWA, Montana Highway Patrol, Department of Public Health and Human Services, and planners from Montana MPOs. Emphasis area team members include staff from city police departments, MDT divisions, and tribal entities.
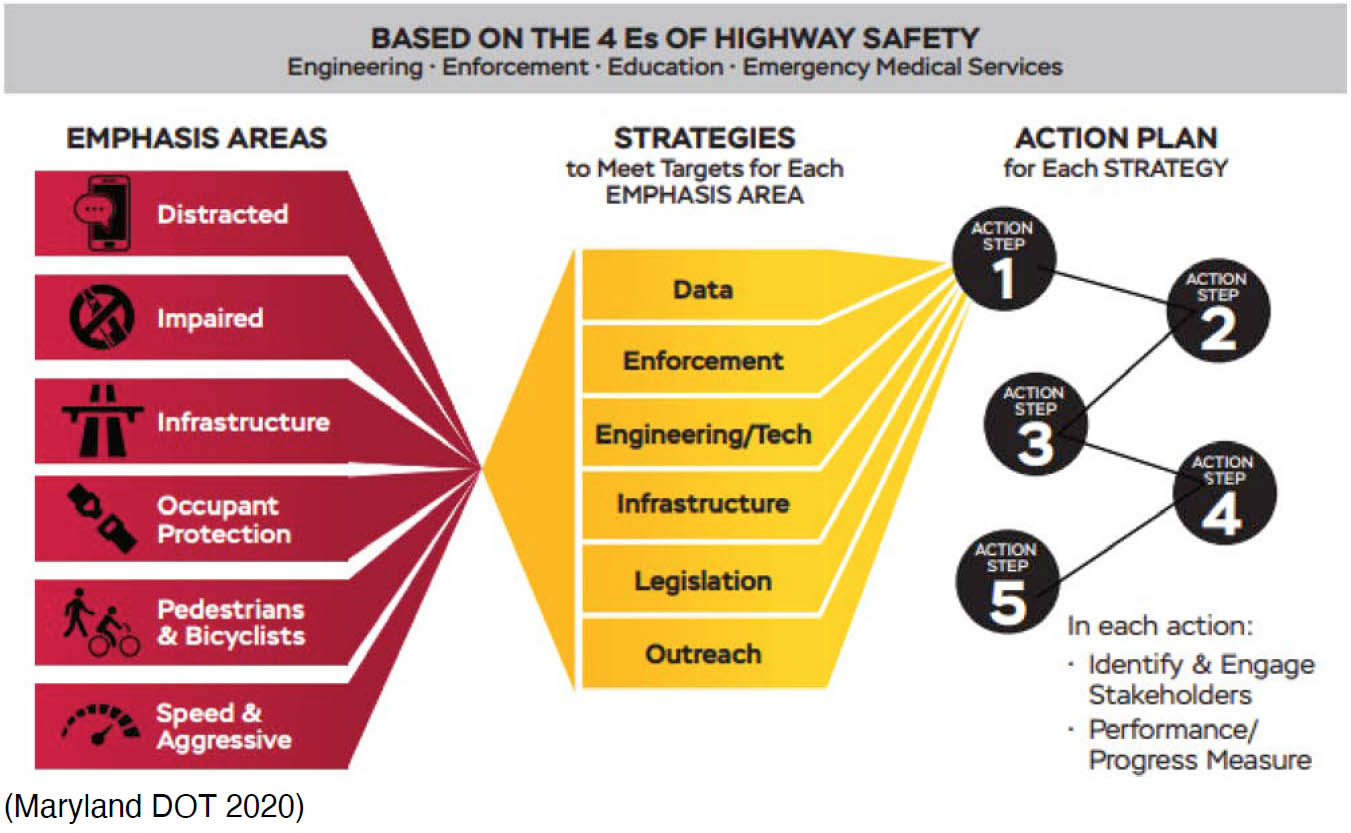
Several states have a consistent process to determine action strategies and items for each emphasis area. The flowchart in Figure 12 shows how Maryland develops core strategies for emphasis area action plans (Maryland DOT 2020). As shown in Figure 13, New York State DOT (NYSDOT) staff use a data-driven process to develop their SHSP (NYSDOT 2023b).
Summary of Information from DOT HSIP Reports
HSIP reports are used to describe (1) the progress being made to implement highway safety improvement projects, (2) improvement effectiveness, and (3) how these improvements have contributed to reducing fatalities and serious injuries (FHWA 2025a).
HSIP staff sit in various DOT divisions such as Operations, Engineering, Planning, Traffic Engineering, Safety, Transportation Systems Management and Operations (TSMO), and Programming. For example, Georgia HSIP staff are in the Operations Division (GDOT 2023), Massachusetts HSIP staff are in Traffic and Safety of the Highway Division (MassDOT 2023c), and Arizona HSIP staff are in the TSMO division (ADOT 2023).
Long Description.
The legend groups Colorado transportation and safety partners into four categories. Lead agencies are Colorado Division of Motor Vehicles, Colorado State Patrol, Colorado Department of Transportation Headquarters, Colorado Department of Transportation Regions, Colorado Department of Public Health and Environment, and Colorado Department of Revenue. Federal agencies are National Highway Traffic Safety Administration, Federal Highway Administration, and Federal Motor Carrier Safety Administration. Safety initiatives are Road Safety Strategy, Colorado Department of Transportation Highway Safety Office, Colorado Department of Transportation Railroad Program, Motorcycle Operator Safety Advisory Board, Whole System Whole Safety, Statewide Traffic Records Advisory Committee, Safety Circuit Rider, Colorado Occupant Protection, Colorado Task Force on Drunk and Impaired Driving, Share the Road, Local Technical Assistance Program, The Mountain Rules, Vision Zero, Drive Smart Colorado, and UN Decade of Action. Other organizations are metropolitan planning organizations, city and county governments, Bicycle Colorado, Mothers Against Drunk Driving, Colorado Association of Road Supervisors and Engineers, American Association of Retired Persons, American Automobile Association, Walk Denver, American Council of Engineering Companies, Colorado Contractors Association, Colorado Young Drivers Alliance, and transportation planning regions.

Long Description.
The diagram shows a three level implementation approach for the Montana Comprehensive Highway Safety Plan. A large triangle contains three labeled levels. The top level is the Executive Leadership Team. The middle level is the Advisory Committee. The bottom level is the Emphasis Area Teams. The text Montana DOT 2020 appears below the diagram.
Long Description.
The diagram shows Maryland’s Strategic Highway Safety Plan action plan structure. Emphasis areas appear on the left and include distracted, impaired, infrastructure, occupant protection, pedestrians and bicyclists, and speed and aggressive. These emphasis areas connect to strategies used to meet targets. The strategies listed are data, enforcement, engineering and technology, infrastructure, legislation, and outreach. Each strategy leads to an action plan made up of five action steps labeled step 1 through step 5. The diagram notes that each action step includes identify and engage stakeholders and performance and progress measure. The text Maryland DOT 2020 appears below the diagram.

Long Description.
The diagram shows the New York State Strategic Highway Safety Plan framework. Vision and performance targets appear at the top, with the principle of equity shown to the right. Below this, a series of emphasis areas is displayed. These emphasis areas are intersections, vulnerable road users, roadway departures, age related, road user behaviors, aggressive driving, and alternate road vehicles and commercial vehicles. These emphasis areas connect downward to strategies and then to proposed actions. A section on additional safety opportunities appears on the left and lists safer vehicles, post crash care, and data. A label on the right states data driven analysis. The text New York State DOT 2023 b appears below the diagram.
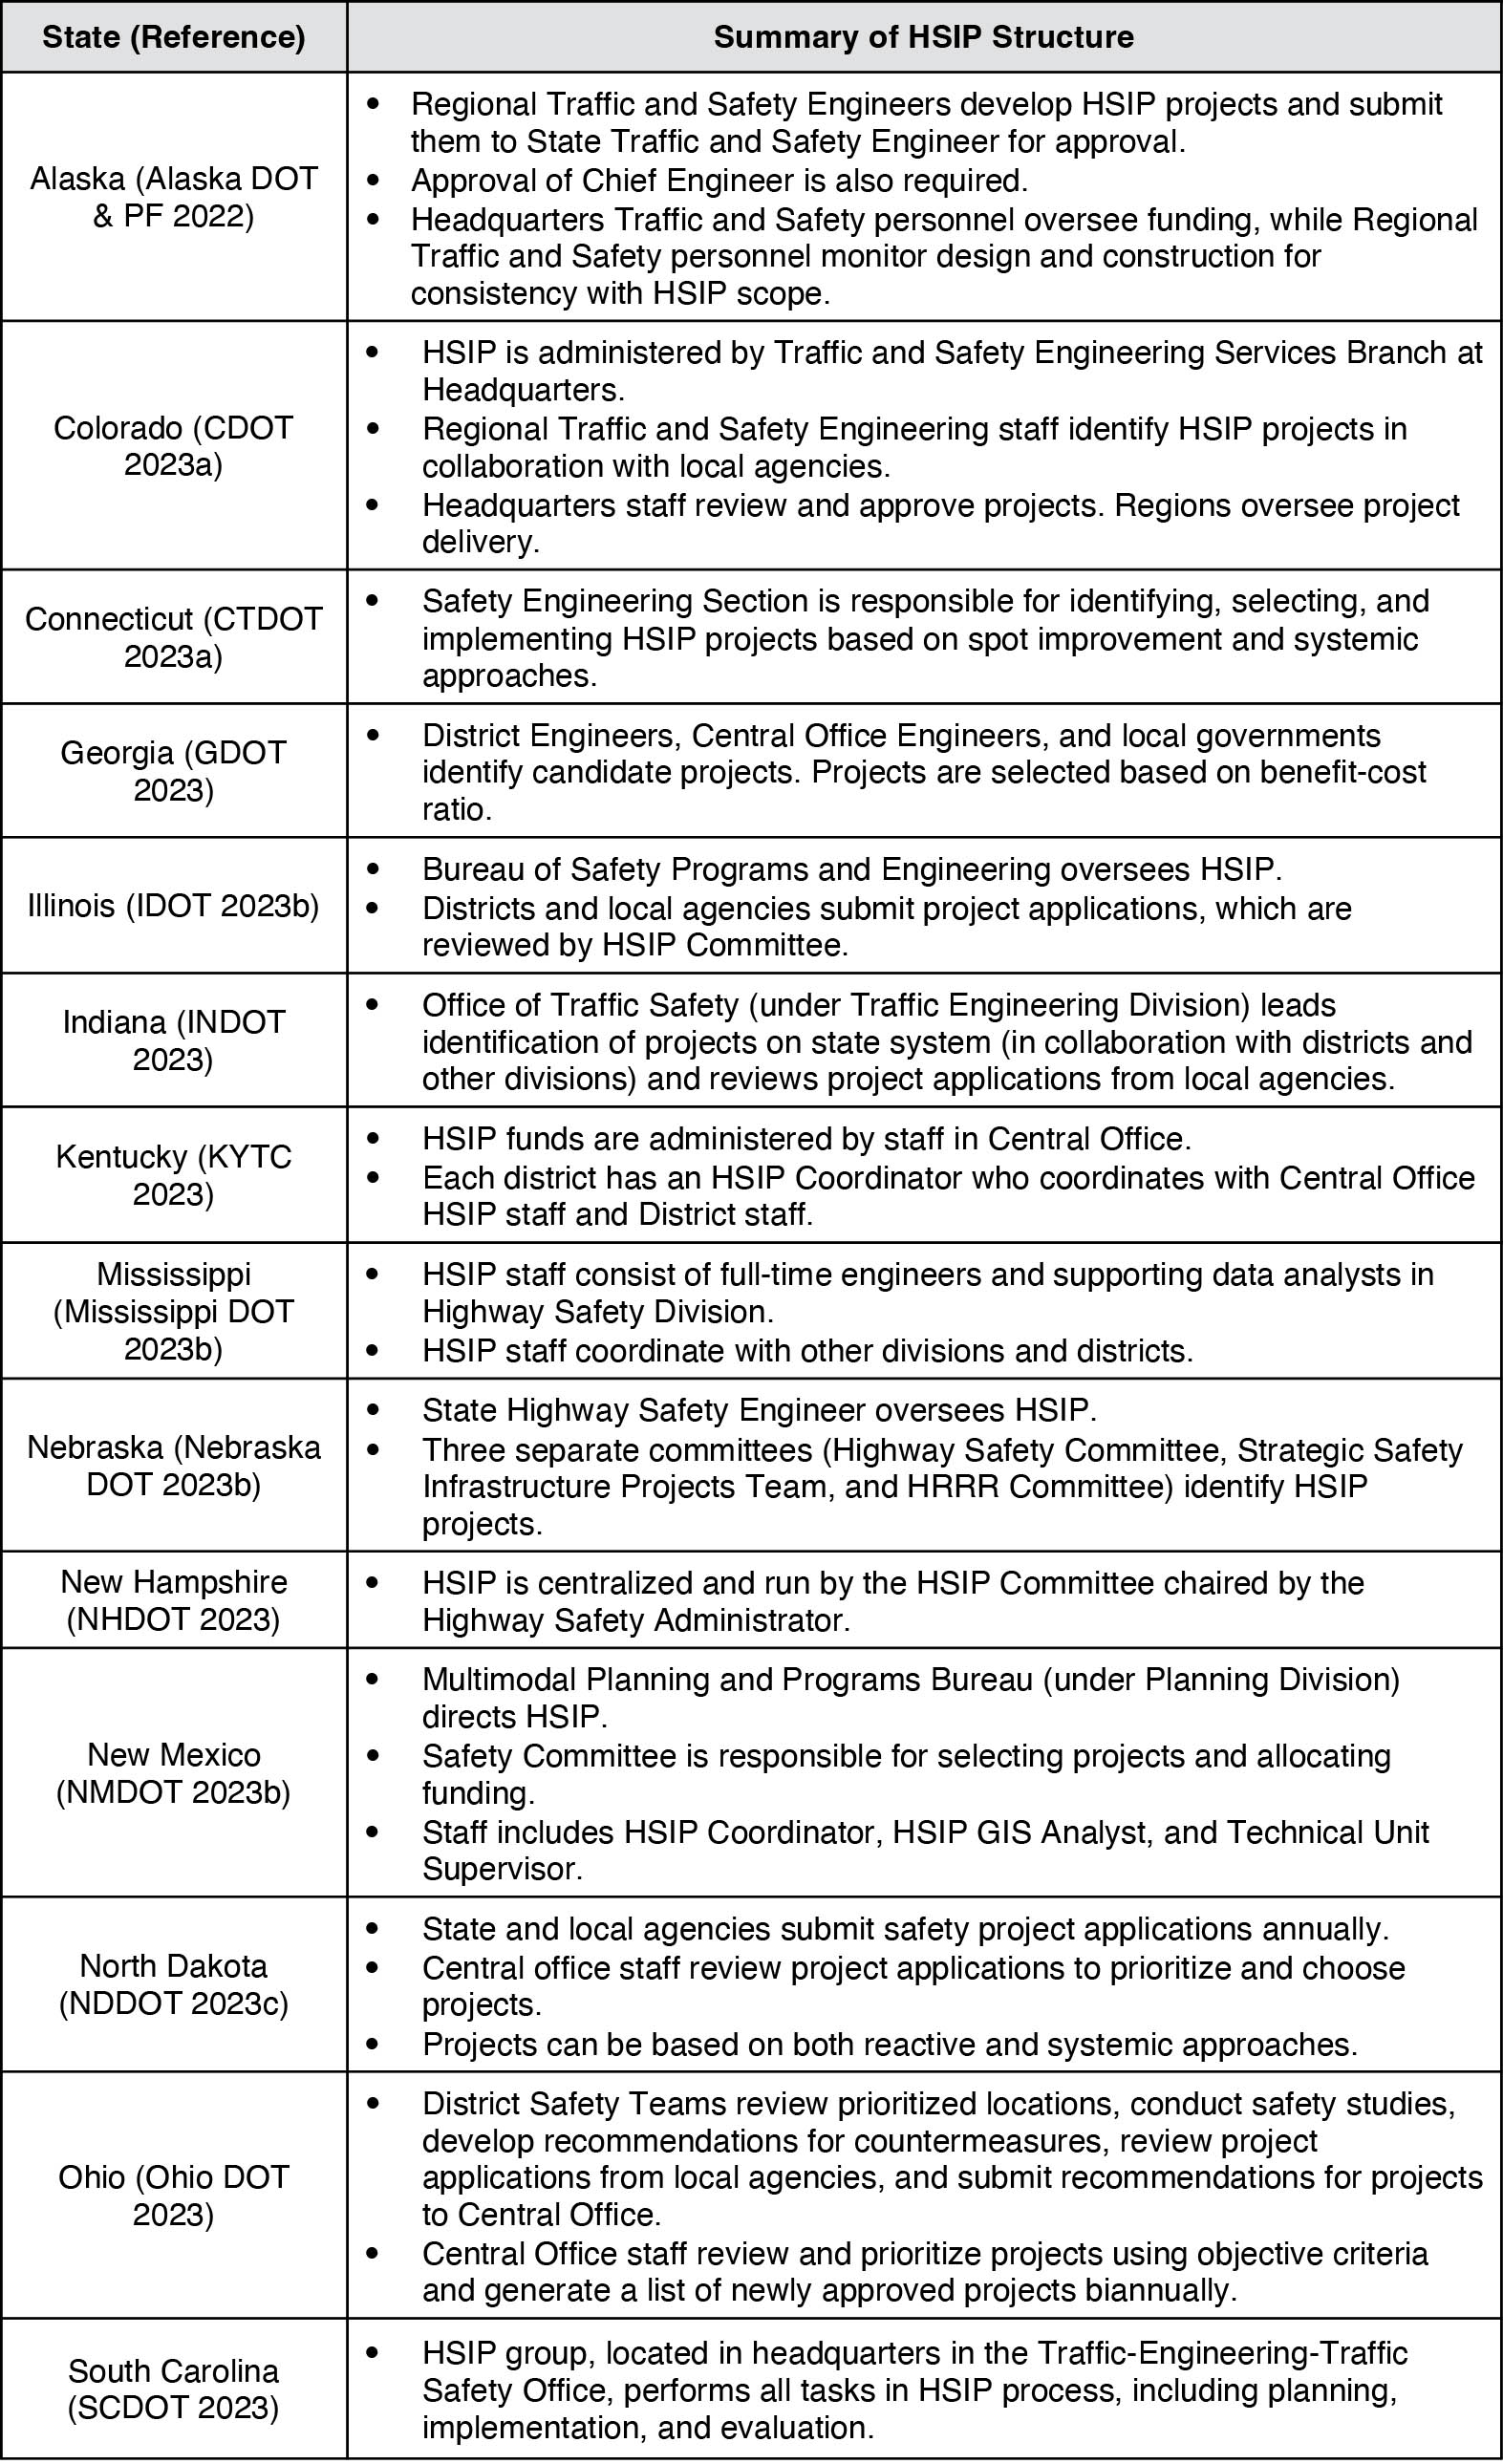
As shown in Table 2, DOTs use a wide range of structures for their HSIPs, with differences in the extent of centralization and use of staff. Example DOT approaches to HSIP structure include highly centralized, use of collaborative efforts between personnel in central office and regions or districts, use of committees, and dedicating staff for the HSIP.
Some HSOs are involved in HSIP reporting. Examples of HSIP reporting coordination efforts are summarized in Table 3.
A wide range of internal and external partners participate in HSIP planning and programming. External partners include local governments, MPOs, law enforcement, academia, tribal agencies, and federal partners (e.g., FHWA and NHTSA). State examples of partner involvement follow:
- Marylandʼs Governors Highway Safety Office (GHSO) is identified as an internal partner for HSIP planning. External partners include academia, FHWA, law enforcement, local agencies, regional planning organizations (RPOs), and other entities (Maryland DOT 2023a).
- The NHDOT HSIP committee holds monthly meetings with internal and external partners. Internal partners include design, GHSO, maintenance, operations, planning, and traffic engineering. External partners include academia, FHWA, law enforcement agencies, local governments, Local Technical Assistance Program (LTAP) representatives, and RPOs (NHDOT 2023).
- In Vermont, the Safety Working Group brings together internal partners such as the HSO on a bimonthly basis to discuss projects and grant administration (VTrans 2023).
- In the District of Columbia, DDOT conducts weekly “SafetyStat” meetings to bring together various DOT divisions to discuss and organize safety projects. Additionally, weekly Ward-based meetings are held to provide updates on project design and construction (DDOT 2023).
- In Arizona, ADOT coordinates with external stakeholders through their involvement in MPO safety meetings, workshops, and advisory groups (ADOT 2023).
- In Hawaii, HDOT engages with police officers during field investigations of potential HSIP project locations to provide HDOT with knowledge of the area and potential improvements (HDOT 2023b).
- In California, Caltrans is developing a strategy to engage stakeholders in HSIP and SHSP implementation and set performance targets (Caltrans 2023a).
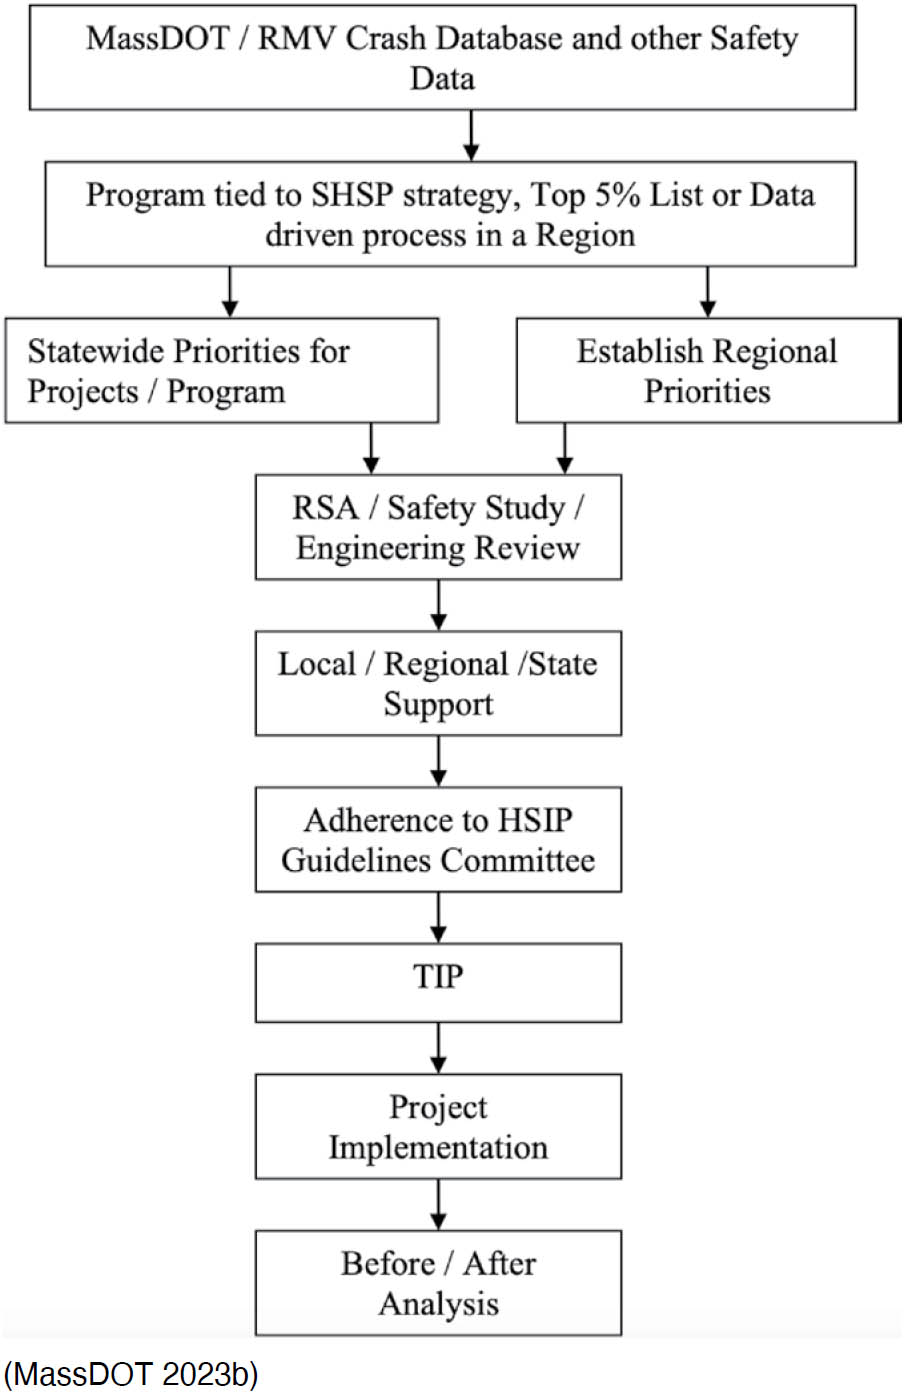
States use various methods to select projects for HSIP funding. Various divisions within NYSDOT are part of the Safety System and Optimization Team which provides guidance for HSIP projects (NYSDOT 2023a). In Ohio, applications for HSIP-funded projects are submitted by the DOT districts and then reviewed and selected by the Safety Review Committee (Ohio DOT 2023). In Texas, TxDOT coordinates with districts and planning to evaluate HSIP projects and finance to ensure targets are being met, such as vulnerable road user (VRU) Special Rule requirements (TxDOT 2023a). In Maine, staff assess their HSIP selection process annually to help enhance coordination with SHSP (MaineDOT 2023). Figure 14 shows the HSIP project selection process for MassDOT (MassDOT 2023b).
States use tools such as GIS crash analysis platforms and project screening frameworks to identify safety concerns. Examples follow:
- The Iowa DOT developed their own publicly available GIS-based Iowa Crash Analysis Tool (Iowa DOT 2023).
- Both Montana and Georgia use a crash analysis software from AASHTO (MDT 2023a, GDOT 2023).
- In Oregon, the state DOT determines HSIP projects by using their All Roads Transportation Safety (ARTS) program. The ARTS program ranks projects using data analysis. The Highway Safety Engineering Committee meets to coordinate the ARTS program. The committee consists
(continued on next page)
Long Description.
The table has 2 columns and 18 rows. The column headers in Row 1 are State Reference and Summary of HSIP Structure. Row 2: Alaska, Alaska DOT and PF 2022; regional traffic and safety engineers develop HSIP projects and submit them to the state traffic and safety engineer for approval. Approval of the chief engineer is also required. Headquarters traffic and safety personnel oversee funding while regional traffic and safety personnel monitor design and construction for consistency with HSIP scope. Row 3: Colorado, Colorado DOT 2023a; HSIP is administered by the traffic and safety engineering services branch at headquarters. Regional traffic and safety engineering staff identify HSIP projects in collaboration with local agencies. Headquarters staff review and approve projects and regions oversee project delivery. Row 4: Connecticut, Connecticut DOT 2023 a; the safety engineering section is responsible for identifying, selecting, and implementing HSIP projects based on spot improvement and systemic approaches. Row 5: Georgia, Georgia DOT 2023; district engineers, central office engineers, and local governments identify candidate projects and projects are selected based on benefit-cost ratio. Row 6: Illinois, Illinois DOT 2023 b; the Bureau of safety programs and engineering oversees HSIP. Districts and local agencies submit project applications which are reviewed by the HSIP committee. Row 7: Indiana, Indiana DOT 2023; the office of traffic safety under the traffic engineering division leads identification of projects on the state system in collaboration with districts and other divisions and reviews project applications from local agencies. Row 8: Kentucky, Kentucky Transportation Cabinet 2023; HSIP funds are administered by staff in central office. Each district has an HSIP coordinator who coordinates with central office HSIP staff and district staff. Row 9: Mississippi, Mississippi DOT 2023 b; HSIP staff consist of full time engineers and supporting data analysts in the highway safety division. HSIP staff coordinate with other divisions and districts. Row 10: Nebraska, Nebraska DOT 2023 b; the state highway safety engineer oversees HSIP. Three separate committees, the highway safety committee, the strategic safety infrastructure projects team, and the HRRR committee, identify HSIP projects. Row 11: New Hampshire, New Hampshire DOT 2023; HSIP is centralized and run by the HSIP committee that is chaired by the highway safety administrator. Row 12: New Mexico, New Mexico DOT 2023 b; the multimodal planning and programs bureau under the planning division directs HSIP. The safety committee is responsible for the selection of projects and allocation of funding. Staffing includes the HSIP coordinator, HSIP geographic information systems analyst, and technical unit supervisor. Row 13: North Dakota, North Dakota DOT 2023 c; state and local agencies submit safety project applications annually. Central office staff review project applications to prioritize and choose projects. Projects can be based on both reactive and systemic approaches. Row 14: Ohio, Ohio DOT 2023; district safety teams review prioritized locations, conduct safety studies, develop recommendations for countermeasures, review project applications from local agencies, and submit recommendations for projects to central office. Central office staff review and prioritize projects using objective criteria and generate a list of newly approved projects biannually. Row 15: South Carolina, South Carolina DOT 2023; the HSIP group located in headquarters in the traffic engineering traffic safety office performs all tasks in the HSIP process including planning, implementation, and evaluation.

Long Description.
The table has 2 columns and 18 rows. The column headers in Row 1 are State Reference and Summary of HSIP Structure. Row 16: Utah, Utah DOT 2023; the safety programs engineer within the traffic and safety division oversees HSIP. Region offices collaborate with the traffic and safety division to help identify potential projects, review local project applications, submit applications for HSIP funding, and evaluate and prioritize projects. Region offices are responsible for project delivery after projects are chosen and funded. Row 17: Vermont, VT Trans 2023; HSIP is centralized. HSIP identifies possible projects based on an assessment of high-crash locations. Senior management personnel review lists of recommended projects to determine if they should proceed to scoping or design. Row 18: Virginia, Virginia DOT 2023; central office staff oversee the HSIP process and undertake network screening, scoring, and selection of HSIP systemic improvement projects. District personnel further screen selected HSIP projects based on data driven analysis and local knowledge. HSIP staff monitor HSIP projects from scoping through construction and closeout.

Long Description.
The table has 2 columns and 7 rows. The column headers in Row 1 are State Reference and Summary of HSIP Reporting Coordination. Row 2: Alaska, Alaska DOT and PF 2022; the HSO helps establish targets and an analyst from the HSO attends all HSIP meetings and assists with data analysis. Row 3: Connecticut, Connecticut DOT 2023 a; the HSO and HSIP staff meet to develop HSIP safety performance measures. Row 4: North Dakota, North Dakota DOT 2023 c; the HSO leads the SHSP and the Department of Transportation coordinates with the HSO in the selection of projects for HSIP funding. Row 5: Florida, Florida DOT 2023; the Department of Transportation coordinates with various stakeholders such as the Department of Highway Safety and Motor Vehicles, Rail Enterprise, and the Federal Highway Administration to establish performance measures. Row 6: Alabama, Alabama DOT 2023; the Department of Transportation and the Department of Economic and Community Affairs collaborate to develop statewide safety performance targets and submit these targets to metropolitan planning organizations for approval. Row 7: Nebraska Nebraska DOT 2023 c; the Department of Transportation traffic engineering division houses both the HSP and HSIP and facilitates coordination and setting of performance targets with input from metropolitan planning organizations.
- of staff from the Transportation Safety Division, Region and Headquarters Traffic, Regional Technical Centers, Transportation Development, Maintenance, Federal Highway, Transportation Safety, Roadway Section, and Association of Oregon Counties (Oregon DOT 2023).
Summary of Information from HSPs
HSPs document the respective Stateʼs highway safety program. HSPs include establishing performance measures and selecting countermeasures to meet the set performance measures (National Archives 2025).
Different states house HSPs in different departments (e.g., HSOs, DOTs, and GHSOs). For example, the Utah Department of Public Safety HSO houses the HSP (Utah Department of Public Safety 2023b), the Missouri Department of Transportation (MoDOT) houses their HSP (MoDOT
Long Description.
The flowchart shows the Highway Safety Improvement Program project selection process for Massachusetts. It begins with Mass DOT and RMV crash database and other safety data. The next step is a program tied to the Strategic Highway Safety Plan strategy, the top 5 percent list, or a data driven process in a region. Two paths appear: statewide priorities for projects or program and establish regional priorities. These paths join at RSA, safety study, and engineering review. The next steps are local, regional, and state support; adherence to HSIP guidelines committee; Transportation Improvement Program; project implementation; and before and after analysis. The text, Massachusetts DOT 2023 b, appears below the diagram.
2023b), and West Virginiaʼs Division of Motor Vehicles GHSO is responsible for the HSP (West Virginia Governorʼs Highway Safety Program 2023). The Massachusetts Office of Grants and Research prepared the HSP (Massachusetts Office of Grants and Research 2023). Idahoʼs Office of Highway Safety (OHS) is responsible for their HSP. Figure 15 shows the Idaho OHS organizational chart (ITD 2023c).
Many HSPs note explicit coordination with their SHSP and HSIP during the development of the HSP. Coordination often involves data sharing, stakeholder engagement, and aligned program areas. Examples of coordination follow:
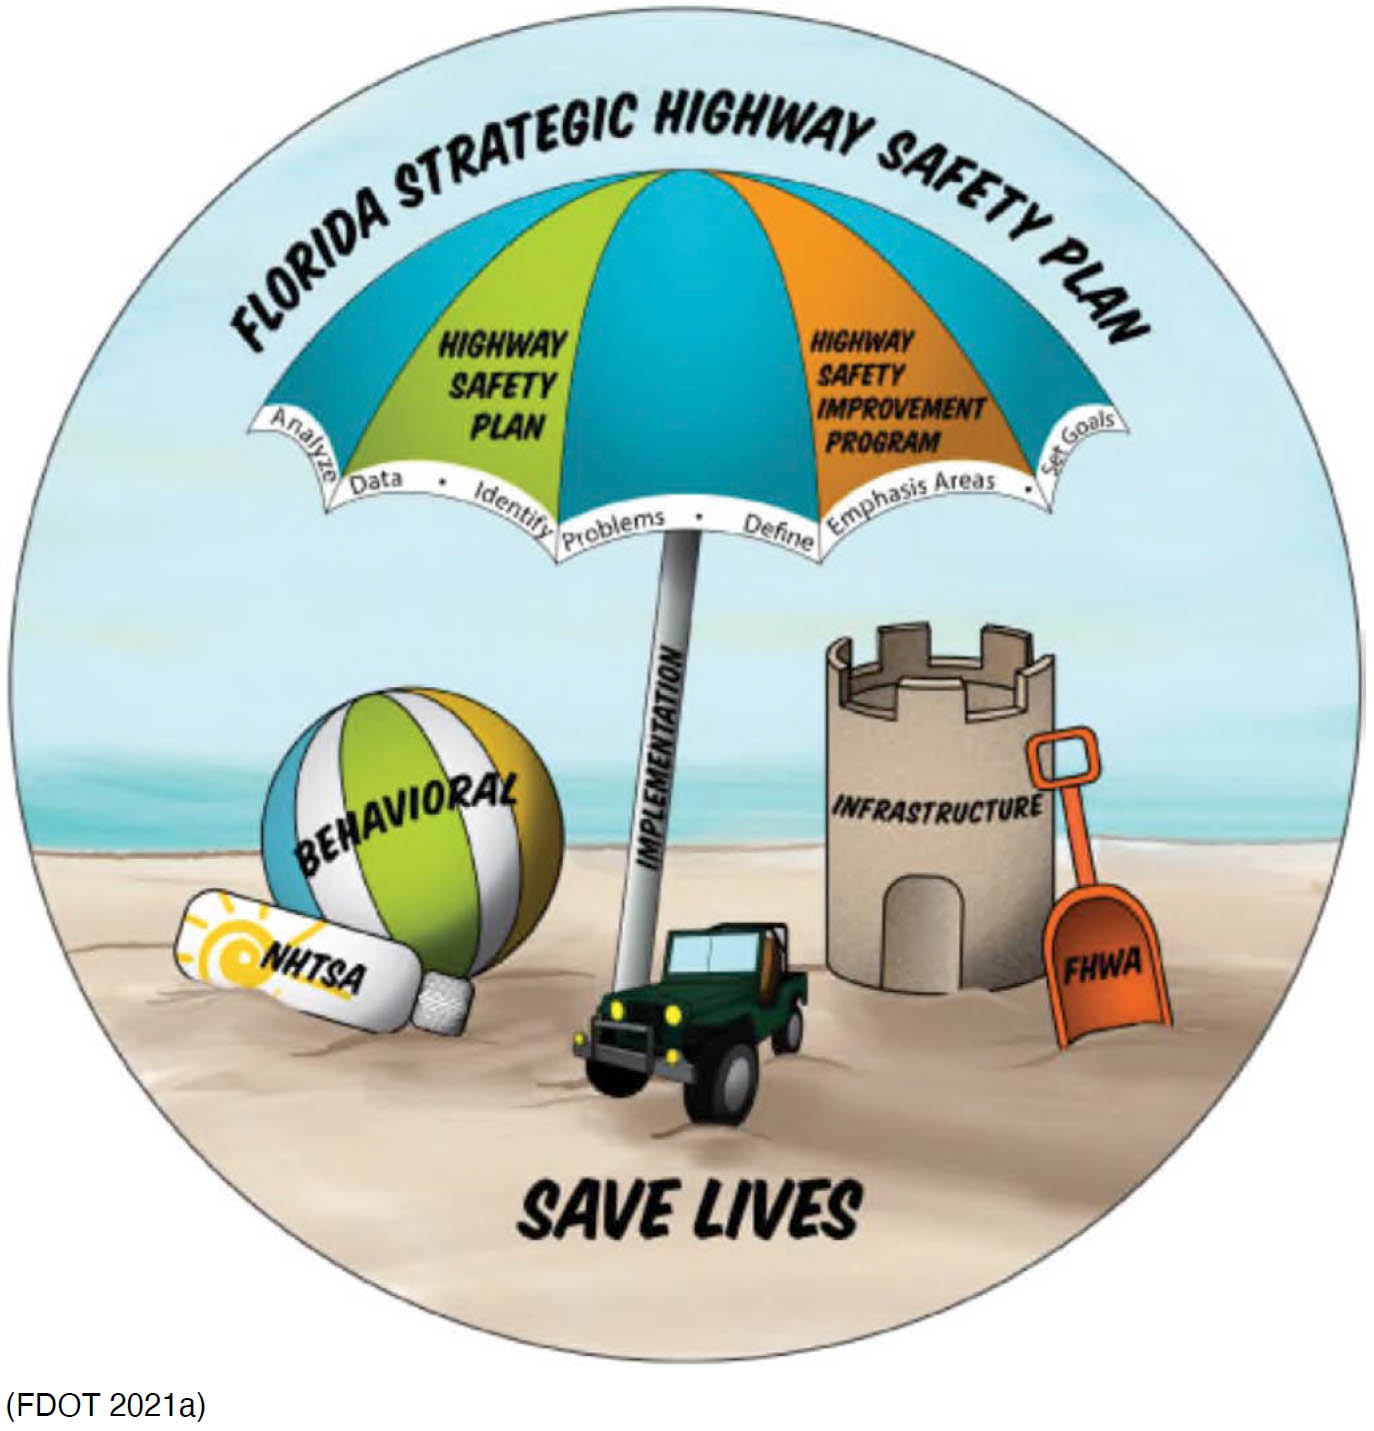
- Floridaʼs HSP is based on their SHSPʼs goals, objectives, and crash data. SHSP countermeasures were used in developing Floridaʼs HSP. Coordination between the HSP and programs in Florida is shown in Figure 16 (FDOT 2021a).
- Collaboration between the Maine Bureau of Highway Safety and MaineDOT is continuous and ongoing. These agencies worked together on the 2022 SHSP and collaborated on developing the 2023 HSP (Maine Department of Public Safety 2023b).
- The California Office of Traffic Safety works with Caltrans to ensure consistency of focus areas with the HSIP. Meetings with Caltrans are conducted to develop performance targets (California Office of Traffic Safety 2023).
- In Nebraska, several strategies for their HSIP are the same as those in their HSP (Nebraska DOT 2023c). Figure 17 shows the Highway Safety Planning Process for Nebraska (Nebraska DOT 2023c).

NOTE: FARS = Fatality Analysis Reporting System.
Long Description.
The diagram shows the Idaho Transportation Department organizational chart for the Division of External Affairs Office of Highway Safety. At the top is the Director. Below is the Division of External Affairs. Three roles appear beneath this level: Administrative Staff, Highway Safety Manager, and Financial Specialist. Under Highway Safety Manager are FARS Analyst, Research Analyst Principals, Grants Contracts Officers, Law Enforcement Trainer, and Crash Report Analysts. The text, Idaho Transportation Department 2023 c, appears below the diagram.
Long Description.
The illustration shows coordination between Florida safety plans and programs. A large beach umbrella labeled Florida Strategic Highway Safety Plan is divided into sections for the Highway Safety Plan and the Highway Safety Improvement Program. Words along the edge include analyze, data, identify problems, define emphasis areas, and set goals. The umbrella pole is labeled implementation. On the left is a beach ball labeled behavioral with an item labeled NHTSA beside it. On the right is a sand structure labeled infrastructure with a shovel labeled FHWA. A small vehicle sits under the umbrella. The text, save lives, appears at the bottom. The text Florida Department of Transportation, 2021 a, appears below the illustration.

Long Description.
The diagram shows the Nebraska highway safety planning process cycle. A central box is labeled Highway Safety Planning Process Cycle. Surrounding this box are seven steps. These steps are define and describe the problems through data analysis, identify and involve partners in each planning process, coordinate Highway Safety Plan and data collection with those for the state Highway Safety Plan, develop performance targets and measures for program areas, identify, prioritize, and select strategies and projects, submit the Highway Safety Plan for NHTSA review and approval, and evaluate outcomes and results for use in the next planning cycle. The text, Nebraska DOT 2023 c, appears below the diagram.
Various stakeholders are involved in developing HSPs, including law enforcement, emergency medical services (EMS), and tribal and regional organizations. Examples of stakeholders are included in Table 4.
As part of the HSP, a public participation and engagement (PP&E) plan must be developed. Examples of PP&E plan components are summarized in Table 5.

Long Description.
The table has 2 columns and 6 rows. The column headers in Row 1 are State Reference and Example HSP Stakeholders. Row 2: Tennessee, Tennessee HSO 2023 b; Traffic Records Coordinating Committee, Occupant Protection Coalition, Bicycle and Pedestrian Safety Committee, and Impaired Driving Advisory Council. Row 3: Alabama, Alabama Department of Economic and Community Affairs 2023; Strategic Highway Safety Roundtable working group which includes representation from engineering, enforcement, education, and EMS. Row 4: Hawaii, Hawaii DOT 2023 a; Department of Transportation, Traffic Records Coordinating Committee, local law enforcement, metropolitan planning organizations, and Walk Wise Hawaii. Row 5: Montana, Montana DOT 2023 b; annual meeting for the state Comprehensive Highway Safety Plan is held with a wide range of attendees, such as the Federal Highway Administration, Department of Transportation, law enforcement, and tribal entities. Row 6: South Carolina, South Carolina Department of Public Safety 2023 b; South Carolina Community Health Worker Association, hospital system, local coalitions, and parks and recreation commissions.

Long Description.
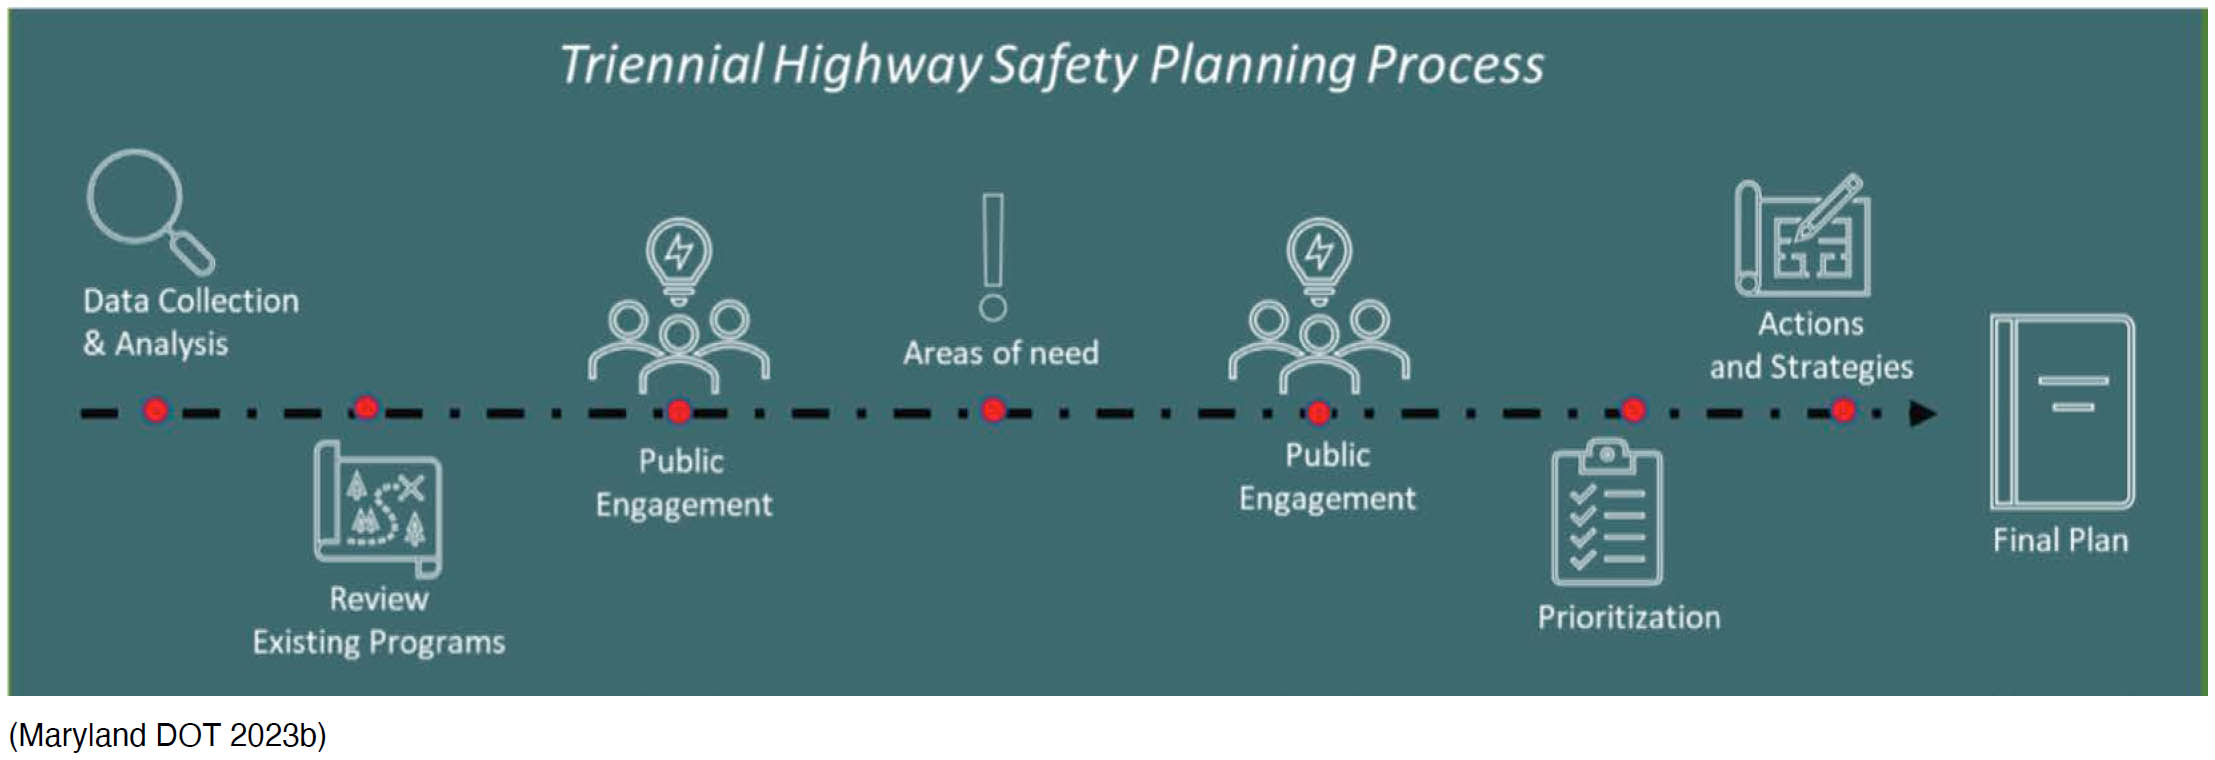
The table has 2 columns and 7 rows. The column headers in Row 1 are State Reference and Example PPE Plan Material. Row 2: Illinois, Illinois DOT 2023 a; community events and two surveys, the traffic safety community survey and the post participation engagement community survey, are used to collect feedback from safety partners and community members. Row 3: California, California Office of Traffic Safety 2023; the Office of Traffic Safety reviews local planning documents to find ways to work with local agencies on existing PPE initiatives to gather input from the public. Row 4: Delaware, Delaware OHS 2022; a website, h t t p s colon double slash w w w dot arrive alivede dot com is used for outreach on various safety priority areas and provides guidance and resources for the public on highway safety topics. Row 5: Georgia, Georgia GOHS 2023 b; a three step process, identify adversely impacted communities, engage community members, and co implement countermeasures, is used to identify countermeasures and strategies for funding. Row 6: Maryland, Maryland DOT 2023 b; the HSO has a Community Engagement Section, which is an entire section dedicated to outreach and education. The PPE plan process for Maryland HSO is shown in Figure 18. Row 7: Oregon, Oregon Transportation Safety Office 2023 b; regional transportation safety coordinators meet with local agencies and safety partners and are involved in developing local transportation safety action plans and implementing action items.
Long Description.
The diagram shows the triennial highway safety planning process for Maryland’s Highway Safety Office. Steps along the timeline include data collection and analysis, review of existing programs, public engagement, identification of areas of need, a second stage of public engagement, prioritization, actions and strategies, and creation of the final plan. The text Maryland DOT 2023 b appears below the diagram.
Summary of Other DOT/HSO Resources
Other resources such as HSO annual reports, HSO annual grant applications, state safety partner websites, and HSIP websites and manuals were also reviewed. Key findings are documented below.
States perform public outreach in various ways (e.g., public surveys, local task force meetings, media campaigns, and regionally specific engagement strategies):
- In Iowa, a public online survey of driver behavior was conducted. The survey asked about seatbelt use, speeding, impaired driving, and distracted driving (Iowa Department of Public Safety 2024b).
- In Utah, county coordinators work with the HSO and Montana State University Center of Health and Safety Culture to guide local task force meetings and community outreach. Local task force meetings bring together local safety stakeholders to discuss potential safety improvements and community outreach activities including community celebrations, parades, and fairs (Utah Department of Public Safety 2024).
- North Dakota Vision Zero Coordinators are regionally based and coordinate with local agencies to educate the community on traffic safety (NDDOT 2024a).
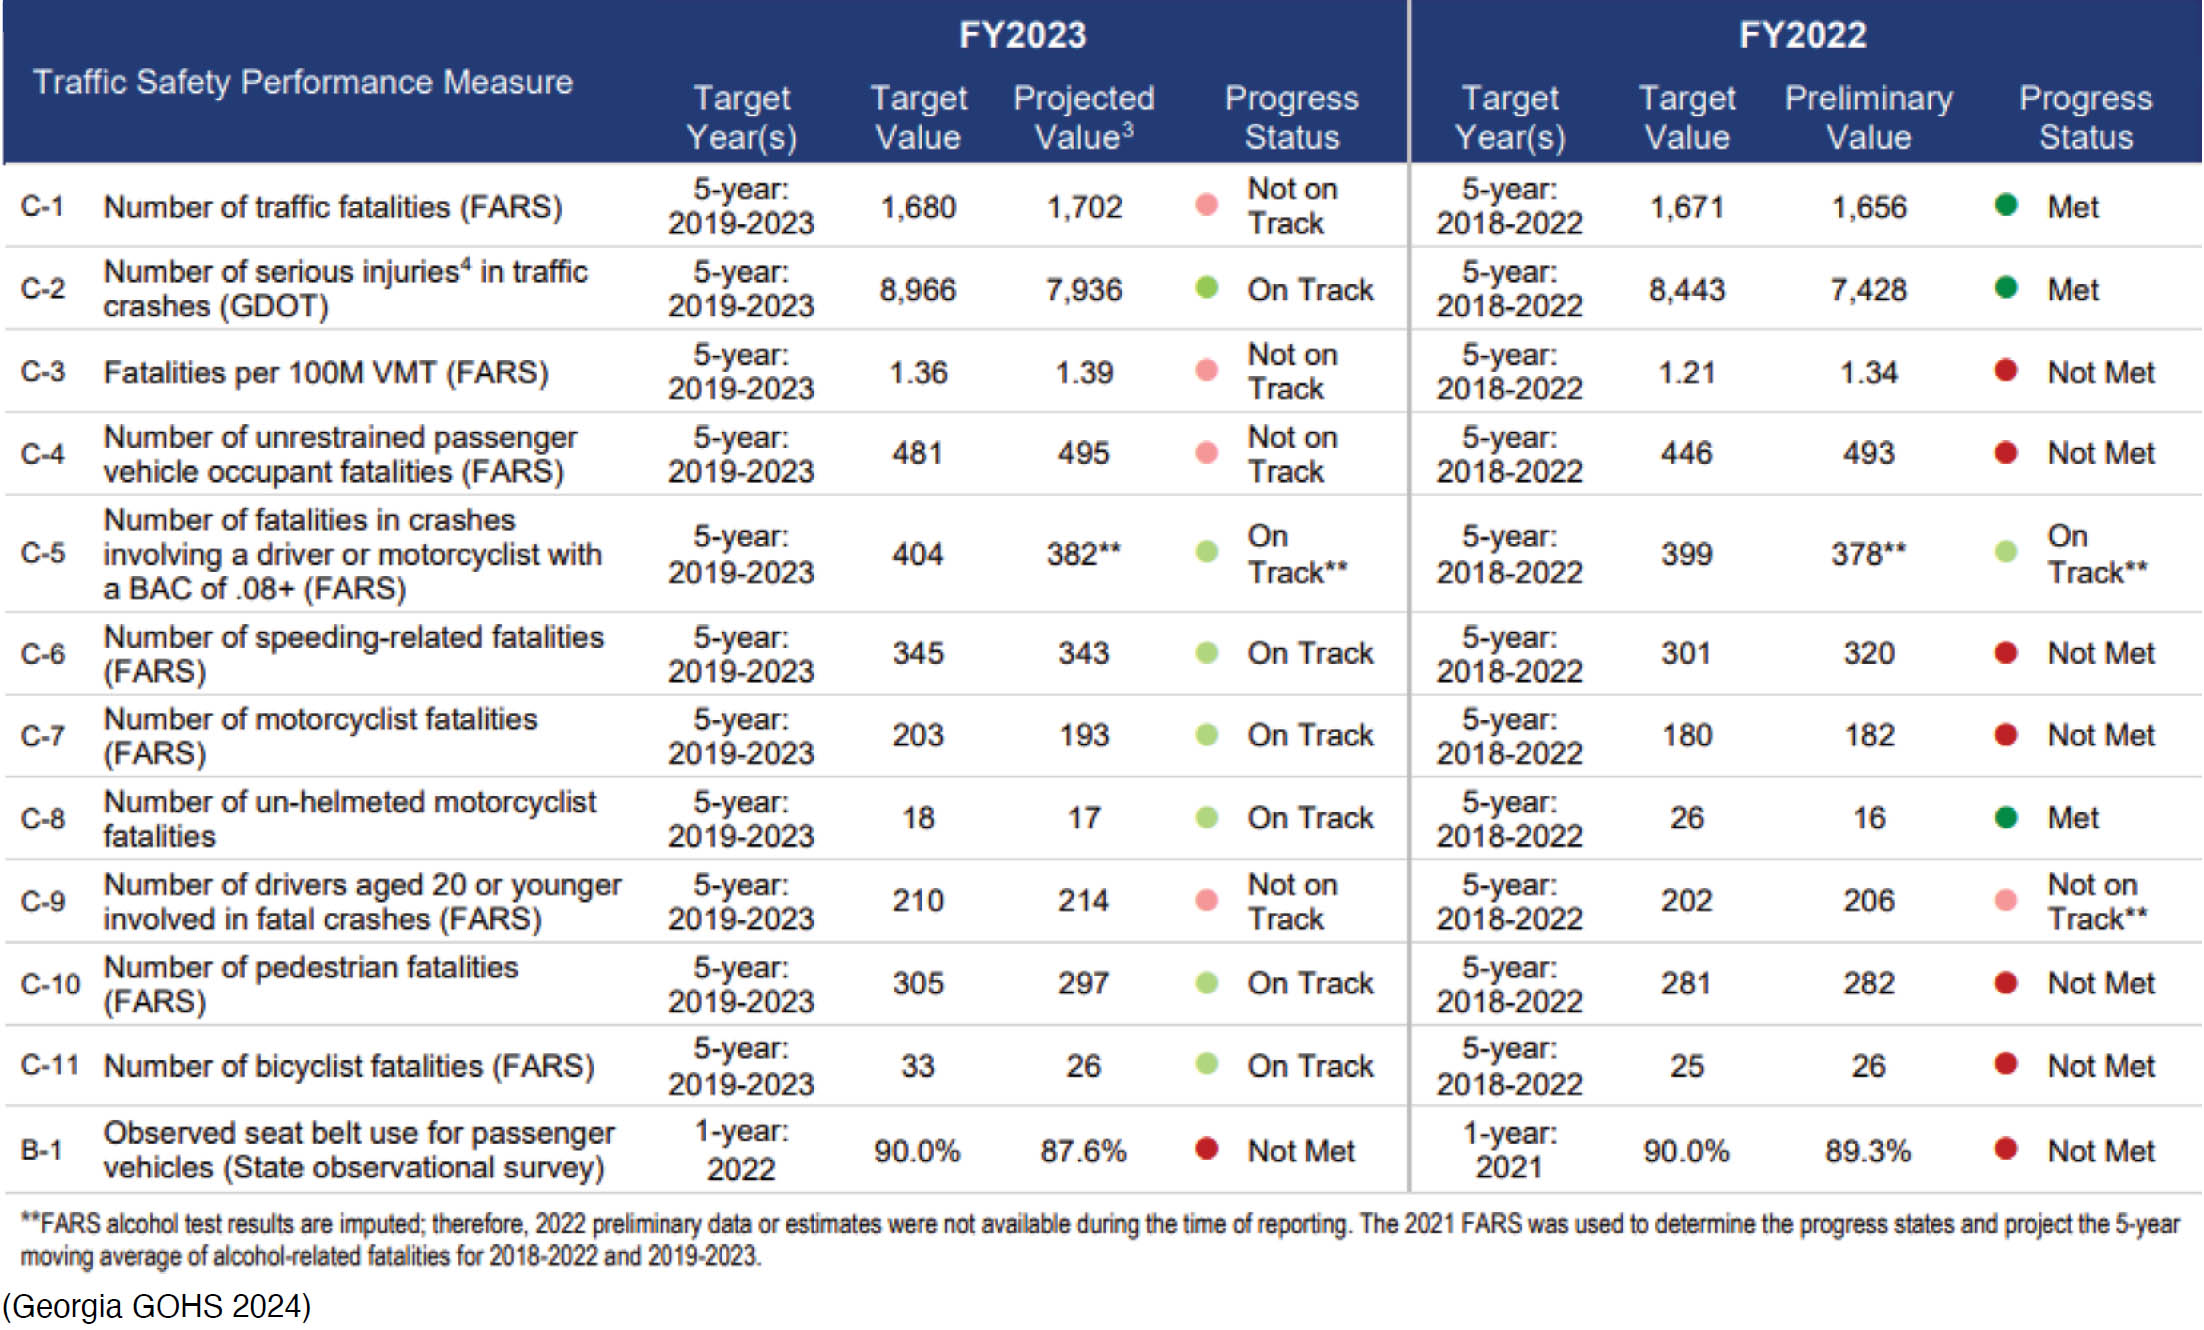
HSO annual reports contain tables that summarize and track performance measures. As shown in Figure 19, Georgiaʼs 2023 Annual Report includes a table that shows the tracking of performance measures versus their targeted values and if the status of the performance measure is on track (Georgia GOHS 2024). Mississippi provides a progress report on performance measures and whether the target was met (Mississippi Department of Highway Safety 2024).
Traffic Records Coordinating Committees (TRCCs) serve as the backbone for crash data coordination and quality improvement for many states. TRCCs consist of staff from various agencies such as DOTs, HSOs, police, and public health. Examples follow:
- Arizonaʼs TRCC consists of members from the Governorʼs Office of Highway Safety (GOHS), DOT, and law enforcement agencies (Arizona GOHS 2024).
- Indianaʼs TRCC consists of various agencies such as the Indiana Criminal Justice Institute (ICJI), Toxicology, DOT, state supreme court, and Department of Health (ICJI 2023a).
- Tennesseeʼs TRCC consists of staff from the DOT, Department of Health, law enforcement, court clerks, FMCSA, and FHWA (Tennessee HSO 2023a).
- The Texas Innovation Alliance consists of transportation stakeholders such as FHWA, TxDOT, Texas Technology Task Force, Texas Freight Advisory Committee, cities, MPOs, Texas
Long Description.
The table has 9 columns and 13 data rows. The column headers in Row 1 are Traffic Safety Performance Measure, FY 2023 Target Year or years, FY 2023 Target Value, FY 2023 Projected Value, FY 2023 Progress Status, FY 2022 Target Year or years, FY 2022 Target Value, FY 2022, Preliminary Value, and FY 2022 Progress Status. Row 2: C dash 1 Number of traffic fatalities FARS; 5 year 2019 dash 2023; 1,680; 1,702; Not on Track; 5 year 2018 dash 2022; 1,671; 1,656; Met. Row 3: C dash 2 Number of serious injuries in traffic crashes GDOT; 5 year 2019 dash 2023; 8,966; 7,936; On Track; 5 year 2018 dash 2022; 8,443; 7,428; Met. Row 4: C dash 3 Fatalities per 100 MVMT FARS; 5 year 2019 dash 2023; 1.36; 1.39; Not On Track; 5 year 2018 dash 2022; 1.21; 1.34; Not Met. Row 5: C dash 4 Number of unrestrained passenger occupant fatalities FARS; 5 year 2019 dash 2023; 481; 495; Not on Track; 5 year 2018 dash 2022; 446; 493; Not Met. Row 6: C dash 5 Number of fatalities in crashes involving a driver or motorcyclist with a BAC of point 0 8 plus FARS; 5 year 2019 dash 2023; 404; 382 star star; On Track star star; 5 year 2018 dash 2022; 399; 378 star star; On Track star star. Row 7: C dash 6 Number of speeding related fatalities FARS; 5 year 2019 dash 2023; 345; 343; On Track; 5 year 2018 dash 2022; 301; 320; Not Met. Row 8: C dash 7 Number of motorcyclist fatalities FARS; 5 year 2019 dash 2023; 203; 193; On Track; 5 year 2018 dash 2022; 180; 182; Not Met. Row 9: C dash 8 Number of un helmeted motorcyclist fatalities FARS; 5 year 2019 dash 2023; 18; 17; On Track; 5 year 2018 dash 2022; 26; 16; Met. Row 10: C dash 9 Number of drivers aged 20 or younger involved in fatal crashes FARS; 5 year 2019 dash 2023; 210; 214; Not On Track; 5 year 2018 dash 2022; 202; 206; Not on Track star star. Row 11: C dash 10 Number of pedestrian fatalities FARS; 5 year 2019 dash 2023; 305; 297; On Track; 5 year 2018 dash 2022; 281; 282; Not Met. Row 12: C dash 11 Number of bicyclist fatalities FARS; 5 year 2019 dash 2023; 33; 26; On Track; 5 year 2018 dash 2022; 25; 26; Not Met. Row 13: B dash 1 Observed seat belt use for passenger vehicles State observational survey; 1-year 2022; 90.0 percent; 87.6 percent; Not Met; 1-year 2021; 90.0 percent; 89.3 percent; Not Met. A note at the bottom states star star FARS alcohol values are imputed. Therefore 2022 preliminary data values were not available during the time of reporting. The 2021 FARS was used to determine the progress status and project the 5 year moving average of alcohol related fatalities for 2018 dash 2022 and 2019 dash 2023. The text Georgia GOHS 2024 appears below the table.
- A&M Transportation Institute, Department of Public Safety, and more. These stakeholders meet to make decisions around innovations and technologies and how to deliver projects (TxDOT 2025).
- Coloradoʼs Advancing Transportation Safety website provides information about SHSP emphasis areas, links to state safety plans, transportation safety news and events, and the link to their safety portal (CDOT 2025). Figure 20 shows Coloradoʼs SHSP Emphasis Areas.
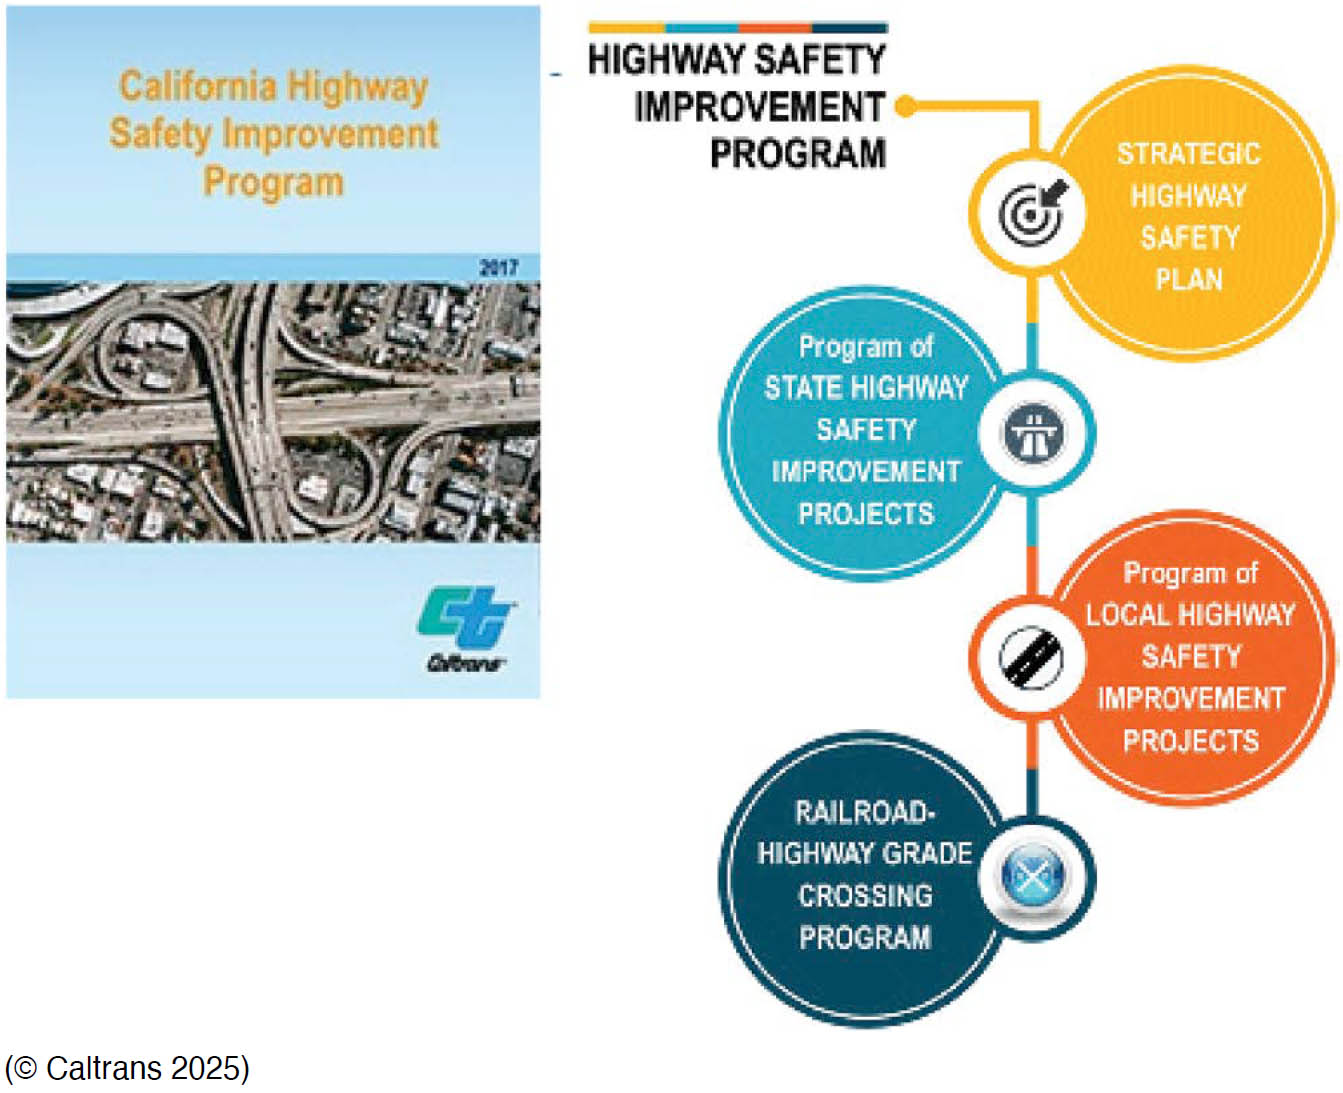
Californiaʼs HSIP consists of three primary components: SHSP, Program of Highway Safety Improvement Projects, and the Railroad-Highway Grade Crossing Program. The Railroad-Highway Grade Crossing Program is funded through HSIP set-aside (Caltrans 2025). Figure 21 shows the components of the HSIP.

Long Description.
The diagram shows Colorado’s Strategic Highway Safety Plan emphasis areas. A center circle is labeled safety culture. Around this circle are four connected segments labeled safe roads, safe people, safe driving, and post crash care. The text, Colorado DOT 2025, appears below the diagram.
Long Description.
The diagram shows components of the California Highway Safety Improvement Program. On the left is a cover labeled California Highway Safety Improvement Program with an aerial view of roadways. On the right a vertical sequence shows the Highway Safety Improvement Program leading to four components. These components are the Strategic Highway Safety Plan, the Program of State Highway Safety Improvement Projects, the Program of Local Highway Safety Improvement Projects, and the Railroad Highway Grade Crossing Program. The text, Caltrans 2025, appears below the diagram.


