Coordination of Highway Safety Improvement Program and Highway Safety Office Activities (2026)
Chapter: 3 Survey Results

CHAPTER 3
Survey Results
A survey was developed and administered to gain greater understanding of the state of the practice for HSIP and HSO coordination within the United States. The survey, which included 25 questions, was reviewed and approved by the NCHRP before being sent to each DOT via Qualtrics Survey Software (Qualtrics 2025). The survey was sent to one respondent from each DOT. Example job titles of survey respondents include State Traffic and Safety Engineer, Traffic Operations Engineer, and HSIP Manager. The contact list for the survey was primarily based on the AASHTO Safety Committee with some modifications (e.g., substitution of panel member or other representative recommended by DOT, contacts from prior syntheses on safety-related topics), and an effort was made to identify the appropriate person at each DOT to complete the survey. In addition, respondents were encouraged to collaborate with others at their DOT as well as colleagues from their HSO and to forward the survey to the staff who would be most capable of answering the questions and providing the most accurate information. Responses were received from 45 state DOTs and the District of Columbia DOT (DDOT) for a response rate of 90%. A map showing the survey respondents is provided in Figure 22. In some cases, DOTs did not answer every question or part of a question.
Topics related to HSIP and HSO coordination covered by the survey include organizational structure, coordination of activities and programs, dashboards, data, developing resources, PP&E efforts, and challenges. Several of the multiple-choice questions included an option for Other with a text entry field. The full survey is provided as Appendix A. A list of responding DOTs and survey responses, including Other text responses, along with resources submitted, are provided in Appendix B.
This chapter is organized into the following sections:
- Coordination of Activities and Programs Between HSIP and HSO (questions 7 through 13)
- HSIP and HSO Sharing of Resources, Data, and Dashboards (questions 14 through 19)
- PP&E Efforts (questions 20 and 21)
- Organizational Structures of HSIP and HSO (questions 1 through 6)
- Challenges and Opportunities for HSIP and HSO Coordination (questions 22 and 23)
- Other Survey Feedback (questions 24 and 25).
Coordination of Activities and Programs Between HSIP and HSO
Survey questions 7 through 13 focused on understanding how states coordinate activities and programs between HSIP and HSO. Question 7 asked who serves as the custodian for the stateʼs SHSP. The result of this question is shown in Figure 23. Most respondents (41 out of 46) indicated that the DOT is the primary custodian. Five states reported that another state agency holds this

Long Description.
The map shows all US states. Most states show survey response received. Four states show survey response not received. These four states are Iowa, Oklahoma, Alabama and Texas. A legend shows two labels. One label shows survey response received. The other label shows survey response not received. The map is created with mapchart dot det.
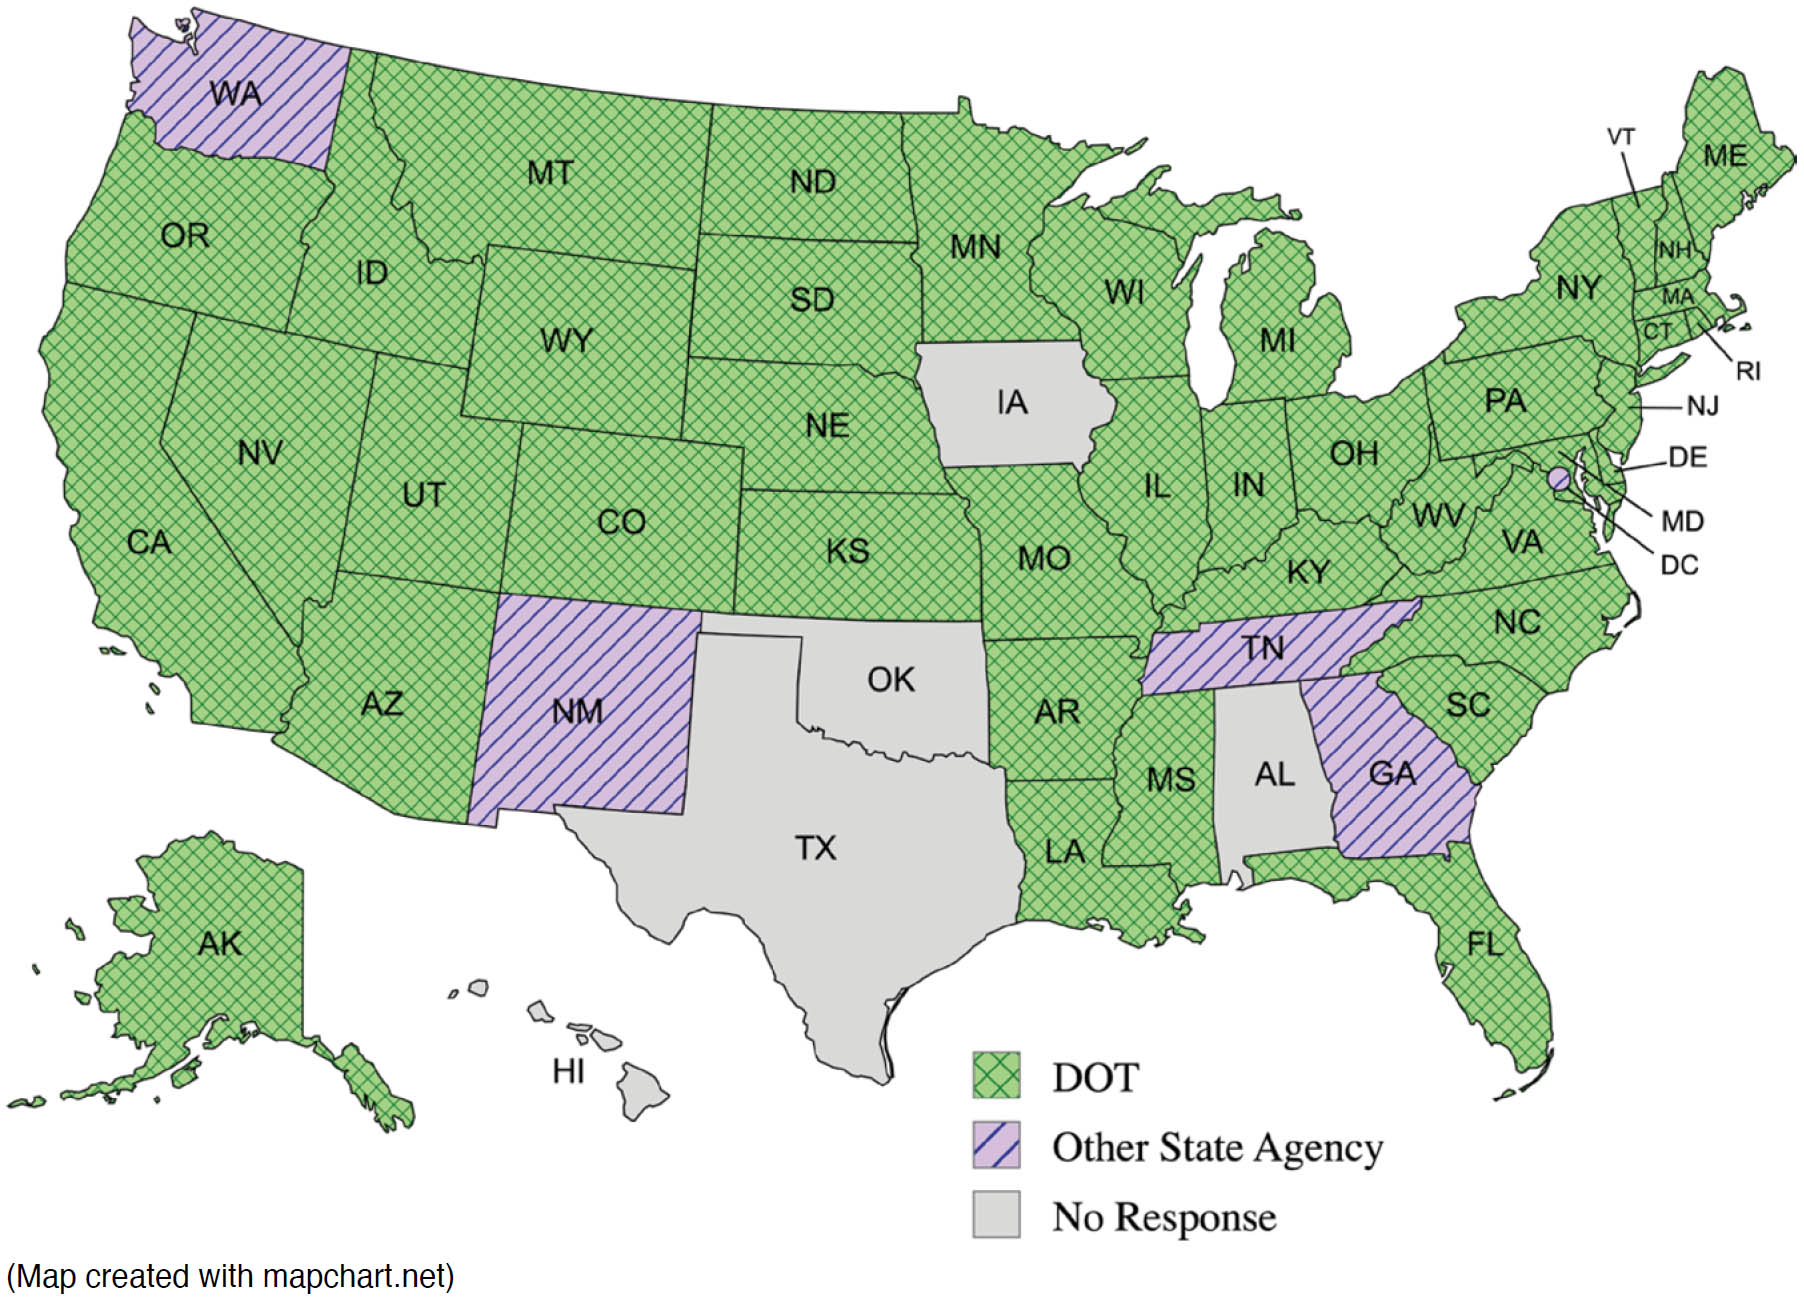
Long Description.
The map shows all US states with three groups. Four states show no response. These states are Iowa, Oklahoma, Alabama, Texas and Hawaii. Five states show other state agency. These states are Washington, New Mexico, Tennessee, Georgia, and the District of Columbia. All other states show DOT. These states are Alaska, California, Oregon, Nevada, Idaho, Montana, Wyoming, Utah, Arizona, Colorado, North Dakota, South Dakota, Nebraska, Kansas, Minnesota, Missouri, Arkansas, Louisiana, Wisconsin, Illinois, Michigan, Indiana, Ohio, Kentucky, Mississippi, Florida, South Carolina, North Carolina, West Virginia, Pennsylvania, New York, New Jersey, Delaware, Connecticut, Rhode Island, Massachusetts, Vermont, New Hampshire, Maine, Virginia, and Maryland. A legend shows three labels. One label shows DOT. The other labels are other state agency and no response. The map is created with mapchart dot net.
role. Table 6 presents the responses from these five states, which include safety offices, interagency partnerships, and joint custodianship arrangements.
Question 8 asked respondents to rate, on a scale from 1 (Low) to 5 (High), the level of coordination between their stateʼs HSIP and HSO across various activities. This question assessed coordination across multiple functional areas, including funding allocation, crash data analysis, behavioral safety initiatives, coordination with emergency services and law enforcement, developing safety plans and reports, stakeholder engagement, project delivery and evaluation, and other related activities. The overall result is shown in Table 7.
Although developing the SHSP and Other activities received the highest average rating of 4.5, the latter was based on a small number of responses (n = 6), limiting its generalizability. Responses in the Other activities included coordination through FDOT State Safety Office (SSO) (Florida), coordination with Local Highway Technical Assistance Council (Idaho), safety performance target setting (Maryland), coordination meetings (Oregon), and active involvement in SHSP (Tennessee). Several other activities also demonstrated relatively high levels of coordination (e.g., identification of safety focus areas, analysis of crash data, and identification of safety strategies). In contrast, lower coordination scores were reported for activities related to implementation and project-level processes, such as project evaluation after construction, project screening and selection, and identification of project delivery methods. Standard deviations ranged from 0.5 to 1.4, with most activities falling between 1.0 and 1.4, except for Other, development of SHSP, and identification of safety focus areas.
Question 9 focused on the level of coordination between HSIP and HSO within specific program areas; the results are presented in Table 8. Respondents were asked to rate coordination on a 1 to 5 scale (with 1 being the lowest and 5 being the highest) across five program types: VRUSA, use of NHTSA penalty funds, Safe Routes to School, HRRR, and railroad at-grade crossings. Among these, VRUSA received the highest average rating of 3.5, while railroad at-grade crossings had the lowest at 1.8. The use of NHTSA penalty funds and Safe Routes to School received average ratings of 3.1 and 2.5, respectively. HRRR was rated at 2.1. Additionally, three respondents selected Other and rated coordination for those programs at 5.0 on average, although this is based on a very small number of responses. Of the three respondents who provided additional context under the Other category, FDOT noted that coordination is inherent because the FDOT SSO administers the HSIP. Oregon DOT referenced work zone and roadway safety programs, while WisDOT mentioned SHSP and safety performance measures.
Question 10, a follow up to Question 9, asked respondents to identify the lead agency responsible for each program reported (see Table 9). For the VRUSA, most responding DOTs (41 out of 45) reported HSIP as the lead. HSIP was also most identified for HRRR (34 out of 36) and railroad at-grade crossings (27 out of 41), though the latter had 11 states indicating another agency. In contrast, use of NHTSA penalty funds was primarily led by HSO (22 out of 32), and

Long Description.
The table has 2 columns and 6 rows. The column headers in Row 1 are DOT and Reported SHSP Custodian. Row 2: District of Columbia; HSO. Row 3: Georgia; GOHS. Row 4: New Mexico; Technical Unit Supervisor comma HSIP Manager. Row 5: Tennessee; Partnership with the Department of Safety. Row 6: Washington; Washington State DOT and Washington Traffic Safety Commission co lead the SHSP.

Long Description.
The table has 6 columns and 20 rows. Row 1: Activity; Average; Standard Deviation; High; Low; Number of Responses. Row 2: Development of SHSP; 4.5; 0.8; 5.0; 2.0; 45. Row 3: Identification of Safety Focus Areas; 4.2; 0.9; 5.0; 1.0; 45. Row 4: Analysis of Crash Data; 4.0; 1.2; 5.0; 1.0; 45. Row 5: Identification of Safety Strategies; 3.9; 1.0; 5.0; 1.0; 45. Row 6: Coordination with Law Enforcement; 3.4; 1.3; 5.0; 1.0; 45. Row 7: Engagement with Local Agencies; 3.4; 1.3; 5.0; 1.0; 45. Row 8: Safety Planning; 3.3; 1.3; 5.0; 1.0; 45. Row 9: Behavioral Safety Initiatives; 3.3; 1.3; 5.0; 1.0; 45. Row 10: Safety Outreach Activities; 3.2; 1.3; 5.0; 1.0; 45. Row 11: Allocation of Funding; 2.9; 1.3; 5.0; 1.0; 44. Row 12: PPE; 2.8; 1.3; 5.0; 1.0; 45. Row 13: Coordination with EMS; 2.8; 1.3; 5.0; 1.0; 45. Row 14: Development of HSP Report; 2.7; 1.3; 5.0; 1.0; 45. Row 15: Development of HSIP Implementation Plan; 2.6; 1.4; 5.0; 1.0; 45. Row 16: RSAs; 2.5; 1.4; 5.0; 1.0; 45. Row 17: Identification of Project Delivery Methods; 2.3; 1.1; 5.0; 1.0; 45. Row 18: Project Screening and Selection; 2.3; 1.2; 5.0; 1.0; 45. Row 19: Project Evaluation After Construction e g Before slash After Safety Analysis; 2.2; 1.3; 5.0; 1.0; 45. Row 20: Other; 4.5; 0.5; 5.0; 4.0; 6. The note for Sort order reads Average, High to Low. Other is shown at bottom.
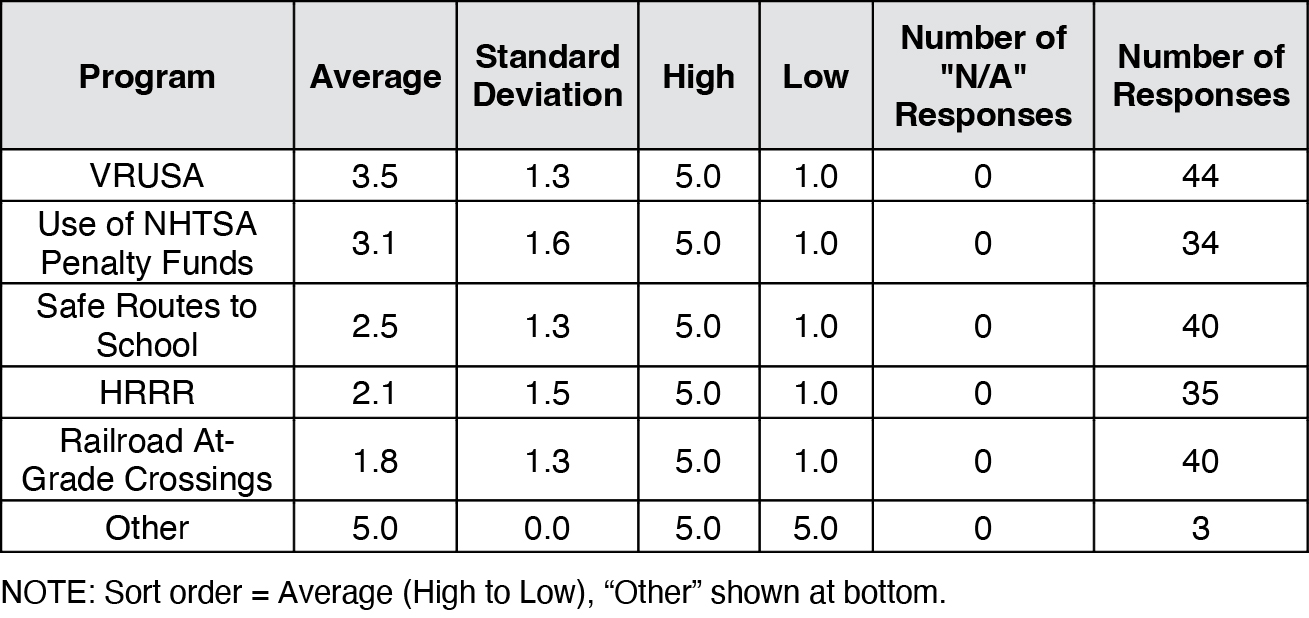
Long Description.
The table has 7 columns and 6 rows. Row 1: Program; Average; Standard Deviation; High; Low; Number of NA Responses; Number of Responses. Row 2: VRUSA; 3.5; 1.3; 5.0; 1.0; 0; 44. Row 3: Use of NHTSA Penalty Funds; 3.1; 1.6; 5.0; 1.0; 0; 34. Row 4: Safe Routes to School; 2.5; 1.3; 5.0; 1.0; 0; 40. Row 5: HRRR; 2.1; 1.5; 5.0; 1.0; 0; 35. Row 6: Railroad At Grade Crossings; 1.8; 1.3; 5.0; 1.0; 0; 40. Row 7: Other; 5.0; 0.0; 5.0; 5.0; 0; 3. The note for Sort order reads Average, High to Low. Other is shown at bottom.

Long Description.
The table has 5 columns and 7 rows. The column headers in Row 1 are Program; HSIP; HSO; Other Agency; Total. Row 2: HRRR; 34; 2; 0; 36. Row 3: Railroad At Grade Crossings; 27; 3; 11; 41. Row 4: Safe Routes to School; 15; 6; 20; 41. Row 5: Use of NHTSA Penalty Funds; 9; 22; 1; 32. Row 6: VRUSA; 41; 4; 0; 45. Row 7: Other; 0; 3; 0; 3.
Safe Routes to School showed more variation, with 20 responding DOTs assigning lead responsibility to an agency other than HSIP or HSO.
Question 11 asked respondents how their state uses any NHTSA penalty funds received, allowing for multiple selections (see Figure 24 for results). Among the 36 respondents who answered this question, the most selected uses were alcohol-impaired driving programs and HSIP-eligible activities—each reported by 23 states. Four responding DOTs reported using the funds for EMS, and 13 selected Other. Other reported uses included funding for 402 programs; support for enforcement, education, and behavioral-related programs; and arrangements where funds are split between HSIP and HSO. In several cases, respondents indicated they were unsure how the funds are allocated or used in their state.
Question 12 asked respondents to rate, on a scale from 1 (Low) to 5 (High), the level of coordination between their stateʼs HSIP and HSO across various safety focus areas. Among the 14 listed areas, VRUs received the highest average rating (3.7), followed by speeding and Other (both 3.5). Focus areas such as motorcyclist safety, distracted driving, work zones, and impaired driving all had average ratings around 3.2. The lowest levels of coordination were reported for aggressive driving at 2.9 and commercial motor vehicles at 2.8. Four respondents selected Other and provided examples (e.g., wildlife-related safety and coordination addressed through SHSP meetings or structural arrangements where the HSIP is administered by the SHSP). The results are summarized in Table 10.

Long Description.
The chart shows four horizontal bars. HSIP eligible activities shows 23. Alcohol impaired driving programs shows 23. Other shows 13. Emergency Medical Services EMS shows 4. The note below reads Respondents could select multiple answers. Sort order equals Count, High to Low. Total number of responses equals 36.
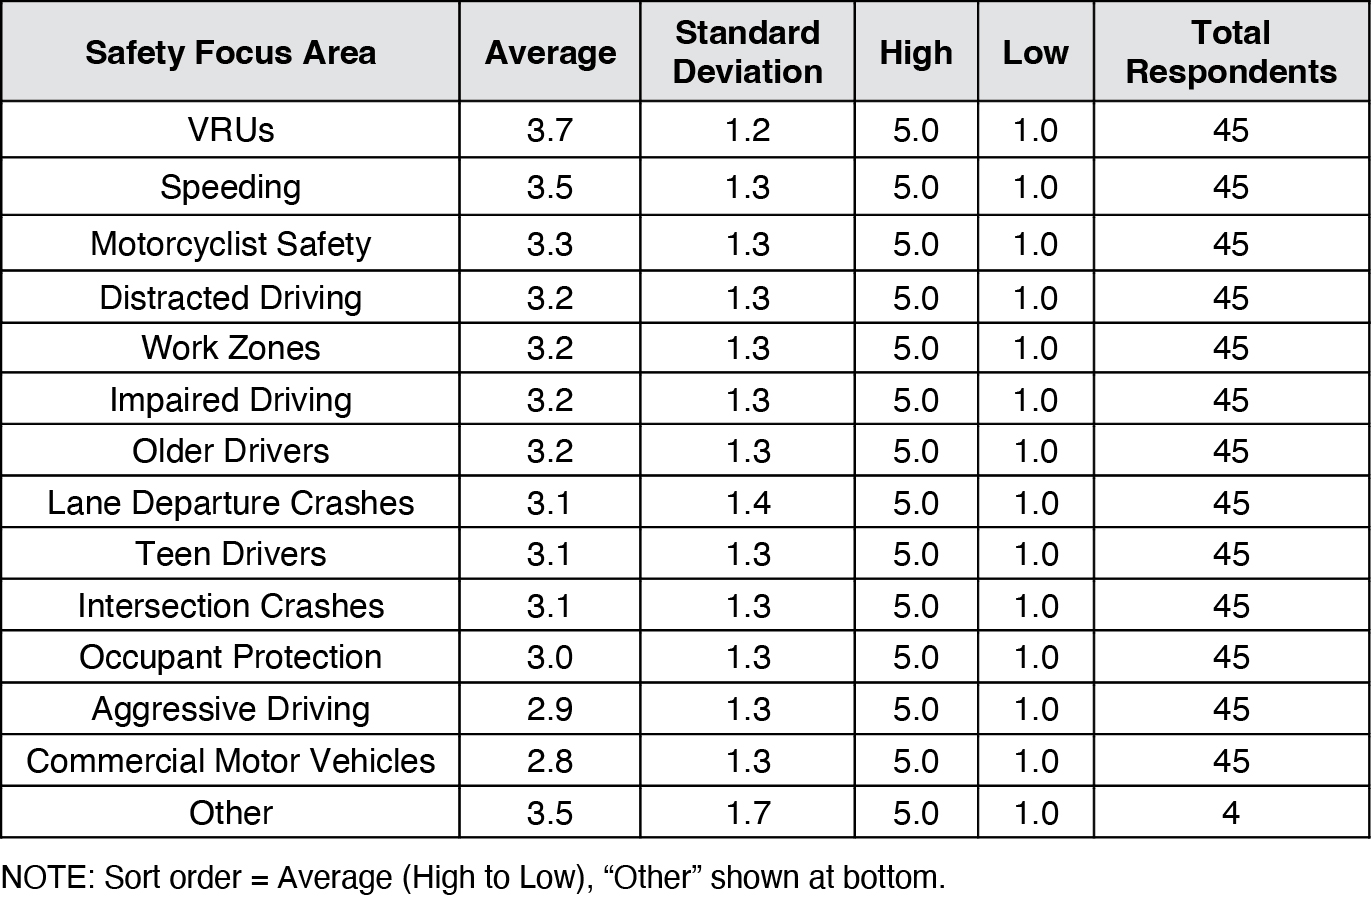
Long Description.
The table has 6 columns and 15 rows. The column headers in Row 1 are Safety Focus Area; Average; Standard Deviation; High; Low; Total Respondents. Row 2: VRUs; 3.7; 1.2; 5.0; 1.0; 45. Row 3: Speeding; 3.5; 1.3; 5.0; 1.0; 45. Row 4: Motorcyclist Safety; 3.3; 1.3; 5.0; 1.0; 45. Row 5: Distracted Driving; 3.2; 1.3; 5.0; 1.0; 45. Row 6: Work Zones; 3.2; 1.3; 5.0; 1.0; 45. Row 7: Impaired Driving; 3.2; 1.3; 5.0; 1.0; 45. Row 8: Older Drivers; 3.2; 1.3; 5.0; 1.0; 45. Row 9: Lane Departure Crashes; 3.1; 1.4; 5.0; 1.0; 45. Row 10: Teen Drivers; 3.1; 1.3; 5.0; 1.0; 45. Row 11: Intersection Crashes; 3.1; 1.3; 5.0; 1.0; 45. Row 12: Occupant Protection; 3.0; 1.3; 5.0; 1.0; 45. Row 13: Aggressive Driving; 2.9; 1.3; 5.0; 1.0; 45. Row 14: Commercial Motor Vehicles; 2.8; 1.3; 5.0; 1.0; 45. Row 15: Other; 3.5; 1.7; 5.0; 1.0; 4. The note for Sort order equals Average, High to Low. Other is shown at bottom.
Question 13 asked respondents to identify the methods their state uses to coordinate HSIP and HSO activities, with multiple selections allowed. Of the 45 responses, the most frequently reported method was meetings at regular intervals (29 responding DOTs), followed by sharing documents (28 responding DOTs). Designated personnel to serve as liaisons and steering committees are each used by 22 responding DOTs. Meetings at irregular intervals were reported by 20 responding DOTs, while formal agreements and standard operating procedures were each noted by 10. Decision rules were the least common—mentioned by seven states. Eleven states selected Other. Most regular meetings occur monthly or quarterly, with some states reporting bi-weekly or as-needed coordination. Examples include SHSP steering committee meetings and weekly or statewide coordination sessions. The overall results are presented in Figure 25.
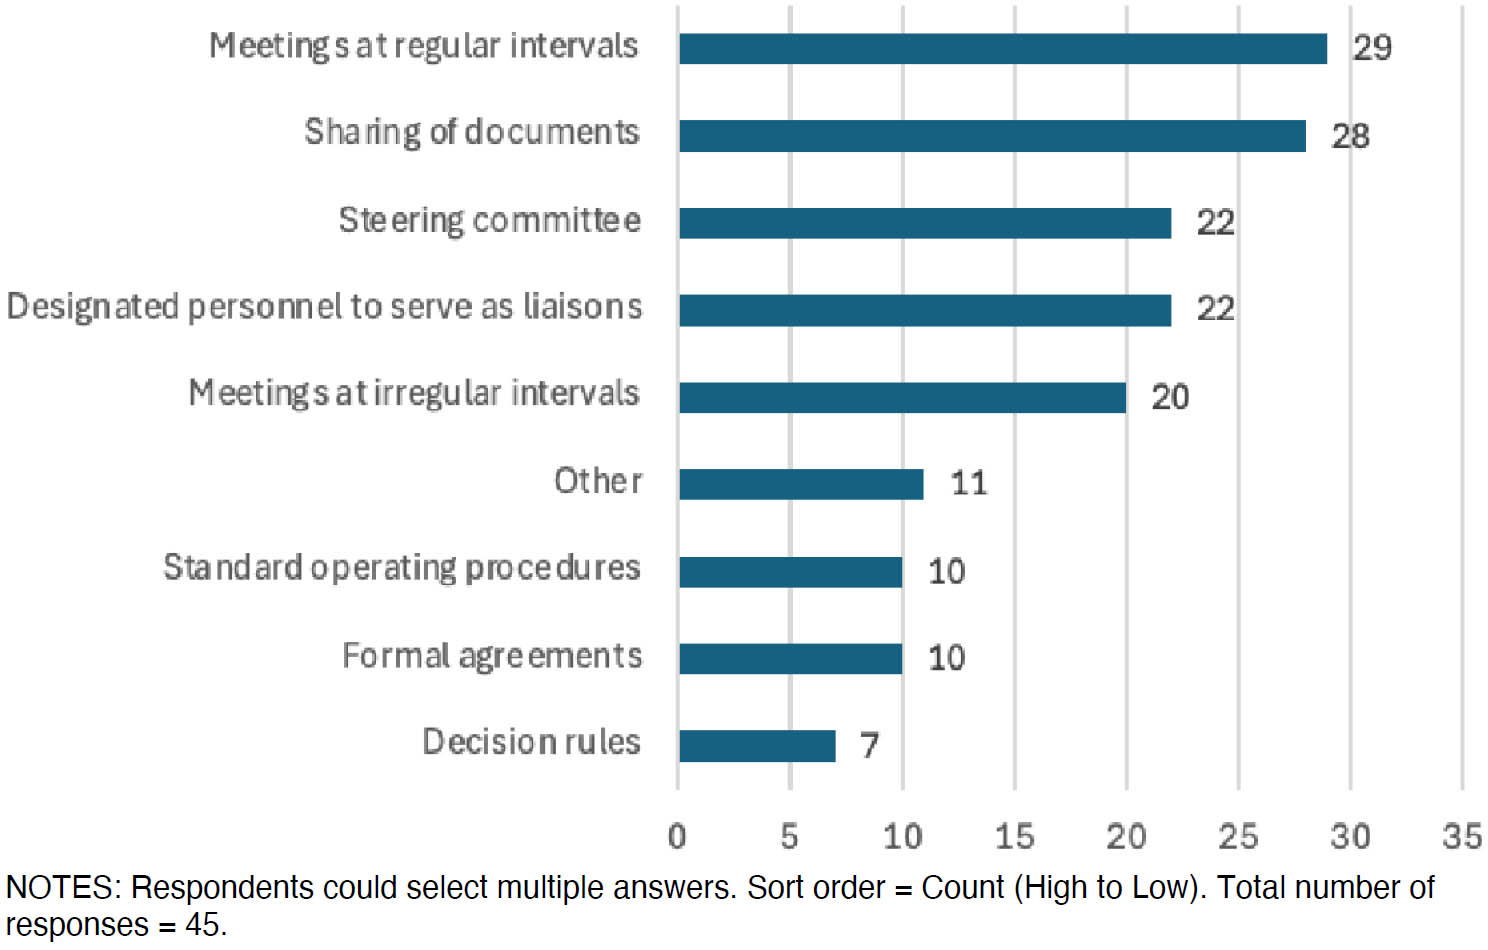
Long Description.
The chart shows nine horizontal bars. Meetings at regular intervals shows 29. Sharing of documents shows 28. Steering committee shows 22. Designated personnel to serve as liaisons shows 22. Meetings at irregular intervals shows 20. Other shows 11. Standard operating procedures shows 10. Formal agreements shows 10. Decision rules shows 7. A note below reads Respondents could select multiple answers. Sort order equals Count High to Low. Total number of responses equals 45.
HSIP and HSO Sharing of Resources, Data, and Dashboards
Questions 14 through 19 focused on how DOTs facilitate the sharing of resources, data, and dashboard information between HSIP and HSO programs. This section explores practices related to coordination documents, data custodianship, information sharing, and public accessibility of dashboards.
Question 14 asked whether DOTs have developed any resources (e.g., guidance or policy documents) to support coordination between the HSIP and HSO. Of the 46 DOTs that responded, 7 reported having such resources in place, while 39 indicated that no formal resources have been developed (see Figure 26). DOTs submitted resources such as a SHSP crash data dashboard and reports in response to this question.
Question 15 gathered information on which agency holds custodianship of crash data within each state. Out of 46 responses, 21 DOTs reported that their DOT is responsible, 8 indicated the State Highway Patrol, and 17 cited other state agency (see Figure 27). Examples of other agencies include Departments of Public Safety, DMVs, or partnerships such as those involving universities or independent labs.
Question 16 asked respondents to rate the estimated level of information and resource sharing between their stateʼs HSIP and HSO across various categories. Crash data received the highest average rating at 4.7, followed by performance metrics at 4.3 and dashboards at 4.1. Lower levels of sharing were reported for feedback from PP&E efforts at 2.9, crowdsourced data at 2.1, and AI analyses at 1.7. The full results are presented in Table 11. Three respondents provided additional information under the other category. FDOT noted that coordination and sharing are inherent due to FDOT SSOʼs administration of HSIP. TDOT highlighted a strong relationship with the Department of Safety in sharing all available resources. GDOT reported that the state does not have an HSO.
Question 17 explored which entities are responsible for maintaining various types of dashboards (see Table 12 for a detailed breakdown of the results). For crash statistics dashboards,

Long Description.
The chart shows two horizontal bars. No shows about 38. Yes shows about 7. The note for Sort order equals Count, High to Low.

Long Description.
The chart shows three horizontal bars. DOT shows about 22. Other state agency shows about 17. State Highway Patrol shows about 8. The note for Sort order equals Count, High to Low.
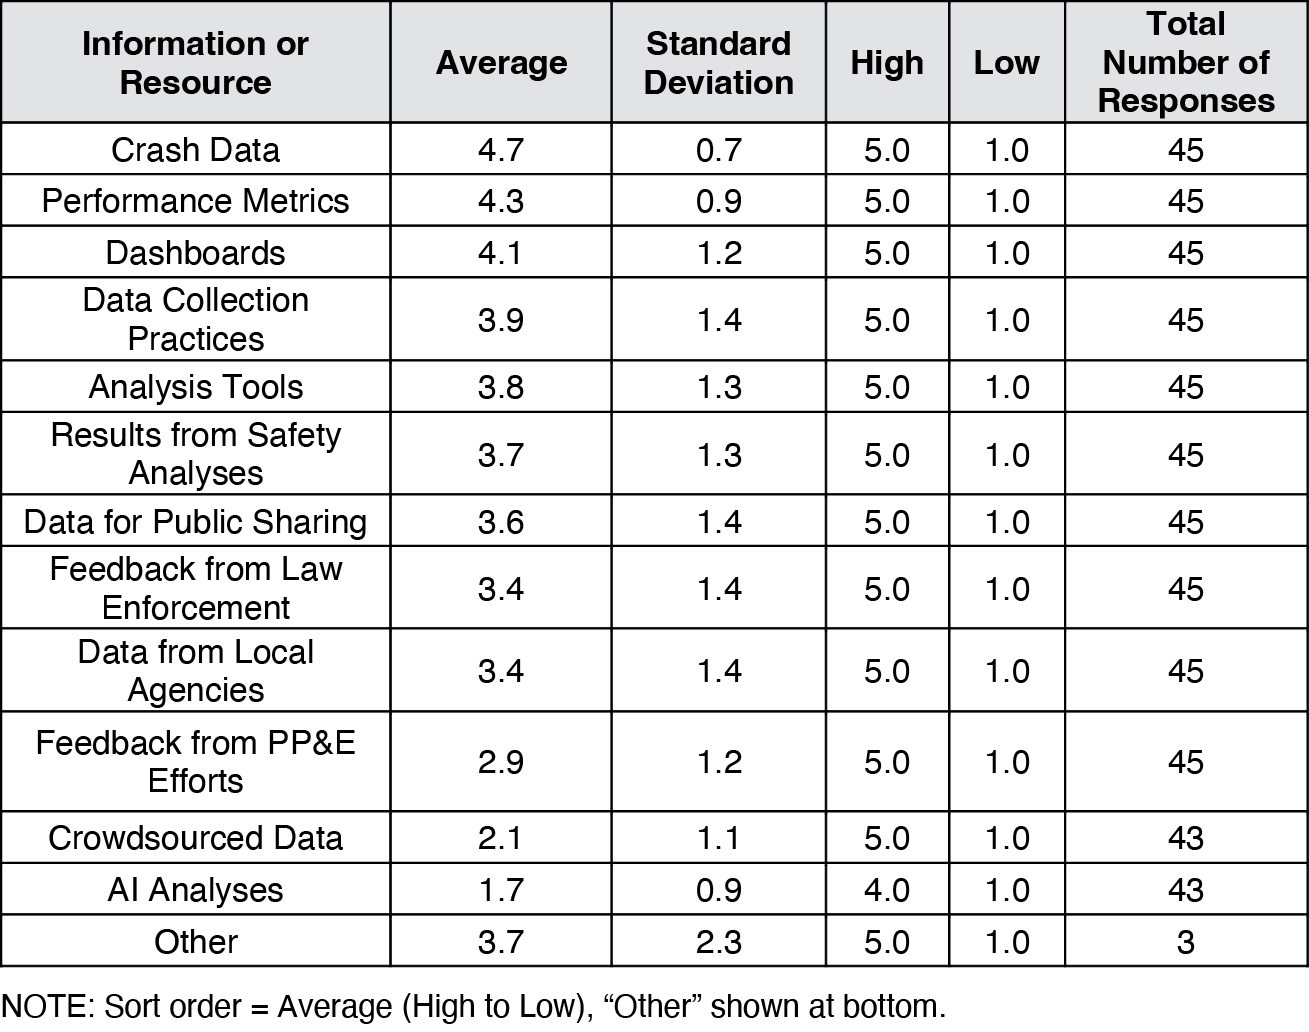
Long Description.
The table has 6 columns and 14 rows. The column headers in Row 1 are Information or Resource; Average; Standard Deviation; High; Low; Total Number of Responses. Row 2: Crash Data; 4.7; 0.7; 5.0; 1.0; 45. Row 3: Performance Metrics; 4.3; 0.9; 5.0; 1.0; 45. Row 4: Dashboards; 4.1; 1.2; 5.0; 1.0; 45. Row 5: Data Collection Practices; 3.9; 1.4; 5.0; 1.0; 45. Row 6: Analysis Tools; 3.8; 1.3; 5.0; 1.0; 45. Row 7: Results from Safety Analyses; 3.7; 1.3; 5.0; 1.0; 45. Row 8: Data for Public Sharing; 3.6; 1.4; 5.0; 1.0; 45. Row 9: Feedback from Law Enforcement; 3.4; 1.4; 5.0; 1.0; 45. Row 10: Data from Local Agencies; 3.4; 1.4; 5.0; 1.0; 45. Row 11: Feedback from PPE Efforts; 2.9; 1.2; 5.0; 1.0; 45. Row 12: Crowd Sourced Data; 2.1; 1.1; 5.0; 1.0; 43. Row 13: AI Analyses; 1.7; 0.9; 4.0; 1.0; 43. Row 14: Other; 3.7; 2.3; 5.0; 1.0; 3. The note for Sort order equals Average, High to Low. Other is shown at bottom.
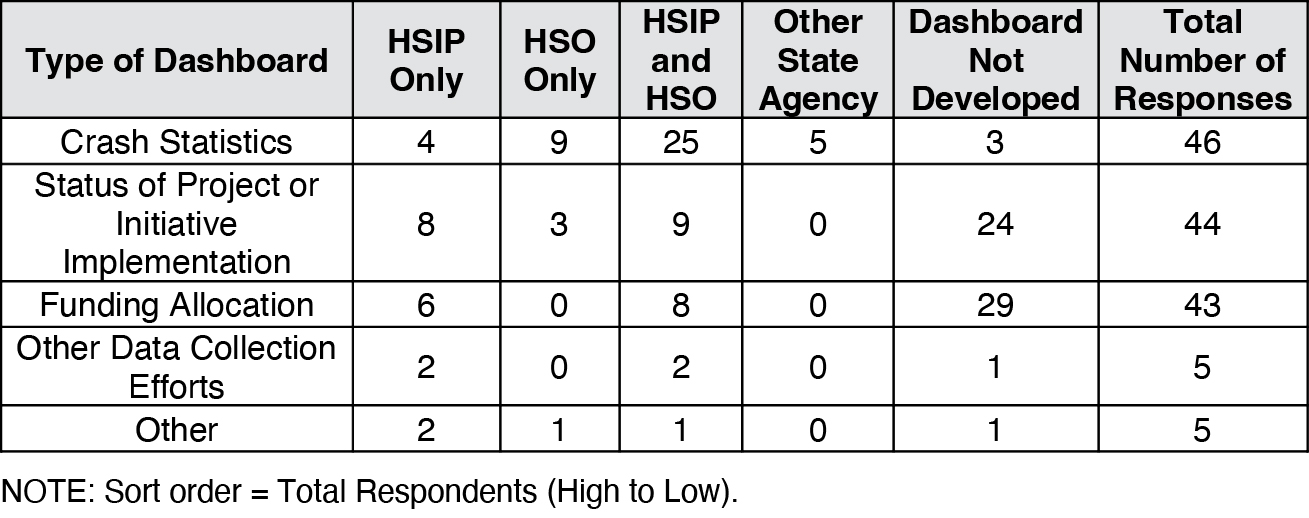
Long Description.
The table has 7 columns and 6 rows. Row 1: Type of Dashboard; HSIP Only; HSO Only; HSIP and HSO; Other State Agency; Dashboard Not Developed; Total Number of Responses. Row 2: Crash Statistics; 4; 9; 25; 5; 3; 46. Row 3: Status of Project or Initiative Implementation; 8; 3; 9; 0; 24; 44. Row 4: Funding Allocation; 6; 0; 8; 0; 29; 43. Row 5: Other Data Collection Efforts; 2; 0; 2; 0; 1; 5. Row 6: Other; 2; 1; 1; 0; 1; 5. The note for Sort order reads Total Respondents High to Low.
most respondents indicated joint maintenance by HSIP and HSO. Dashboards related to the status of project implementation and funding allocation were less commonly developed, with 24 and 29 responding DOTs reporting that these types of dashboards have not been developed, respectively. For the other data collection efforts category, examples included Kansasʼs VRUSA, Maineʼs Public Crash Query Tool and Bureau of Highway Safety Data Warehouse, New Mexicoʼs VRUSA, and Virginiaʼs tracking of HSIP project locations for evaluation purposes. In the Other category, responses included examples such as crash data portals, safety corridor dashboards, and incident management tracking tools maintained by various state agencies.
Question 18, a follow up to Question 17, asked which of the dashboards previously identified are publicly accessible. For this question, respondents were asked to select all dashboard types available to the public in their state. Among the 38 respondents who answered this question, crash statistics dashboards were the most widely available, reported by 34 responding DOTs. Dashboards related to the status of project or initiative implementation are publicly available in nine states, while two responding DOTs reported public access to funding allocation dashboards. Five responding DOTs indicated that dashboards related to other data collection efforts were available to the public, and seven responding DOTs selected Other. In the other data collection efforts category, publicly available dashboards included topics such as lane departures, VRU safety, crash reporting timeliness, and performance dashboards like VRUSA. Dashboards noted in the Other category included crash trend summaries, safety corridor data, roadway clearance times, and statewide community crash maps. The results are presented in Figure 28.
Question 19 asked DOTs to identify the methods used to share data and information between their stateʼs HSO and HSIP programs (multiple responses were allowed). Twenty-eight states reported using data requests on an as-needed basis, while 23 indicated that data is pushed at regular intervals. Eleven states reported having formal data sharing agreements, and seven use a shared server. Twelve states selected Other, citing approaches such as shared office space, shared management, academic partnerships, or specialized platforms like AASHTOWare Safety. The results are summarized in Figure 29.

Long Description.
The chart shows six horizontal bars. Crash Statistics shows 34. Status of Project or Initiative Implementation shows 9. Other shows 7. Other Data Collection Efforts shows 5. Funding Allocation shows 2. None of the following types of dashboards are available to the public shows 0. The note below reads, Respondents could select multiple answers. Sort order equals Count High to Low. Total number of responses equals 38.

Long Description.
The chart shows six horizontal bars. Data requests on an as needed basis shows 28. Data pushed at regular intervals shows 23. Other shows 12. Data sharing agreement shows 11. Shared server shows 7. None of the above shows 0. The note below reads as follows. Respondents could select multiple answers. Sort order equals Count High to Low. Total number of responses equals 46.
Public Participation and Engagement (PP&E) Efforts
Questions 20 and 21 focused on how states approach PP&E activities, including which entities typically lead these efforts and how HSIP and HSO programs collaborate to support them.
Question 20 asked which entity typically takes the lead on PP&E efforts (see Table 13 for the results). Out of the 46 responses, 28 responding DOTs indicated that leadership depends on the context. Twelve responding DOTs reported that HSO leads PP&E efforts, while one selected HSIP as the lead. Five responding DOTs selected Other, with responses indicating that leadership of PP&E efforts varies depending on the topic or area. Some responding DOTs noted that traffic safety or behavioral efforts are led by the HSO, while infrastructure or engineering efforts fall under HSIP or other related offices.
Question 21 focused on the methods used by HSIP and HSO to collaborate or share information for PP&E efforts (see Figure 30). The most reported method was sharing PP&E results on an as-needed basis, selected by 25 responding DOTs. Eighteen responding DOTs reported joint participation in PP&E activities, and nine regularly shared PP&E results. Three responding DOTs reported using a shared website. Seven respondents selected Other, with examples including collaboration through agency websites, integrated units, or local traffic safety commissions involving both HSIP and HSO representatives.

Long Description.
The table has 2 columns and 6 rows. The column headers in Row 1 are Entity; Count. Row 2: HSIP or HSO depending on context; 28. Row 3: HSO; 12. Row 4: Other; 5. Row 5: HSIP; 1. Row 6: The total number of responses is 46. A note reads Sort order equals Response from High to Low.

Long Description.
The chart shows six horizontal bars. PPE results shared on as needed basis shows 25. Joint participation in PPE activities shows 18. PPE results shared on regular basis shows 9. Other shows 7. Shared website for PPE outreach shows 3. None of the above shows 0. The note below reads as follows. Respondents could select multiple answers. Sort order equals Count, High to Low. Total number of responses equals 39.
Organizational Structures of HSIP and HSO
Questions 1 through 6 of the survey sought information about the organizational structures of HSIP and HSO.
The first survey question asked responding DOTs if their HSO was located within the DOT or another state agency. Of the 46 responding DOTs, 24 indicated that their HSO is under the DOT, 21 noted that their HSO is under another state agency, and 1 DOT did not answer this question. Figure 31 is a map showing HSO location by type. Examples of other state agencies include State Police, Department of Public Safety, Department of Safety and Homeland Security, and Department of Motor Vehicles (DMV).
The second survey question asked who the DOTʼs HSIP manager reports to. Figure 32 is a map showing the results for this question. From 46 responses, 18 responding DOTs indicated that the HSIP manager reports to a division head (e.g., a Director of Traffic Engineering or Planning Division Director); 12 responding DOTs said the manager reports to the State Highway Safety Engineer; 7 responding DOTs reported to other executive staff, including positions such as Chief Engineer or Assistant Secretary of Operations. Another seven responding DOTs selected Other, with examples including Assistant State Traffic Engineer and Section Managers. Finally, two responding DOTs indicated that the HSIP manager reports directly to the head of the DOT.
Question 3 examined the specific responsibilities performed by the DOTʼs HSIP manager and asked respondents to select all applicable job duties from a provided list. Of the 46 responses, 45 indicated that completing the HSIP annual report is part of the role. Other commonly selected duties included evaluating projects (42 responses), tracking HSIP budgets and allocations (37 responses), identifying projects (30 responses), and approving projects (29 responses). Twelve responding DOTs reported that the HSIP manager leads education or public outreach campaigns. Fourteen responding DOTs selected Other, with additional responsibilities such as managing crash data systems, providing guidance to district staff, overseeing SHSP and VRUSAs, ensuring federal compliance, and coordinating with programs like the Fatality Analysis Reporting System (FARS), Intelligent Transportation Systems (ITS), and the Railroad Grade Crossing Safety Program. Figure 33 shows the survey results for Question 3.

Long Description.
The map shows three groups of states. States marked as DOT include Alaska, Arizona, Oregon, Montana, Idaho, Wyoming, Colorado, New Mexico, North Dakota, Nebraska, Kansas, Missouri, Wisconsin, Illinois, Kentucky, West Virginia, North Carolina, Georgia, Florida, Pennsylvania, New York, Rhode Island, and Connecticut. States marked as other state agency include Washington, California, Nevada, Utah, South Dakota, Minnesota, Arkansas, Louisiana, Mississippi, Tennessee, New Hampshire, Indiana, New Jersey, Massachusetts, New Hampshire, Maine, Delaware, Michigan, Ohio, Virginia, South Carolina, and Washington DC. States marked as no response are Oklahoma, Iowa, Alabama, Hawaii, Maryland, and Texas. The map is created with mapchart dot net.

Long Description.
The map shows six groups of states. States marked as Head of DOT include New Jersey and New Hampshre. States marked as State Highway Safety Engineer include Montana, Arizona, Kansas, Missouri, Louisiana, Mississippi, Michigan, North Carolina, South Carolina, Virginia, Rhode Island, and Alaska. States marked as Other Division Head include Oregon, California, Utah, Colorado, Nebraska, North Dakota, Minnesota, Wisconsin, Indiana, Kentucky, Arkansas, West Virginia, New York, New Mexico, Massachusetts, Vermont, Connecticut, and Delaware. States marked as Other Executive Staff include Nevada, Wyoming, Ohio, Tennessee, Florida, Washington, DC, and Maine. States marked as Other include Washington, Idaho, South Dakota, Illinois, Georgia, Maryland, and Pennsylvania. States marked as no response are Oklahoma, Texas, Hawaii, Iowa, and Alabama. The map is created with mapchart dot net.

Long Description.
The chart shows eight horizontal bars. Completes HSIP annual report shows 45. Evaluates projects shows 42. Tracks HSIP budgets slash allocations shows 37. Identifies projects shows 30. Selects projects shows 29. Approves projects shows 29. Other shows 14. Leads education slash public outreach campaigns shows 12. The note reads as follows. Respondents could select multiple answers. Sort order equals Count, High to Low. Total number of responses equals 46.
Question 4 asked who the head of the stateʼs HSO reports to. Figure 34 represents the results of the HSO leadership reporting structure across states by agency type. Of the 46 responses, 13 responding DOTs selected “other intermediate division head,” including positions such as Bureau Chief of Policy and Planning, Planning Division Administrator, and Assistant Commissioners. Ten responding DOTs reported Other, with responses including roles like the State Traffic Engineer, Florida DOT Assistant Secretary, and the Attorney General. Eight responding DOTs indicated that the HSO head reports to the State Director for the Department of Public Safety, while five reported the State Director for DOT. Four responding DOTs chose other state departments (e.g., Michigan State Police or Deputy Mayorʼs office), while three responding DOTs each selected the Governor or the State Director for the Bureau of Motor Vehicles.
Question 5 asked for which entities the state has developed an organizational chart. Thirteen responding DOTs reported having an organizational chart for the HSO only, followed by 11 responding DOTs that indicated charts exist for both the HSIP and HSO. Ten responding DOTs noted that no organizational chart has been developed for either program, while nine respondents were unsure. Three states reported having an organizational chart for HSIP only.
Question 6 asked about the approximate number of employees working within each stateʼs HSIP and HSO (see Table 14). Responses indicate that HSIPs tend to be smaller in size, with 14 states reporting one to three employees and 11 states reporting four to six employees. In contrast, HSO programs are generally larger, with 11 states indicating 21 or more employees and an additional 9 states each reporting between 7 to 10 and 11 to 15 employees. Although most respondents were able to provide an estimate, five states were unsure about HSO staffing levels, whereas none reported uncertainty about HSIP.
Challenges and Opportunities for HSIP and HSO Coordination
Questions 22 and 23 explored the challenges that hinder coordination between HSIPs and HSOs and alternative opportunities for collaboration when formal coordination during the HSIP process is absent. DOTs were asked to identify key barriers as well as describe existing efforts and mechanisms used to facilitate communication and alignment across the two programs.

Long Description.
The map shows eight groups of states. States marked as Governor include Washington, Arizona, and Louisiana. States marked as State Director for the Bureau of Motor Vehicles include Oregon, West Virginia, and Virginia. States marked as State Director for Department of Public Safety include Nevada, Utah, South Dakota, South Carolina, Tennessee, Mississippi, Delaware, and New Hampshire. States marked as State Director for DOT include Colorado, North Dakota, Wisconsin, Illinois, and Kentucky. States marked as Other intermediate division head include Idaho, Montana, Wyoming, New Mexico, Nebraska, Kansas, Minnesota, Missouri, Arizona, Ohio, New York, Connecticut, and Massachusetts. States marked as Other State Department include California, Indiana, Michigan, and the District of Columbia. States marked as Other include Alaska, Pennsylvania, North Carolina, Georgia, Florida, Maryland, New Jersey, Rhode Island, Vermont, and Maine. States marked as no response are Oklahoma, Texas, Alabama, Iowa, and Hawaii. The map is created with mapchart dot net.

Long Description.
The table has 8 columns and 3 rows. The column headers in Row 1 are Organization; 1 to 3; 4 to 6; 7 to 10; 11 to 15; 16 to 20; 21 or More; Unsure. Row 2: HSIP; 14; 11; 8; 7; 1; 3; 0. Row 3: HSO; 1; 3; 9; 9; 5; 11; 5.
Question 22 asked respondents to identify the most significant challenges hindering coordination between HSIP and HSO, allowing up to three selections. Staffing constraints were the most frequently cited challenge, reported by 23 responding DOTs. Differences in organizational structures or processes were identified by 18 responding DOTs, and 14 responding DOTs cited funding constraints. Ten responding DOTs indicated the need to coordinate with internal and external partners, while nine responding DOTs reported challenges with evaluating program performance. Data availability was selected by 6 responding DOTs, and 4 responding DOTs noted differences in data collection practices or standards. Two responding DOTs cited stakeholder concerns. Additionally, 5 responding DOTs selected Other and provided open-ended responses, describing issues such as internal turf boundaries, lack of familiarity with the other program, and difficulty obtaining leadership support. The results are presented in Figure 35.
Question 23 asked states whether, in the absence of coordination with the HSO during the HSIP process, there are other opportunities to discuss safety efforts. Among the 44 respondents to this question, 16 indicated that alternative opportunities exist, while 2 reported no additional

Long Description.
The chart shows 10 horizontal bars. Staffing constraints shows 23. Differences in organizational structures or processes shows 18. Funding constraints shows 14. Need to coordinate with internal and external partners shows 10. Evaluating program performance shows 9. Data availability shows 6. Other shows 5. Differences in data collection practices or standards shows 4. Stakeholder concerns shows 2. None of the above shows 0. The note reads as follows. Respondents could select up to 3 answers. Sort order equals Count from High to Low. Total number of responses equals 40.
coordination avenues. The remaining 26 respondents noted that their DOT already coordinates with the HSO during the HSIP process. Open-ended responses highlighted various mechanisms for collaboration, such as SHSP development, standing interagency meetings, advisory councils, and task forces focused on roadway safety.
Other Survey Feedback
The final section of the survey gathered general feedback about agency interest in follow-up engagement and insights into how HSIP and HSO representatives collaborated in completing the survey. Responses to these questions helped contextualize the level of interagency communication and willingness to contribute further to the study.
Question 24 asked whether agencies would be interested in participating in a follow-up case example interview. Of the 44 respondents who answered this question, 15 responding DOTs expressed interest in participating.
Question 25 explored how the HSIP and HSO teams collaborated in completing the survey, (see Table 15). Twenty-two responding DOTs reported that they completed the survey without input from the HSO. Joint or partially coordinated efforts were less common, with six agencies completing it together, five seeking input from the HSO, and one responding DOT having the HSO review the responses. An additional 12 respondents selected Other and provided details indicating variations in collaboration, including responses completed by shared managers, Safe System leads, or completed by DOT due to time constraints.

Long Description.
The table has 2 columns and 7 rows. The column headers in Row 1 are Response; Count. Row 2: DOT exclusively filled out survey without input from HSO; 22. Row 3: Other; 12. Row 4: DOT and HSO filled out survey jointly at the same time; 6. Row 5: DOT shared survey questions with HSO and HSO provided input; 5. Row 6: DOT completed survey and HSO reviewed survey responses; 1. Row 7: Total Number of Responses; 46. NOTE: Sort order equals Response, from High to Low.
Summary of Key Survey Findings
Key findings from the survey are presented below by topic (and summarized in Table 16). Individual survey responses for all questions are available in Appendix B.
Coordination of Activities and Programs Between HSIP and HSO
- Among the 46 respondents, 41 reported that their DOT serves as the custodian of the SHSP, underscoring the DOTʼs dominant role in overseeing statewide safety planning efforts.
- SHSP development (average score 4.5) and identification of safety focus areas (4.2) received the highest level of coordination ratings for activities, indicating that collaboration is strongest during statewide safety planning.
- Regarding coordination of programs, the average coordination level is highest for VRUSA (3.5) and lowest for railroad at-grade crossings (1.8).

Long Description.
The table has 2 columns, 21 rows, and 5 section headers. The column headers in Row 1 are Description; Finding. First Section Head: Organizational Structures. Row 2: Number of responding DOTs with HSO under DOT; 25. Row 3: Most commonly supervisory structure for the HSIP manager; Other division head, 18. Row 4: Most commonly reported job duty of the HSIP manager; Completes HSIP annual report, 45. Row 5: Most commonly reported supervisor of the HSO head; Other intermediate division head, 13. Row 6: Most common entity for which an organization chart has been developed; HSO only, 13. Second Section Head: Coordination of Activities and Programs. Row 7: Number of responding DOTs identifying DOT as SHSP custodian; 41. Row 8: Most coordinated activity between HSIP and HSO; Development of SHSP. Row 9: Most coordinated program between HSIP and HSO; VRUSA. Row 10: Most common uses of NHTSA penalty funds; Alcohol-Impaired Driving Programs, 23, and HSIP Eligible Activities, 23. Row 11: Highest-rated area of coordination by safety focus; VRUs. Row 12: Most common method used to coordinate HSIP and HSO activities; Meetings at regular intervals, 29. Third Section Head: Sharing of Resources, Data, and Dashboards. Row 13: Number of responding DOT s that have developed coordination-related guidance or policy documents; 7. Row 14: Most common custodian of crash data; DOT, 21. Row 15: Highest level of information and resource sharing between HSIP and HSO; Crash Data. Row 16: Dashboards type most commonly available to the public; Crash Statistics, 34. Row 17: Most common method to share data between HSO and HSIP programs; Data requests on an as-needed basis, 28. Fourth Section Head: PPE Efforts. Row 18: Entity that most often leads PPE efforts; HSIP or HSO depending on context. Row 19: Most common method used to collaborate on PPE efforts; PPE results shared on an as-needed basis. Fifth Section Head: Challenges and Opportunities. Row 20: Most perceived challenge for coordinating HSIP and HSO activities; Staffing Constraints. Row 21: Survey completion method most commonly reported by responding DOT s; Exclusively by the DOT without input from the HSO.
- Most states assign leadership for infrastructure-heavy programs like VRUSA and HRRR to HSIP, while HSO most often leads behavioral programs such as NHTSA penalty fund use.
- Alcohol-impaired driving programs and HSIP-eligible activities are the most common uses of NHTSA penalty funds, each reported by 23 responding DOTs, showing a balanced investment in behavioral and infrastructure safety.
- Regarding safety focus areas, coordination is strongest for topics such as VRUs (3.7) and speeding (3.5), while lower scores were reported for aggressive driving (2.9) and commercial vehicles (2.8), indicating uneven collaboration across focus areas.
- The most frequently used coordination methods are regular meetings (29 responding DOTs) and document sharing (28 responding DOTs), suggesting that structured communication is key to cross-program integration.
HSIP and HSO Sharing of Resources, Data, and Dashboards
- Seven responding DOTs indicated that their states have developed formal guidance or policy documents to support coordination between HSIPs and HSOs (see table of resources in Appendix D, which can be found by searching nationalacademies.org/publications for NCHRP Synthesis 661).
- Although 21 responding DOTs identified the DOT as the custodian of crash data, the remaining respondents were split between the State Highway Patrol (8 responding DOTs) and other state agencies (17 responding DOTs), indicating a diverse range of data governance models.
- Crash data was reported to be the most shared information between HSIP and HSO, with an average rating of 4.7 on a 5-point scale. In contrast, crowdsourced data and AI analyses received the lowest ratings (2.1 and 1.7, respectively), reflecting emerging or underused practices.
- For dashboards related to crash statistics, 25 respondents reported joint maintenance by HSIP and HSO. Funding allocation dashboards are less common, with 14 responding DOTs indicating that they are maintained by HSIP or HSIP and HSO. This points to limited dashboard deployment beyond basic crash reporting.
- Crash statistics dashboards are the most publicly accessible, as reported by 34 out of 38 respondents, whereas public access to dashboards on project implementation status (9 responding DOTs) or funding allocation (2 responding DOTs) remains rare.
- The most common method for sharing data and information was “as-needed data requests,” (28 responding DOTs), followed by routine data pushes (23 responding DOTs). Formal agreements (11) and shared servers (7) were less prevalent, implying reliance on informal or ad hoc mechanisms.
Public Participation and Engagement (PP&E) Efforts
- Most responding DOTs (28 out of 46) indicated that leadership for PP&E efforts varies depending on the context, with responsibilities typically shared between HSIP and HSO. This reflects a flexible and situational approach to public engagement leadership.
- The most reported method for collaboration on PP&E efforts was sharing results on an as-needed basis, selected by 25 respondents. Fewer responding DOTs reported joint participation (18) or regularly scheduled sharing (9), suggesting that PP&E-related coordination remains largely informal and reactive.
Organizational Structures of HSIP and HSO
- Out of 46 responding DOTs, 24 reported that their HSO is housed within the DOT, 21 responded that their HSO is located within another state agency, 1 did not answer this question.
- HSIP managers most commonly report to a division head (18 responding DOTs), followed by the State Highway Safety Engineer (12). Fewer report to executive leadership (7), Other (7), or the DOT head directly (2), suggesting varied placement across organizational hierarchies.
- Nearly all respondents (45 out of 46 responding DOTs) indicated that HSIP managers are responsible for completing the HSIP annual report. Other common responsibilities include project evaluation (42), budget tracking and allocation (37), project identification (30), and project approval (29).
- Twelve responding DOTs reported that HSIP managers lead education or public outreach campaigns, while 14 selected other responsibilities such as crash data system oversight or SHSP coordination, suggesting that HSIP roles in some states extend beyond core program administration.
- The most common HSO reporting structures are HSO director reports to an intermediate division head (e.g., Bureau Chief of Policy and Planning, Planning Division Administrator, and Assistant Commissioners) (13 responding DOTs), followed by HSO director reports to the State Director for the Department of Public Safety (8 responding DOTs).
- Regarding the existence of organizational charts for HSIP and HSO, the most common survey responses were organizational charts for HSO only (13 responding DOTs) and organizational charts for both HSIP and HSO (11 responding DOTs).
- HSIPs tend to have smaller staffs, with 25 responding DOTs reporting from 1 to 6 employees. HSO programs generally have larger staff, with 11 responding DOTs indicating 21 or more employees. Five responding DOTs were unsure about HSO staffing levels.
Challenges and Opportunities for HSIP and HSO Coordination
- As reported by 23 of the 40 respondents, staffing constraints were identified as the most significant barrier to effective coordination between HSIP and HSO. Other frequently cited challenges included structural or procedural differences (18), funding limitations (14), and the need to coordinate with internal and external partners (10). These findings suggest that both organizational and resource-based issues are perceived by responding DOTs as challenges to inter-program collaboration.
- When asked about opportunities to coordinate outside the formal HSIP process, 16 out of 44 respondents noted that alternative mechanisms such as SHSP development meetings, advisory councils, or interagency task forces are available. Meanwhile, over half (26 responding DOTs) indicated that coordination with HSO already occurs within the HSIP process, suggesting that many states have integrated collaborative practices.
Other
- Out of 46 responding DOTs, 22 reported that the DOT exclusively completed the survey without input from the HSO, while 6 indicated that the entities filled it out jointly. This response pattern may reflect limited day-to-day interaction between the HSIP and HSO programs in many states.


