Designing for Target Speed, Volume 1: Operating Speed and Road Elements (2026)
Chapter: Appendix C: Proposed Data Framework for Investigating the Relationship of Speed with Road Elements
APPENDIX C. PROPOSED DATA FRAMEWORK FOR INVESTIGATING THE RELATIONSHIP OF SPEED WITH ROAD ELEMENTS
OVERVIEW OF CONCEPTUAL FRAMEWORK FOR DATABASE
For the data framework, the research team began with the three categories of elements provided in the Request for Proposal (RFP) for NCHRP Project 15-76. The broad definitions can be generally applied as follows:
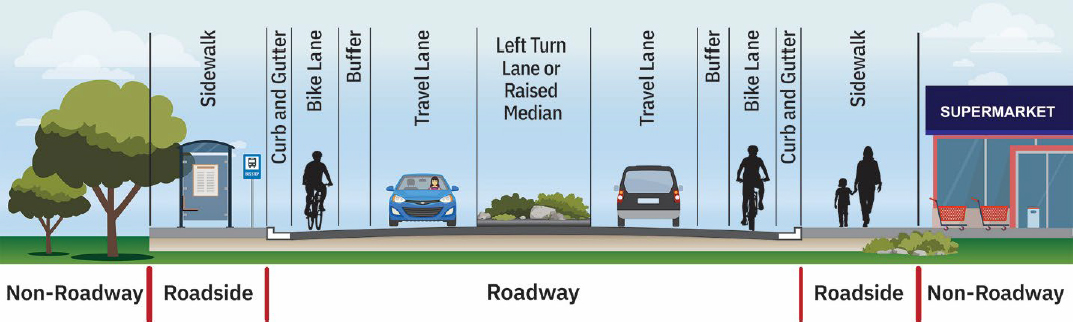
- Roadway: elements found within the paved travel surface (e.g., between the curbs or between the edges of the shoulders).
- Roadside: elements found adjacent to the roadway that can be included as part of the design of the facility and have a potential effect on speed.
- Non-roadway: elements not in the roadway or roadside, often not under the control of the designer, but still having a potential effect on speed.
To help organize and conceptualize the data, the three categories of elements can be spatially represented as zones on a given cross-section. An example cross-section is shown in Figure C-1; cross-sections that contain other elements may have category zone boundaries different from this.
RECOMMENDATION FOR THE PROPOSED NCHRP 15-76 DATABASE
Examples of factors in each of the three categories are listed in the RFP, but the findings revealed in the literature review and the review of previous related research suggested that additional categories to describe those and other factors would be beneficial in terms of defining a potential study site matrix. Table A-2 summarizes several factors identified from the literature that could affect operating speed. For example, elements that can be found in the roadway zone can be subdivided into those factors that are directly within the designer’s control (e.g., roadway geometry for a cross-section and roadway geometry for a corridor) and those that are associated with traffic volume, or those associated with traffic control devices.
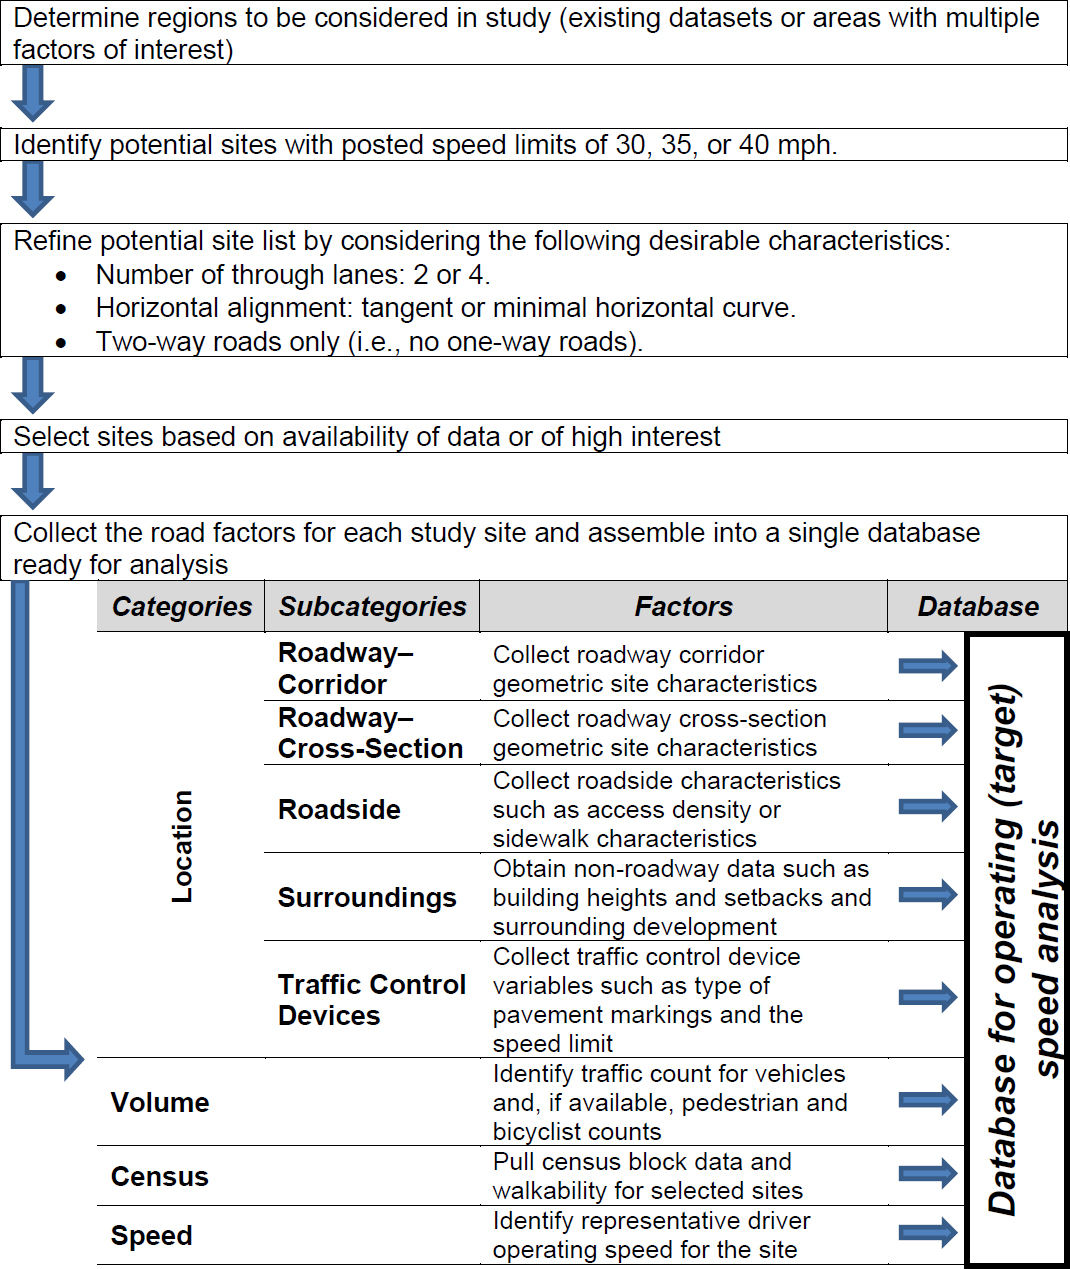
Based on reviews, as well as parameters defined within the RFP and discussion with the project panel, the research team identified the following four key categories to organize the data needed to explore the relationships among site factors and operating speed:
- Location characteristics.
- Volume.
- Census.
- Speed.
Figure C-2 shows these groups along with an overview of the workflow needed to develop the database to be used to evaluate the relationships with speed. An initial step is to identify potential sites within the posted speed limit range for the project (30, 35, or 40 mph). To aid in managing the number of factors, the research team defined the following additional fixed variables based upon consideration of information in the literature, guidelines, and previous experience that will guide selection of study sites:
- Number of through lanes: 2 or 4.
- Median type: raised, TWLTL, or none.
- Horizontal alignment: tangent or minimal horizontal curve.
- Two-way roads only (i.e., no one-way roads).
- Curb-and-gutter treatment on edge of travel surface (i.e., no shoulders).
After discussion with the panel, the decision was made to include streets with either curbs or with shoulders, so the final bullet in the above list was removed as one of the fixed variables. The median type restriction was also removed.
POTENTIAL SOURCES FOR STUDY SITES
A key to the success of this NCHRP project was the ability to connect operating speed with site-specific elements to identify relationships for target speed selection. Identifying those relationships required a large and comprehensive database. In addition to the operating speed measure, this database needed at least the roadway, roadside, surrounding area, land use, traffic control devices, and traffic volume characteristics for the roadway segment in question. Data available from census databases also helped to explain some of the variability in speed on a segment. A database that included all the needed pieces did not exist prior to this project. Therefore, this effort sought to identify available data sources that could provide large quantities of data of interest with the intent to merge these datasets to form the database that would be used in the evaluation.
Because of the large number of factors that could influence operating speed, the database needed to include a large number of sites with data from multiple sources. Therefore, the goal was to identify a) existing datasets that include data for many locations so that a larger number of sites could be available, and b) data sources or methods of collecting data that allow for efficient data collection for many locations. Initial efforts focused on identifying a potential list of study sites, while additional efforts emphasized sources for operating speed data and for location characteristics data for the segments ultimately chosen as study sites.
With the availability of big data (vendor) sources for speed data, the research team could consider having multiple sites that could include a wide range of values for the factors of interest. Rather than being limited to a specific city or metropolitan area within a region to keep travel to a minimum, the research team was able to consider more sites in more locations to provide not only a geographic distribution but also a more robust sample of sites. To that end, researchers also considered appropriate sources for information on identifying potential study sites. Appropriate sources contained, at a minimum, information on posted speed limit to be able to identify sites in the 30 to 40 mph range. Researchers also identified sources available within the team that contained information on key factors that are anticipated to be of interest for the Phase II analysis, such as number of travel lanes, presence of bicycle lanes, sidewalk separation, horizontal alignment, building setback, residential density, and road network density.
Based on those criteria, the research team envisioned using a combination of study sites already known to the team along with study sites to be identified during Phase II. Existing database of potential sites already available to the research team included the following:
- Sites in Austin, Texas, collected as part of NCHRP Project 17-76 (Guidance for the Setting of Speed Limits).
- Sites in the San Antonio, Texas district, collected as part of Texas DOT (TxDOT) Project 0-7049 (Improving and Communicating Speed Management Practices).
- Sites included a recent FHWA study (Development of Pedestrian-Intersection Crash Modification Factors).
- Sites included in NCHRP Project 3-141 (Guidance on Midblock Pedestrian Signals).
These sources represented more than 1,000 potential sites. An additional bonus to using study sites identified in the above sources was that some of the factors of interest to this NCHRP
study were already available. In addition to these potential sources of study sites, several databases or websites could be used to identify additional sites which would help to address the requirement of having multiple regions represented in the database. Potential sources to identify sites included:
- Portland, Oregon.
- Dallas, Texas.
- Several states.
- Selected cities.
NCHRP 17-76
NCHRP 17-76 built a database using sites from the City of Austin. Much of the speed data were obtained by the City of Austin for their traffic calming program. About a quarter of the database included speed data collected by the NCHRP 17-76 (Fitzpatrick et al. 2021b, Fitzpatrick et al. 2021c) team. The database was supplemented with additional factors identified during NCHRP 15-76, including Census data added to explore the potential of those factors for Phase II.
TxDOT 0-7049
Members of the research team developed a speed database using sites in the San Antonio district of Texas for a concurrent TxDOT project (Fitzpatrick et al. 2024). Data from that database was merged with the NCHRP 17-76 database for use in NCHRP 15-76 Phase I efforts.
FHWA, Development of Pedestrian-Intersection Crash Modification Factors Project
The FHWA sponsored a project (Development of Pedestrian-Intersection Crash Modification Factors) to investigate the influence of intersection corner radius on pedestrian crashes and right-turn vehicle speed (Fitzpatrick et al. 2022, Fitzpatrick et al. 2021a). The research team for that project built a database that would permit the investigation of the relationship of corner radius to crashes. The database, called PedCMF, included several variables of interest to this NCHRP project.
Sites selected by the research team had volume data files available. The database had sites from three states. The research team selected intersections with the following characteristics (Fitzpatrick et al. 2022):
- At least a full 2-h turning movement count of vehicles and pedestrians.
- Traffic control signal presence at the intersection.
- Typical intersection geometric configurations (including three- and four-leg intersections), removing intersections with five legs or a large skew.
- No road or sidewalk construction visible during the years matching the crash data.
The research team assembled a spreadsheet with one record for each intersection corner (i.e., a four-leg intersection would be described by four records) and variables to describe the approach and receiving legs in relation to the right-turn movement at the corner (Fitzpatrick et al. 2022). A total of 1,285 corners were used in the statistical analysis. The number of intersections with 30- to 40-mph posted speed limits was 208, spread across three states (OR, VA, WA).
The results of the FHWA study included a corner radius crash modification factor (CMF) and a speed-prediction equation for right-turn speeds. The report documented the following findings (Fitzpatrick et al. 2022): “The corner radius can be unique to each corner at an intersection; therefore, this study assigned crashes to an intersection corner rather than to the entire intersection. For corner-level pedestrian crashes, the following variables were found to be positively related: pedestrian volume on the approach leg, pedestrian volume on the receiving leg, vehicle volume on the approach leg, vehicle volume on the receiving leg, corner radius, and shoulder width. The number of pedestrian crashes was higher when both legs at a corner were one-way streets with traffic moving away from the corner or when there was a mix of two-way and one-way operations present at the intersection. Fewer pedestrian crashes occurred when on-street parking existed on the approach leg. The findings from the study support the development of a crash modification factor (CMF) for corner radius. Assuming a baseline condition of 10 ft, the pedestrian CMFs for corner radius for the range of corner radii included in the evaluation went from 1.00 for a 10-ft radius to 1.59 for a 70-ft radius.”
NCHRP 3-141
The midblock pedestrian signal (MPS) treatment has been used for more than 40 years, especially by the City of Los Angeles. The MPS operates similarly to a coordinated-actuated vehicular traffic control signal at a midblock crossing, except it displays a flashing red indication in place of a solid red indication during the pedestrian clearance interval. The objective of that NCHRP research (Fitzpatrick et al. 2023) was to summarize the effectiveness of MPS installations and propose language suitable for inclusion in the MUTCD. As of the time the review on NCHRP 15-76 was conducted, the research team on NCHRP 3-141 had created a database of 899 pedestrian crossings with 194 sites having a MPS and the other 705 sites having other types of traffic control such as signals or pedestrian hybrid beacons. For each site, the team collected roadway geometric data, pedestrian and vehicle volume, posted speed limit, and crashes. The number of sites with 30- to 40-mph posted speed limit was 540 intersections spread across three states (CA, TX, UT).
City of Portland
The city of Portland collects 24-hour counts of vehicles and vehicle speeds on a variety of Portland streets and makes the data available so that a user can download the data from an interactive website (City of Portland 2022). The data are used for traffic trends and to analyze speeding trends for traffic calming. The traffic speed tab includes several speed measures including the 50th and 85th percentile speed along with the posted speed limit. It also includes the X and Y coordinates, which facilitated the matching of the speed data with census data. The data were downloaded during NCHRP 15-76 Phase I to verify their usability. A total of 348 sites had 30- to 40-mph posted speed limits.
City of Dallas
As part of previous TxDOT projects, speed limit data were purchased from HERE and a GIS layer for streets and roads in Dallas was refined to identify segments with various ADTs or speed limits. Those segments with speed limits of 30, 35, or 40 mph were identified as part of
NCHRP 15-76 Phase I. The resulting database includes 234 roadway segments with traffic volumes and cross-section (e.g., number of lanes and lane width) information.
States of Maine, Massachusetts, Ohio, Utah, Virginia, and West Virginia
Several states have websites with roadway data, including posted speed limits. The research team identified websites for the following states:
- Maine (Maine DOT 2022).
- Massachusetts (Massachusetts DOT 2022).
- Ohio (Ohio DOT 2022).
- Utah (Utah DOT 2022).
- Virginia (Virginia DOT 2022).
- West Virginia (West Virginia DOT 2022).
Using Virginia as an example, the website showed the following number of sites for conventional (rather than variable school) speed limits of interest:
- 30 mph – 709 segments, 789 mi in length.
- 35 mph – 5,938 segments, 7,183 mi in length.
- 40 mph – 1,644 segments, 2,690 mi in length.
Cities of Tucson, Minneapolis, and Detroit
The City of Tucson maintains a mapping website (City of Tucson 2022) containing a layer that shows the speed limits within the city. The data associated with this map layer provides a source of sites with speeds in the desired 30-40 mph range. A similar web-based mapping tool exists for the City of Minneapolis (City of Minneapolis 2022), which shows the speed limits of streets in that city. The Southeast Michigan Council of Governments (Southeast Michigan Council of Governments 2022) also maintains a traffic volume website for their region that includes Detroit and surrounding communities; that website includes speed limits for each of the roadways where traffic volumes are recorded.
POTENTIAL SOURCES OF LOCATION DATA
Table C-1 lists the segment-level variables that could be measured or collected for each identified study site location, using refined categories for those variables expanded from the original three categories defined in the RFP. The research team could then use mapping tools and online databases, if not already available to the research team or from a state’s or city’s dataset, to collect and measure these variables for initial review. For example, researchers could use existing databases to identify locations with posted speed limits in the 30- to 40-mph range, with two to four travel lanes. Those databases were also used to compile information on additional site characteristics like width of lanes, median, and/or roadway surface as they are available within the database. For the remaining location factors in Table C-1, the research team was able to use online mapping tools such as Google Earth (both typical aerial view and Street View mode) to identify or measure and document the necessary information (Google 2024, Google 2023).
Table C-1. Factors within the location subcategories to be considered.
| Factors | Location Subcategory |
|---|---|
| Segment length – distance between intersections/features that could affect speeds | Roadway – Corridor |
| Characteristics of downstream intersection (e.g., roundabout, innovative intersection, intersection angle, etc.) | Roadway – Corridor |
| Characteristics of upstream intersection | Roadway – Corridor |
| Horizontal alignment | Roadway – Corridor |
| Presence of school zone | Roadway – Corridor |
| Bicycle lane presence; if present, then width | Roadway – Cross-Section |
| Distance between sidewalk and automobile lane | Roadway – Cross-Section |
| Lane width (per lane or average for all lanes) | Roadway – Cross-Section |
| Median presence | Roadway – Cross-Section |
| Median width | Roadway – Cross-Section |
| Number of lanes | Roadway – Cross-Section |
| On-street parking type (angle, parallel, none); if on-street parking present, then width | Roadway – Cross-Section |
| Roadway cross-section type (number of lanes and median type) | Roadway – Cross-Section |
| Roadway surface width (defined as driving surface, i.e., curb to curb or not including shoulders) | Roadway – Cross-Section |
| Center line marking presence | Traffic Control Device |
| Edge line marking presence | Traffic Control Device |
| Posted speed limit (mph) | Traffic Control Device |
| Signal density (signals per mile) | Traffic Control Device |
| Access density (non-residential driveways and intersections per mile) | Roadside |
| Fence presence (type and distance from roadway) | Roadside |
| Street trees (scale based on number and distance from roadway) | Roadside |
| Sidewalk presence (if present, then buffer presence) | Roadside |
| Sidewalk buffer presence | Roadside |
| Street furniture (scale based on number and distance from roadway) | Roadside |
| Building heights | Surroundings (Non-Roadway) |
| Building setback | Surroundings (Non-Roadway) |
| Context (rural, rural town, suburban, urban, urban core) | Surroundings (Non-Roadway) |
| Development or land use | Surroundings (Non-Roadway) |
| Roadway functional class (local, collector, arterial, etc.) | Surroundings (Non-Roadway) |
| School within 0.5 mi (yes/no, and if yes then type) | Surroundings (Non-Roadway) |
POTENTIAL SOURCES OF SPEED DATA
Table C-2 summarizes the identified sources that could potentially provide segment-level speed data. The following sections discuss the reviewed sources.
Table C-2. Summary of sources for speed data.
| Speed Source | Comments |
|---|---|
| INRIX XD™ | Real-time highly granular speed data from probe vehicles, crowdsourced devices, connected vehicles, and fixed sensors. Speed data are available for more than a million non-freeway segments by hour or 15-minute period plus free-flow speed. Research team has processed a sample of the data, which shows great potential in providing the necessary number of sites and quantity of speed readings. |
| NPMRDS | 5-minute TMC-based data providing car, truck, and mixed vehicle travel times. Speed data are sourced from GPS and mobile devices in vehicles, including ATRI truck speed data. Limited to National Highway System roadways. The traffic volume for a given speed value is not provided. |
| StreetLight | Collects and reports a variety of mobility data on roadways across country, obtained from anonymized location records from smart devices. Featured data include volumes, origin-destination, turning movements, and link analysis. Data for average speeds are available, but they are based on origins and destinations of trips and are historical rather than real-time. |
| Wejo | Relatively new source of big data, with millions of cars uploading to the cloud every ~3 seconds nationwide. There is uncertainty with precision of data, and there is a potential disadvantage with cost, as data are reported to be priced per 100 million data points. |
| Traditional data collection | Examples of traditional data collection include roadside equipment, on-roadway equipment, and video. |
| Existing databases | In a few cases, agencies have a database of speed data, perhaps built to support a traffic calming program. |
INRIX XD™
Overview
INRIX provides real-time speed data coverage across the roadway network in the United States. Their highly granular floating vehicle data are combined with traditional real-time traffic flow information as well as hundreds of market-specific criteria that affect traffic. INRIX compiles and aggregates crowdsourced, passively collected data from a variety of different sources and data resellers, including from smartphones, connected cars, fleet telematics, and fixed-sensor networks. They blend all of these data sources using proprietary algorithms to produce several different traffic data products, and their most popular data product is segment-based traffic speeds.
INRIX traffic speeds have been extensively tested and evaluated on major highways and arterial streets and found to be accurate for real-time and historical archived use. Historically, their dataset has been robust for interstates and freeways; however, the addition of the INRIX XD™ Traffic service has added a rich dataset for non-freeways in many locations across the country, incorporating more than a million roadway segments.
INRIX XD™ collects data into site descriptors and speed data. Speed data are compiled into a nationwide average speed (NAS) database that contains speed data for each individual segment aggregated by hour or by 15-minute period. The hourly file, commonly described as the “NAS168 File”, contains the collected speed data for each segment for each of the 168 hours of
the week; this file can be used for queries to obtain speed data for specific time periods or for the entire week by hour and time of day. The NAS168 file also contains a variable for free-flow speed or reference speed, representing the 66th percentile observed speed for all time periods. Site descriptors include the road or street name; the direction of travel; the starting and ending latitude and longitude for each segment, the location by state, county, and ZIP code; the segment length; and a key intersection. Table C-3 lists the descriptions of the field names used in these files.
Table C-3. INRIX XD™ data file format.
| Field Name | Type | Example | Description |
|---|---|---|---|
| xdsegid | Integer | 167115703 | Identification number of the particular roadway segment in the XD database |
| dayname | Text | FR | Two-letter abbreviation for the day of the week in which the speed data were collected |
| ffspd | Integer | 23 | Free-flow mean speed representing the 66th percentile of the 168 hourly speed bins at a given location for the week |
| spdXX | Integer | 21 | The average speed for a given hour of the day corresponding to XX, where XX is a number from 00 to 23 |
| road | Text | E VILLA MARIA RD | The name of the roadway on which the segment is located |
| direction | Text | W | The direction of travel (N, S, E, or W) for which the data were recorded |
| roadorder | Text | B4-E1 | A code showing the order in which the segments are arranged in the data file |
| startlat | Float | 30.63972 | The latitude for the start of the roadway segment |
| endlat | Float | 30.64354 | The latitude for the end of the roadway segment |
| startlon | Float | -96.35821 | The longitude for the start of the roadway segment |
| endlon | Float | -96.35343 | The longitude for the end of the roadway segment |
| state | Text | Texas | The state in which the roadway segment is located |
| county | Text | Brazos | The county in which the roadway segment is located |
| zipcode | Integer | 77802 | The ZIP Code in which the roadway segment is located |
| seglength | Float | 0.398 | The length of the roadway segment (mi) |
Sample Dataset – Texas
The research team selected a sampling of segments from Dallas and Bryan, Texas to explore the data available from INRIX XD™ as part of NCHRP 15-76. Sites were randomly selected from the Dallas, Texas site database, along with a selection of streets in Bryan, Texas familiar to the research team. The purpose of this selection was to determine not only what data fields and format were available in the INRIX XD™ database, but also to get a sense of what roadways were present in the database. In addition to the many arterials that the INRIX XD™
database contains, more collectors were available in the database for large cities like Dallas compared to small cities like Bryan. Also, while the research team initially requested data based on segment boundaries that they defined, the actual segment boundaries in the database did not necessarily coincide with the researchers’ assumptions; that is, for a given segment requested from the database, the INRIX XD™ database subdivided it into as many as six subsegments, providing additional detail within that segment than was originally anticipated.
Table C-4 summarizes the locations and lengths of the segments chosen by the research team that were available in the INRIX XD™ database. This effort acquired one year of speed data (January 1 to December 31, 2019) in each travel direction binned by day of the week and hour of the day, plus a free-flow speed, per subsegment found in the database.
Table C-4. Summary of segments chosen to review INRIX XD™ data.
| City | Roadway | From | To | Length (mi) |
|---|---|---|---|---|
| Dallas, Texas | E. Grand Ave | Fairview Ave | Cameron Ave | 0.69 |
| Dallas, Texas | S. Central Expy | Linfield Rd | Overton Rd | 0.66 |
| Dallas, Texas | S. Buckner Blvd | US-175 Hawn Fwy | Lake June Rd | 1.42 |
| Dallas, Texas | E. Ledbetter Dr | University Hills Blvd | Lancaster Rd | 0.93 |
| Dallas, Texas | N. Buckner Blvd | SH 244 Northwest Hwy | Northcliff Dr | 1.15 |
| Dallas, Texas | N. Houston St | Continental Ave | Commerce St | 0.44 |
| Bryan, Texas | E. Villa Maria Rd | South College Ave | Briarcrest Dr. | 0.94 |
| Bryan, Texas | Wm. J. Bryan Pkwy | SH 6 Rudder Freeway | Texas Ave | 1.84 |
| Bryan, Texas | E. Villa Maria Rd | Briarcrest Dr | 29th St | 0.55 |
The average, minimum, and maximum speeds of each subsegment from Table C-4 during the period of midnight to 1:00 AM (chosen to approximate free-flow speeds due to expected low volumes), as well as the calculated free-flow speed from each subsegment, were generated to provide another illustration of the data available. Each of the subsegments had a speed limit of 30, 35, or 40 mph, but the calculated free-flow speeds ranged from 9 mph at a segment in downtown Dallas to 47 mph in suburban Dallas. Likewise, the speeds during the midnight hour varied from a low of 7 mph to a high of 52 mph (excluding some time periods where there was no recorded volume). The variety of speeds available at these sample sites provided a good indication that not only can a robust sample of sites be selected with different characteristics, but also that this database contained sufficient detail and variability in speed to explain relationships between speed and the variables of interest in the Phase II analysis.
INRIX XD™ data does not have the capability of presenting vehicle volume during the speed reading. Even though it was not possible to verify the ffspd, having typical volume data along with a large range of potentially influential factors resulted in a database that could answer the 15-76 research questions.
National Performance Management Research Data Set
Overview
The National Performance Management Research Data Set (NPMRDS) consists of probe-based traffic data (FHWA 2020). NPMRDS and other private-sector data can provide data for extensive geographic coverage and not require the installation of in-pavement sensors. This type of data provides opportunities to track roadway performance, especially over the long term.
The NPMRDS is an archived speed dataset that covers the National Highway System (NHS). It includes 5-minute interval speed data on over 400,000 road segments for passenger vehicles and trucks. The dataset is supplied by a combination of HERE and the American Trucking Research Institute (ATRI). HERE supplies the data used to estimate car vehicle travel times, and ATRI provides the data for truck travel time estimates. HERE prepares the data from these two data sets into a single travel time statistic meant to be an estimate of “average vehicle travel time” for both cars and trucks. Recently, INRIX partnered with the Center for Advanced Transportation Technology Laboratory at the University of Maryland and other industry leaders (including TTI and KMJ Consulting, Inc.) to support NPMRDS from 2017 through 2022 (NPMRDS 2025).
With NPMRDS (and other vendor data), recorded data are referenced to segments on a map. Multiple speed records collected from probe vehicles in a single segment during any given 5-minute time bin are used to assign a travel time value to that particular segment. Speed data are binned in 5-minute increments per Traffic Message Channel (TMC). Probe coordinates are based on Global Positioning System (GPS) equipment (e.g., smartphones, navigation devices) located in vehicles.
Schuman et al. (Schuman et al. 2021) provides details on the attributes and codes used in the NPMRDS. TMC road network inventory information contains both TMC-level (each direction of the travel path) information and Highway Performance Monitoring System (HPMS) level information. There are more than 40 roadway inventory variables in the dataset, and HPMS data represented both travel directions as the HPMS data were collected based on center line. Table C-5 lists the attributes and codes used for 5-minute interval operating speed data.
Table C-5. TMC time file format in NPMRDS. (Schuman et al. 2021)
| Field Name | Type | Example | Description |
|---|---|---|---|
| Datasource | Text | NPMRDS (Passenger vehicles) | The data set this record comes from. This field is only included when choosing to merge the data sets into a single CVS file. |
| tmc_code | Text | 107-12441 | The unique 9-digit value identifying the TMC segment. |
| measurement_tstamp | Date | 1/1/2021 12:00:00 AM | Date of data record, in “MM/DD/YY HH:NN:SS A” format. The date is in the local time of TMC segment to which the record pertains. |
| speed | Number | 43 | Speed is recorded in mph as an integer. The harmonic average speed for all reporting vehicles on the segment. |
| average_speed | Number | 45 | The historical average speed for the roadway segment for that hour of the day and day of the week in miles per hour. |
| reference_speed | Number | 50 | The calculated “free flow” mean speed for the roadway segment in miles per hour. This attribute is calculated based upon the 95th-percentile point of the observed speeds on that segment between 10pm and 5am, which establishes a reliable proxy for the speed of traffic at free-flow for that segment. |
| travel_time_minutes | Number | 3 | Travel time recorded in minutes as an integer. It is the ratio between the segment length and the harmonic average speed for all reporting vehicles on the segment. |
| data_density | Text | C | Data density indicator, where: A = 1 to 4 reporting vehicles B = 5 to 9 reporting vehicles C = 10 or more reporting vehicles |
Sample Dataset – Austin, Texas
The research team extracted sample data for Austin, Texas to gain an appreciation for whether the NPMRDS dataset would be a valuable source of speed data for NCHRP 15-76. The effort collected NPMRDS data on Lamar Boulevard for 2015. The number of TMCs on this roadway is 42 (21 TMCs northbound, and 21 TMCs southbound). The TMCs are not placed at equal distances, with some of the placements being greater than 1 mile.
Table C-6 lists the number of potential travel time epochs for various time periods for the NPMRDS data for Lamar Boulevard. For example, if the evaluation is considering one week worth of data for one TMC, speed measurements should be available for 2,016 time periods (epochs). Unfortunately several of the epochs had no speed data for the time period reviewed. Table C-7 shows percentage of yearly epoch coverage by number of TMCs. It shows that around 90 percent of the TMCs have epoch coverage with a range from 11 percent to 30 percent. This low coverage presented concerns regarding how representative the available speed data would be to the roadway characteristics.
Table C-6. Potential amount of NPMRDS speed data for Lamar Boulevard in Austin, Texas.
| Number of TMCs | 1 Day | 1 Week | 1 month | 1 Year |
|---|---|---|---|---|
| 1 TMC | 288 | 2,016 | 8,766 | 105,192 |
| Lamar Boulevard (northbound)-21 TMCs | 6,048 | 42,336 | 184,086 | 2,209,032 |
| Lamar Boulevard (southbound)-21 TMCs | 6,048 | 42,336 | 184,086 | 2,209,032 |
Table C-7. Percentage of yearly epoch coverages by TMCs.
| Percentage of Yearly Epoch Coverage | Number of TMCs on Lamar Boulevard |
|---|---|
| 1-5% | 1 |
| 6-10% | 2 |
| 11-15% | 9 |
| 16-20% | 11 |
| 21-25% | 10 |
| 26-30% | 7 |
| 31-35% | 1 |
| 36-40% | 1 |
While the NPMRDS contained many site characteristics and incorporated data from multiple sources, it had some limitations which included the fact that the dataset contained only sites on the NHS, which excluded many arterials and collectors that would have been desirable study sites for this project. While a location’s daily traffic volume is provided in NPMRDS, a volume that corresponds to a particular speed value is not provided. Also, the speed data in NPMRDS are archived. These limitations, combined with the low coverage noted in Table C-7 and the cost to purchase this speed data, indicated that NPMRDS would not be the optimal choice for speed data on NCHRP 15-76.
StreetLight
StreetLight (StreetLight 2025) is a big data source that collects and reports a variety of mobility data on roadways across the United States and Canada, obtained from anonymized location records from smart phones and navigation devices in connected cars and trucks, combined with context sources such as parcel data and digital road network data. Their featured data included volume counts (ADT and VMT), origin-destination information, turning movement counts, and link analysis. From that data, they could provide additional metrics such as average trip speed, travel time, and distance, but those are not primary data that they collect and provide. With an emphasis on how roadways are used for routing, trip purposes, and trip attributes, StreetLight data provided a potentially rich dataset of information on those variables; however, their speed data were derived from and based on origins and destinations of trips, which means that the speed data may not be as robust as could be obtained from other sources. Their most popular data product was historical origin-destination and trip pattern studies. Because of this, they had less emphasis developing their speed estimation analytics.
Wejo
Wejo was a more recent big data option, with a focus on connected vehicles. As a result, the Wejo dataset did not include all types of vehicles that may travel a given roadway or pass a certain point; however, it did have data from millions of vehicles uploaded every 1 to 3 seconds. Among their reported data available for use, the Wejo dataset included insights on trips (e.g., origin-destination data), traffic (e.g., traffic volumes and flows, average speeds), and driving events (e.g., hard braking and acceleration). The vendors stated that they had coverage of 95 percent of roads in the United States, with data on hundreds of billions of trips. The sheer size of the dataset suggested a caveat, in that obtaining data from this dataset would require particular definitions of locations, dates and times, events, and other features (in more detail than with other databases) to refine the data request into something manageable and tailored to the needs of NCHRP 15-76. In addition, requested data were reported to be priced per 100 million data points, which was not feasible for this project.
Traditional Data Collection Methods
Several traditional data collection methods were available including roadside equipment, on-roadway equipment, and video. The research team members have used such equipment installed in roadside or non-roadway areas to collect speed and volume data. Roadside-installed equipment can be used to collect spot speeds at locations of interest. The research team had previous experience with this approach and tested new equipment with the potential of improving efficiency over previous methods. However, this method still required sending staff and equipment to many locations across the country to install, monitor, and remove the equipment, as well as to extract and process the data.
In previous similar studies, research team members collected speed data by using laser guns or on-pavement sensors. While this approach can obtain the desired data, there is a disadvantage in the relative cost with this approach (similar to the roadside equipment method above) compared to other methods.
The research team also used video on a variety of studies, often as a way to document traffic volumes, gap and headway characteristics, and other conditions. The team logged many hours collecting data with this approach and tried multiple methods of extracting and analyzing the data from these videos. Unfortunately, in addition to the expense of obtaining the data, there were still difficulties in establishing a reliable method of efficiently extracting the data from the video.
A variety of previous studies, one of which is described in a 2011 synthesis report (TRB Operational Effects of Geometrics Committee 2011), have collected operating speed data at a number of sites using traditional data collection methods. Generally, in these studies, speeds of 100 or 125 free-flow vehicles at each site are measured, typically with a Lidar gun. A commonly used alternative method employs automated traffic recorders, typically either through the use of tubes or sensors on the pavement connected to the recorder unit, or through a unit with self-contained radar or lidar mounted at a roadside location. These devices are often supplemented with video recordings and/or photographs of the site and vehicles that travel through them. These studies have frequently used the data to explore relationships between roadway and traffic
characteristics and speed and in a few cases, the studies generate speed prediction equations that consider roadway or roadside characteristics. When a vehicle is considered free-flow may be a function of the technician collecting the data or it could be fixed at a headway value.
These methods have the advantage of being able to record data for every vehicle that travels through the study area during the observation period and obtain detailed information about each site from an in-person point of view, and the research team had the capability to use these methods to collect data; however, these methods are labor-intensive to install, monitor, and remove the data collection equipment and they can also require a great deal of labor to reduce the data and prepare it for analysis. For this project, which required data from hundreds of sites, the expense to collect the data with these methods was considerable. In addition, with the expected sites located in widely distributed locations across the country, the expense for staff to travel to those sites, as well as transport the necessary equipment, added to the overall cost substantially. Thus, while these traditional methods have proven capabilities for obtaining useful data at small numbers of sites that are located relatively near one another, the economy of using these methods for hundreds of sites nationwide was surpassed by the use of available big data sources that can provide data for hundreds more sites and thousands more vehicles for similar or lower cost.
Existing Data (Binned Speed Data)
The research team had access to data previously collected for other projects. The research team for NCHRP 17-76 (Fitzpatrick et al. 2021b) obtained data at hundreds of sites in Austin, Texas, area using speed tubes connected to traffic counters. While the tubes and counters recorded speed for every vehicle, the resulting database used for analysis in the project contained binned speed data, which provided key speed measurements (i.e., average, standard deviation, 85th percentile, and pace) as well as traffic volumes for an entire day. The project collected these data for hundreds of thousands of vehicles at over 600 Austin-area sites with posted speed limits between 25 and 40 mph, along with detailed site characteristics data. This dataset combining speed, volume, and site characteristics was used in the statistical analysis discussed in Appendix F.
A similar database available to the researchers from the city of Portland, Oregon, provided speed and volume data for nearly 1200 locations in both directions of travel (almost 2400 sites). More than 300 of those sites had speed limits of 30 to 40 mph, providing speed measurements for hundreds of thousands of vehicles in percentiles of 50, 70, 85, and 90.
The size of these databases, both in terms of the number of sites and the number of recorded vehicles, provided a robustness that supported the consideration of binned data to produce meaningful and statistically significant results. These and other databases mentioned previously could provide many more sites and vehicles than could be obtained through traditional methods of obtaining per-vehicle data while making efficient use of project resources.
POTENTIAL SOURCES OF TRAFFIC DATA
Traffic volume for a segment is typically expressed as vehicles per day. States maintain databases of traffic volume for their roads; however, how often the data is updated varies. Volumes on the roads of interest to this project were generally not in state databases because
roads with posted speed limits of 40 mph and less are often maintained by cities or counties rather than states.
POTENTIAL SOURCES OF CENSUS DATA
The census category includes those factors obtained from datasets built using census data. Those variables – listed in Table C-8 – were compiled from the EPA’s Smart Location Database (SLD) (Ramsey and Bell 2014) for each site used in Phase II. The EPA developed the SLD to address the growing demand for data products and tools that consistently compare the location efficiency of various places. The SLD summarizes several demographic, employment, and built environment factors for every census block group (CBG) in the United States. The factors measured serve as indicators of commonly cited variables (e.g., residential and employment density, land use diversity, design of the built environment, access to destinations, and distance to transit) that have been shown in the transportation research literature to be related to travel behavior. In total, the SLD contains more than 90 variables describing transportation and land use characteristics at the block group level for the entire nation.
Table C-8. Census-related factors to be considered.
| Factor | Source |
|---|---|
| Total population in core-based statistical area (CBSA) for the relevant census block group | SLD |
| Total number of workers that live in CBSA | LEHD* |
| Housing units, 2010 | 2010 decennial Census |
| Gross residential density (HU/acre) on unprotected land | SLD |
| Gross population density (people/acre) on unprotected land | SLD |
| Total road network density | NAVSTREETS |
| % LowWageWk of total #workers in a CBG (work location), 2010 | LEHD, 2010 decennial Census |
| Households (occupied housing units), 2010 | 2010 decennial Census |
| Percent of population that is working aged, 2010 | 2010 decennial Census |
| Percent of zero-car households in CBG | ACS*, 2010 decennial Census |
| Percent of one-car households in CBG | ACS, 2010 decennial Census |
| Percent of two-plus-car households in CBG | ACS, 2010 decennial Census |
| # of workers earning $3333/month or more (home location), 2010 | LEHD, 2010 decennial Census |
| # of workers earning $1250/month or less (home location), 2010 | LEHD, 2010 decennial Census |
| # of workers earning > $1250/month but < $3333/month (home location), 2010 | LEHD, 2010 decennial Census |
| % LowWageWk of total #workers in a CBG (home location), 2010 | LEHD, 2010 decennial Census |
| # of workers in CBG (home location), 2010 | LEHD, 2010 decennial Census |
| National Walkability Index score for CBG. | EPA Walkability Index |
| *LEHD = Longitudinal Employer-Household Dynamics program, ACS = American Community Survey | |
For more in-depth evaluations of walkability, some organizations have developed scores and indices that are intended to allow for objective comparisons of various locations. These scores and indices include both roadway and non-roadway features in their calculations, though the details vary based on the purpose of the score. For example, a commonly known measure, simply named Walk Score (Walk Score 2025a), assigns a numeric value to a given address based on a 100-point scale, with higher scores representing better walkability. The details of how Walk Score is calculated are proprietary, but the stated methodology says that it is based on the length
of walking routes to nearby amenities, population density, block length, and intersection density. Though the details of the calculation are not provided, the providers state that these characteristics (Walk Score 2025b) make a neighborhood walkable:
- A center: Walkable neighborhoods have a center, whether it’s a main street or a public space.
- People: Enough people for businesses to flourish and for public transit to run frequently.
- Mixed income, mixed use: Affordable housing located near businesses.
- Parks and public space: Plenty of public places to gather and play.
- Pedestrian design: Buildings are close to the street, parking lots are relegated to the back.
- Schools and workplaces: Close enough that most residents can walk from their homes.
- Complete streets: Streets designed for bicyclists, pedestrians, and transit.
The Walk Score concept is not primarily a transportation resource, but rather it is promoted by a real estate agent company, whose stated purpose of the score is to make it easy for people to evaluate walkability and transportation when choosing where to live. Companion measures of Bike Score and Transit Score are also provided from the same source. While Walk Score states that it considers a variety of non-roadway components, the lack of available detail on how the score is calculated made it difficult to determine whether it considers these components objectively and thoroughly from a planning and design perspective. Also, the address-specific nature of Walk Score suggested a level of granularity that may need adjustment for a study that considers a roadway corridor adjacent to multiple addressed properties.
An alternative to Walk Score is the National Walkability Index (NWI) from the EPA (US EPA 2025b, US EPA 2021). The NWI is described as a nationwide geographic data resource that ranks United States Census block groups according to their relative walkability. The national dataset includes walkability scores for all block groups as well as the underlying attributes that are used to rank the block groups. The NWI methodology states that the index is based on measures of the built environment that affect the probability of whether people walk as a mode of transportation: street intersection density, proximity to transit stops, and diversity of land uses (based on the mix of employment types and occupied housing in each block group). These measures were chosen because they can be measured using the SLD for any census block group in the country.
To determine NWI walkability scores, the chosen SLD variables were used to rank every block group in the United States (US EPA 2021). Each block group was assigned four ranked scores corresponding to intersection density, proximity to transit stops, employment mix, and employment and household mix. Each ranking is based on placement into 20 quantiles by variable value, each quantile containing 5 percent of the total block groups. The block groups were then assigned a rank from 1 to 20 depending upon their quantile position, where a ranked score of 1 was assigned to the block groups with the lowest relative values influencing walking, and a ranked score of 20 was assigned to the block groups with the highest relative values influencing walking. Ranked scores were then weighted by the following formula:
Final National Walkability Index score = (w/3) + (x/3) + (y/6) + (z/6)
Where:
w = block group’s ranked score for intersection density
x = block group’s ranked score for proximity to transit stops
y = block group’s ranked score for employment mix
z = block group’s ranked score for employment and household mix
Thus, each block group is assigned a final NWI score on a scale of 1 to 20. The scores are categorized as follows (US EPA 2021):
- 1.00 to 5.75 = Least walkable
- 5.76 to 10.50 = Below average walkable
- 10.51 to 15.25 = Above average walkable
- 15.26 to 20.00 = Most walkable
The resulting score for a given block group can then be directly compared to any other block group in the country based on objective measures of factors that can influence walkability. That feature facilitates the analysis of a roadway corridor by including the NWI score for the surrounding block group as a site characteristic that could be correlated to speed on that roadway. Because the SLD can be freely accessed online, users can view or download the necessary data to calculate the NWI score for a given location (Ramsey and Bell 2014). Numerous other variables describing density, land use, employment, street network, and transit characteristics are also available to supplement the NWI score and can also be used in an analysis of factors related to speed.
SUMMARY
The successful completion of this research required assembling a large database with a variety of factors (i.e., site information, location data, speed data, traffic data, census data) from multiple sources. There are more potential sources of data today than have been realistically available in the past; while all of those sources are not equally feasible for this project, the current state of speed data and site information from third-party vendors and online databases made those sources much more practical than in the past, to the degree that it was more efficient to collect average speed data for thousands of roadway segments than spot speed data for hundreds of specific locations, while still producing a database with widespread geographical distribution and a robust dataset that was suitable for thorough statistical analysis.


