Paying the Price: The Status and Role of Insurance Against Natural Disasters in the United States (1998)
Chapter: 4 Earthquake Insurance Protection in California
CHAPTER FOUR
Earthquake Insurance Protection in California
RICHARD J. ROTH, JR.
CALIFORNIA IS WELL KNOWN for having earthquakes—the 1906 San Francisco earthquake comes readily to mind—yet damage-causing earthquakes have not been that common in California until recently. After 1906, the next damage-causing earthquakes occurred in Santa Barbara (1925) and in Long Beach (1933). None of the state's building codes incorporated earthquake-resistive features until 1933, and then only for schools and public buildings. After the 1906 earthquake, builders, property owners, and government officials did not act on the dangers of earthquakes. Californians today live with their legacy: buildings of unreinforced masonry construction and homes unattached to their foundations.
THE SAN FERNANDO EARTHQUAKE
The modern era of earthquake activity began with the 1971 San Fernando earthquake, which caused substantial damage to homes, businesses, and public buildings. Insurance covered only a small portion of the losses because very few people had earthquake coverage and there was very little fire damage. (In
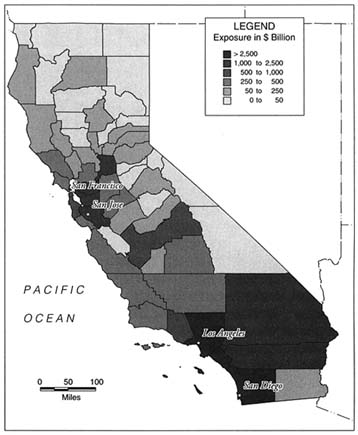
FIGURE 4-1 Total residential and commercial exposures in California.
California as well as other states, homeowners' coverage covers any fire losses, even if caused by an earthquake.)
The 1971 disaster caused several important changes in attitudes. It raised the consciousness of people with respect to the dangers of earthquakes, and it focused attention on the necessity of revising the building codes to require earthquake-resistive design and construction. The event also reinforced the insurance industry's concern about the threat of earthquakes, and prompted the California Insurance Department to request private insurers to report annually on their earthquake exposures. This questionnaire, still in use today, is valuable to the department in monitoring the solvency of insurers. Figure 4-1 shows the distribution of current earthquake exposures in California.
THE NORTHRIDGE EARTHQUAKE
Although a series of damaging earthquakes have occurred in California since the San Fernando earthquake, none of them compare to the January 17, 1994, Northridge earthquake. Next to Hurricane Andrew, it is the largest insured natural disaster ever, causing the largest insured damage by far of any earthquake in the United States, with total insured losses of over $12.5 billion. (In contrast, only a fraction of the damage caused by the Kobe, Japan, earthquake in 1995 was covered by insurance.) To put the $12.5 billion figure in context, the population of Los Angeles County (where Northridge is located) is 9,244,646, with 1,565,862 single-unit dwellings and 1,402,997 apartment units (as of January 1, 1995; California Department of Finance, 1995). This works out to insurance company payments of $1,352 for each man, woman, and child over a very large geographical area. The value of the total loss from the earthquake, including disaster assistance and uncompensated losses, is much greater.
The insured loss amounts were about one-third commercial and two-thirds residential. The high peak-ground acceleration of the earthquake was the primary cause of damage to building contents, chimneys, and
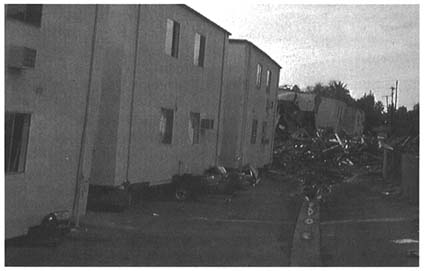
The first floor garage of this apartment building in Reseda, California, collapsed onto the cars parked inside during the Northridge earthquake of 1994 (USGS, J. Dewey).
garden walls. Building damage from landslide and liquefaction was not as common as in the Loma Prieta earthquake. While the insurance payments on this event exceed all of the earthquake insurance premiums collected in this century, this amount should only be compared to the current premium volume since so few structures were insured in past years, and so little premium collected.
A typical earthquake policy insures for loss against structural damage, damage to contents, and loss of use (residential) or business income (commercial). "Loss of use" covers the cost of hotel accommodations and meals until the structure is repaired, or it covers the loss of rental income on the house. "Business income" covers the loss of profits and the costs arising from shutting down the business (sometimes called ''business interruption"). In the Northridge earthquake, for every $100 of insured residential damage, there was an average of $20 of content damage, and $10 of loss of use. It turned out that these ratios were the same for the 1989 Loma Prieta earthquake, even though the dollar amounts were much greater in Northridge.
The insurance industry had great difficulty in estimating what the ultimate losses would be from the Northridge earthquake. Property Claim Services (PCS) collects statistics on disasters and runs training classes on catastrophe claims handling for member insurance companies. PCS was the designated insurance industry collector of the estimates of the Northridge insured losses, as well as the media spokesperson for this catastrophe. It polled its members and announced estimates of the total industry insured losses periodically. Table 4-1, which provides a summary
TABLE 4-1 Estimates of Insured Losses Caused by the Northridge Earthquake, January 17, 1994
Month of Estimate | Estimate of Total Losses (in billions of dollars) |
February 1994 | 2.5 |
April 1994 | 4.5 |
June 1994 | 5.5 |
August 1994 | 7.2 |
October 1994 | 9.0 |
January 1995 | 10.4 |
March 1995 | 11.2 |
May 1995 | 11.7 |
July 1995 | 12.5 |
Source: Property Claim Services. | |
of these figures, shows that estimates of total insured losses grow over time as more accurate damage figures become available.
The California Insurance Department conducted its own surveys. The first one asked insurers to report their estimates as of October-November 1994, and the total reported was $8.8 billion. The survey conducted February–March 1995 reported that total losses were $10.6 billion, including loss adjustment expenses. Both of these surveys were consistent with the surveys in the above table. A short, last survey made in 1996 confirmed that the final figure is $12.5 billion for industry insured losses.
Earthquake damage losses are difficult to estimate, because the full extent of damage is not known until reconstruction and repair have been completed. This is why the initial estimates after the earthquake were about $2.5 billion and then grew monthly for more than two years. Table 4-2 shows the estimates of the final total losses paid or to be paid by insurers after the 1994 Northridge earthquake, according to the California Insurance Department survey of insurers conducted in February–March 1995.
As the table shows, insurance covers a wide variety of types of losses, and is an effective mechanism for compensating for earthquake damage. Even though the lines of insurance listed in the table are standard for reporting insurance premiums and losses, not every insurer reported losses the same way. For instance, it is likely that some insurers reported residential earthquake policy losses under the "homeowners' multiple peril" line. However, the distinction between residential and commercial should be accurate.
The number of automobile damage claims resulting from the Northridge earthquake was 32,249. News photos showed many cars crushed under apartment buildings, but most of the claims were for minor damage from falling objects. Many small losses were also reported under the regular homeowners' policy, whether or not the homeowner had an earthquake policy. Glass breakage and fire damage are covered under the homeowners' policy, and at a low deductible.
STATE GOVERNMENT INITIATIVES FOR EARTHQUAKE INSURANCE
After every major earthquake, a flurry of legislation is proposed in the California legislature to deal with disaster recovery. Much of the legislation addresses the needs of people who do not have insurance or
TABLE 4-2 Northridge Earthquake Insured Losses, as Estimated by Insurance Companies as of February–March 1995
disaster assistance by providing for special tax deductions, postponement of payments, and lowering the assessed value of damaged homes for real estate taxes. The need to provide special relief has also spurred the state legislature to authorize special insurance funds to expand the number of people covered against future earthquake losses as well as the extent of their protection. This section summarizes two important pieces of legislation that addressed these issues.
The California Residential Earthquake Recovery Fund (1992)
At the time of the Loma Prieta earthquake in 1989, the standard earthquake insurance deductible was 10 percent (of the coverage on the structure). This meant that on a $150,000 house, the insured had to pay the first $15,000 of the cost of repairing the damage. After the Loma Prieta earthquake, the public protested to insurers and California legislators about such a high deductible. Many insurers responded by offering both 5 percent and 10 percent deductible policies. In the fall of 1991, the California legislature, after extensive public testimony, responded by establishing the California Residential Earthquake Recovery Fund (CRERF), which became effective January 1, 1992.
The sole intent of the CRERF program was to provide earthquake insurance to cover the 10 percent deductible. Regular earthquake policies remained unaffected. For about $60, the public could buy $15,000 of earthquake coverage (subject to a small deductible). The charge was included on the bill for the homeowners' insurance policy. It was a popular product (about 90 percent of homeowners bought it), and the price/coverage relationship was reasonable. The premiums were collected by insurers and forwarded to the CRERF and held by the state treasurer. This program was only in existence during 1992, after which it was repealed.
In 1992, there were 16 damage-causing earthquakes, including the Landers earthquake, which was one of the strongest ever recorded in California, although the damage was small because of its location. The CRERF paid all claims in full. Had the CRERF been in existence at the time of the 1994 Northridge earthquake, the expected loss covered by this policy would have been $1.2 billion (some estimates are higher). The fund would only have had about $400 million in funds to distribute, so it would have paid pro rata 33 cents on the dollar for the claims. This would have amounted to a payment of $500 to $800 to each homeowner with earthquake damage.
The CRERF program was repealed by the legislature at the request of the insurance commissioner for three reasons. First, the management and cost of the program became a financial burden, with over 70 people hired to manage the computer tracking of policies. Second, the earthquake claims were handled by independent adjusters, instead of the insurers writing the homeowners' policies. This turned out to be costly and inefficient. Third, and perhaps most important, the insurance commissioner was very concerned about the political problems that he
thought might arise in the event that the CRERF could not pay its claims in full.
CRERF was an interesting program that was well received by the public, because it provided up to $15,000 in coverage for the deductible. This is not a significant amount of earthquake insurance protection on an individual home in California, and would only have provided meaningful protection if it supplemented a basic earthquake insurance policy covering the damage in excess of the underlying deductible.
The California Earthquake Authority (1996)
In 1985, the California legislature passed a law requiring insurers writing homeowners' insurance on one- to four-family units to offer earthquake coverage on these structures. There was no requirement that the owners had to buy earthquake insurance, only that the insurers had to offer it. This law was not instigated by consumers, but was passed at the urging of the insurance industry to overcome a recent lower court decision which had required greatly expanded coverage under the homeowners' policy, including earthquake damage. In other words, the lower court decision appeared to enable homeowners to collect for earthquake damage even though they had not purchased an earthquake endorsement, and the insurer had not received a premium for the earthquake coverage.
The lower court case was eventually overturned by the California Supreme Court, but the mandatory offer law remained in effect. Many people who were close to the drafting of this law believe that it was a poor solution to a legal problem that no longer existed. Furthermore, it took away from insurers the ability to manage their total earthquake exposure and forced them to insure structures which are so old or in such poor condition that they should not be provided with coverage.
The insurance companies lived with this law until the 1994 Northridge earthquake struck. The insured damage was beyond expectations, and when homeowners across the state heard about the average insurance payments of $30,000 to $50,000 after the 10 percent deductible for homes in the Northridge area, earthquake insurance became a desirable commodity in the minds of many homeowners. The insurance companies reevaluated their earthquake exposures up and down the state and decided that they could not risk selling any more earthquake policies. In view of the mandatory offer law, the only legal response they had was to stop offering new homeowners' policies, although in fact they did
renew existing homeowners' policies even at the risk of the policyholder's opting to buy earthquake insurance.
In view of the desire of homeowners to maintain their earthquake coverage in the future, there was no possibility that the mandatory offer law could be repealed by the legislature. The California Insurance Department surveyed insurers and found out that up to 90 percent of them had either stopped selling new homeowners' policies or had placed restrictions on selling them. After extended discussions between the Insurance Department and the large insurers, an advisory group of insurers and actuaries proposed the formation of a state-run earthquake insurance company—the California Earthquake Authority (CEA).
The challenge from the start was to capitalize the CEA adequately. This challenge generated some innovative financing ideas. First, the department and the advisory group listed the possible sources of funding and chose these possibilities: (1) cash up front, (2) post-event assessments on insurers, (3) post-event assessments on CEA earthquake policyholders, (4) reinsurance, and (5) borrowing in the capital market.
Second, each of these possibilities was designated as a "block." Then the blocks were put into various patterns to decide which one made the most sense. In 1995, the state legislature passed a law, referred to as Assembly Bill 13, authorizing the insurance commissioner to undertake a feasibility study of the CEA proposal. The final block pattern, which was incorporated in this law, is shown in Table 4-3 and totals $10.5 billion in start-up funding.
The innovative features of this financing plan are the ability to pay for a large earthquake while committing relatively few dollars up front. At the time of the formation of the CEA, the capital market had never been used to back potential earthquake losses. In the proposed plan, capital markets were given the opportunity to cover the layer of losses from $7 to $8.5 billion. Before the markets had a chance to raise the full amount of capital, Warren Buffet of Berkshire Hathaway offered to cover the layer with his company's funds, and the insurance commissioner accepted his offer.
The excess-of-loss reinsurance commitment is $2 billion in excess of $4 billion. No reinsurance commitment this large has ever been made. A group of reinsurance brokers was chosen to determine if such a large placement was possible. Presentations were made to reinsurance companies in the United States and Europe. A long list of reinsurers agreed to commit small amounts which added up to $1.7 billion. The reinsurance that was placed was a two-year policy with an aggregate limit, a
TABLE 4-3 Capacity Participations in the California Earthquake Authority
Layer | Source of Funding | Total |
up to $1 billion | INDUSTRY-CONTINGENT ASSESSMENT; (to start the program) | $1 billion |
$3 billion ($1–$4 billion) | INDUSTRY-CONTINGENT ASSESSMENT; (after the earthquake) | $4 billion |
$2 billion ($4–$6 billion) | REINSURANCE; (no reinstatement) | $6 billion |
$1 billion ($6–$7 billion) | POLICYHOLDER-CONTINGENT ASSESSMENT | $7 billion |
$1.50 billion ($7–$8.5 billion) | CAPITAL MARKETS; (bonds that default on interest) | $8.5 billion |
$2 billion ($8.5–$10.5 billion) | INDUSTRY-CONTINGENT ASSESSMENT; (after the earthquake) | $10.5 billion |
provision that there would be no coverage after the limit had been exceeded, and a provision that the rate would be just under 15 percent rate on line (that is, 15 percent of the $1.7 billion, or $255 million, per year). This translates to very expensive reinsurance, but was the only choice, because the worldwide reinsurers are already heavily committed to reinsuring the commercial earthquake insurance market in California. The all-residential CEA program would have to be in addition to the reinsurers' commitment to the commercial earthquake insurance market in California.
The $10.5 billion total funding amount assumes that 100 percent of the current earthquake insurance policyholders will agree to buy coverage insured through the CEA, which would be limited coverage policies with a higher deductible (15 percent instead of 10 percent) and additional exclusions. If the CEA had been in business at the time of the Northridge earthquake, the CEA would have had to pay out about $4 billion. Therefore, the $10.5 billion figure was chosen so that the CEA would be able to pay for an earthquake two-and-a-half times the Northridge event.
When the CEA plan became operational at the end of 1996, insurers representing 72 percent of the homeowners' market elected to join the CEA program. All of the dollar amounts in Table 4-3 should be multiplied by 72 percent to get the actual layers for the program as it was implemented. For instance, the $2 billion reinsurance layer is now $1.44 billion, so the $1.7 billion in committed funds was more than adequate to cover this layer. The $1 billion first layer became $720 million, which was paid in by the participating insurers, and so on. At the time of the Northridge earthquake, there were approximately 1.9 million earthquake policies on single-unit dwellings. The CEA rate filing submitted to the California Insurance Department assumed that 72 percent times 1.9, or approximately 1.4 million policies, would be sold by the CEA.
The rates in many parts of California were set at higher levels than in the past, and the deductible was fixed at 15 percent. A 15 percent deductible is actually quite high. In order for a house to sustain damage to at least 15 percent of its value, the house must be located within 20 miles of the fault or on poor soil. The rates being charged for the policies with 15 percent deductibles have risen to about $3 per $1,000 of coverage for wood frame houses on good soil, and up to $6 or $7 per $1,000 for houses in higher-risk locations or near known faults. For a high-value house in a high-risk area, the premium can easily run into thousands of dollars per year.
From the consumer perspective, these increased rates and the unlikely chance of filing a claim due to the high deductible have led many policyholders not to renew their coverages. As of July 1997, the number of earthquake policies written through the CEA is below the level that the CEA promoters had anticipated. They anticipated writing about 26,600 policies per week (1,384,768 divided by 52). They are actually writing about half that many per week. Comments from insurance agents and the public indicate that the number of policies in some areas could be even less than half of the pre-CEA figures. Those who had earthquake insurance before and are now choosing not to buy the CEA policy have been complaining, as are those who are still renewing their coverages. This suggests that there is a strong interest among many property owners in protecting their homes against earthquake damage, but not by purchasing insurance.
Ironically, this concern could translate into renewed interest and investment in the retrofitting of existing homes, attention to building codes, and the future structural design of houses. Up until now California residents have shown a noticeable lack of interest in adopting mitigation
measures. A 1989 survey of 3,500 homeowners in four California counties subject to the hazard reported that only between 5 and 9 percent of the respondents in each of these counties reported adopting any loss reduction measures (Palm et al., 1990). A follow-up survey by Palm and her colleagues in 1993 revealed that between 20 to 25 percent of the homes in the two counties affected by the 1989 Loma Prieta earthquake (Santa Clara and Contra Costa) had bolted their house to the foundation; less than 10 percent of homeowners in the two southern counties in the survey (Los Angeles and San Bernardino) had undertaken this measure (Palm, 1995).
The lack of interest in purchasing the CEA earthquake insurance raises a number of difficult political questions. The structure of the CEA funding arrangement was based on the assumption that most of the residents who had earthquake insurance would renew their policies, so that the CEA would receive sufficient premium income to cover the costs of those parties, providing coverage for each of the layers. With the unexpectedly large decrease in demand, it is unclear whether the CEA will have enough funds available to pay the reinsurers and Berkshire Hathaway.
The current lack of interest in this earthquake insurance means that even if there is a major earthquake in California next year with damage that exceeds the Northridge quake, it is unlikely that the insured losses would be as large, therefore it is most likely that the higher layers of reinsurance funding for the CEA will not be touched. This means that the reinsurers and Berkshire Hathaway have received premiums on coverage that is now almost risk-free. Whatever happens, the California Earthquake Authority has received worldwide attention, and much has been learned from the discussions and analytical work that have gone into this initiative.
THE CALIFORNIA EARTHQUAKE INSURANCE MARKET
The CEA was formed by the state legislature in order to relieve insurers of the risk of providing protection against earthquakes in compliance with the mandatory earthquake insurance law. The anticipation was that after the CEA plan was enacted, these insurers would then eagerly offer standard homeowners' insurance again. This has not happened: insurers are still being very cautious about selling homeowners' coverage.
The problem seems to be that these insurers are still liable for a
major earthquake. As Table 4-3 shows, insurers that have elected to participate in the CEA will be subject to a post-earthquake assessment in the layer $3 billion excess of $1 billion. Such an assessment would be based on the insurer's market share of earthquake policies (including CEA policies). The only way an insurer can limit this potential assessment is to control its market share of earthquake policies. This can only be done by controlling the number of homeowner policies being sold. If an insurer sells a homeowners' policy, the insurer must offer to sell a CEA policy. The more CEA policies the insurer sells, the greater the potential assessment on that insurer from the CEA in the event of a major earthquake. Therefore, to reduce that potential assessment, the insurer must sell fewer CEA policies, but the only way to do that is to sell fewer homeowners' policies.
This section describes the private insurance market which offered earthquake insurance coverage to both homeowners and businesses prior to the formation of the CEA.
Size of the Market
Out of 800 property-casualty insurers active in California, about 175 insurers sold earthquake insurance prior to the establishment of the CEA in 1996. Most residential earthquake insurance was purchased from a few large insurers, such as State Farm, Allstate, Farmers, USAA (selling to the military), and the northern and southern California automobile clubs. Most commercial earthquake insurance was obtained through insurance brokers who assemble groups of insurers around the world to take a share of the large risks. The dollar value and premiums involved in insuring hospitals, factories, and office buildings can be quite large. Since most commercial earthquake insurance is sold in conjunction with other coverage that a business must have, it is difficult to know the exact amount of premium paid for the earthquake protection alone.
The property-casualty insurers in 1996 had a total premium income in California of $32.6 billion for all coverages, approximately $1.5 billion of which was for residential and commercial earthquake insurance. The figure for residential and commercial insurance was higher in 1996 than previous years, because rates for earthquake insurance were substantially increased after the Northridge earthquake.
Table 4-4 shows the amount of premiums paid for each major line of insurance in California for the year 1996. The table shows that the resources available to pay for another $12.5 billion in damages caused by
TABLE 4-4 Total Insurance Premiums for Policies Written in California, 1996
Line of Insurance | Premiums |
Homeowners' Multiperil | $ 3,027,060,068 |
Commercial Multiperil | 3,035,924,265 |
Workers' Compensation | 4,935,028,301 |
General Liability | 2,168,035,307 |
Private Auto Liability | 7,688,676,280 |
Commercial Auto Liability | 1,333,483,182 |
Private Auto Physical Damage | 4,409,374,145 |
Commercial Auto Physical Damage | 474,574,965 |
Earthquakes | 1,500,000,000a |
All Others | 4,037,524,810 |
Total | $32,609,681,323 |
a Estimated. | |
the Northridge earthquake are quite limited, since each of these lines of insurance has its own losses and expenses. Any and all of these lines of insurance can also have claims arising from an earthquake. The insurance industry's invested reserves and surplus are intended to support the continuing business (such as automobile and workers' compensation), not solely to pay for catastrophic events. The Northridge earthquake was clearly subsidized by the other lines of insurance and the business written in other states.
In general, only large multiline, multistate companies insure against catastrophes. (A multiline, multistate company is an insurance company licensed in many states to sell all types of property-casualty insurance, such as workers' compensation, automobile, fire, earthquake, and commercial coverage.) The small insurance companies operating only in California do not have the financial resources to pay for a large earthquake; many small insurers barely survived the Northridge earthquake. The problem is that there are not enough large insurers around, and the cost of natural catastrophes is rising rapidly.
Many insurers are mutual insurers, which are owned by the policyholders, not stockholders. The central problem for mutual insurers is that in the event of a large earthquake that depletes their capital, they have nowhere to go to raise new capital. They can only raise insurance rates. Stock insurers have the advantage that they can sell more stock to raise additional capital after an earthquake. After a major earthquake, a
somewhat perverse situation often exists in which the stock market will increase the value of an insurer's stock price in the anticipation that the insurer will be able to raise future earthquake insurance premiums and increase their profits. So it has not been that difficult for stock insurers to raise additional funds after an earthquake.
Number of Earthquake Insurance Policies
In connection with several proposals affecting earthquake insurance in the 1995–1996 legislative session, the California Insurance Department issued a special questionnaire in 1995 to all insurers writing earthquake insurance in California asking for detailed information on homeowners' policies and earthquake insurance policies in force at the end of 1994.
Table 4-5 shows the number of residential policies in force in California at the end of 1994 based on that survey. The table includes condominium and renter policies, but not mobile home policies. Homeowners' (HO) policies are specifically designed for certain types of housing units. The standard homeowners' policy is an HO-3. The policy for apartment renters is an HO-4; for condominium owners it is an HO-6. Earthquake coverage (EQ) appears as an endorsement to the respective policy. At the time of the 1994 Northridge earthquake (Los Angeles County) about 40 percent of the homes in the Northridge area had earthquake insurance. This percentage did not change over 1994, because insurers tried not to increase the number of earthquake policies during that year.
After this survey was taken, the Department of Insurance approved substantial earthquake rate increases, and an increase in the deductible for many insurers from the 10 percent that was common at the time of the Northridge earthquake to 15 percent of structure coverage. The bottom of the table shows the number of insurance policies as a percent of the number of insured and uninsured units in the state. The number of renters with insurance is quite low, as might be expected.
THE BUSINESS OF EARTHQUAKE INSURANCE
Insurance is a business: it involves accountants, actuaries, salespersons, claims adjusters, managers, executives, and so on. Insurance is a product: it focuses on a market; it has a value to the customer; and it has a price (or premium). But insurance has one feature that distinguishes it from most other consumer products: the cost of the product to the insurer
TABLE 4-5 Percent of Dwellings, Condos, and Apartments with Earthquake Insurance as of the end of 1994
| Dwellings | Condos | Renters | ||||||
County | Number HOa | Number EQb | % EQc | Number HO | Number EQ | % EQ | Number HO | Number EQ | % EQ |
Alameda | 285,949 | 123,418 | 43.2 | 17,637 | 9,234 | 52.4 | 29,983 | 15,636 | 52.1 |
Contra Costa | 215,930 | 75,114 | 34.8 | 21,636 | 9,286 | 42.9 | 19,374 | 8,306 | 42.9 |
Fresno | 138,478 | 18,715 | 13.5 | 3,045 | 617 | 20.3 | 10,728 | 1,655 | 15.4 |
Kern | 125,744 | 28,571 | 22.7 | 2,329 | 613 | 26.3 | 6,706 | 2,374 | 35.4 |
Los Angeles | 1,575,670 | 573,408 | 36.4 | 104,352 | 62,119 | 59.5 | 109,209 | 62,119 | 56.9 |
Orange | 459,346 | 173,634 | 37.8 | 80,559 | 38,392 | 47.7 | 50,033 | 26,839 | 53.6 |
Sacramento | 278,466 | 23,881 | 8.6 | 8,357 | 1,420 | 17.0 | 24,808 | 5,277 | 21.3 |
San Diego | 490,400 | 122,133 | 24.9 | 56,867 | 23,576 | 41.5 | 60,299 | 28,101 | 46.6 |
San Francisco | 117,161 | 41,634 | 35.5 | 10,278 | 5,310 | 51.7 | 32,691 | 20,536 | 62.8 |
San Mateo | 150,109 | 68,565 | 45.7 | 11,731 | 6,267 | 53.4 | 20,124 | 10,548 | 52.4 |
Santa Clara | 323,866 | 150,551 | 46.5 | 25,524 | 13,722 | 53.8 | 38,945 | 20,231 | 51.9 |
Santa Cruz | 57,161 | 24,118 | 42.2 | 3,167 | 1,537 | 48.5 | 5,201 | 2,464 | 47.4 |
Rest of State | 2,724,270 | 724,954 | 26.6 | 130,864 | 59,991 | 45.8 | 201,190 | 76,361 | 38.0 |
Totals | 6,302,093 | 1,931,449 | 30.6 | 434,028 | 212,947 | 49.1 | 549,206 | 254,850 | 46.6 |
Total Insured + Uninsured | 6,481,927 |
|
| 833,118 |
|
| 3,865,777 |
|
|
Percent Insured | 97.2 | 29.8 |
| 52.1 | 25.6 |
| 14.2 | 6.6 |
|
a Number HO = Number of HO Policies b Number EQ = Number with EQ Coverage c %EQ = Percentage with Earthquake Coverage Source: California Insurance Department, California Statistical Abstract (California Department of Finance, 1995). | |||||||||
is determined only after the product is sold, because the cost depends on claims paid out during the policy period. Therefore, the expected losses and other expenses must be estimated beforehand.
Estimating losses and expenses is the work of actuaries, who, as an example, project losses due to automobile accidents based on past accident history, inflation in medical costs, and changes in the tort laws. Similarly, life insurance actuaries project insurance payments based on morbidity and mortality tables, which were derived from the historical experience of people who had life and health insurance in the past. The insuring of natural disasters presents the ultimate challenge to actuaries because the past cannot necessarily be used to project the future. Instead, actuaries rely more and more on scientific and engineering knowledge when trying to quantify these low-frequency, high-severity events.
Rating and Underwriting Earthquake Risks
Insurers manage the business of insurance through two processes: rating and underwriting. Rating is the process of determining the proper amount to charge per $1,000 of coverage, given the risk characteristics of the peril being covered. In the case of earthquake insurance, the rate could be based on the susceptibility of the structure and contents to shake damage, the proximity to known faults, the characteristics of the faults, and the soil conditions under the structure.
Prior to the mid 1980s, insurers charged one rate for earthquake insurance (about $2 per $1,000 of coverage and a 5 percent deductible) for a standard house anywhere along the coast. They charged a lower rate for the interior of the state and a higher rate for masonry homes. So few homes had earthquake insurance that the insurance industry did not pay much attention to the actuarial correctness of these rates.
In more recent years and prior to the passage of the CEA, earthquake rates were as complicated as automobile rates (which vary by territory, type of car, usage of car, driver's age, sex, marital status, and driving record). When earthquake rates are determined by actuaries, the actuaries normally do not include the potential losses from the megacatastrophe earthquake or even the largest earthquake that occurs once every two or three hundred years or more. The rates are usually based on all of the small, medium, and large earthquakes that are likely to occur only in the next one hundred years. In addition, a guide often used by insurers is to ask how many years of premium it would take to pay for
a large earthquake. Many insurers regard 5 to 10 years of premium to pay for a large earthquake as a reasonable level of risk to take.
Underwriting is the process of determining at what price to insure the risk. If the underwriter believes that the price should be higher than the rate allowed by the regulator or the rate the insured would be willing to pay, then the underwriter would decide not to offer coverage for a particular risk. For example, the underwriting process might result in a decision not to insure a structure against earthquakes in the case of very poor construction, very poor soil conditions, or close proximity to major faults. In the case of a house on the side of a hill, for instance, which could slide in even a small earthquake, a claim on the insurance policy is likely to be made and the amount of the claim is very uncertain, so the risk could not be priced reasonably and would be rejected.
Underwriting can be used as a powerful mitigation tool by requiring structures to be retrofitted in order to become insurable. Underwriting may conclude that deductibles are necessary to eliminate the numerous small losses that occur because of an earthquake. Finally, underwriting can indicate the need for exclusions to eliminate claims for swimming pools, decking, brick veneer, and non-seismic earth movement such as landslides.
Estimating Damages
In order to undertake rating and underwriting, insurers need information from engineering and scientific studies. Some of the key concepts that are relevant in this regard are damage ratios and exceedance probabilities.
A damage ratio is the ratio of the expected insured loss to the replacement value of the structure and contents, assuming that the building was on good soil and is an average value for its area. Soil maps and fault maps must be expressed in terms of some intensity scale that can be applied to structures with known damage ratios to get an estimate of the expected average annual loss to that structure at that location. Insurers also need to know the frequency distribution of damage ratios for each zip code; such a distribution would give insurers the number of small losses as well as large losses, information that is needed to determine the effect of changing deductibles.
Insurers and reinsurers also need to know what are called exceedance probabilities, such as the probability of exceeding $4 billion in insured losses from a given earthquake event. When the California Earthquake
Authority was proposed to the legislature, all of this information was estimated. At present, these estimates are based on insurance claims statistics from past earthquakes for certain types of structures, from government research studies (and maps), and from earthquake computer models.
While it may be very difficult to predict when and where the next earthquake will occur, it is important to know how the amount of damage varies with the distance to the epicenter and the magnitude of the earthquake. It is very important and useful to the insurance industry to know the relative amount of damage that will occur for different types of building construction and for different types of soil conditions. The relativity between the factors is important because this is reflected in the proper premium rate to charge for each building at a particular location. For example, if the damage to a masonry building is expected to be ten times greater than the damage to a wood frame building, then the loss portion of the premium rate should also be ten times greater. In addition, the relativity between the factors affects how an insurance company manages its portfolio of risks by enabling it to reduce the high concentrations of risks in certain areas.
The last major published study undertaken by structural engineers to estimate damage ratios was ATC-13, published by the Applied Technology Council in 1985. In view of the extensive building damage experienced during the 1994 Northridge earthquake, the insurance industry would welcome a confirmation or update of that study by the structural engineering profession. The ATC-13 study (funded by FEMA) is the basic analysis used by the commercial earthquake modelers, and therefore the basic analysis used by the insurance industry. The California Insurance Department and the U.S. Geological Survey funded two studies on damage ratios based on insurance industry claims statistics. (See Steinbrugge and Algermissen, 1990, on insured losses before Loma Prieta; and Steinbrugge and Roth, 1994, on insured losses from Loma Prieta.)
Insurers need to work closely with earth scientists and engineers in interpreting available data. For example, damage patterns may be fairly predictable with a strike/slip fault (as distance from the fault rupture plane increases, damage usually decreases, with the exception of poorly constructed buildings on poor soil). However, damage patterns may be more complicated with a thrust fault, because the fault plane dips at an angle; serious damage may occur in places that might not be expected using traditional models that work with surface fault traces. In the special case of blind thrust faults, damage patterns may be even more difficult to predict. By working closely with scientists and engineers, insurers
can make decisions that reflect a sophisticated understanding of the earthquake risk.
Estimating the Probability of Earthquakes
Another area of scientific knowledge that is valuable to insurers is the study of earthquake probability. Over the years, seismologists have been estimating the likelihood of a given fault rupturing again. These estimates are based partly on the length of time that has passed since the last rupture and on the long-term slip rate. However, a fault can also rupture when nearby faults rupture. The most recent study by the Southern California Earthquake Center (Working Group on California Earthquake Probabilities, 1995) presented a consensus estimate of the probability of earthquakes of specific sizes for 65 seismic zones in southern California. A working group of leading seismologists and geologists from the California state government and its universities and from the U.S. Geological Survey made up the consensus team. A second report, prompted by the 1992 Landers earthquake, evaluated the probability of a major earthquake within the next 30 years on each of the major known faults in southern California. The report concluded that there is a high probability of significant seismic activity in the next 30 years in the Santa Barbara, Palmdale, and San Bernardino areas of southern California.
The conclusions of the USGS study are that the occurrence of an earthquake in southern California of a magnitude (M) on the Richter scale of 6.0 or greater is expected each 1.6 years, on the average, during the next 30 years. (This recurrence interval is about double the observed rate since 1850.) The probability of a magnitude of 7.0 or greater in the next 30 years is estimated at 86 percent. (The predicted rate of earthquakes for M of 7.0 or greater is also about double the rate since 1850.) Great earthquakes of a magnitude of 7.8 or greater have an estimated 6 percent to 9 percent probability of occurrence in the next 30 years. This is particularly ominous since, depending on the location of the epicenter, the effect of such an earthquake on a densely populated area would be so devastating that it could be classified as a mega-disaster.
Role of the California Insurance Department
Before the CEA was established, California state regulations required all earthquake insurance rates to be filed with and approved by the California Insurance Department (CID). Concern about the exposure of the
insurance industry to earthquakes greatly increased in the aftermath of the San Fernando earthquake in 1971, leading the California Insurance Department to issue Ruling 226. This ruling required all licensed insurers to report yearly on their insured exposures for earthquake shake damage on residential and commercial structures in the state, via a detailed questionnaire. At that time, the percentage of homes and commercial structures insured for earthquake damage was less than 10 percent, and the insurance losses from the San Fernando earthquake were about $46 million. Since then, the demand for earthquake insurance has grown substantially, along with a large increase in housing and commercial building values.
These annual earthquake questionnaires also elicit information used for estimating the probable maximum loss, or expected insured loss for structural and contents damage from a major earthquake in each designated earthquake zone. From these questionnaires, the insurance department compiles estimates of the aggregate insured PML losses by earthquake zone and publishes these results. The state is divided into eight zones, but Zones A (San Francisco) and B (Los Angeles/Orange County) are the most important. The questionnaires for individual insurers are not made public.
The California Insurance Department uses these questionnaires to monitor the amount of earthquake exposure of each insurance company in relation to its financial strength. The questionnaire shows the amount of earthquake insurance by earthquake zone and by residential and commercial building classes. In addition, there is detailed information on reinsurance. This questionnaire was an impetus to the development of the many earthquake simulation models that are now available. It has also encouraged insurers to improve their knowledge of seismicity, geology, and structural engineering, and to develop their own in-house expertise.
The California Insurance Department also, under its regulatory authority, conducts detailed surveys of insurance industry losses after major earthquakes. Some of the statistics from these surveys are shown in the tables in this chapter, and some research publications based on these surveys are listed in the references to this chapter (Roth, 1995-1996; Steinbrugge and Algermissen, 1990; Steinbrugge and Roth, 1994).
MARKETING PRIVATE EARTHQUAKE INSURANCE
Building on the conditions of insurability detailed in Chapter 2, this section examines whether earthquake insurance can be marketed by private
companies at a price that reflects the risk and reduces the chance of insurer insolvency to an acceptable level, while still satisfying the regulator, the California Department of Insurance.
Probable Maximum Loss
In Chapter 2, we indicated that insurers are concerned with the probable maximum loss that they can suffer from a single disaster. The following example illustrates how PML is calculated and used in relation to earthquakes. An insurance company has sold earthquake insurance on 100,000 homes in the San Francisco Bay Area. Since their average replacement cost is $200,000, the aggregate replacement cost of the homes might be $20 billion ($200,000 × 100,000). It is highly unlikely that any event, even one like the 1992 Oakland fire, could destroy all 100,000 homes. In the event of an earthquake, most of the homes would be only partially damaged, and many would not be damaged at all.
Now suppose the California Insurance Department wants to determine the PML for single-family residences in conjunction with a 10 percent deductible earthquake policy for insurers who are selling policies in the San Francisco Bay Area earthquake zone. The CID looks at damage statistics compiled by structural engineers who inspected typical houses damaged in past California earthquakes, and then at estimates derived from these statistics of what the damage would be to these houses if the earthquake had been a major one. Using this information, the CID indicates to insurers that the PML percentage factor is 1.7 percent of the insured value. This means that the expected loss to the insurance company from a major earthquake based on the average PML for the above example of 100,000 homes with coverage against earthquakes would be $340 million (1.7 percent × $20 billion).
PML estimates are sometimes based on the largest expected earthquake in the next one hundred years, and sometimes they are said to be based on an earthquake at the 90th percentile of damaging earthquakes in size. The probable maximum loss estimate does not include any estimate of damage from a mega-catastrophe earthquake, nor does it include the possibility of an unusually large number of small or medium-size earthquakes.
There are different PML factors for different deductibles, and for commercial buildings of differing construction. The goal is to estimate what would happen if the maximum likely fault rupture occurred at one
of the large faults in the affected zone. The PML percentage varies from fault zone to fault zone (Roth, 1995-1996).
From an insurance company underwriter's point of view, $340 million is a much more useful number than the $20 billion figure. If the insurer decides to commit $250 million of the insurance company's net worth to a possible earthquake event in the San Francisco Bay Area earthquake zone, the underwriter will conclude that there are too many earthquake policies in that zone.
An increasing number of insurance companies now prefer to use exceedance probability (EP) curves. An EP curve specifies, for a given year, the likelihood of an earthquake that causes damage equal to or greater than ''X" dollars. The value of "X" is varied over the entire spectrum of potential damage from earthquakes. In other words, a PML is just one of many values used in constructing an EP curve. This curve is normally generated by a computer model.
Capacity
As pointed out in Chapter 2, there is a direct relationship between the PML and the maximum amount the insurer is willing to cover in one disaster zone, which is called its capacity. After the 1994 Northridge earthquake, insurance managers reevaluated their PML exposures in relation to their chosen capacity for California earthquake exposure. Many insurers announced that they would not be selling any more earthquake insurance policies, but would be renewing existing policies. Of course, the Northridge earthquake showed many property owners what an earthquake can do to a home. When these homeowners decided that they wanted earthquake insurance, many found that it was not available.
An essential part of controlling capacity is the use of reinsurance. About half of earthquake reinsurance is sold by reinsurers in the United States and the other half by reinsurers around the world, mostly in Europe. Although the concept of reinsurance is simple, contracts can get quite complicated. Practically every commercial earthquake policy is reinsured with other insurers, usually on a building-by-building basis, or what is called "per risk" insurance. Very few residential earthquake policies are reinsured individually since the expected damage per house is relatively small; earthquake insurance losses on homes are usually aggregated, and the reinsurance policy prevents the aggregate loss from getting too high.
Insurability Issues
Insuring earthquakes in a financially responsible manner is essentially a matter of limiting the potential insured loss in each location where such an event is likely to occur. It also means assuming that no megaearthquake occurs during the period of coverage (that is, an earthquake of magnitude 7.8 or greater). The worst situation for an insurer is to have all of its earthquake policyholders concentrated in one area, in fully insured high-valued houses, near a fault where soil conditions are poor (on hillsides or with a high probability of liquefaction). Under these conditions, the PML from one event would be very high indeed.
It is often said that the purchase of earthquake insurance must be mandatory in order to spread the risk and make earthquakes insurable. Such a provision has been attached to many governmental disaster programs and proposals. There is no actuarial or scientific basis for making the purchase of earthquake insurance mandatory in California or anywhere else. Over two million residences, out of six million, are insured against earthquakes throughout California, all policies voluntarily purchased.
SIDEBAR 4-1Making Earthquakes More Insurable In order to make the potential loss from an earthquake more insurable, the strategy is essentially one of divide and conquer and involves these essential points:
|
On an actuarial basis, whatever can be gained by diversifying geographically was gained long ago.
If the political objective is to make owners of low-risk buildings subsidize owners of high-risk buildings (such as those built of unreinforced masonry in fault areas), then it may be necessary to impose a mandatory (tax) scheme. Furthermore, it is not clear why earthquake insurance should even be sold for many old buildings, because earthquake policies are usually replacement coverage policies which pay the cost of replacing destroyed buildings with brand new ones, often of far greater value than the old.
As a final argument against making the purchase of earthquake insurance mandatory, the strategies listed above to increase insurability would not be possible since there would be no opportunity for the insurer to select risks. Therefore, making the purchase of earthquake insurance mandatory would actually reduce the insurability of earthquakes for the insurer or the government pool providing the coverage. In California, the law requiring insurers to offer earthquake insurance to everyone who buys homeowners' insurance has caused a serious restriction in
These measures add up to a new form of insurance management which is much more scientific, financially and actuarially sound than has been seen in the insurance industry before. Using this form of management, it is possible to make small and medium-size earthquakes insurable; it is not useful with the very large earthquakes, where the insurance industry's own survival is at stake. |
the availability of earthquake insurance for this reason and led to the formation of the CEA. Although the homeowners are not required to accept the offer, the insurers are required to make earthquake insurance available and thus cannot select risks to control the PML level by territory. This prevents insurers from increasing the insurability of their portfolio of earthquake risks.
PROPOSALS FOR FEDERAL GOVERNMENT EARTHQUAKE INSURANCE
Since the 1980s, the insurance industry has been advancing proposals to the U.S. Congress to establish a federal natural hazards insurance program, somewhat like the National Flood Insurance Program (NFIP). First addressing the earthquake peril, these proposals have been expanded to cover most natural hazards in order to gain broader support in Congress. These proposals have been motivated by the following factors:
The risks involved in insuring natural disasters are so uncertain and so large that most insurers do not want them to be part of the costs of being in the insurance business. Insurers are business enterprises which must attract capital and make profits in competition with other businesses.
Government programs can accumulate premiums and investment income free of taxes and therefore can accumulate funds at a much greater rate than insurers can.
A single pot of money is sometimes assumed to be the best "spread of risk."
A government-run insurance program could reduce the heavy governmental reliance on post-event disaster relief loan and grant programs.
Efforts to mitigate earthquake damage may be more effective if tied to a government insurance program (as is the case with the NFIP).
The NFIP has been held up as a model federal catastrophe insurance program.
As reasonable as these factors seem to be, they are in conflict with some sociological, economic, and actuarial teachings and principles. These teachings and principles focus on the "true" cost of such government programs (the opportunity cost of the funds), the foregone benefits of a competitive insurance marketplace (e.g., cost efficiency and rate competition),
and the absence of consumer choice (the ability to decide whether to purchase coverage). In simple and political terms, the controversy boils down to determining what government can do best, what the private insurance industry can do best, and what the fairest allocation of scarce government resources is among all of the competing demands on government budgets and commitments.
California and other western states would be the primary beneficiaries of the earthquake portion of this program, but there are states with significant exposure to wind and hurricane that would benefit as well. In recent years, it has been easy to find members of Congress willing to sponsor legislation to establish such a program, but actual forward movement of these bills has been slow.
This effort to push for federal legislation has actually been very fruitful in promoting and funding research studies on earthquake insurance issues. Over the years, the major federal agencies have been sponsoring research studies in earthquake science as well as actuarial science, economics, finance, and other social sciences. These studies have greatly increased our knowledge and understanding of the scientific and financial aspects of earthquakes and natural hazards in general.
Advancements in the science of earthquakes are needed to predict the probability and magnitude of future earthquake events. Research programs in economics and actuarial science are needed to plan for the necessary funding for earthquake recovery, and to devise the optimum allocation of resources after the event in order to promote speedy economic recovery of the affected region and the rebuilding of the damaged residential, commercial, and public structures.
The reluctance of Congress to act seems to stem from a lack of consensus on what will work, a realization that the problem is not well understood, and a concern about adequate provisions for mitigation. The nation has come a long way in understanding the science and economics of earthquakes, and more can be learned and understood. This is an international issue. China, Japan, New Zealand, and other countries are working as hard as the United States to find a workable solution to responding to natural disasters.
Rationale for a Federal Reinsurance Program
There is no question that in past natural disasters, the government (state or federal) has been the primary source of relief and economic recovery. However, as in the case of medical care and welfare, it is not
easy to determine the best allocation of responsibilities between the federal and state governments and all other stakeholders.
The proposal to establish a federal earthquake insurance program was originally based on the premise that these disasters were uninsurable and that the solvency of many, if not most, insurers was at stake, because of the huge potential insured losses that a large earthquake can cause. Today, insurers are more sophisticated and much better able to estimate probable maximum loss values and capacity limits, so that solvency and insurability are better managed, but they are still very real concerns.
As an example, the California Insurance Department did not have to take over any insurers because of excessive insured losses after the Northridge earthquake, which was a moderate-size earthquake. However, the insurers did take immediate steps to control the PML levels by restricting the issuance of new earthquake policies. This led to the restricted availability of earthquake insurance and the formation of the CEA.
As an alternative to the CEA, the federal government reinsurance program would provide the insurance industry with additional capacity to market earthquake coverage. The main problem that the insurance industry has is its vulnerability to the mega-catastrophe event, an earthquake so large and devastating that whole communities are practically destroyed over a wide geographical area, leaving some insurers insolvent, and seriously depleting the capital base of most other insurers. The 1964 Alaskan earthquake was an event of great magnitude over a wide geographical area. Although the area was sparsely populated, only federal aid and the discovery of oil enabled the region to recover economically. Had this mega-catastrophe event occurred in Los Angeles in 1995, the federal government would have had to consider federal loans or grants to the insurance industry!
SUMMARY AND CONCLUSIONS
The public demand for earthquake insurance has grown dramatically in recent years and, consequently, so has the insurance industry's exposure to large amounts of insured earthquake losses. Ordinarily insurance deals with situations that involve many small losses, the total of which is predictable based on past loss experience. Earthquake insurance, on the other hand, deals with low-frequency, high-severity events where past history is not useful for predicting the future loss experience at a particular location. Instead, the insurance industry must rely on engineering,
geological, and seismological information and expertise to make estimates of the potential loss exposure to a group of insured buildings in a particular fault zone.
An insurer uses this information to manage its portfolio of earthquake risks to make sure that the insurer's potential loss does not exceed the insurer's capacity to pay the losses. This control of earthquake exposures means that earthquake insurance will not be available to all homeowners and building owners who want it. In California, the California Earthquake Authority is a government-sponsored attempt to make residential earthquake insurance available where the insurance industry has not been able to provide it.
There have been several damage-causing earthquakes in California recently and there will be more. The insurance industry, the government, and the scientific community need to be in a partnership to establish the most appropriate coordinated program for financing the essential economic recovery after an earthquake.