Health Risk Considerations for the Use of Unencapsulated Steel Slag (2023)
Chapter: 6 Multiple Stressors in Disadvantaged Communities Where Unencapsulated Slag May Be Used
6
Multiple Stressors in Disadvantaged Communities Where Unencapsulated Slag May Be Used
In carrying out its statement of task, the committee considered whether cumulative exposures to stressors associated with lower socioeconomic living conditions are likely to exacerbate health risks of electric arc furnace (EAF) slag constituents, including the risk of negative cognitive effects. This chapter considers exposures to multiple stressors in disadvantaged communities and examines approaches used to consider demographics of communities in several states near slag processing facilities.
CUMULATIVE EXPOSURES
In reality, human exposure is not to a singular chemical but to multiple stressors simultaneously and over an extended timeframe, via multiple pathways and from various sources, affecting individuals and communities in positive or negative ways. In general terms, a stressor is any physical, chemical, social, or biological entity that can induce a change (either positive or negative) in health, well-being, and quality of life, either now or into the future (Tulve et al., 2016).
Cumulative exposures are defined as simultaneous exposure to a range of stressors and exposures over the lifespan. Cumulative exposures include chemical stressors (such as environmental pollutants) and nonchemical stressors such as noise, temperature, poor diet, and smoking (EPA, 2022b; Tulve et al., 2016).
The health disparities of particular interest are those caused or exacerbated by exposures to pollution and/or environmental degradation that are disproportionately borne by disadvantaged and overburdened individuals and communities, particularly slag chemicals of potential concern.
SOCIETAL INEQUITIES AND CUMULATIVE EXPOSURES
Cumulative exposures are not distributed equally, nationally. Environmental, social, and other stressors are disproportionately borne by under-resourced and marginalized communities with resultant health disparities. Exposure to multiple environmental pollutants, climate change, social and health vulnerabilities, and food insecurity, among others, is clustered in under-resourced communities for systemic reasons (Lane et al., 2022; Hoffman et al., 2020; Bullard et al., 2008). These uneven distributions drive health inequities observed in under-resourced communities.
Structural drivers, also known as social determinants of health, are factors that influence the health of a community. The structural drivers of inequity are associated with inequitable distribution of stressors—environmental, social, built, and natural. Low-income, under-resourced communities often have pollutant sources located inside or nearby (Bullard, 1994; Commission for Racial Justice, 1987). The extent of the health impacts of these exposures can be mediated by factors such as social determinants of health including lifestyle, diet, pre-existing disease, genetics, neighborhood characteristics, education, health care access, systemic racism, and socioeconomics (EPA, 2022b; Lewis et al., 2011).
There is a positive correlation between educational attainment and life expectancy (Hibbert and Tulve, 2019). Mohai et al. (2009) indicated that where a person lives is strongly associated with the likelihood of living near a polluting industrial facility, as well as a person’s income and educational status. The authors found that those without high school diplomas were more likely to live near such a facility.
Environmental Justice
The environmental justice movement highlighted several social determinants of health that impact disenfranchised communities because of a history of discrimination and residential segregation (Morello-
Frosch and Lopez, 2006). Minorities are in communities that often have limited political or financial power (Morello-Frosch and Lopez, 2006). These communities face premature death from air pollution compared to those who live in predominantly White communities (Jbaily et al., 2022). Toxic Wastes and Race in the United States, a landmark publication published in 1987, highlighted that waste facilities were disproportionately located in lower-income, minority communities, with a strong relationship between race and hazardous waste siting. The same outcome was observed more than 20 years later and continues to be witnessed today, as a result of structural racism, discrimination, and social exclusion (Jones et al., 2022; Lane et al., 2022; Bullard, 1994).
Racial segregation has been shown to be significantly and positively associated with exposure to fine particulate matter (PM2.5). As documented in Fumes Across the Fenceline, African Americans are more exposed (38%) and more likely to live (75%) on the border of an environmental pollution source (Fleischman and Franklin, 2017). Mikati et al. (2018) correlated particulate matter (PM)-emissions from facilities with neighborhood characteristics by block group. They reported that those in poverty and Black people had 1.35 and 1.54 times higher emissions burdens, respectively, compared to the overall population. Disparities identified nationally were also seen in most states (Mikati et al., 2018). In an epidemiological study investigating the mortality resulting from PM2.5 in 207 cities, Kioumourtzoglou et al. (2016) reported increased mortality for PM2.5 exposure for Black residents and those with lower household income. Regardless of socioeconomic status, Black people still face greater health risk than White people, indicating that psychosocial factors (including chronic stress from discrimination, class bias, lower social position increasing susceptibility, and higher environmental exposures) are contributors to risk (Di et al., 2017).
Redlining
Black, Indigenous, and people of color communities in the United States are systematically exposed to stressors, specifically environmental stressors, such as toxic pollutants, urban heat, air pollution, and other stressors at higher levels in comparison to their White counterparts (Morello-Frosch and Lopez, 2006). As aforementioned, structural racism has influenced and continues to influence exposures across the life course (Morello-Frosch and Lopez, 2006). One such racist practice was redlining—the impact of which is still evident today (Massey, 2020; Bravo et al., 2016; Morello-Frosch and Jesdale, 2006).
Redlining was a discriminatory policy in the 1930s by the federal Home Owners’ Loan Corporation (HOLC), which was created to support homeowners struggling to make mortgage payments. The corporation created, and utilized, maps of cities to which they assigned investment risk. Neighborhoods were shaded one of four colors. Each color reflected a level of perceived investment risk. Higher risk was assigned to communities of color. This led to residential segregation. Many of the areas depicted as yellow or red are still today associated with racial segregation, poverty, disinvestment, environmental stressors, and income inequality (Swope et al., 2022). Psychosocial stressors as a result of these land-use decisions combined with varied environmental stressors heighten the cumulative risk for adverse health impacts. Research findings suggest that nonchemical stressors modify the biological response of chemical stressors, magnifying the adverse response in many cases, particularly in children (Tulve et al., 2016; Hibbert and Tulve, 2019). Recent studies reveal that historical redline mapping is associated with aspects that result in adverse health outcomes from decreased green spaces, worsened air quality, and excessive heat zones, for example (Swope et al., 2022; Nardone et al., 2020a). These long-lasting impacts weaken community resilience against further insult, are retained over generations, and are evidenced to continue to shape the spatial distribution of environmental stressors (Mitchell et al., 2018; Figure 6-1). Research findings associate several adverse health impacts with these historical discriminatory practices, including cancer (Krieger et al., 2020a), asthma (Nardone et al., 2020a), and adverse birth outcomes (Krieger et al., 2020b).
Several studies have reported an association between redlining and environmental health outcomes (Swope et al., 2022; Lee et al., 2022). Health outcomes, however, are moderated by coping strategies and other psychosocial factors.
In addition to increased exposure to environmental pollutants, social stressors are evident in redlined neighborhoods, such as the stress of living near a pollutant source (e.g., hazardous waste site or industry), having limited access to healthcare, or experiencing neighborhood violence. Zoning led to neighborhood disinvestment and reduced wealth accumulation opportunities (over generations) and concentrated disadvantage associated with poor environmental quality today (Fullilove and Wallace, 2011; Saegert and Evans, 2003). For example, Hoffman et al. (2020) reported that 94 percent of more than 100 cities indicated the cities that were redlined as D-zoned areas (hazardous) showed elevated land surface temperatures, which can amplify heat stress compared to A-zoned areas. Respiratory illnesses, such as asthma, are disproportionately experienced by D-zoned communities due to poor housing quality, hazardous waste facility and transportation route proximity, and lack of green space, for example (Bailey et al., 2021; Hoffman et al., 2020; Wilson, 2020; Nardone et al., 2021). Nardone et al. (2020b) correlated HOLC zoning with census tract emergency department visits across eight California cities and found that higher zones (D-zoned areas) have a 39 percent higher rate of emergency department visits (2011–2013) due to asthma compared to A-zoned areas. Schuyler and Wenzel (2022) reported that for Pittsburgh/Allegheny neighborhoods, D-zoned neighborhoods had the highest amounts of specific air pollutants (namely, PM2.5, carbon monoxide, sulfur dioxide, and volatile organic compounds) compared to A–C zoned neighborhoods as well as highest rates of uncontrolled asthma (yet lower rates of asthma care options). Similar findings are reported for cardiovascular health (Mujahid et al., 2021). Mujahid and colleagues reported that living in historically redlined neighborhoods was associated with greater adverse cardiovascular health, particularly for Black participants. Participants had a 0.82 lower cardiovascular health score compared to participants living in A-zoned areas (Mujahid et al., 2021).
Children are particularly susceptible to cumulative exposures. Due to their metabolic rate, high surface area to body weight ratio, and life stage behaviors such as pica, they are already more inclined to have heightened exposures compared to adults (Tulve et al., 2016; Cohen Hubal et al., 2014). Sexton and Linder (2010) found that children ages 3 to 6 living in inner-city neighborhoods in Minneapolis had higher exposure to multiple environmental carcinogens and neurotoxins than the general population. Children’s exposure to multiple contaminants can have synergistic or additive effects at a developmental stage when they are more susceptible to adverse effects compared to later life stages (Buckley et al., 2020).
Studies have shown that psychosocial stress, inadequate health-care access and utilization, exposure to noise pollution, and exposure to violence (which may in turn be a function of income, education level, and minority status) can modify the effect of chemical exposures on human health (Lemay and Piotrowski, 2002; Hood, 2005; Sapolsky, 2005; deFur et al., 2007). Communities or sub-populations with higher levels of these factors are more vulnerable to the health effects caused by environmental exposures (EPA, 2003b; Davis et al., 2005; Menzie et al., 2007; Callahan and Sexton, 2007).
Poor maternal psychosocial status (i.e., high stress, low social support) has been shown to intensify the association between manganese (Mn) exposure and preterm birth risk (Ashrap et al., 2020). Inorganic arsenic is a well-known epigenetic dysregulator of pathways such as the glucocorticoid pathway, which is a set of genes known to also be dysregulated by persistent stress and discrimination (Bailey and Fry, 2014; Meakin et al., 2020; Santos et al., 2018).
These effects can perpetuate long term. Haynes et al. (2015) found blood and hair Mn concentrations were inversely correlated with child IQ scores. Despite a crucial role in brain growth and development, excessive Mn exposure could lead to adverse health outcomes including deficits in neuropsychological functioning and motor skills (Torres-Agustin et al., 2013; Zoni and Lucchini, 2013; Hernandez-Bonilla et al., 2011) and attention deficits (Smith and Strupp, 2023).
Studies on chromium (Cr) exposure in children are limited. However, similar findings were observed for Cr exposure in early life stages. Caparros-Gonzalez et al. (2019) reported an association between Cr exposure and adverse neuropsychological outcomes in Spanish children (6–11 years old). Sughis et al. (2012) reported on Cr exposure in Pakistani children producing surgical instruments. They stated that these children had increased oxidative DNA damage with increased metal exposure. Several studies report neurological and psychological effects of relatively high concentrations of Mn, particularly in occupational settings. At lower levels, Laohaudomchok et al. (2011) measured performance on cognitive
and motor control tests and psychological functioning in 46 male welders. They reported that an increasing cumulative Mn exposure index (Mn-CEI) over a 12-month period was significantly associated with poorer psychological tests (e.g., mood; p< 0.03) and nearly associated with slower reaction times on performance (p = 0.10). Measurements across the work shift indicated worse cognitive performance and fine motor control with increased cumulative Mn exposure.
Soil heavy metal concentrations follow the same pattern of higher concentrations observed in or near communities of color (Jones et al., 2022). Researchers have identified proximity to emission sources as a major cause of soil contamination with heavy metals by socioeconomic status, race, and poverty with higher concentrations observed in minority communities (Jones et al., 2022; Aelion et al., 2013). Bell et al. (2014) and Ryan et al. (2011) each found an association between fugitive dust from roads (PM2.5) and hospital admissions due to cardiovascular and respiratory issues. Children exposed to fine road dust (PM2.5) had higher inhaler usage (Gent et al., 2009). Li et al. (2007) identified higher health risks associated with heavy metal–containing road dust (specifically lead, Cr, and copper).
DEMOGRAPHIC CONSIDERATIONS
The committee considered a prior investigation of demographic factors, which was conducted in 2022 for the U.S. Environmental Protection Agency (EPA) to evaluate different demographic groups within populations living near 87 steel plants in the United States (SC&A, 2022). The evaluation informed EPA’s development of proposed regulations of particulate matter (PM) emissions from those facilities, under the authority of Section 111 of the U.S. Clean Air Act.1 The analysis used census data (American Community Survey 2015–2019 presented in U.S. Census Bureau, 2023) to examine the intersection of 87 facilities with race, ethnicity, age, level of education, poverty, and linguistic isolation at the block group level. The proximity results describe the demographics of the population surrounding these steel plants using EAFs and argon–oxygen decarburization vessels.
Population percentages for certain demographic groups within 5 km of steel plants are greater than the corresponding nationwide percentages for those same demographics. The demographic percentage for populations residing within 5 km of facility operations is 5 percentage points greater than its corresponding nationwide percentage for the African American population (17 percent within 5 km of the facilities compared to 12 percent nationwide), 4 percentage points greater than its corresponding nationwide percentage for the population below the poverty level (17 percent within 5 km of the facilities compared to 13 percent nationwide), and 3 percentage points greater than its corresponding nationwide percentage for the population ages 18 to 64 (65 percent within 5 km of the facilities compared to 62 percent nationwide). The remaining demographic groups within 5 km of facility operations are less than the corresponding nationwide percentages.
In addition, the proximity results presented in SC&A (2022) indicate that the population percentage for one demographic group within 50 km of steel plants is greater than the corresponding nationwide percentages for that same demographic. The demographic percentage for populations residing within 50 km of facility operations is 3 percentage points greater than its corresponding nationwide percentage for the African American population (15 percent within 50 km of the facilities compared to 12 percent nationwide). The remaining demographic groups within 50 km of facility operations are less than the corresponding nationwide percentages.
Because the results are presented at the national scale, steel producers in locally disadvantaged communities cannot be identified, and thus plants cannot be examined individually in relation to their local community or region. Also, the analysis does not include slag processing facilities, which is where many local residents would obtain slag, although slag processors are often located near steel plants.
___________________
1 Standards of Performance for Steel Plants: Electric Arc Furnaces Constructed After 10/21/74 & On or Before 8/17/83; Standards of Performance for Steel Plants: Electric Arc Furnaces & Argon-Oxygen Decarburization Constructed After 8/17/83. Federal Register Vol. 87, No. 94: 29710–29728.
The committee used Allegheny County, Pennsylvania and Pueblo, Colorado as case examples to examine populations where slag processing facilities are currently operating. For Allegheny County, both slag processors located in the county are within or in close proximity to census geographies with higher percentages of Black populations (Figure 6-1). The Allegheny County Department of Human Services (2021a) developed a Community Need Index (updated in 2021) that ranks census tracts by need using the combined factors of
- percentage of families who live below the poverty line,
- percentage of unemployed males,
- resident education levels,
- percentage of single mothers, and
- number of 911 dispatches for gunshots fired.
As shown in Figure 6-1, the two processing plants in Allegheny County are in close proximity to census tracts identified as moderate need. Assuming, on a cost basis, that slag would not be transported upward of 50 km, the delivery of slag material almost certainly includes distribution into these adjacent tracts of moderate need.
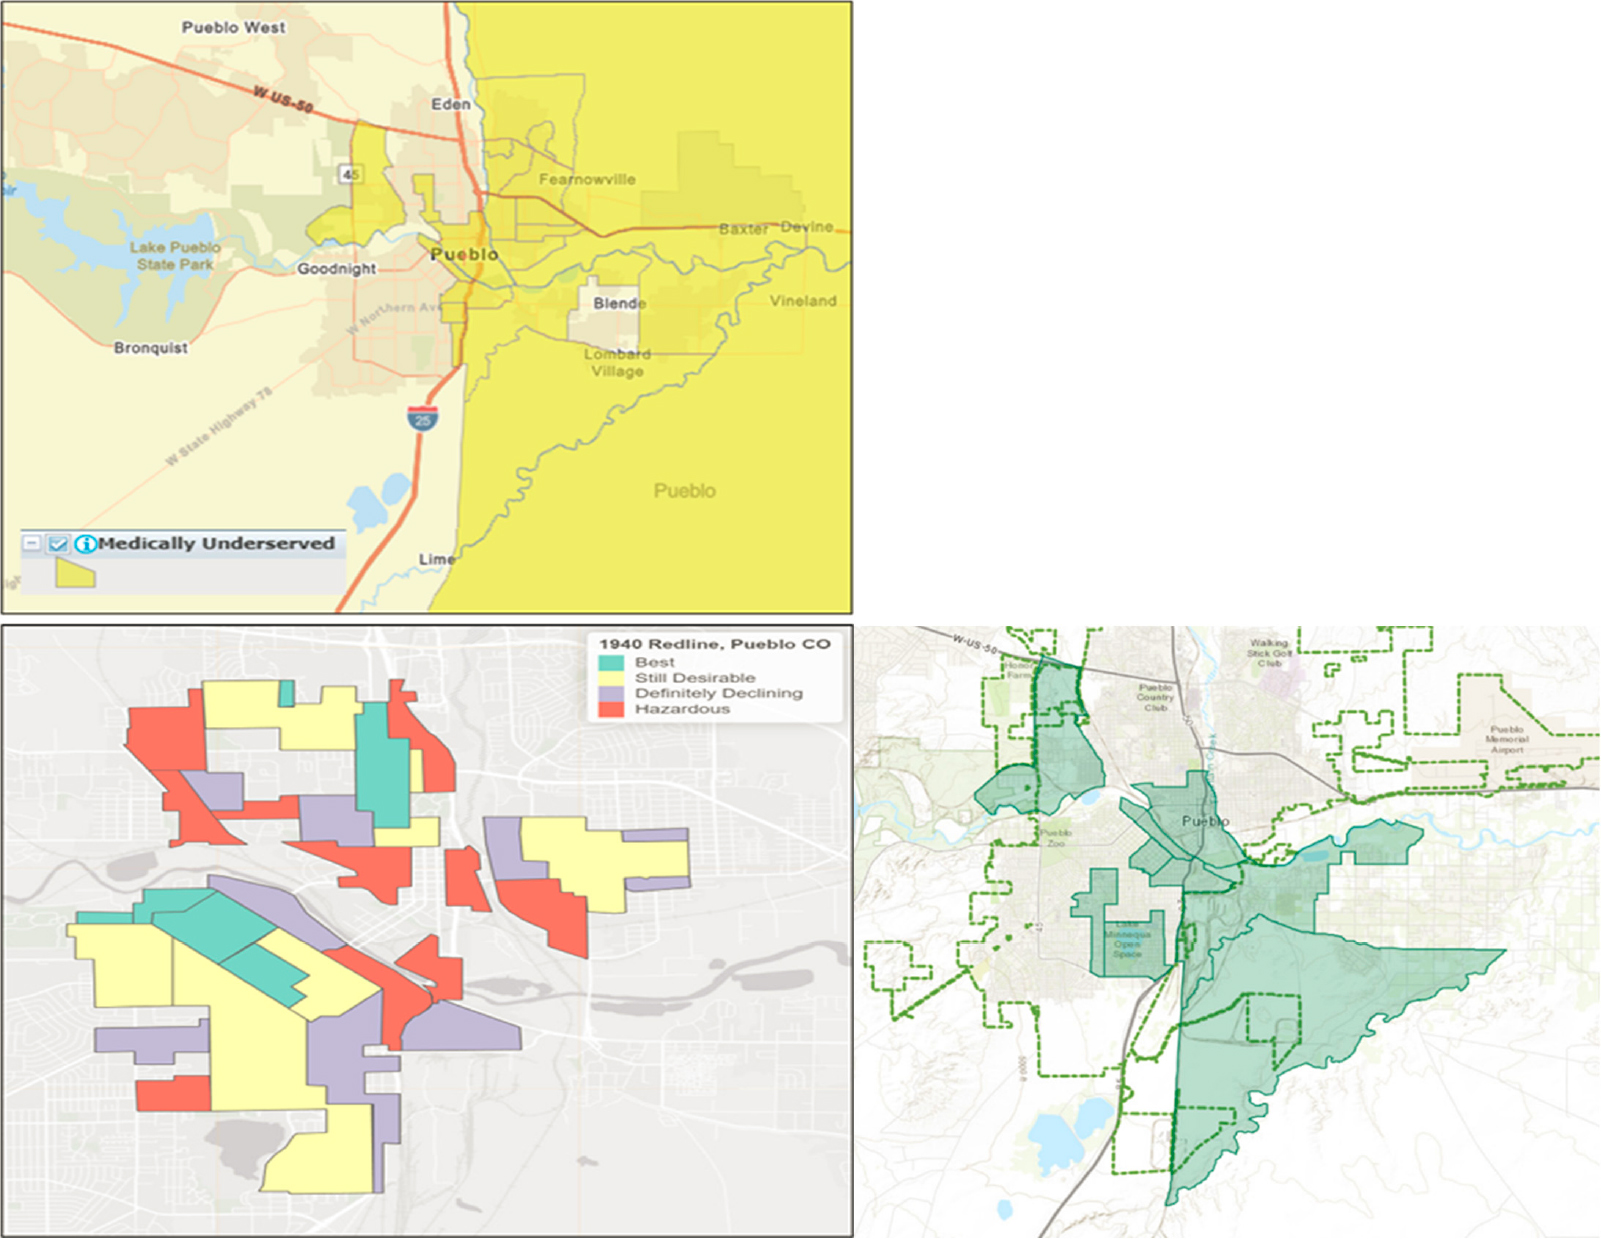
A second example is Pueblo, Colorado, which is located in a minority-majority census block group (Figure 6-2). Using open-source data, it can also be seen that the facility is within an opportunity zone. These zones were established by the 2017 Tax Cuts and Jobs Act and provide tax breaks to investors who invest unrealized capital gains into a qualified opportunity fund. Opportunity zones were determined using socioeconomic criteria, with room for local discretion based on more qualitative and local knowledge. The qualifying criteria, as set out by federal policy, require either a poverty rate of at least 20 percent or a median income that is no greater than 80 percent of the median income in the respective metropolitan area (Jacoby, 2019). The intent of the opportunity zone qualifying criteria was to target distressed communities. Figure 6-3 illustrates a case in which red zone areas remain medically underserved. Figure 6-4 illustrates that lower-income, under-resourced communities align with areas of higher ambient ozone and proximity to Superfund sites and hazardous waste sites.
SUMMARY
Disadvantaged communities have a higher burden of cumulative exposures to multiple stressors. Exposure to chemical stressors, such as Cr and Mn, can result from various sources in addition to slag in disadvantaged communities. Other chemical stressors, such as lead, can work in synergy with Cr and Mn in producing the observed health outcomes, including cognitive effects. Nonchemical stressors can also exacerbate the health outcomes observed for Cr and Mn exposures, including cognitive effects.
Disadvantaged communities can be located reasonably close to a slag processing facility and therefore have access to unencapsulated slag for residential use. Inequitable cumulative exposures to multiple stressors (chemical and nonchemical) in those communities can exacerbate health risks associated with exposure to slag components. Important considerations include the following:
- How racism influences cumulative exposures as part of cumulative risk, particularly with a lens toward health equity;
- Role of historical factors and practices that impact community exposures; and
- Structural racism, social determinants of health, and occupational exposures.
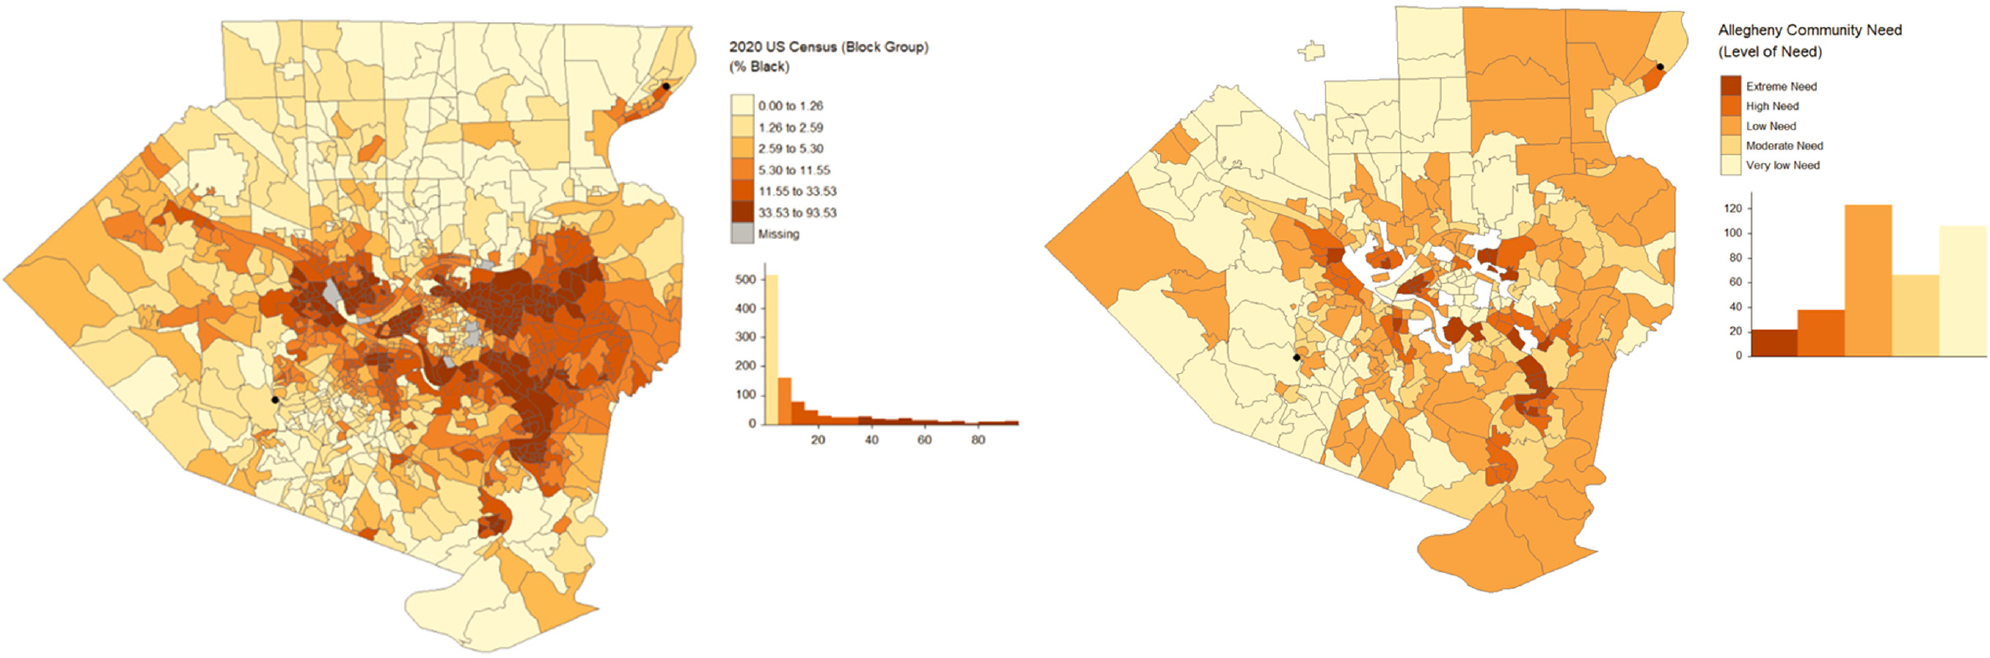
NOTE: Black dots indicate the location of two slag processing facilities. Need is only available at the census tract level for tracts shown.
SOURCE: Allegheny County Department of Human Services. 2021b. “Allegheny County Community Need Map.” See https://alcogis.maps.arcgis.com/apps/webappviewer/index.html?id=095b39af79d3483bbcd37418db2fb2e1.
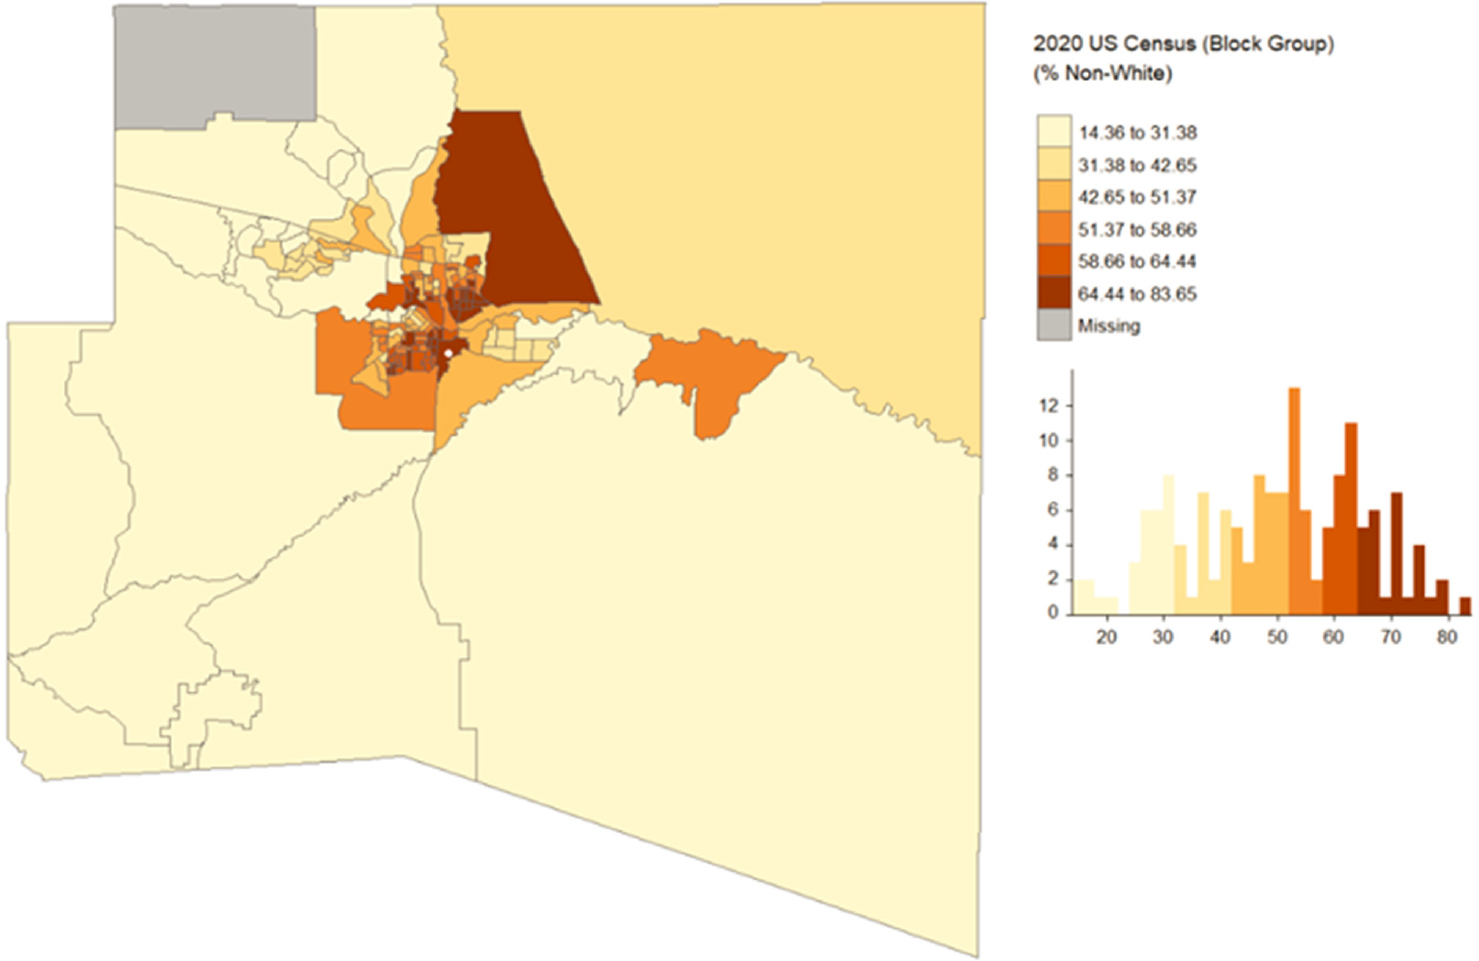
NOTE: The white dot indicates the location of the slag processing facility.
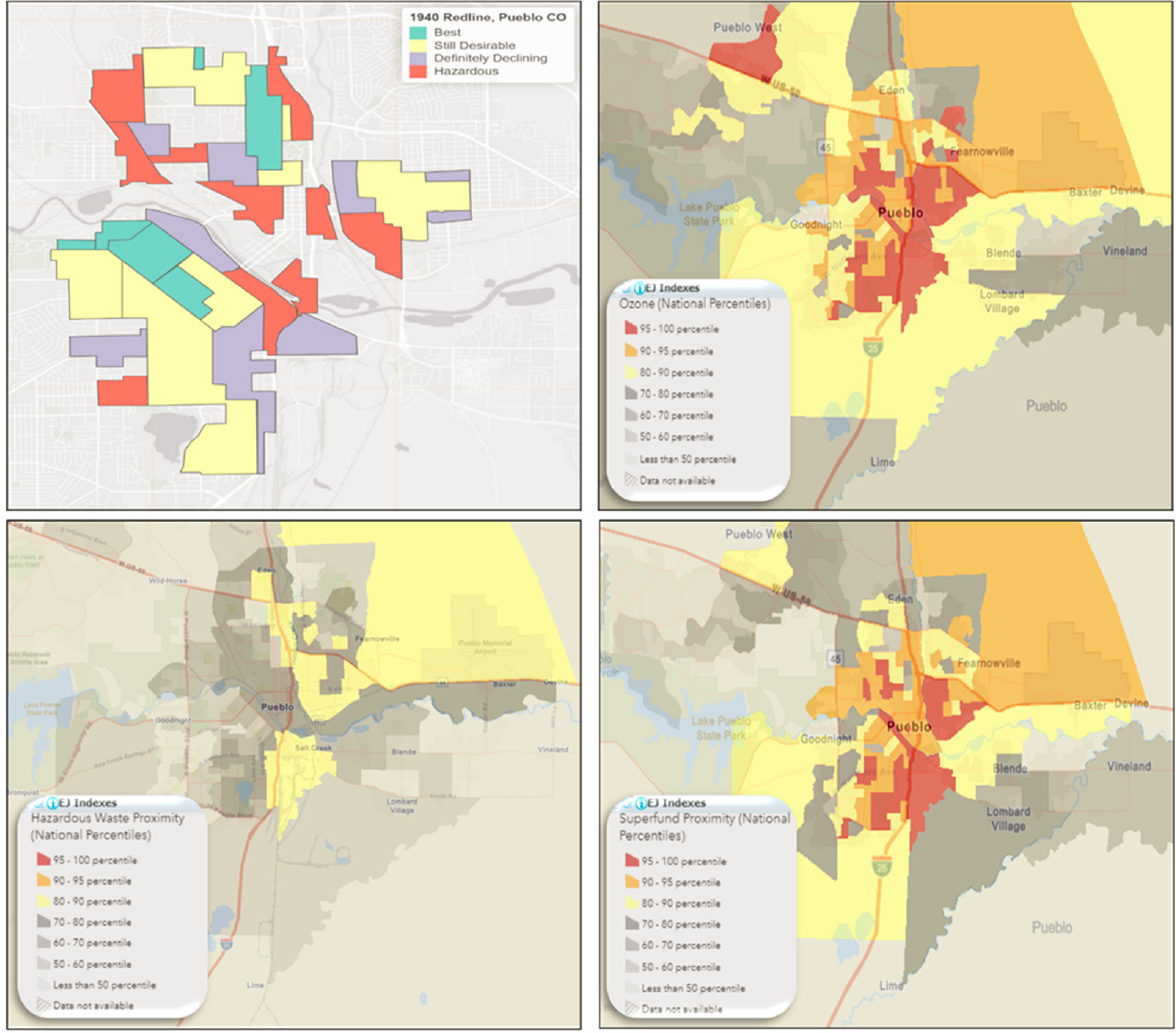
NOTE: Red and blue highlighting align with areas of higher ambient ozone, Superfund site proximity, and hazardous waste site proximity.
Ozone values are derived from 2019 source data from EPA’s Office of Air Quality Planning and Standards non-attainment areas. Ozone annual mean top 10 of daily maximum 8-hour concentration in air. Superfund proximity source is derived from Superfund Enterprise Management System database November 3, 2022. Count of proposed and listed NPL sites on the National Priorities List within 5 km (or nearest one beyond 5 km), each divided by distance in kilometers. Count excludes deleted sites. Hazardous waste proximity sources are derived from operating treatment, storage, and disposal facilities (TSDFs) from Resource Conservation and Recovery Act info and large quantity generators (LQGs) from the 2021 Biennial Reports on February 9, 2023. Count of hazardous waste management facilities (TSDFs and LQGs) within 5 km (or nearest one beyond 5 km), each divided by distance in kilometers (EJScreen Version 2.12).


