Third-Party Contracts for Fixed-Route Bus Operations and Maintenance: Performance Metrics (2023)
Chapter: Chapter 3 - Transit Agency Survey

CHAPTER 3
Transit Agency Survey
This chapter presents the results of the survey of transit agencies about their contracted-out bus service. The survey targeted North American transit agencies that report their data to the NTD and that have outsourced their fixed route bus service at least once in the last 5 years (between 2016 and 2020). This chapter is divided into the following sections:
- Survey Design and Methodology
- Results, which includes
- Nature of Contractual Arrangements,
- Reasons and Analyses for Starting and Continuing to Outsource,
- Accountability, and
- Benefits, Challenges, and Satisfaction
- Summary of Survey Results
Survey Design and Methodology
The team designed the survey to be between 10 and 15 minutes long, with a minimal number of open-ended responses. Participants that previously contracted out but now operate services directly were instructed to provide details of their most recent bus service contract. Participants that had multiple contractors were instructed to provide the details of their “main” contract, defined as the one that accounts for the majority of their outsourced bus operations. After the introductory material, the survey contained these sections:
- Nature of Contractual Arrangements (e.g., the proportion of service outsourced, number of contractors, support functions supplied, and contract payment structures)
- Reasons for Outsourcing
- Accountability (e.g., performance measures for revenue service and maintenance, data accuracy and validation, and oversight of staff and processes)
- General (e.g., benefits and challenges and satisfaction with contracting out)
Appendix C contains a flowchart summarizing the overall survey design. Appendix D contains the entire survey instrument.
To identify potential survey participants, the team downloaded rural and urban reporter NTD data for reporting years 2016 through 2020 and identified 409 transit agencies (i.e., unique NTD reporters) that contracted out their fixed route bus service (NTD mode MB) at least once between 2016 and 2020. Of these 409, 21 did not file a 2020 NTD report for bus service, leaving 388 transit agencies. The team excluded 115 transit agencies that outsourced less than five bus peak vehicles in 2020, leaving 273 potential survey recipients. The team then classified the 273 transit agencies based on the number of bus peak vehicles outsourced in 2020 using the classification system shown in Table 8. The team randomly selected 25 transit agencies from
Table 8. Peak-vehicle classification for potential survey participants.
| Category | Outsourced 2020 Bus (MB) Peak Vehicles Range | Number of Transit Agencies | Final Sample Size |
|---|---|---|---|
| Small | 5–24 | 178 | 24 |
| Medium | 25–99 | 58 | 25 |
| Large | 100 or more | 25 | 25 |
| Previously Outsourced1 | 0 | 12 | 9 |
| Total | 273 | 83 |
Note: 1Transit agencies that outsourced their bus service at least 1 year between 2016 and 2019 but were directly operating their bus service in 2020.
the small and medium groups and selected all transit agencies from the large and previously outsourced groups, resulting in 87 transit agencies selected to receive the survey. Transit agencies without publicly available contact information or with incorrect NTD data were eliminated from the sample, leaving 83 transit agencies selected to participate.
The small, medium, and large categories used in the survey classification system are not the same as those used in the NTD analysis in Chapter 2. In the NTD analysis, the team classified transit agencies based on their total bus service peak vehicles (including both directly operated and purchased transportation). In the survey, the team classified transit agencies based on their outsourced peak vehicles (excluding any directly operated service). Classifying agencies into small, medium, and large groups based on their outsourced peak vehicles allowed the team to obtain a variety of survey respondents based on the size of the outsourced service, not on the size of the agency as a whole.
The team recruited participants by sending a pre-invitation email containing a preview of the survey to identified points of contact at each of the 83 selected transit agencies. The team updated its contact lists as best as possible, based on bounced emails or responses that recommended a different point of contact. Finally, the team sent an official invitation email containing the link to the online survey and a link to the survey preview. The team followed up with recipients to encourage participation. Of the 83 eligible agencies, four declined to participate in the survey, and 40 never responded (either via email or by beginning to take the survey). Thirty-nine transit agencies began the survey, and 37 transit agencies completed it. Figure 6 is a map of the responding transit agencies.
Survey Results
Table 9 displays the contracting situation of the 37 respondents. Out of the 37 respondents, only two indicated that they had previously contracted out but switched to operating their service in-house. Most of the respondents (31 out of 37, or 84%) currently contracted out operations and maintenance. Only 11% contracted out revenue operations alone.
The rest of the survey results are presented using the following sections of the survey:
- Nature of contractual arrangements
- Reasons and analyses for starting and continuing to outsource
- Accountability
- Benefits, challenges, and satisfaction
Nature of Contractual Arrangements
This section of the survey obtained information about the nature of respondents’ current contracts, including how much bus operations and/or maintenance was contracted out, the
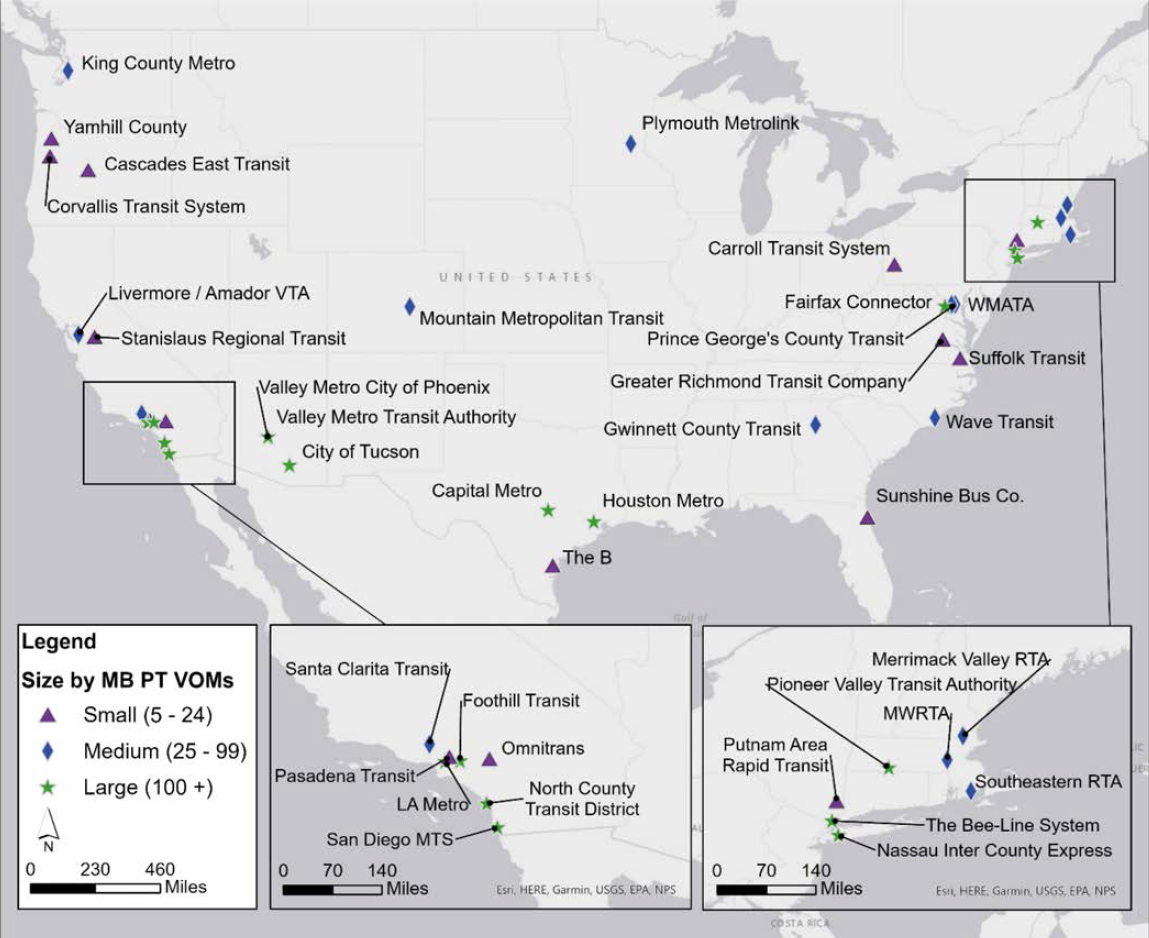
Figure 6. Map of transit agencies that completed the survey.
Table 9. Number of survey respondents by contracting situation.
| Contracting Situation | Number of Respondents | % of Respondents |
|---|---|---|
| Currently Contracting Out | 35 | 95% |
| Operations Only | 4 | 11% |
| Operations and Maintenance | 31 | 84% |
| Previously Contracted Out | 2 | 5% |
| Operations Only | 1 | 3% |
| Operations and Maintenance | 1 | 3% |
Note: Percentages are rounded and may not add up.
Table 10. Amount of bus operations contracted out.
| Amount of Bus Operations Contracted Out | Number of Respondents | % of Respondents |
|---|---|---|
| All | 26 | 70% |
| A Set of Routes | 7 | 19% |
| A Single Garage | 2 | 5% |
| Multiple Garages | 1 | 3% |
| Other | 1 | 3% |
| Total | 37 | 100% |
number and type of contractors, support functions provided by the contractor(s), the duration of contracts, and payment structures.
Amount of Service Contracted Out.
Most respondents (26 of 37, or 70%) contracted out all of their bus operations (see Table 10), and most respondents (25 of 37, or 68%) also contracted out all of their route bus maintenance (see Table 11). Table 12 displays a cross-tabulation of the amount of bus operations and bus maintenance contracted out. Five respondents did not outsource their maintenance, three of which outsourced all bus operations. Overall, the most common situation for respondents was to outsource all bus operations and maintenance.
Number and Type of Contractors.
Most respondents (28 of 37, 76%) had one contractor for their outsourced bus service, and most of the contractors (41 out of 48, 85%) were private for-profit companies (see Table 13). Although not common, nine respondents had multiple contractors: seven respondents had two, and two respondents had three separate contractors.
Table 11. Amount of bus maintenance contracted out.
| Amount of Bus Maintenance Contracted Out | Number of Respondents | % of Respondents |
|---|---|---|
| All | 25 | 68% |
| A Set of Routes | 4 | 11% |
| A Single Garage | 2 | 5% |
| Multiple Garages | 1 | 3% |
| None | 5 | 14% |
| Total | 37 | 100% |
Note: Percentages are rounded and may not add up.
Table 12. Cross-tabulation of the amount of bus operations and bus maintenance contracted out.
| Amount of Bus Operations Contracted Out | Amount of Bus Maintenance Contracted Out | |||||
|---|---|---|---|---|---|---|
| A Set of Routes | A Single Garage | Multiple Garages | All | None | Total | |
| A Set of Routes | 4 | 0 | 0 | 2 | 1 | 7 |
| A Single Garage | 0 | 2 | 0 | 0 | 0 | 2 |
| Multiple Garages | 0 | 0 | 1 | 0 | 0 | 1 |
| All | 0 | 0 | 0 | 23 | 3 | 26 |
| Other | 0 | 0 | 0 | 0 | 1 | 1 |
| Total | 4 | 2 | 1 | 25 | 5 | 37 |
Table 13. Number and type of contractors.
| Number of Contractors | Number of Respondents | Type of Contractor | ||||
|---|---|---|---|---|---|---|
| Private for-Profit | Private not-for-Profit | Another Public Transit Agency | Other Public Entity | Total | ||
| 1 | 28 | 24 | 4 | 0 | 0 | 28 |
| 2 | 7 | 11 | 0 | 0 | 3 | 14 |
| 3 | 2 | 6 | 0 | 0 | 0 | 6 |
| Total | 37 | 41 | 4 | 0 | 3 | 48 |
Outsourced Support Functions.
Contractors also often provide support functions in addition to operating revenue service and maintaining vehicles. Table 14 displays the support functions reported by respondents to be at least partially outsourced, sorted with the most common responses at the top of the table. (It is important to note that the survey did not provide respondents with precise definitions of each function, so responses rely on respondents’ interpretations of each function.) The two most common support functions were street supervision (reported by 35 respondents, 95%) and dispatching and radio room services (reported by 33 respondents, 89%). It was much less common for contractors to provide planning services (only reported by four respondents, 11%) or to provide revenue vehicles (only reported by two respondents, 5%).
Duration of Current Contracts.
Most respondents’ current contracts (57%) have been in effect for 3 or fewer years (see Table 15), and less than 20% of respondents reported having contracts in effect for more than 5 years.
Table 16 displays the maximum possible contract durations (including renewal options). The most common duration was 5 years, reported by 11 respondents (or 30%). The second most common duration was 10 years, reported by 9 respondents (or 24%). There were three
Table 14. Outsourced support functions provided by contractors.
| Outsourced Support Function | Number of Respondents (n = 37) | % of Respondents |
|---|---|---|
| Street Supervision | 35 | 95% |
| Dispatching (Radio Room) | 33 | 89% |
| Administration | 29 | 78% |
| Executive Management | 19 | 51% |
| Scheduling | 19 | 51% |
| Call Center | 18 | 49% |
| In-Person Customer Service | 13 | 35% |
| Passenger Information | 12 | 32% |
| Provide Operations and Maintenance Facilities | 7 | 19% |
| Planning | 4 | 11% |
| Provide Revenue Vehicles | 2 | 5% |
| None | 1 | 3% |
Note: Respondents could select more than one option unless they chose “None.” Table is sorted with the most common responses at the top. Respondents were not provided with definitions of these functions, so responses are based on respondent interpretation. In addition, some functions may only be partially outsourced.
Table 15. Number of years current contract has been in effect.
| Number of Years the Current Contract Has Been in Effect | Number of Respondents | % of Respondents | Cumulative % of Respondents |
|---|---|---|---|
| 1 | 8 | 22% | 22% |
| 2 | 11 | 30% | 51% |
| 3 | 2 | 5% | 57% |
| 4 | 4 | 11% | 68% |
| 5 | 5 | 14% | 81% |
| 8 | 1 | 3% | 84% |
| 9 | 2 | 5% | 89% |
| 10 | 2 | 5% | 95% |
| More than 10 Years | 2 | 5% | 100% |
| Total | 37 | 100% |
Note: No respondents reported having contracts in effect for 6 or 7 years, so those rows are omitted from the table.
respondents that reported contracts that could last over 10 years. Eighty-one percent of contracts were designed to last between 5 and 10 years.
Table 17 displays the number of renewal options contained in respondents’ current contracts. Two renewal options were the most common response (18 respondents to the question, or 53%), and 82% of contracts had three or fewer renewal options.
Payment Structures.
Many different payment structures are possible in contractual relationships. In fee-per-revenue-hour or mile-payment structures, the contract stipulates a price the transit agency pays for each unit of service delivered by the contractor (e.g., $4.00 per revenue mile). In cost pass-through payment structures, the transit agency is billed for actual costs incurred by the contractor rather than based on a fee per hour or mile. Contracts that include an additional administrative or overhead fee usually stipulate a price for the contractor’s fixed costs associated with managing and administering the service. The fee typically remains relatively constant, even with changes in service hours or miles.
Table 16. Maximum contract duration including renewal options.
| Maximum Duration of Contract in Years | Number of Respondents | % of Respondents | Cumulative % of Respondents |
|---|---|---|---|
| 2 | 2 | 5% | 5% |
| 3 | 1 | 3% | 8% |
| 4 | 1 | 3% | 11% |
| 5 | 11 | 30% | 41% |
| 6 | 1 | 3% | 43% |
| 7 | 6 | 16% | 59% |
| 8 | 3 | 8% | 68% |
| 10 | 9 | 24% | 92% |
| More than 10 Years | 3 | 8% | 100% |
| Total | 37 | 100% |
Note: No respondents reported having contracts in effect for 1 or 9 years, so those rows are omitted from the table.
Table 17. Number of renewal options in current contracts.
| Number of Renewal Options | Number of Respondents | % of Respondents | Cumulative % of Respondents |
|---|---|---|---|
| 1 | 5 | 15% | 15% |
| 2 | 18 | 53% | 68% |
| 3 | 5 | 15% | 82% |
| 4 | 2 | 6% | 88% |
| 5 | 2 | 6% | 94% |
| More than 5 | 2 | 6% | 100% |
| Total | 34 | 100% |
Note: Three respondents did not answer this question. Percentages are rounded and may not add up.
Table 18 displays the different payment structures in respondents’ contracts, sorted with the most common responses at the top of the table. The most common, reported by 25 respondents to the question (or 69%), was a fee per revenue hour or mile. Several contracts also included cost pass-through payments (11 respondents or 31%) and an additional administrative or overhead fee (14 respondents or 39%).
To examine the complexity of payment structures in current contracts, the team counted the number of structures reported by each respondent (see Table 19). A single payment structure was most common (reported by 19 respondents to the question, or 53%).
Reasons and Analyses for Starting and Continuing to Outsource
This section of the survey obtained information about why respondents originally started to contract out their bus service, why respondents continue to contract out, and what analyses are performed to decide to outsource.
Beginning to Outsource.
Table 20 displays respondents’ reasons for starting to outsource, sorted with the most common responses at the top of the table. Twenty-two (61%) of respondents to the question indicated they began outsourcing for historical, political, or legal reasons, which included those respondents that are required by law to outsource (e.g., in Massachusetts). However, the desire to reduce operating costs was also very common (17 respondents, 47%), as was the desire to increase service cost efficiency or effectiveness (8 respondents, 22%).
Table 18. Payment structures in current contracts.
| Payment Structure | Number of Respondents (n = 36) | % of Respondents |
|---|---|---|
| Fee per Revenue Hour or Mile | 25 | 69% |
| Additional Admin or Overhead Fee or Rate | 14 | 39% |
| Cost Pass-Through | 11 | 31% |
| Fee per Vehicle Hour or Mile | 6 | 17% |
| Fee per Day/Week/Month/Year | 4 | 11% |
| Fee per Mechanic or Maintenance Hour | 4 | 11% |
| Other | 3 | 8% |
Note: Respondents could select more than one option. One respondent did not answer this question. Table is sorted with the most common responses at the top.
Table 19. Number of payment structures in current contracts.
| Number of Payment Structures in the Contract | Number of Respondents | % of Respondents |
|---|---|---|
| 1 | 19 | 53% |
| 2 | 8 | 22% |
| 3 | 6 | 17% |
| 4 | 2 | 6% |
| 6 | 1 | 3% |
| Total | 36 | 100% |
Note: No respondents reported having contracts in effect for 5 years, so that row is omitted from the table. Percentages are rounded and may not add up.
Although historical, political, or legal reasons were the top justification to begin outsourcing, outsourcing is often still started with careful consideration. It is reasonable that some of the staff responding to the survey were not present when the transit agency first decided to outsource—making outsourcing seem to be the “way we’ve always done it” rather than a calculated decision.
Because reducing costs was a common reason to begin outsourcing, respondents reported conducting analyses focused on comparing the costs of outsourcing versus insourcing (see Table 21). The most common analyses were comparing the operational costs (17 respondents, 47%) and comparing the staffing needs (10 respondents, 28%) of outsourcing versus insourcing.
Several respondents did not know what initial analyses were conducted, likely because contracting out had started before the respondent’s tenure. Nine respondents (25%) reported that no analysis was conducted, which may be explained by the number of respondents who reported that contracting out was driven by historical, political, or legal reasons (see Table 20). The six respondents that selected “other” in Table 21 typically explained that outsourcing was past practice, and many even reported that outsourcing was in place since the transit agency’s inception.
Table 20. Reasons to begin outsourcing.
| Reason for Outsourcing | Number of Respondents (n = 36) | % of Respondents |
|---|---|---|
| Historical, Political, or Legal1 | 22 | 61% |
| Reducing Operating Costs | 17 | 47% |
| Increase Service Cost Efficiency or Effectiveness | 8 | 22% |
| Lack of Staff Capacity | 6 | 17% |
| Increase Service Flexibility | 5 | 14% |
| Needed Quick New Service Start-Up | 5 | 14% |
| Improve Service Quality | 4 | 11% |
| Lack of Staff Capability | 2 | 6% |
| Other | 2 | 6% |
| Don’t Know | 2 | 6% |
Note: Respondents could select more than one option unless they chose “Don’t know.” One respondent did not answer this question. Table is sorted with the most common responses at the top.
1The survey choice text was “historical or political”; however, several agencies also indicated a legal issue was part of their reasons to outsource. So, the team recoded some survey answers to be included under the “historical, political, or legal” option. This option includes transit agencies at which outsourcing is legally required.
Table 21. Initial analyses conducted to decide to begin outsourcing.
| Initial Analysis to Decide to Outsource | Number of Respondents (n = 36) | % of Respondents |
|---|---|---|
| Compare Operational Costs | 17 | 47% |
| Staffing Analysis | 10 | 28% |
| None | 9 | 25% |
| Compare Capital Costs | 5 | 14% |
| Compare Fully Loaded Costs | 5 | 14% |
| Other | 6 | 17% |
| Don’t Know | 5 | 14% |
Note: Respondents could select more than one option unless they chose “None” or “Don’t know.” Table is sorted with the most common responses at the top.
Continuing to Outsource.
Although the original reasons for beginning to outsource bus service might be largely historical or political, transit agencies not required by law to outsource have an opportunity at every contract expiration to reassess the costs and benefits of contracting out. Table 22 displays the reasons that respondents continue to outsource their bus service (sorted so that the most common responses are at the top of the table). Service cost efficiency or effectiveness was the main reason respondents decided to continue to outsource (reported by 19 respondents, 53%). Apart from historical, political, or legal reasons (reported by 16 respondents, 44%), not having enough staff to begin in-house operations was also a common response (reported by 10 respondents, 28%).
The following are a few highlighted reasons reported by the seven respondents who selected “other”:
- Reduced risk for the buyer of service
- Easier budgeting (based on cost per hour in the contract)
- Lacking operations and maintenance facilities
Table 22. Reasons to continue outsourcing.
| Reason to Continue Outsourcing | Number of Respondents (n = 36) | % of Respondents |
|---|---|---|
| Service Cost Efficiency or Effectiveness | 19 | 53% |
| Historical, Political, or Legal1 | 16 | 44% |
| Lack of Staff Capacity | 10 | 28% |
| Service Quality | 7 | 19% |
| Service Flexibility | 7 | 19% |
| Lack of Staff Capability | 6 | 17% |
| Need Quick New Service Start-Up | 2 | 6% |
| Other | 7 | 19% |
| Don’t Know | 0 | 0% |
Note: Respondents could select more than one option unless they chose “Don’t know.” One respondent did not answer this question. Table is sorted with the most common responses at the top.
1The survey choice text was “historical or political”; however, several agencies also indicated a legal issue was part of their reasons to outsource. So, the team recoded some survey answers to be included under the “historical, political, or legal” option. This option includes transit agencies at which outsourcing is legally required.
Table 23. Analyses conducted to decide to continue outsourcing.
| Analysis to Decide to Continue to Outsource | Number of Respondents (n = 33) | % of Respondents |
|---|---|---|
| Compare Operational Costs | 14 | 42% |
| Staffing Analysis | 14 | 42% |
| None | 13 | 39% |
| Compare Fully Loaded Costs | 4 | 12% |
| Other | 0 | 0% |
| Don’t Know | 2 | 6% |
Note: Respondents could choose more than one option unless they selected “None” or “Don’t know.” Four respondents did not answer this question. Table is sorted with the most common responses at the top.
Transit agencies that are not required by law to outsource may conduct analyses when deciding whether to contract out or directly operate service. Table 23 displays the analyses reported by survey respondents (the table is sorted with the most common responses at the top). Similar to the analyses conducted to initially decide whether to outsource, respondents mostly compared operational costs (14 respondents, 42%) and performed staffing analyses (14 respondents, 42%). However, 13 respondents (39%) reported not conducting any analyses. Again, this is likely because of several respondents outsourcing, at least in part, for historical, political, or legal reasons. When contracting out is how bus service has been historically provided, the significant changes required to switch to an in-house operation may be seen as prohibitive.
Summary of Reasons to Outsource.
When examining Table 20 through Table 23, an important theme emerges. Although historical and political (including legal) reasons were the most common single justification to begin outsourcing, reasons related to lowering costs and related to not having staff capacity or capability to insource were also important. Cost and staffing analyses were the two types of analyses that most frequently were performed by transit agencies when either beginning to outsource their bus service or deciding whether to continue to outsource. The synthesis of the evidence seems to suggest that the two main reasons transit agencies begin to and continue to outsource their bus service are to lower costs and to leverage the staff capacity and capabilities of a contractor.
Accountability
This section of the survey obtained information about the performance measures and processes used by transit agencies to provide oversight of contractors and to hold contractors accountable. The accountability section of the survey included the following sub-sections:
- Revenue Service Performance Measures
- Maintenance Performance Measures
- Data Accuracy
- Oversight Staff and Additional Oversight Processes
Revenue Service Performance Measures.
The survey provided respondents with a set of revenue service performance measures (i.e., performance measures associated with the operation of revenue service) and asked respondents four questions for each measure:
- How often is the measure monitored (in the context of holding the contractor accountable)?
- Is the measure explicitly mentioned in the contract?
- Is the measure tied to an incentive or penalty in the contract?
- Who calculates the measure?
Table 24 displays how often each measure is monitored. The table is sorted in descending order based on the percentage of respondents that indicated they do monitor the measure. Each measure had 35 respondents unless indicated otherwise in the table (two respondents did not answer this question at all). The table includes subtle shading of monitoring frequency to help readers quickly identify the most frequent responses, with darker green cells corresponding to more frequent responses, and lighter green cells corresponding to less frequent responses.
Every respondent that answered this question indicated they monitor a crash or accident rate. In addition, many other measures were monitored by more than 90% of respondents, including schedule adherence (more commonly called on-time performance [OTP]), missed trips or blocks, complaint rates (or complaint counts), and injury rates of passengers or employees. The measure that was most frequently monitored on a daily or weekly basis was missed trips or blocks, monitored daily or weekly by 22 (63%) of respondents.
The least-monitored measure was operator overtime usage, only monitored by 14 respondents (40%). The relatively low monitoring of overtime usage makes sense given that most contractors are paid a fee per revenue hour or mile (see Table 18), which is a fixed price, regardless of the amount of overtime accrued by operators.
Table 25 displays the answers to the three remaining questions for each measure. The table also contains the number of responses received for each measure and question, because the online survey did not show the measure to respondents if they did not monitor the measure. The table is sorted to match the sort order of Table 24, which is based on the percentage of respondents
Table 24. Monitoring frequency of revenue service performance measures.
| Performance Measure | Not Monitored | Daily / Weekly | Monthly | Quarterly | Total that Monitors |
|---|---|---|---|---|---|
| Crash/Accident Rate1 | 0% | 41% | 50% | 9% | 100% |
| Schedule Adherence [Enroute On-Time Performance (OTP)] | 3% | 51% | 40% | 6% | 97% |
| Missed Trips or Blocks (or % Service Operated) | 3% | 63% | 31% | 3% | 97% |
| Complaint Rate | 6% | 40% | 51% | 3% | 94% |
| Passenger/Employee Injury Rate1 | 6% | 29% | 56% | 9% | 94% |
| Cost Efficiency (e.g., Cost per Hour) | 11% | 11% | 63% | 14% | 89% |
| Complaint Response Time | 14% | 49% | 31% | 6% | 86% |
| Cost Effectiveness (e.g., Cost per Rider) | 14% | 6% | 60% | 20% | 86% |
| Service Effectiveness (e.g., Passengers per Hour) | 14% | 14% | 51% | 20% | 86% |
| Pull-Out Adherence (On-Time PullOuts) | 17% | 49% | 26% | 9% | 83% |
| Customer Satisfaction | 17% | 34% | 34% | 14% | 83% |
| First Time Point On-Time Performance | 20% | 43% | 31% | 6% | 80% |
| Headway Adherence or Headway Reliability | 23% | 40% | 31% | 6% | 77% |
| Overcrowding | 31% | 46% | 23% | 0% | 69% |
| Operator Absenteeism / Call Outs | 37% | 37% | 14% | 11% | 63% |
| Operator Overtime Usage | 60% | 11% | 20% | 9% | 40% |
Note: Percentages are rounded and may not add up.
1These measures had 34 responses.
Table 25. Additional characteristics of revenue service performance measures.
| Performance Measure | Measure is Explicitly Mentioned in Contract | Measure is Tied to Incentive or Penalty | Measure is Calculated by Transit Agency (Not Contractor) | |||
|---|---|---|---|---|---|---|
| % of Respondents | Total Respondents | % of Respondents | Total Respondents | % of Respondents | Total Respondents | |
| Crash / Accident Rate | 89% | 35 | 61% | 33 | 50% | 34 |
| Schedule Adherence (i.e., Enroute OTP) | 88% | 34 | 76% | 33 | 79% | 33 |
| Missed Trips or Blocks (or % Service Operated) | 91% | 34 | 73% | 33 | 70% | 33 |
| Complaint Rate | 72% | 32 | 58% | 31 | 84% | 31 |
| Passenger / Employee Injury Rate | 39% | 33 | 20% | 30 | 37% | 30 |
| Cost Efficiency (e.g., Cost per Hour) | 43% | 30 | 14% | 29 | 79% | 28 |
| Complaint Response Time | 72% | 29 | 41% | 29 | 79% | 29 |
| Cost Effectiveness (e.g., Cost per Rider) | 24% | 29 | 4% | 28 | 78% | 27 |
| Service Effectiveness (e.g., Passengers per Hour) | 37% | 30 | 11% | 28 | 79% | 29 |
| Pull-Out Adherence (On-Time Pull-Outs) | 63% | 27 | 50% | 26 | 85% | 26 |
| Customer Satisfaction | 61% | 28 | 31% | 26 | 73% | 26 |
| First Time Point On-Time Performance | 41% | 27 | 35% | 26 | 83% | 24 |
| Headway Adherence or Headway Reliability | 54% | 26 | 40% | 25 | 72% | 25 |
| Overcrowding | 13% | 23 | 5% | 22 | 71% | 21 |
| Operator Absenteeism / Call Outs | 33% | 21 | 15% | 20 | 32% | 19 |
| Operator Overtime Usage | 36% | 14 | 29% | 14 | 36% | 14 |
Note: The percentage of respondents is based on the number of respondents who answered the question as indicated in the header row divided by the total respondents for that measure.
that monitor the measure—the measure monitored by the most respondents is at the top of the table. The table includes subtle shading to help readers quickly identify the most frequent responses, with darker green cells corresponding to more frequent responses, and lighter green cells corresponding to less frequent responses.
As seen in Table 25, the top five measures explicitly mentioned in contracts were
- Missed trips or blocks (91% of 34 respondents),
- Crash/accident rate (89% of 35 respondents),
- Schedule adherence (OTP) (88% of 34 respondents),
- Complaint rate (72% of 32 respondents), and
- Complaint response time (72% of 29 respondents).
However, even though many measures were explicitly mentioned in contracts, it was somewhat less common for measures to be tied to an incentive or penalty. The top five measures tied to incentives or penalties were
- Schedule adherence (OTP) (76% of 33 respondents),
- Missed trips or blocks (73% of 33 respondents),
- Crash/accident rate (61% of 33 respondents),
- Complaint rate (58% of 31 respondents), and
- Pull-out adherence (on-time pull-outs) (50% of 26 respondents).
In summary, the most common measures to be both explicitly measured in contracts and to be tied to incentives or penalties were those measures related to delivering scheduled service on time and ensuring the safety and satisfaction of passengers.
In most cases, measures were calculated by transit agencies (and not the contractors). There were a few exceptions, however. Fifty percent of 17 respondents to the crash/accident rate measure indicated that the measure was calculated by the contractor. This makes sense, given the contractor is the one operating the service and, therefore, the one aware of, responding to, and reporting crashes/accidents. Other measures that were less frequently calculated by the transit agency included passenger/employee injury rate, operator absenteeism / call outs, and operator overtime usage.
More details about specific measures and the incentives and penalties tied to them are provided in the case examples in Chapter 4.
Maintenance Performance Measures.
The survey provided respondents with a set of maintenance performance measures (i.e., performance measures associated with the maintenance of revenue vehicles) and asked respondents the same four questions for these measures as were asked of the revenue service performance measures:
- How often is the measure monitored (in the context of holding the contractor accountable)?
- Is the measure explicitly mentioned in the contract?
- Is the measure tied to an incentive or penalty in the contract?
- Who calculates the measure?
Table 26 displays how often each measure is monitored. The table is sorted in descending order based on the percentage of respondents that indicated they do monitor the measure. Each measure had 30 respondents unless indicated otherwise (two respondents that outsourced maintenance did not answer this question at all). The table includes subtle shading of monitoring frequency to help readers quickly identify the most frequent responses, with darker green cells corresponding to more frequent responses, and lighter green cells corresponding to less frequent responses.
Table 26. Monitoring frequency of maintenance performance measures.
| Performance Measure | Not Monitored | Daily / Weekly | Monthly | Quarterly | Total Who Monitors |
|---|---|---|---|---|---|
| Distance Between Mechanical Failures | 7% | 17% | 70% | 7% | 93% |
| Preventative Maintenance (PM) Inspection On-Time Performance | 10% | 17% | 63% | 10% | 90% |
| Road Calls | 13% | 33% | 47% | 7% | 87% |
| Fleet Availability (% of Buses Available for Service) | 17% | 53% | 23% | 7% | 83% |
| Bus Washes/Cleaning | 27% | 43% | 23% | 7% | 73% |
| Corrective Maintenance Work Completed | 33% | 23% | 37% | 7% | 67% |
| Repeat Mechanical Failure Rates (Buses with a Repeated Problem) | 37% | 23% | 33% | 7% | 63% |
| Maintenance Campaign Work Completed | 37% | 17% | 33% | 13% | 63% |
| Maintenance Cost per Mile/Bus | 43% | 3% | 40% | 13% | 57% |
| Employee Injury Rates | 43% | 17% | 27% | 13% | 57% |
| Farebox Failure Rates | 47% | 20% | 30% | 3% | 53% |
| Work Order Closure Time/Rates | 50% | 20% | 23% | 7% | 50% |
| Road Call Response Time1 | 59% | 14% | 24% | 3% | 41% |
| Mechanic-to-Bus Ratio | 60% | 7% | 20% | 13% | 40% |
| Mechanic Absenteeism / Call Outs / Availability | 63% | 13% | 20% | 3% | 37% |
| Mechanic Overtime Usage | 63% | 10% | 23% | 3% | 37% |
Note: Percentages are rounded and may not add up.
1This measure had 29 respondents.
The two measures monitored by at least 90% of respondents were the distance between mechanical failures and preventative maintenance (PM) inspection on-time performance. The measures that were most frequently monitored on a daily or weekly basis were fleet availability and bus washes/cleaning. In general, fewer maintenance measures were monitored by a significant proportion of respondents when compared to the operational measures.
The least-monitored maintenance measures were similar to the least-monitored operational measures: mechanic absenteeism / call outs / availability and mechanic overtime usage. Again, this finding is aligned with the payment structures in the respondents’ contracts. When paying a fee per hour or mile, absenteeism or overtime among mechanics is a cost the contractor experiences but not one that is not directly passed on to the transit agency.
Table 27 displays the answers to the three remaining questions for each measure. The table also contains the number of responses received for each measure and question, because the online survey did not show the measure to respondents if they did not monitor the measure. The table is sorted to match the sort order of Table 26, which is based on the percentage of respondents that monitor the measure—the measure monitored by the most respondents is at the top of the table. The table includes subtle shading to help readers quickly identify the most frequent responses.
As seen in Table 27, the top five measures explicitly mentioned in contracts were the following:
- PM inspection on-time performance: 88% of 26 respondents
- Road calls: 73% of 26 respondents
- Distance between mechanical failures: 70% of 27 respondents
Table 27. Additional characteristics of maintenance performance measures.
| Performance Measure | Measure is Explicitly Mentioned in Contract | Measure is Tied to Incentive or Penalty | Measure is Calculated by Transit Agency (Not Contractor) | |||
|---|---|---|---|---|---|---|
| % of Respondents | Total Respondents | % of Respondents | Total Respondents | % of Respondents | Total Respondents | |
| Distance Between Mechanical Failures | 70% | 27 | 54% | 26 | 58% | 26 |
| PM Inspection On-Time Performance | 88% | 26 | 60% | 25 | 54% | 26 |
| Road Calls | 73% | 26 | 38% | 24 | 52% | 25 |
| Fleet Availability (% of Buses Available for Service) | 67% | 24 | 23% | 22 | 59% | 22 |
| Bus Washes/Cleaning | 68% | 22 | 25% | 20 | 57% | 21 |
| Corrective Maintenance Work Completed | 55% | 20 | 25% | 20 | 45% | 20 |
| Repeat Mechanical Failure Rates (Buses with a Repeated Problem) | 47% | 19 | 11% | 18 | 68% | 19 |
| Maintenance Campaign Work Completed | 37% | 19 | 21% | 19 | 68% | 19 |
| Maintenance Cost per Mile/Bus | 41% | 17 | 12% | 17 | 59% | 17 |
| Employee Injury Rates | 35% | 17 | 0% | 16 | 25% | 16 |
| Farebox Failure Rates | 50% | 16 | 25% | 16 | 69% | 16 |
| Work Order Closure Time/Rates | 33% | 15 | 13% | 15 | 33% | 15 |
| Road Call Response Time | 54% | 13 | 8% | 12 | 31% | 13 |
| Mechanic-to-Bus Ratio | 67% | 12 | 18% | 11 | 42% | 12 |
| Mechanic Absenteeism / Call Outs / Availability | 36% | 11 | 0% | 11 | 27% | 11 |
| Mechanic Overtime Usage | 45% | 11 | 9% | 11 | 27% | 11 |
Note: The percentage of respondents is based on the number of respondents that answered the question as indicated in the header row divided by the total respondents for that measure.
- Bus washings/cleaning: 68% of 22 respondents
- Fleet availability: 67% of 24 respondents
(Mechanic-to-bus ratio was also reported as explicitly mentioned in contracts by 67% of that measure’s 12 respondents, but since there were fewer respondents, the measure did not make the top five.)
Although several measures were explicitly mentioned in contracts, only the following two measures were tied to incentives or penalties for at least half of the respondents:
- PM inspection on-time performance: 60% of 25 respondents.
- Distance between mechanical failures: 54% of 26 respondents.
All of the remaining maintenance measures were reported as tied to incentives or penalties by less than 40% of respondents. Most measures were typically calculated by transit agencies.
Data Accuracy.
If performance measures are calculated by contractors without regular auditing or quality assurance processes, transit agencies may not know for certain whether the reported data are accurate. Based on survey results, many operational and maintenance measures were calculated by transit agencies and not by contractors; however, in some cases, transit agencies rely on contractor-reported data or logs to calculate performance measures. In both cases, whether the contractor is the source of the data or logs used by the transit agency or the contractor calculates the performance measures, the expectation of data accuracy from contractors is an important issue—especially when incentives or penalties are present.
Respondents were asked whether their contracts had language that required contractor-provided data and reports to be correct. Eighty-eight percent (30 of 34 respondents) answered affirmatively. Of those 30 respondents, 16 indicated that contractor-provided data accuracy was tied to an incentive or penalty.
Respondents were also asked whether they had regular, ongoing procedures to check contractor-provided data for accuracy. Eighty-eight percent (30 of 34 respondents) answered affirmatively. Of those 30 respondents, 19 indicated that they had regular procedures for checking all measures provided by the contractor; 11 indicated that those procedures were in place for only some of the measures. Three respondents reported they calculated all performance measures, and one reported that they did not have any regular procedures in place.
A few respondents described their procedures, such as
- Conducting on-site reviews and inspections,
- Comparing contractor-provided data with transit agency systems or manual checks,
- Conducting audits of contractor-provided monthly reports,
- Hiring a third party to review vehicle maintenance work,
- Randomly inspecting maintenance records, vehicle inspection reports, and work orders, and
- Physically inspecting a sample of the fleet weekly.
Oversight Staff and Additional Oversight Processes.
Having performance measures to monitor contractors’ performance is critical; however, transit agencies may also benefit from having specific staff dedicated to providing contractor oversight. Respondents were asked whether they had dedicated oversight staff to supervise or provide proactive oversight of contractors. Out of 34 responses, 31 (91%) reported they had dedicated oversight staff to either monitor bus operations or bus maintenance, or both. It was slightly more common for respondents to have dedicated oversight staff for operations (91%, or 31 out of 34 respondents) than to have dedicated oversight staff for maintenance (83%, or 24 out of 29 respondents).
However, even with dedicated oversight staff, 40% (12 out of 30 respondents) reported that these staff had adequate time to perform their oversight duties only some of the time. Respondents provided some explanations about the challenges causing oversight staff to not always have adequate time, and most responses related to those staff also having other duties that sometimes have to take priority over providing contractor oversight.
Respondents also indicated whether they used “secret shopper” or similar spot-check programs to help monitor contractor performance. Fifty-three percent (18 out of 34 respondents) reported having a spot-check program, while the remainder did not.
Benefits, Challenges, and Satisfaction
Through an open-ended question, respondents provided the most important benefits and most significant challenges they experienced from contracting out their bus service.
Some of the benefits described are paraphrased as follows:
- Cost efficiency (more service at a lower cost),
- Elimination or reduction of pension and benefits costs,
- Increased flexibility to make changes to service and service levels,
- Overall contractor competency and excellence in delivering high-quality service,
- Access to a national reservoir of best practices, and
- Reduced need to be engaged in day-to-day operations and bus operator management.
Some of the challenges described are paraphrased as follows:
- Costs of service increasing over time,
- Operator shortages, especially recently,
- Billing disagreements,
- Turnover of key personnel (e.g., contractor management staff),
- Service quality challenges,
- Inadequate documentation of performance measures or NTD data,
- Quality training of contractors’ employees, and
- Quality of maintenance.
As can be seen from the benefits and challenges, transit agencies appear to have a wide range of experience with outsourced service—what some agencies have experienced as benefits have been experienced by other agencies as challenges.
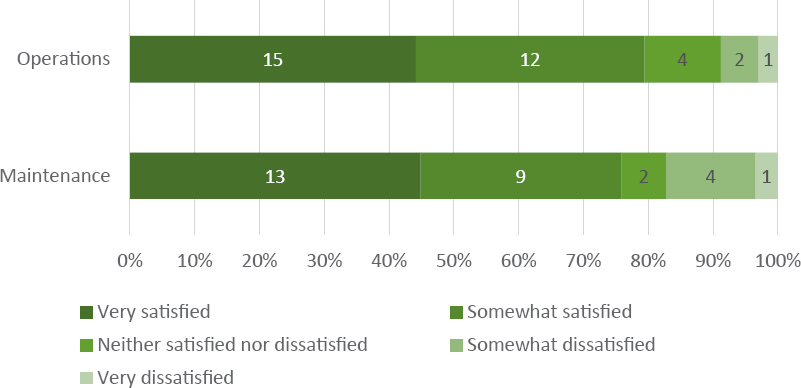
Respondents provided their overall satisfaction with their outsourcing of bus operations or maintenance (see Figure 7). Twenty-seven of 34 respondents (79%) were at least somewhat satisfied with their outsourcing of bus operations, with 15 of 34 (44%) being very satisfied. Responses for maintenance were similar to those for operations. However, the number of respondents either somewhat or very dissatisfied with their outsourced maintenance (five respondents out of 29, 17%) was higher than the respondents similarly dissatisfied with their outsourced operations (three respondents, 9%).
Summary of Survey Results
In this summary of results, percentages provide context around the statements made; however, for succinctness, the number of respondents for any given survey question or option is omitted. The number of respondents for each question and option may vary; the results tables provide full details.
The 37 respondents that completed the survey provided insights into contracting out bus operations and/or maintenance. First, it was most common that all bus service (instead of a portion of service) was contracted out (70%), and it was typical that both operations and maintenance were provided by the contractor (86%). Although most respondents only had one contractor for their bus service, nine respondents (24%) had either two or three contractors. It was common for contractors to provide support functions as a part of their contractual duties, with street supervision, dispatching (radio room), and administration being the most common support functions (reported by 95%, 89%, and 78%, respectively). It was rare for contractors to provide revenue vehicles (5%) or facilities (19%) or for contractors to provide transit planning services (11%).
Among the respondents, the average contract was in effect for 3 years or less (57%), and current contracts could last up to over 10 years (including renewal options). However, most contracts were designed to last between 5 and 10 years (81%).
The payment structures in contracts were mainly based on a fee per revenue hour or mile (69%); however, several contracts included cost pass-through and administrative or overhead fee elements (31% and 39%, respectively). Although over half (53%) of the respondents reported having a single payment structure in their contracts, the remaining had between two and six different reported payment structures.
The decision to begin outsourcing was mainly driven by both historical and political factors—including legal requirements (61%) and the desire to reduce cost (47%). As such, specific analyses to support initial outsourcing were sometimes not performed, but if they were, the analyses were usually related to comparing the operational costs (47%) or staffing requirements (28%) of contracting out versus operating service in-house. Similar factors and analyses were at play in the decision to continue outsourcing, with cost efficiency or effectiveness (53%) and historical, political, or legal factors (44%) being the most-cited reasons.
Respondents hold contractors accountable by tracking many different operations and maintenance performance measures. For the operations measures, crashes/accidents, schedule adherence (OTP), missed service, and complaints were the most monitored and the most likely to be tied to an incentive or penalty (see Table 24 and Table 25). For the maintenance measures, distance between mechanical failures, PM on-time performance, and road calls were the most monitored and the most likely to be tied to an incentive or penalty (see Table 26 and Table 27). For most measures, it was more common for transit agencies to perform the calculation of the measure than for the contractors to do so. However, maintenance measures were somewhat more likely to be contractor-calculated than operations measures.
Most respondents (83%) had contractual language that required contractor-provided data to be accurate and also had regular processes to check contractor-provided data for accuracy (88%). Most respondents (91%) also reported having dedicated oversight staff to provide proactive oversight of the contractor; however, for some respondents (40%), these staff did not always have adequate time to perform their contractor oversight because of other responsibilities. To augment dedicated oversight staff, some transit agencies (53%) implemented a secret shopper or similar program to perform spot checks of operations or maintenance.
Respondents reported many benefits related to outsourcing their bus service, including increased cost efficiency, reduced risk, reduced long-term staffing costs (e.g., pensions and benefits), and high-quality service without the need to manage day-to-day operations. On the other hand, respondents reported some challenges, including increasing costs, operator shortages, billing disagreements, turnover of key personnel, and service quality challenges.
Overall, respondents were satisfied with their outsourced bus service, with 79% of respondents being either somewhat or very satisfied with outsourced bus operations and 76% of respondents being either somewhat or very satisfied with outsourced bus maintenance.


