Third-Party Contracts for Fixed-Route Bus Operations and Maintenance: Performance Metrics (2023)
Chapter: Chapter 4 - Case Examples

CHAPTER 4
Case Examples
This chapter contains five case examples of U.S. transit agencies that contract out (or used to contract out) bus service. The chapter contains the following sections:
- Methodology
- The five case examples, including
- Nassau Inter-County Express (NICE Bus),
- MetroWest Regional Transit Authority (MWRTA),
- San Diego Metropolitan Transit System (San Diego MTS),
- City of Tucson (Sun Tran), and
- Escambia County Area Transit (ECAT).
- Summary of Case Examples
Methodology
The team developed a qualitative and quantitative approach to help select transit agencies as case examples using four main criteria:
- Criteria 1: Outsourcing to Insourcing. Select one transit agency that previously contracted out but began in-house operations within the last 5 years.
- Criteria 2: Insourcing to Outsourcing. Select one transit agency that previously directly operated service but began outsourced operations within the last 5 years.
- Criteria 3: Currently Outsourcing. Select three agencies that are currently contracting out and have done so for at least 3 of the last 5 years. Consideration will be given to the following areas:
- Identify at least one smaller (<50 buses MB total) agency. This agency could be a rural agency, but it does not necessarily have to be.
- Identify at least one agency that directly operates and outsources bus services in the same year(s).
- Identify one additional agency that has been contracting out the entire 5-year period.
- Criteria 4: General Considerations. When considering all five agencies,
- Try to have a national distribution with no two agencies from the same state,
- Prefer agencies that have completed the survey,
- Prefer agencies that have been contracting out longer, and
- Prefer agencies whose outsourced bus service has at least 10 vehicles operated at peak and whose outsourced service represents at least 25% of their total bus service.
Based on these criteria, the team selected five agencies as case examples and confirmed those selections with the study oversight panel. The team sent invitation emails to each agency, and after acceptance of the invitation, the team held a 60-to-90-minute interview with each agency.
The transit agencies provided the team with documents and example reports to include in the case examples. Transit agencies had an opportunity to review their case example write-ups before their publication in this report.

Nassau Inter-County Express (NICE Bus)
Nassau Inter-County Express operates public transit service throughout Nassau County, NY, as well as in the western portion of Suffolk County and the eastern portion of Queens County—a 285 square-mile service area home to nearly 1.4 million people (FTA 2020b). NICE Bus provides 38 fixed routes, complementary Americans with Disabilities Act (ADA) paratransit called NICE Bus/Able-Ride, and a pilot on-demand rideshare service called Nice Mini (NICE Bus 2022). Under contract with Nassau County, Transdev provides all transit functions, including executive management, administration, operations, and maintenance, and Nassau County provides the vehicles and facilities to enable service. NICE Bus is under the oversight of the Nassau County Department of Public Works, and the County’s Bus Transit Committee provides policy-level oversight (this group is comprised of individuals appointed by the Nassau County executive’s office and the Nassau County legislature). Outsourcing of transit operations is not required by law. Table 28 presents a summary of NICE Bus’s 2020 operating statistics for fixed route bus services.
The team selected NICE Bus as a case example under Criteria 3c (medium or large transit agency that has been outsourcing for at least the last 5 years). NICE Bus makes a good case example because (1) it contracts out all fixed route bus operations and maintenance to a single, for-profit contractor that also provides all support services (NICE Bus provides vehicles and maintenance facilities), (2) the current contract has been in place more than 10 years, (3) NICE Bus’s contract contains a good selection of performance measures, and (4) county staff are very satisfied with outsourcing.
Contracted Services Overview
Public transit service in Nassau County began in 1973 when several existing private operators were consolidated into a single system, operated by the Metropolitan Transit Authority (MTA) as MTA Long Island Bus. MTA continued to provide management, operations, and maintenance functions for Nassau County service until 2012 when Nassau County issued a Request for Proposals (RFP). Transdev (at the time named Veolia-Transdev) was awarded the contract, and Nassau County has been outsourcing fixed route bus service since then, working with Transdev the entire time. The initial contract with Transdev was for 5 years with an optional 5 years of additional service. In 2015, Nassau County elected to award the optional 5-year service period and recently extended that contract through December 2023.
Table 28. NICE Bus 2020 operating statistics for fixed route bus service.
| Statistic | Purchased Transportation Service |
|---|---|
| Peak Vehicles | 229 |
| Ridership | 14,263,561 |
| Revenue Hours | 697,327 |
| Revenue Miles | 7,813,194 |
Source:FTA 2020b.
The payment structure in the contract includes a fixed fee for management and administration plus a cost per revenue hour of operation. Transdev is contracted to provide a certain level of service (e.g., 800,000 revenue hours per month) but is paid for actual services provided each month (e.g., 750,000 hours) based on the agreed-upon cost per revenue hour.
Table 29 summarizes the functions outsourced to Transdev under NICE Bus’s service contract.
Outsourcing has always been how Nassau County provides transit service. Nassau County does not have the staff capacity to support a county transit department, and contracting out continues to be a positive experience for the county.
Accountability
Nassau County currently has approximately two full-time equivalent positions for the task of managing the County’s transit service and its contract with Transdev. In practice, this responsibility is shared between the Transportation Supervisor for Nassau County of Public Works (a full-time position) and part-time involvement from the County’s Office of Minority Affairs (to assist with disadvantaged business enterprise goals), Office of Emergency Management, and other County departments/services as needed (e.g., financials, capital projects, engineering, etc.). The Transportation Supervisor is tasked with the following responsibilities related to contractor accountability:
- Contractor oversight
- Contract management
- Grant management
Table 29. Summary of outsourced functions for NICE Bus’s fixed route bus service.
| Function | Outsourced? | Details |
|---|---|---|
| Executive Management | Yes | |
| Administration | Yes | |
| Scheduling | Yes | |
| Planning | Yes | Nassau County provides approval for new routes or major changes. These types of changes are discussed at quarterly bus transit meetings. Public outreach is included in the planning process, facilitated by Transdev. |
| Dispatching (Radio Room) | Yes | |
| Street Supervision | Yes | |
| Call Center | Yes | |
| Passenger Information | Yes | |
| In-Person Customer Service | Yes | |
| Providing Revenue Vehicles | No | Nassau County owns the revenue vehicles. |
| Maintaining Revenue Vehicles | Yes | |
| Providing Operations and Maintenance Facilities | No | Nassau County owns the facilities. |
| Maintaining Operations and Maintenance Facilities | Yes | Contractor provides basic maintenance and is also responsible for project management and execution of major facility improvements and expansions (with approval and cooperation of Nassau County). |
- Review of maintenance records (New York Department of Transportation [DOT] performs a supplemental weekly review of maintenance records)
- Ongoing meetings with the contractor
- Capital meetings every other month
Additionally, it is the Transportation Supervisor’s responsibility to ensure that all the fiscal activities are completed in a timely manner (processing payments, meeting federal reporting requirements, etc.), submit final NTD data, and work with the contractor to ensure data accuracy and timeliness.
Nassau County’s Bus Transit Committee meets publicly on a quarterly basis to review the state of NICE Bus operations (e.g., challenges and accomplishments) and approves new types of services or major service changes proposed by Transdev and the Transportation Supervisor.
Per the contract for service, Transdev is required to provide accurate data; however, inaccurate data is not tied to any financial penalties. Additionally, the County hosts regular service meetings and discussions with Transdev to ensure service is provided according to expectations. The County has access to the information systems used by the contractor; therefore, performance reports can be run at the County’s request. An independent controller has also done some checks into performance data and has attested to its accuracy.
To ensure service meets the expectations of the County, performance measures are used to track revenue service and vehicle maintenance. The following sections describe
- Revenue service performance measures,
- Maintenance performance measures, and
- Special programs for monitoring service.
Revenue Service Performance Measures.
As outlined in Table 30, NICE Bus uses a variety of performance measures to track the quality of revenue service, some of which are explicitly mentioned in the contract. All revenue service performance measures are calculated and reported by the contractor. Table 31 presents the incentives or penalties tied to some performance measures.
Table 30. NICE Bus revenue service performance measures.
| Performance Measure | Monitoring Frequency | Explicitly in Contract | Comments |
|---|---|---|---|
| Schedule Adherence (OTP) | Quarterly | ✓ | |
| Headway Adherence/Reliability | Quarterly | ||
| Pull-Out Adherence | Quarterly | ||
| First Time Point (OTP) | Quarterly | ||
| Missed Trips or Blocks | Quarterly | ✓ | |
| Complaint Rate | Quarterly | ||
| Customer Satisfaction | Quarterly | ||
| Overcrowding | Daily/Weekly | There is real-time crowding information available to the public that also tracks patterns in crowding. | |
| Crash/Accident Rate | Quarterly | ✓ | |
| Passenger/Employee Injury Rate | Quarterly | ||
| Operator Absenteeism / Call Outs | Quarterly | This metric is reviewed on an as-needed basis but has become especially important with bus operator shortages. |
Table 31. NICE Bus revenue service performance measures with incentives or penalties.
| Performance Measure | Performance Standard | Incentive or Penalty Details |
|---|---|---|
| Schedule Adherence (OTP) | 70% | $5,000 incentive or penalty.1 On-time is defined as arriving between 1 minute early and 5 minutes late, measured at the starting, middle, and last timepoints on routes. |
| Missed Trips or Blocks | 0% | $5,000 incentive or penalty.1 Rate is calculated as the number of missed pull-outs that result in a full missed trip ÷ scheduled pull-outs (excludes weather-related incidents). |
| Crash/Accident Rate | 1.2 per 100,000 miles | $5,000 incentive or penalty.1 Rate is calculated using total crashes/accidents divided by total revenue fleet odometer miles. |
Note:1The incentive is earned if Transdev meets the standard. The penalty is levied if Transdev fails to meet the standard.
Incentives and penalties are assessed quarterly; each performance standard met provides the contractor with a $5,000 bonus. Each performance standard not met results in a $5,000 penalty.
The performance measures provide an objective assessment of performance, and the incentives and penalties have been effective at motivating the contractor to reach the agency’s service goals.
Maintenance Performance Measures.
To ensure NICE Bus capital assets perform for the vehicles’ expected useful life, the transit agency uses a series of maintenance performance measures as presented in Table 32. All maintenance performance measures are calculated by the contractor, and none of the measures are explicitly mentioned in the contract. According to NICE Bus, incentives and penalties are not necessary for maintenance, because maintenance records are regularly reviewed by the County and New York State DOT.
Special Programs for Monitoring Service.
Transdev has a mystery rider program designed to provide an alternative method for tracking service quality. Findings from this program are presented to the Bus Transit Committee for review. Additionally, Transdev provides a full customer services department as part of their contract, and customer service statistics are presented to the Bus Transit Committee and at regular, ongoing meetings with NICE Bus staff.
Performance Measures in New RFP.
NICE Bus released an RFP in January 2022 for the management, operation, and maintenance of fixed-route and paratransit services. Although the incentives and penalties are similar to those in the current contract with Transdev, there
Table 32. NICE Bus maintenance performance measures.
| Performance Measure | Monitoring Frequency |
|---|---|
| Distance Between Mechanical Failures | Quarterly |
| PM Inspection On-time Performance | Quarterly |
| Repeat Mechanical Failure Rates | Quarterly |
| Bus Washes/Cleaning | Quarterly |
are some differences. Content from the liquidated damages and incentive payments section of the RFP is summarized below. Table 33 contains the performance-based incentives and penalties.
In addition to the incentives and penalties listed in Table 33, the RFP also levies LDs if specific contractor management positions do not stay for at least 2 years. The amount of the LD varies by position, as follows:
- Chief Executive Officer: $10,000
- Chief Operating Officer: $10,000
- Chief Financial Officer: $5,000
- Director of Safety: $5,000
- Director of Human Resources: $5,000
- Director of Scheduling and Planning: $5,000
Challenges, Notable Practices, and Lessons Learned
Challenges.
NICE Bus did not report any significant challenges, stating that the experience outsourcing transit service has been positive and without performance issues. One item that does require ongoing attention from County staff is ensuring that the contractor provides all the services included in the contract. NICE Bus’s contract requires the contractor to provide operations, maintenance, and all the support services needed to operate a bus transit system—even things like public relations and outreach. County staff does need to spend time overseeing the activities of the contractor to ensure that the contractor is providing all required services and that no activities are slipping through the cracks.
Notable Practices.
The team identified the following notable practices at NICE Bus.
- Contractor staffing oversight. NICE Bus includes a clause in its contract for service that gives the County the right to approve the contractor’s management staff changes. This authority helps reduce contractor management staff turnover. County staff will review resumes and even have discussions with potential incoming staff to help them decide whether to approve the new person.
- Customer experience assessment. NICE Bus uses two main ways to regularly obtain the perspective of its customers: a mystery rider program and regular tracking of customer
Table 33. NICE Bus revenue service performance measures with incentives or penalties as defined in its January 2022 RFP.
| Performance Measure | Performance Standard | Penalty Details | Incentive Details |
|---|---|---|---|
| Schedule Adherence (OTP) | 75% | 5% points below standard: $5,000 penalty | 3% points above standard: $5,000 bonus |
| Missed Trips or Blocks | 0% | 5% points below standard: $2,000 penalty | 5% points above standard: $2,000 bonus |
| Crash/Accident Rate | 1.2 per 100,000 revenue miles | 10% points below standard: $5,000 penalty | 10% points above standard: $5,000 bonus |
| Vehicle Maintenance Inspection Pass Rate1 | 90% | Less than 75%: $50,000 penalty 76% to 84%: $30,000 penalty 85% to 89%: $10,000 penalty | Not applicable |
Source: NICE Bus January 2022 RFP (provided by Nassau County staff).
Note:1The vehicle maintenance inspections are performed by New York State DOT staff.
- A straightforward set of performance-based incentives and penalties. NICE Bus’s contract with Transdev contains three incentives and penalties associated with revenue service performance measures, including schedule adherence, missed trips, and crashes/accidents. There are four performance measures in the new RFP, with vehicle maintenance being added to the list. Although the list of incentives and penalties is not long or overly complex, each involves a different aspect of performance, reducing overlap and keeping the incentive and penalty structure simple to administer.
complaints. Transdev provides the mystery rider program and the customer service department as a part of its scope of services under its contract with Nassau County. Statistics from both programs are presented to the Bus Transit Committee at its regular meetings.
Lessons Learned.
The following are some lessons that NICE Bus learned that might be helpful to other transit agencies.
- Be more than an oversight client. NICE Bus has learned that it is important to do more than simply provide contract oversight, supply funding, levy liquidated damages, and process invoices. NICE Bus has found that being inclusive and open with the contractor has helped to build relationships, creating a proactive and positive atmosphere that helps build a culture of ownership within both the contractor and the County.
- Frequent two-way communication. Establish and sustain dialog with top-level contractor management staff to maintain awareness of what the contractor is doing and to clearly communicate with the contractor about expectations.
- Focus on the human element. A contractor that prioritizes people (both riders and staff) achieves better service than one that is only focused on maximizing profit and/or avoiding penalties for substandard service.
Summary
Nassau County has worked with the same service contractor, Transdev, for over 10 years, outsourcing all aspects of transit service provision (except for capital assets) with contractor oversight and FTA compliance and grant management handled by one full-time county employee. The contractor continues to deliver what staff believes is an efficient and reliable service, and County staff are satisfied with the decision to outsource. NICE Bus has found that regular, two-way communication with the contractor is key to successful outsourcing and that performance incentives and penalties also help align the contractor’s goals and the County’s goals. Notably, Nassau County retains some decision-making power related to the contractor’s management staff to avoid rapid staff turnover and the detrimental service outcomes such changes can introduce.

MetroWest Regional Transit Authority (MWRTA)
The MetroWest Regional Transit Authority provides public transit service in the MetroWest region of Greater Boston. The main service area covers 16 towns within a service area of 272 square miles containing a population of 327,217 (FTA 2020d). There is limited service outside this area to serve transfers to other transit providers, most notably the Massachusetts Bay Transportation Authority for service into Boston (MWRTA 2022). As of May 2022, MWRTA has 15 routes that run on weekdays and 8 on Saturdays. Fixed-route services do not operate on Sundays or major holidays. Table 34 displays 2020 operating statistics for MWRTA’s fixed route bus service.
Figure 8 displays a MetroWest system map.
Table 34. MWRTA 2020 operating statistics for fixed route bus service.
| Statistic | Purchased Transportation |
|---|---|
| Peak Vehicles | 40 |
| Ridership | 474,988 |
| Revenue Hours | 85,790 |
| Revenue Miles | 1,210,820 |
Source:FTA 2020d.
MWRTA was established in 2006 as a regional transit authority by the state legislature and has an advisory board comprised of representatives from the communities served as well as a representative of the disabled community. Transit services began in 2007 and include fixed route bus service, demand response service (including ADA paratransit), and commuter shuttles. All services are outsourced to Kiessling Transit Inc., which is a subsidiary of National Express. State law mandates that MWRTA contracts out its service. In Massachusetts, transit agencies can be organized under either Chapter 161A or 161B of General Laws, Part 1, Title XXII. Chapter 161B, which applies to MWRTA, prohibits regional transit authorities from directly operating service.
The team selected MWRTA as a case example under Criteria 3a: currently outsourcing small agency (having less than 50 VOMS outsourced). MWRTA also makes a good case example, because (1) it only outsources operations (and not maintenance), (2) its outsourcing is required by state law, (3) it has a robust set of performance measures (including many that are explicitly named in the contract), and (4) it has a secret shopper program. In addition, MWRTA represents the experiences of a smaller agency, a suburban operating context, and the Northeastern region.
Contracted Services Overview
As previously noted, all fixed route bus services are outsourced. In MWRTA’s current contract, the contractor is responsible for operating bus service, hiring and managing bus operators and support staff, and providing customer service. MWRTA retains executive management, planning of bus routes and headways, and the purchasing and maintenance of vehicles. Table 35 summarizes which functions are outsourced versus performed in-house. In addition to the functions listed in this table, the contractor provides a safety manager who reviews requests to deviate fixed routes for ADA service and MWRTA has a staff member who handles commercial driver’s license training. The safety manager makes sure that the location is safe for the 25-ft buses used on fixed routes and that service can be provided without any backing or clearance issues.
The state law that requires outsourcing has been in place since before MWRTA was established. As such, MWRTA has never formally studied the merits of outsourcing versus directly operating bus service. MWRTA has gone through several contract cycles and worked with multiple contractors. The division of support functions has been consistent over time with one notable exception: a decision in 2015 to switch from outsourcing vehicle maintenance to performing it in-house. The main reasons for bringing maintenance in-house were to have control over maintenance and to focus on maintaining vehicles to a high standard (as opposed to minimizing costs). Since this change, MWRTA has heard many compliments from bus operators about the quality of the vehicles.

Figure 8. MWRTA system map.
Table 35. Summary of outsourced functions for MWRTA’s fixed route bus service.
| Function | Outsourced? | Details |
|---|---|---|
| Executive Management | No | |
| Administration | Yes | Administration includes hiring and management activities needed to provide service. |
| Scheduling | Partially | Routes are done in-house, but blocking, run cutting, and rostering are performed by contractor. |
| Planning | No | |
| Dispatching (Radio Room) | Yes | Contractor staffs radio room. Complaints are received and responded to by dispatch center and shared with MWRTA. |
| Street Supervision | Yes | Contractor provides street supervisors using MWRTA vehicles. |
| Call Center | No | MWRTA handles calls for service (also handles demand response and paratransit). |
| Passenger Information | No | |
| In-Person Customer Service | Yes | Contractor provides customer service face-to-face at central hub and by phone. Central hub location issues senior/disabled CharlieCard and loads value. |
| Providing Revenue Vehicles | No | MWRTA owns and maintains the revenue vehicles. |
| Maintaining Revenue Vehicles | No | |
| Operations and Maintenance Facilities | No | MWRTA owns and maintains operations and maintenance facilities. |
| Maintaining Operations and Maintenance Facilities | No |
The current contract for both fixed-route and demand-response service was signed in 2020 with Kiessling Transit, Inc. Kiessling was subsequently bought out and is now a subsidiary of National Express. The contract has an initial duration of 3 years, with two 1-year renewal options. The payment structure is based on an all-inclusive fee per vehicle hour, with vehicle hours being calculated from gate to gate (i.e., the hours include both revenue hours and deadheading to/from the depot). The first 3 years of rates are part of the contractor’s bid, with an annual escalation of around 3%. The current rate per hour is $48.21. The renewal options, if exercised, could involve renegotiation, as the value of the contract depends on the service hours planned by MWRTA and the performance of the contractor.
Accountability
MWRTA has dedicated staff who oversee the outsourced service. The Deputy Administrator is charged with the overall management/oversight of revenue service contracts. The department of Fixed-Route, Intermodal, and Marketing calculates on-time performance metrics, and the two main performance metrics used are pull-out adherence and missed trips. For pull-out adherence, the standard is within 5 minutes of the scheduled time, and the contract allows MWRTA to assess a $100 fee per occurrence for late pull-outs if the contractor is at fault. Any run that is 30 minutes or more behind schedule is considered to be missed, and MWRTA can assess an additional $500 fee (i.e., the total fee for a missed trip is $100 + $500, or $600). The contract also provides for a $1,000 pattern of practice penalty that can be assessed if the contractor consistently fails to meet a performance standard (e.g., a particular run is consistently late). MWRTA has never had to use the pattern of practice penalty.
MWRTA provides the vehicles, including insurance coverage and maintenance. If there is a crash or damage where the bus operator is at fault, the contract requires the contractor to pay the insurance deductible (currently $1,000). This provision is also used for minor damage below the deductible, such as an operator hitting a curb and blowing out a tire.
MWRTA strives for a collaborative approach with the contractor and has weekly oversight meetings to discuss performance and any issues that come up. MWRTA and the contractor’s staff work in the same building, and informal discussions in the hallway are common.
The following sections describe
- Revenue service performance measures and
- Special programs for monitoring service.
Revenue Service Performance Measures.
Table 36 summarizes performance measures that are currently tracked. In general, MWRTA calculates measures that pertain to service performance or service planning, while the contractor tracks measures related to complaints, crashes, and staffing. Within MWRTA, performance measures are calculated by the department of Fixed-Route, Intermodal, and Marketing.
Table 36. MWRTA revenue service performance measures.
| Performance Measure | Monitoring Frequency | Explicitly in Contract | Comments |
|---|---|---|---|
| Schedule Adherence (OTP) | Weekly | MWRTA uses Trapeze Streets to review random routes and check that operators are following routes, making stops, and returning to base on time. | |
| Pull-Out Adherence | Weekly | ✓ | Pulling out within 5 minutes of schedule is on time. |
| Missed Trips or Blocks | Weekly | ✓ | Defined as 30 or more minutes late. |
| Complaint Rate | Weekly | ✓ | Monitored, but no contractual penalty. If there are many complaints about a particular operator, MWRTA can remove them per the contract. |
| Complaint Response Time | Weekly | ✓ | Contractor proposed standard to follow up and resolve within 3 days. |
| Customer Satisfaction | Weekly | Tracked internally; surveyed annually. MWRTA checks Twitter daily. There is a general form on the website for questions/complaints. | |
| Overcrowding | Weekly | Tracked internally, part of service planning, so not the responsibility of contractor. | |
| Crash/Accident Rate | Weekly | ✓ | Rate not tracked, but contractor responsible for costs up to deductible for at-fault crashes. |
| Passenger/Employee Injury Rate | Weekly | ||
| Cost Efficiency | Monthly | ||
| Cost Effectiveness | Monthly | ||
| Service Effectiveness | Monthly | ||
| Operator Absenteeism / Call Outs | Weekly | ✓ | Contractor manages their own operators. |
| Operator Overtime Usage | Monthly | Overtime usage is up to contractor. |
Table 37 lists the contractual penalties or damages that can be assessed to the contractor. MWRTA noted that the penalties are discretionary, and that the agency tries to be strategic in using penalties to correct service problems. If the agency is seen as nitpicking, the contractor may compensate by increasing gate-to-gate times or raising their hourly rate at the next contract renegotiation.
Special Programs for Monitoring Service.
MWRTA has several special programs for contract oversight and service monitoring. For contract oversight, MWRTA works closely with the contractor and has no major concerns about data accuracy. At the end of each monthly billing period, MWRTA prepares an internal invoice to calculate estimated hours and billing amounts using internal data. This internal invoice is then compared to the contractor’s invoice and MWRTA investigates any discrepancies.
For service monitoring, MWRTA runs a mystery rider program. Participants are hired by the contractor, and MWRTA provides a form for the mystery rider to fill out. This program has been in place for many years, and MWRTA does internal audits on the forms and follows up on any complaints raised. MWRTA also has a travel trainer program. When the travel trainer is riding the service, they report back to MWRTA on the bus operator’s performance. MWRTA receives complaints and compliments from the community between two and three times per week. In addition, staff located at an intermodal station often relay passenger comments and their own observations. All buses have video recordings, and both MWRTA and the contractor have access to the videos, which are reviewed when incidents occur. MWRTA performs random video audits in which they review videos to ensure compliance with rules and performance expectations. The contractor provides the equipment for the DriveCam system and forwards reports from the vendor that provide data on unsafe driving behaviors.
Challenges, Notable Practices, and Lessons Learned
Challenges.
MWRTA reported the following challenges related to contracting out fixed route bus operations and maintenance:
- Working with contractors that are large companies. MWRTA has found it challenging at times to get responses and resolve issues when the contract was held by a large corporation. One example was in early 2020 when MWRTA was willing to offer agency COVID-19 testing to contractor staff and bus operators but had to go through layers of bureaucracy to get this approved.
- Operator recruitment. The contractor has struggled to recruit and hire an adequate number of bus operators. Although MWRTA is not directly responsible for operator recruitment, when the contractor is struggling with filling operator positions, the service suffers.
Table 37. MWRTA revenue service performance measures with incentives or penalties.
| Performance Measure | Performance Standard | Incentive or Penalty Details |
|---|---|---|
| Pull-Out Adherence | Within 5 minutes of schedule | $100 penalty per occurrence |
| Missed Trips or Blocks | Over 30 minutes late | $500 penalty per occurrence |
| Crash/Accident | If operator is at fault | Penalty based on lesser of insurance deductible or damages |
| Pattern of Practice | Pattern of poor performance1 | $1,000 penalty |
Note:1An example of a pattern of poor performance would be a particular run repeatedly being late.
Notable Practices.
The team identified the following notable practices at MWRTA.
- Discretionary penalties. Discretionary penalties (specifically allowed in the contract) allow MWRTA to build a collaborative culture with contractors while retaining the option to assess fees if service problems are not resolved.
- Invoice checking. MWRTA’s practice of generating a “mock” invoice from internal data to compare with the contractor’s submitted invoice is a noteworthy practice for identifying and correcting billing errors.
Lessons Learned.
The following are some lessons that MWRTA has learned that may be helpful to other transit agencies.
- Co-location of agency and contractor staff. MWRTA and the contractor are based in the same building, which helps to build relationships and quickly resolve issues.
- Strong working relationships. Many bus operators have been employed for years. During transitions between contractors, it is common for new contractors to vet and retain existing staff to ease the transition. MWRTA staff have an open-door policy and are often approached by bus operators with feedback about route conditions and passenger experiences.
Summary
MWRTA is a small transit agency in a suburban area of Greater Boston. Outsourcing is required by state law, so MWRTA has many years of experience in overseeing outsourced bus service and has worked with multiple contractors. Currently, MWRTA outsources bus operations, management, support staff, and customer service, while executive management, planning, and maintenance are performed in-house. MWRTA used to outsource maintenance but decided to take maintenance in-house to have more control over maintenance quality. MWRTA has experienced challenges in the past working with contractors who are large corporations and is currently experiencing an operator shortage along with transit agencies nationwide. In terms of lessons learned, MWRTA has found that co-location of agency and contractor staff has been valuable, and strong working relationships are important for delivering good service. Notable practices that other agencies might consider include discretionary penalties and MWRTA’s approach to invoice checking.
San Diego Metropolitan Transit System (San Diego MTS)
The San Diego Metropolitan Transit System (San Diego MTS) operates public transit service in the greater metropolitan area of San Diego, serving a total of 3,240 square miles and approximately 3 million people living in the urbanized areas of San Diego County as well as the rural parts of East County (San Diego MTS 2022). San Diego MTS is governed by a 15-member board of directors representing the areas served by San Diego MTS. San Diego MTS also “owns the assets of: San Diego Trolley, Inc.; San Diego Transit Corporation; and the San Diego and Arizona Eastern Railway Company” (San Diego MTS 2022).
San Diego MTS operates a fixed-route bus, complementary ADA paratransit (branded as MTS Access), and a trolley. San Diego MTS’s fixed route bus service consists of approximately 100 routes, including local, urban, express, premium express, and rural routes, in addition to commuter bus and a bus rapid transit (BRT) service known as Rapid Bus.
San Diego MTS directly operates the trolley and some fixed route bus service. The remainder of fixed route bus service and the MTS Access service is contracted out. Table 38 displays 2020 operating statistics for San Diego MTS’s fixed route bus services.
Table 38. San Diego MTS 2020 operating statistics for fixed route bus service.
| Statistic | Directly Operated Service | Purchased Transportation Service | Total |
|---|---|---|---|
| Peak Vehicles | 223 | 296 | 519 |
| Ridership | 18,383,114 | 20,286,607 | 38,669,721 |
| Revenue Hours | 781,729 | 1,056,021 | 1,837,750 |
| Revenue Miles | 9,236,042 | 10,894,941 | 20,130,983 |
Source:FTA 2020e.
The team chose San Diego MTS as a case example under Criteria 3b (agency that both directly operates and outsources bus service). San Diego MTS makes a good case example because it contracts out both operations and maintenance at multiple garages (but not all), has two private for-profit contractors, and the contractors both provide several supporting functions in addition to operations and maintenance. San Diego MTS is a larger system with a complex operating environment and has many performance measures explicitly mentioned in its contracts, with some measures associated with incentives or penalties.
Contracted Services Overview
San Diego MTS currently contracts out three out of its five bus divisions, including South Bay Division (operating fixed route bus and BRT), East County Division (operating fixed route bus, commuter express, and rural routes), and Copley Division (operating minibus and ADA paratransit). (The minibus service uses smaller vehicles on lower-performing bus routes.) San Diego MTS’s Imperial Avenue Division and Kearny Mesa Division are operated in-house under the umbrella of the San Diego Transit Corporation (a public non-profit).
Outsourcing the three bus divisions has a long history. In 2003 and 2004, state legislation divested the Metropolitan Transit Development Board of its long-range and infrastructure planning duties and moved them to the San Diego Association of Governments. The Metropolitan Transit Development Board was San Diego’s Metropolitan Planning Organization and transit-focused agency at the time. This divestiture also gave birth to San Diego MTS, which would focus on short-range transit planning and bus and rail operations. When San Diego MTS took over, several smaller operators were also operating bus services serving unincorporated areas or smaller municipalities. The state legislation gave San Diego MTS authority to consolidate these smaller operations, which were already contracted out. When absorbing these smaller operations, San Diego MTS continued to outsource those services, and the routes and services in these areas continue to be outsourced today.
San Diego MTS continues to obtain an independent cost estimate before they contract out any type of service. This estimate can be easily compared with the cost of their current in-house operations, and so far, outsourcing service remains more cost-efficient than switching to in-house operations. San Diego MTS also finds that outsourcing provides several benefits, including consistent pricing (making budgeting and planning much easier) and human capital management (i.e., the contractor is responsible for recruiting, training, and retaining all front-line staff). The historical precedent, cost efficiency, and convenience of outsourcing mean that San Diego MTS will likely continue to outsource far into the future.
Outsourced Functions.
At the outsourced bus divisions, both operations and maintenance are contracted out as well as some other support functions (more details below). San Diego MTS owns all vehicles and facilities that are operated and used by the contractors. First Transit is the contractor at Copley Division, operating and maintaining minibus and ADA paratransit
services. Table 39 lists the additional support functions provided by First Transit at the Copley Division. Transdev is the contractor at South Bay and East County Divisions, operating and maintaining the variety of fixed-route services operating out of those divisions, including a Rapid Bus BRT line. Table 40 displays the additional support functions provided by Transdev at the East County and South Bay Divisions.
Transdev is also responsible for towing vehicles.
Contractual Details.
The two contracts, one with First Transit and one with Transdev, are structured similarly; however, there are some differences. Table 41 displays some key characteristics of both contracts.
The Transdev contract also has some interesting cost pass-through mechanisms, including the following:
- Indirect contract costs can be passed through. For example, Transdev is responsible for maintaining facilities; however, if there is an improvement that is not within Transdev’s specific area of responsibility, Transdev can incur the cost and pass it through to San Diego MTS.
- Fuel costs are passed through.
- Engine and transmission repairs are passed through.
In both contracts, the fees per mile or hour increase each fiscal year, and both contracts contain provisions that stipulate significant increases or decreases in services that may cause a re-negotiation of the fees.
Table 39. Summary of outsourced functions at San Diego MTS’s Copley Division (First Transit).
| Function | Outsourced? | Details |
|---|---|---|
| Executive Management | Yes | Division-level general manager (GM) plus regional and national executive support. |
| Administration | Yes | Only includes administration at the division. |
| Scheduling | Partially | Three service changes a year. San Diego MTS creates the routes and builds the schedules (including trips and blocks) and hands those off to the contractor who handles run cutting and rostering. |
| Planning | No | |
| Dispatching (at the Division) | Yes | Contractor provides division dispatch, checking operators in and ensuring fitness for duty. |
| Dispatching (Radio Room) | Pending | (Pending; bus radio equipment recently installed.) |
| Street Supervision | Yes | San Diego MTS provides the non-revenue vehicles used by street supervisors. |
| Call Center | No | |
| Passenger Information | No | |
| In-Person Customer Service | No | |
| Providing Revenue Vehicles | No | San Diego MTS owns the revenue vehicles. |
| Maintaining Revenue Vehicles | Yes | |
| Providing Operations and Maintenance Facilities | No | San Diego MTS owns the operations and maintenance facility. |
| Maintaining Operations and Maintenance Facilities | Yes | First Transit is responsible for the state of good repair at the facility, which is owned by San Diego MTS. All major improvement work is funded and managed by San Diego MTS. |
Table 40. Summary of outsourced functions at San Diego MTS’s East County and South Bay divisions (Transdev).
| Function | Outsourced? | Details |
|---|---|---|
| Executive Management | Yes | Regional GM and a division manager for each division. |
| Administration | Yes | Only includes administration at the division. |
| Scheduling | Partially | Three service changes a year. San Diego MTS creates the routes and builds the schedules (including trips and blocks) and hands those off to the contractor who handles run cutting and rostering. |
| Planning | No | |
| Dispatching (at the Division) | Yes | Contractor provides division dispatch, checking operators in and ensuring fitness for duty. |
| Dispatching (Radio Room) | Yes | Contractor radio room staff includes front-line staff (radio dispatchers/controllers) and radio room manager. |
| Street Supervision | Yes | Transdev procures all their non-revenue vehicles, including supervision and relief vehicles. San Diego MTS provides maintenance trucks. |
| Call Center | No | |
| Passenger Information | No | |
| In-Person Customer Service | No | |
| Providing Revenue Vehicles | No | San Diego MTS owns the revenue vehicles. |
| Maintaining Revenue Vehicles | Yes | |
| Providing Operations and Maintenance Facilities | No | San Diego MTS owns the operations and maintenance facilities. |
| Maintaining Operations and Maintenance Facilities | Yes | Transdev is responsible for the state of good repair at both facilities, which are owned by San Diego MTS. All major improvement work is funded and managed by San Diego MTS (e.g., installing new equipment). |
Table 41. Key characteristics of San Diego MTS’s contracts with First Transit and Transdev.
| Current Contract Characteristic | First Transit | Transdev |
|---|---|---|
| Length of Time Since Effective Date | 3 years | 1 year |
| Duration | 10 years total: 6-year base plus two 2-year renewal options | 10½ years total: 6½-year base plus two 2-year renewal options |
| Payment Structure | Fee per revenue mile ($4.18 currently) |
|
Source: Contract documents provided by San Diego MTS and interviews with San Diego MTS staff.
Accountability
San Diego MTS has dedicated staff to oversee both contractors. The Director of Contract Operations and Passenger Facilities, in addition to other duties, oversees the bus services outsourced to Transdev and is supported by two Senior Contract Operations Administrators. The group has clearly assigned oversight duties, and they use several performance measures to monitor contractor performance. All the measures are calculated by San Diego MTS staff responsible for contractor oversight, although many may rely on accurate record keeping by the contractor. The contract includes specific language that requires contractor-provided data to be delivered timely and accurately. Moreover, the contract contains LDs for found inaccuracies and even more stringent penalties if the inaccuracy appears to be intentional (see the section on LDs below). San Diego MTS staff use customer complaint data to help validate Transdev reporting. San Diego MTS staff also compares reported revenue miles with scheduled revenue miles to ensure reported revenue miles appear reasonable.
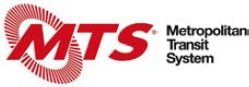
The contractor’s performance is summarized in a monthly key performance indicator report that is discussed by Transdev and San Diego MTS staff. Figures 9, 10, and 11 provide excerpts from the monthly key performance indicator report.
The Manager of Paratransit and Minibus, in addition to other duties, oversees the ADA paratransit and fixed route bus services outsourced to First Transit. San Diego MTS staff monitor contractor performance using several performance measures. The contract includes specific language that requires contractor-provided data to be delivered timely and accurately. The contract contains liquidated damages for found inaccuracies and even more stringent penalties if the inaccuracy appears to be intentional (see the section on liquidated damages below).
The following sections describe
- Revenue service performance measures,
- Maintenance performance measures, and
- Special programs for monitoring service.

Figure 9. Excerpt 1 from the March 2022 contract operations (fixed route) monthly report.
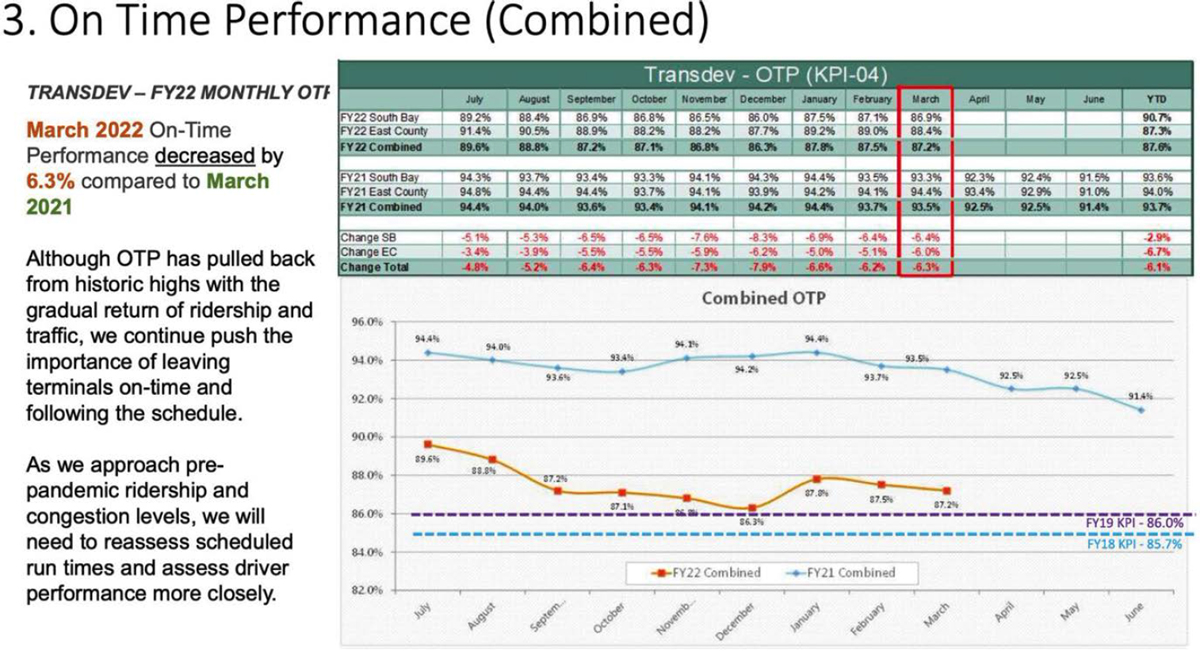
Figure 10. Excerpt 2 from the March 2022 contract operations (fixed route) monthly report.
Figure 11. Excerpt 3 from the March 2022 contract operations (fixed route) monthly report.
Revenue Service Performance Measures.
Table 42 summarizes performance measures currently in place for Transdev-provided service. (Performance measures for First Transit-provided service are similar enough to not require a separate table.)
San Diego MTS’s contracts with Transdev and First Transit contain many performance bonuses and assessments, referred to in this report as incentives and penalties. Table 43 displays the revenue service performance measures that are associated with incentives and penalties under the contract with Transdev. Table 44 displays the same information but under the contract with First Transit. A unique performance measure employed by San Diego MTS under the Transdev contract is its operator-based OTP measure, described in the second row of Table 43. Based on its internal analyses, San Diego MTS found that if most operators maintain at least 70% OTP, overall service quality is higher. Therefore, the contract with Transdev includes a bonus for when more than 10% of operators maintain 70% OTP for the month. (Operators must have hit at least 100 time points in the month to be included in the analysis.)
Maintenance Performance Measures.
Table 45 lists the maintenance performance measures monitored by San Diego MTS to ensure Transdev’s maintenance performance. (The details of the First Transit contract are similar enough to not require an additional table.)
San Diego MTS’s contracts with Transdev and First Transit contain several provisions for incentives and penalties associated with maintenance performance measures (see Table 46 and Table 47).
Additional Liquidated Damages.
In addition to the performance measures and associated incentives and penalties, both contracts also contain several liquidated damages. Some of those liquidated damages in the Transdev contract are highlighted in the following:
- $300 penalty per day plus the cost of salaries and benefits for each vacant position
- $500 penalty per occurrence of an operator not following the official route
- $1,000 penalty per incident of the contractor failing to accurately submit required reports
- $1,000 penalty for each incident where San Diego MTS finds that the contractor inaccurately reported missed mileage or fails to report a missed trip or mechanical failure
- $250 penalty per occurrence of an operator leaving a timepoint early
- $100 penalty per occurrence of an operator not making required stop announcements
- $1,000 penalty per incident of an operator working in service that has not completed training
- $1,000 penalty per day or incident that the contractor fails to return a bus to service after the bus is out of service for 30 calendar days (unless caused by long-term parts unavailability)
Some of the liquidated damages in the First Transit contract are highlighted in the following:
- $10,000 penalty per occurrence of receiving an unsatisfactory rating from the California Highway Patrol during an inspection of vehicle operator records or maintenance
- $500 penalty per occurrence of untimely reporting of any accident involving an MTS-owned vehicle where there has been vehicle damage, property damage, or personal injury (including fatality). Reporting by the contractor must occur within 1 hour of the contractor receiving notification and must follow up with specific details within 3 hours.
- $100 penalty per occurrence of an operator getting lost or going off-route causing passengers delay or inconvenience
- $150 penalty per occurrence of an operator leaving a timepoint early
- $500 penalty per occurrence of an operator not making required stop announcements
- $500 penalty for each incident where San Diego MTS finds that the contractor inaccurately reported missed mileage or fails to report a missed trip or mechanical failure
- $750 penalty for failing to make pull-out because of either vehicle or operator shortages
Table 42. San Diego MTS revenue service performance measures for the Transdev contract.
| Performance Measure | Monitoring Frequency | Explicitly in Contract |
|---|---|---|
| Schedule Adherence (OTP)1 | Monthly | ✓ |
| Headway Adherence/Reliability | Monthly | ✓ |
| Pull-Out Adherence | Not monitored | |
| First Time Point On-Time Performance | Monthly | ✓ |
| Missed Trips or Blocks | Monthly | ✓ |
| Complaint Rate | Monthly | ✓ |
| Complaint Response Time | Weekly | |
| Customer Satisfaction | Weekly | ✓ |
| Overcrowding | Weekly | |
| Crash/Accident Rate | Monthly | ✓ |
| Passenger/Employee Injury Rate | Monthly | |
| Cost Efficiency | Monthly | |
| Cost Effectiveness | Monthly | |
| Service Effectiveness | Monthly | |
| Operator Absenteeism / Call Outs | Weekly | |
| Operator Overtime Usage | Not monitored |
Note: 1Automatically reported and monitored by San Diego MTS Computer-Aided Dispatch / Automatic Vehicle Location system. On-time is defined as arriving at a time point between 1 minute early and 5 minutes late and not departing early.
Table 43. San Diego MTS revenue service performance measures with incentives or penalties in the Transdev contract.
| Performance Measure | Performance Standard | Incentive or Penalty Details |
|---|---|---|
| System-Wide Schedule Adherence (OTP) | 84.0% to 84.99% | Progressive incentive or penalty from +$7,500 to -$10,000 (see Table E-1 in Appendix E) |
| Operator-Based Schedule Adherence (OTP) | 10% of operators below 70% OTP |
Progressive incentive from +$2,500 up to +$15,000 (see Table E-2 in Appendix E) Exceeding the standard (having a smaller percentage of operators below 70% OTP) results in a higher bonus. There is no penalty. |
| Missed Trips or Blocks | 99.720% to 99.859% trips completed | Progressive incentive or penalty from +$10,000 to -$30,000 (see Table E-3 in Appendix E) |
| Operator-Related Complaint Rate | 7.00 to 7.99 |
Progressive incentive or penalty from +$10,000 to -$10,000 (see Table E-4 in Appendix E) Rate is calculated as the number of valid operator-related complaints divided by total number of riders multiplied by 100,000. |
| Crash/Accident Rate | 1.11 to 1.20 |
Progressive incentive or penalty from +$20,000 to -$10,000 (see Table E-5 in Appendix E) Rate is calculated as the number of preventable accidents per 100,000 total revenue fleet odometer miles. |
Table 44. San Diego MTS revenue service performance measures with incentives or penalties in the First Transit contract.
| Performance Measure | Performance Standard | Incentive or Penalty Details |
|---|---|---|
| System-Wide Schedule Adherence (OTP) | 85.01% | $1.00 penalty per time point not on time On-time is defined as arriving at a time point between 1 minute early and 5 minutes late and not departing early. |
| Missed Trips or Blocks | 99.85% trips operated | $240 penalty per missed trip |
| Complaint Rate | 7.00 to 7.99 (neutral) |
Progressive incentive or penalty from +$2,000 to -$3,000 (see Table E-6 in Appendix E) Rate is calculated as the number of valid complaints divided by total number of riders multiplied by 100,000. |
| Crash/Accident Rate | 0.01 to 1.20 (neutral) |
Progressive incentive or penalty from +$5,000 to -$10,000 (see Table E-7 in Appendix E) Rate is calculated as the number of preventable accidents per 100,000 total miles operated. |
Table 45. San Diego MTS maintenance performance measures in the Transdev contract.
| Performance Measure | Monitoring Frequency | Explicitly in Contract | Calculated By |
|---|---|---|---|
| Distance Between Mechanical Failures | Monthly | ✓ | San Diego MTS |
| Fleet Availability | Daily | Contractor | |
| Road Calls | Daily | ✓ | San Diego MTS |
| Road Call Response Time | Not monitored | ||
| PM Inspection On-time Performance | Monthly | ✓ | Contractor |
| Maintenance Cost Per Mile/Bus | Not monitored | ||
| Repeat Mechanical Failure Rates | Monthly | San Diego MTS | |
| Farebox Failure Rates | Monthly | San Diego MTS | |
| Work Order Closure Time/Rates | Not monitored | ||
| Corrective Maintenance Work Completed | Quarterly | San Diego MTS | |
| Maintenance Campaign Work Completed | Quarterly | San Diego MTS | |
| Employee Injury Rates | Not monitored | ||
| Mechanic Absenteeism / Call Outs / Availability | Not monitored | ||
| Mechanic Overtime Usage | Not monitored | ||
| Mechanic-to-Bus Ratio | Monthly | San Diego MTS | |
| Bus Washes/Cleaning | Monthly | San Diego MTS |
Table 46. San Diego MTS maintenance performance measures with incentives or penalties in the Transdev contract.
| Performance Measure | Performance Standard | Incentive or Penalty Details |
|---|---|---|
| Distance Between Mechanical Failures | 8,000 to 8,999 |
Progressive incentive or penalty from +$10,000 to -$10,000 (see Table E-8 in Appendix E) Rate is calculated as the total fleet miles divided by the total reportable Major and Other (combined) mechanical failures as defined by the NTD. |
| Fleet Availability | Must have sufficient buses available | $2,000 penalty per day for not having sufficient buses to operate all transit routes described in the contract |
| Pre-Trip Inspections | Every vehicle must have proper pre-trip inspection. | $250 penalty per incident of an operator operating a bus without the proper pre-trip inspection |
| PM On-Time Performance | All PMs must be on-time. | $500 penalty for a late PM (occurred more than 10% past the PM’s due mileage) $2,000 penalty for a missed PM (occurred more than 1,000 past the PM’s due mileage) $10,000 penalty for a pattern of late or missed PMs over a 3-month period |
| Bus Washes/Cleaning | Must sufficiently clean buses | $500 penalty for each incident that a bus is not cleaned to the requirements in the scope of work |
Table 47. San Diego MTS maintenance performance measures with incentives or penalties in the First Transit contract
| Performance Measure | Performance Standard | Incentive or Penalty Details |
|---|---|---|
| Distance Between Mechanical Failures | 7,000 to 8,999 | Exceeding the standard results in a $128 bonus per road call; failing to meet the standard results in a $128 penalty per road call. Rate is calculated as the total fleet miles divided by the total reportable Major and Other (combined) mechanical failures as defined by the NTD. |
| Pre-Trip Inspections | Every vehicle must have proper pre-trip inspection. | $300 penalty per incident of an operator operating a bus without the proper pre-trip inspection |
| PM On-Time Performance | All PMs must be on-time. | $250 penalty for a late or missed PM $2,000 penalty for a pattern of late or missed PMs over a 3-month period |
Both contracts also state the following:
- In lieu of liquidated damages, San Diego MTS reserves the right to pursue actual damages caused by a breach of contract.
- San Diego MTS can, at its discretion, not assess liquidated damages without setting any precedent that prevents it from assessing damages in the future.
- The assessment of penalties does not mean that the contractor can simply fail to meet the requirements in the contract.
Special Programs for Monitoring Service.
All complaints are handled and investigated by San Diego MTS, which helps provide the passengers’ perspective on service quality. San Diego MTS also reviews on-board videos—both in response to incidents or complaints and when conducting random reviews. San Diego MTS also has “ghost riders” who ride buses and do ride checks to ensure operators are performing their main responsibilities.
Challenges, Notable Practices, and Lessons Learned
Challenges.
San Diego MTS reported the following challenges related to contracting out fixed route bus operations and maintenance:
- Operator and mechanic retention. Although not likely directly related to outsourcing, San Diego MTS’s contractors, like many transit agencies, are experiencing a challenge retaining front-line staff—especially bus operators and mechanics. This challenge can drive up the contractor’s expenses as well as negatively impact service quality through missed trips.
- Contractor financial transparency. The pricing structures in San Diego MTS’s contracts are based on fees per unit of service provided (e.g., a fee per revenue mile). This pricing structure is established by the contractor during the proposal process and is officially adopted at the execution of the contract. However, there is no guarantee that the expense assumptions of the contractor will remain unchanged over time. Inflation, increasing fuel prices, increased labor costs, and other factors may increase the contractor’s expenses while the revenue from the contract remains fixed, causing real financial challenges and eating into the contractor’s profit margin. Contractors may cite increased costs as a challenge that limits their ability to address service quality or other issues. Because contractors do not regularly divulge their financial situation, San Diego MTS has found it can be difficult to know the extent to which contractors are experiencing financial strain outside of their control and beyond the contractor’s contingency or whether “costs are up” becomes the default explanation regardless of its veracity.
- Quality of service challenges. San Diego MTS has found that sometimes the quality of service in contracted operations is lower than in their in-house operations. Contracted operations need to be effectively monitored to ensure a high level of service quality is maintained.
- Alignment of contractor collective bargaining agreements (CBAs) and agency goals. San Diego MTS has found that occasionally, there may be a mismatch between a contractor’s CBAs and the agency’s goals. For example, the CBA may allow for same-day operator callouts without much repercussion. This may cause service quality challenges that perhaps could have been avoided if the CBA treated same-day callouts differently.
Notable Practices.
The team identified the following notable practices at San Diego MTS.
- Two-pronged OTP incentivization strategy. San Diego MTS has a notable approach to encouraging its contractor’s OTP, including both incentives and penalties for different levels of performance and measuring performance at the system level and the individual operator level. As discussed in the Accountability section of this case example, San Diego MTS rewards the contractor if it achieves a systemwide OTP of 85% or better and also if less than 10% of operators drop below 70% OTP in a given month. This approach helps incentivize not only overall OTP but also the performance of individual operators, which ultimately improves service quality.
- A collaborative relationship with contractors. San Diego MTS has worked hard to develop a collaborative relationship with its contractors, building strong relationships with the contractors’ management teams and working on issues collaboratively. San Diego MTS’s practice has been to first work to try to solve problems collaboratively before beginning to leverage liquidated damages, and this approach has been very effective for them.
Lessons Learned.
The following are some lessons that San Diego MTS learned that may be helpful to other transit agencies:
- Continuity of contractor management. San Diego MTS has found it very beneficial to make sure that the contractor’s management team stays the same for as long as possible. Keeping the same management team in place helps to maintain continuity—both operationally and administratively.
- Contractual flexibility. San Diego MTS has found it important to keep an element of flexibility in its contracts to allow for unforeseen but necessary adjustments to service or staffing. For example, the recent increase in electric bus adoption may require the contractor to provide an electric bus expert or to train existing mechanics on electric bus repair and maintenance at an additional cost to the contractor. If the contract does not have a mechanism for this change, it may be difficult for the contractor (and the transit agency) to begin using electric buses. Increased fuel prices and cost of living as well as general inflation may pose serious difficulties to contractors and transit agencies if there is limited flexibility in the contract to adjust to changing realities.
Summary
San Diego MTS has an extensive service area and outsources three of its five bus garages to two separate contractors: First Transit and Transdev. Although outsourcing at San Diego MTS began because of historical reasons (i.e., consolidation of smaller operators that contracted out), San Diego MTS continues to outsource some of its services because it has found outsourcing cost-efficient and convenient. Currently, San Diego MTS’s contractors, in addition to operating revenue service and maintaining buses, provide executive management, administration, supervision, radio room, and some other services focused on supporting revenue service (e.g., run cutting and rostering). San Diego MTS provides transit planning and customer service functions in addition to providing the facilities and revenue vehicles used by the contractors. San Diego MTS’s contracts contain a wide variety of incentives, penalties, and liquidated damages. Incentives and penalties are usually on a sliding scale by which exceeding the standard results in increasing bonuses and failing to meet the standard results in increased penalties. San Diego MTS has found contractor staffing shortages and increasing costs (e.g., higher fuel prices) to be a challenge, especially when contractors and services are impacted by these issues. However, through a collaborative approach to problem-solving, San Diego MTS continues to see outsourcing as a beneficial approach for its historically outsourced garages.

City of Tucson (Sun Tran)
The City of Tucson provides a variety of transit services in the Tucson, AZ region, made up of 335 square miles and a population of 828,206 (FTA 2020a). The city’s transit services are all organized under the Sun Tran brand and consist of the following (Sun Tran 2022c):
- Sun Tran: Comprises 30 local bus routes, 11 of which are part of the Frequent Transit Network (Sun Tran June 2022).
- Sun Express: Comprises 12 express bus routes.
- Sun Link: Comprises 1 streetcar route.
- Sun Van: ADA complementary paratransit service.
- Sun On Demand: On-demand general-public shared-ride service. Provides service in two zones.
As seen in the list above, fixed route bus service is also specifically called Sun Tran, replicating the overall brand name, while other services have different monikers (e.g., the streetcar service is called Sun Link). Sun Tran’s fixed route bus service has a long history, starting as a horse-drawn

Figure 12. Sun Tran local bus service.
streetcar system that was bought by the Tucson Rapid Transit Company in 1905. In 1969, the City of Tucson purchased the Tucson Rapid Transit Company, which was renamed Sun Tran in 1975 (Sun Tran 2022a). Figure 12 shows a Sun Tran bus stop and a Sun Tran bus in local service. Today, the following three entities cooperatively provide the Sun Tran fixed route bus service:
- The City of Tucson, among other roles, receives FTA funds and provides oversight. The City contracts out to RATP Dev for transit management services.
- RATP Dev, a private for-profit, which, under a contract with the City, is responsible for the management and day-to-day operations.
- Tucson Transit Management, LLC is a shell corporation that employs non-executive employees and is managed by RATP Dev Tucson Transit Management, LLC does business as Sun Tran but will be referred to within this case example as TTM to differentiate between the functions staffed by RATP Dev and TTM.
Sun Tran fixed route bus, Sun Van, and Sun Link are all operated under a single management contract with RATP Dev.
Table 48 contains 2020 operating statistics for Sun Tran’s fixed route bus service.
Although Sun Tran was selected as a case example under Criteria 2 (switching from insourcing to outsourcing within the last 5 years), the team found during the case example interviews that the City of Tucson has been outsourcing its service for over 5 years (even though NTD data suggests otherwise). According to City staff, NTD data suggesting they directly operated service is incorrect. The potential alternative agencies that met Criteria 2 did not respond to the survey, so the team decided to continue using Sun Tran as a case example.
Sun Tran makes a good case example because the City has extensive experience contracting out operations and maintenance for different types of transit services, has a robust set of performance metrics for monitoring service and contractor performance, and can provide relevant insights and “lessons learned” that will help other transit agencies make decisions about contracting out operations and maintenance.
Table 48. Sun Tran 2020 operating statistics for fixed route bus service.
| Statistic | Purchased Transportation |
|---|---|
| Peak Vehicles | 198 |
| Ridership | 12,346,810 |
| Revenue Hours | 689,783 |
| Revenue Miles | 8,206,957 |
Source:FTA 2020a.
Contracted Services Overview
The City originally started outsourcing fixed route bus operations to reduce operating costs, improve service quality, and allow bus operators the ability to strike. To assess the potential for outsourcing to reduce operating costs, City staff compared fully loaded hourly costs under in-house and outsourced scenarios. Regarding the ability for bus operators to strike, if bus operators were employees of the City instead of employees of a TTM, City charter rules would prohibit them from striking; City staff indicated that the ability to strike is an important and merited labor protection for bus operators. If not for the strike issue, bus operators would be City employees, though City staff indicated that the City might still opt to contract out transit service management for cost savings and service quality purposes.
The City has used management contractors other than RATP Dev in the past. When Sun Link streetcar service started in 2014 (Sun Tran May 2022), RATP Dev was the contractor that managed operations and maintenance of Sun Link streetcar service, while Transdev was the contractor that managed operations and maintenance of Sun Tran fixed route bus service and Sun Van ADA paratransit service. The City wanted a unified management contract for all three modes to improve system efficiency, and RATP Dev won the bid for the unified contract in 2017. Now, Sun Tran (fixed route bus), Sun Van (ADA paratransit), and Sun Link (streetcar) services are managed and operated under a single contract between the City and RATP Dev. Under the same contract, RATP Dev maintains the assets (vehicles and facilities) for Sun Tran and Sun Link. (The City contracts with a different entity for Sun Van maintenance, and RATP Dev oversees this contract.)
The current contract with RATP Dev has been in effect for 4 years and is a 6-year contract with two renewal options. The City pays all contractor costs as well as an administrative fee.
RATP Dev provides the overall general manager for Sun Tran, Sun Van, and Sun Link; an assistant general manager for each of the three services; and the director of safety and security for the regional transit system. All other fixed route bus transit staff (including operators, dispatchers, and planners) are TTM employees. RATP Dev is responsible for executive management, which includes oversight and provision of transit functions staffed by TTM employees, including (in addition to operations and maintenance): administration (e.g., payroll and accounting), scheduling, planning, dispatching, street supervision, maintenance, the Sun Tran call center, passenger information, customer service, and ticket sales. RATP Dev and the City share transit planning responsibilities; RATP Dev focuses on short-range planning while the City focuses on long-range planning.
The City manages transit grant funding via the City’s finance department, reports to FTA, and audits service via an in-house compliance department. The City owns all Sun Tran assets (e.g., the vehicles and the operations and maintenance facilities that support Sun Tran operations). The City opted to own these assets (as opposed to contracting service to a turnkey transit operator) to retain local control over how the assets are used.
Table 49 summarizes the extent to which fixed-route transit functions are outsourced from the perspective of the City.
Accountability
RATP Dev is contractually obligated to deliver Monthly Operations Reports (MOPs) and Monthly Compliance Reports (MCRs) to staff in the City’s compliance department. MOPs report performance indicators for all Sun Tran services as well as news such as the receipt of new buses (Sun Tran 2022b). MOPs are publicly available; Figure 13 and Figure 14 contain excerpts from a 2022 MOP. MCRs include more detail about the performance indicators as well
Table 49. Summary of outsourced functions for Sun Tran fixed route bus service.
| Function | Outsourced? | Details |
|---|---|---|
| Executive Management | Yes | Performed by RATP Dev; Sun Tran’s GM and assistant GM are RATP Dev employees. |
| Administration | Partially | The City manages grant funding, reports to FTA, and conducts audits. Other administrative functions (e.g., payroll) are performed by TTM employees managed by RATP Dev. |
| Scheduling | Yes | Performed by TTM employees managed by RATP Dev. |
| Planning | Partially | Short-range planning performed by TTM employees, managed by RATP Dev; long-range planning conducted by City staff. |
| Dispatching (Radio Room) | Yes | Performed by TTM employees managed by RATP Dev. |
| Street Supervision | Yes | Performed by TTM employees managed by RATP Dev. |
| Call Center | Yes | Performed by TTM employees managed by RATP Dev. |
| Passenger Information | Yes | Performed by TTM employees managed by RATP Dev. |
| In-Person Customer Service | Yes | Performed by TTM employees managed by RATP Dev. |
| Providing Revenue Vehicles | No | The City owns the revenue vehicles. |
| Maintaining Revenue Vehicles | Yes | Maintenance performed by TTM employees managed by RATP Dev. |
| Providing Operations and Maintenance Facilities | No | The City owns the operations and maintenance facilities. |
| Maintaining Operations and Maintenance Facilities | Yes | Maintenance performed by TTM employees managed by RATP Dev. |

Figure 13. Excerpt from the Sun Tran monthly operations report (fixed route bus).

Figure 14. Excerpt from the Sun Tran monthly operations report (fixed route bus).
as information related to compliance and whether or not the contractor is meeting the standards by which contract incentives and penalties are assessed. MCRs are not publicly available.
City compliance staff review the MOPs and MCRs and also conduct internal audits for the Public Transportation Agency Safety Plan and monitor compliance with drug and alcohol testing requirements. TTM staff, managed by RATP Dev, conduct most of the data collection and tracking, while City staff conduct monthly spot checks of the collected data. City staff has access to drug and alcohol testing files as well as access to all data in the scheduling and routing system (Trapeze). In between monthly reports, RATP Dev and City staff are frequently in communication, often daily.
The following sections describe revenue service performance measures and maintenance performance measures.
Revenue Service Performance Measures.
Table 50 describes the performance measures that the City uses to monitor the delivery of Sun Tran’s fixed-route service. All the measures in the table are calculated by the contractor, and all of the measures identified as being included in MCRs are explicitly listed in the contract. The definitions in the table are from MOPs or the contract.
MCRs additionally require RATP Dev to report monthly all federally funded procurement activity, pre-award Buy America audits, post-delivery Buy America audits, all grant-funded procurements, all disadvantage business enterprise participation, Title VI updates (e.g., training, complaints, and limited-English-proficiency services provided), an Equal Employment Opportunity update (e.g., complaints closed and filed), operator training/retraining plans accomplishments, safety and security activity (e.g., drills and in-service events), and drug and alcohol compliance. MCRs require an annual review/audit of third-party drug and alcohol testing.
Table 50. Sun Tran revenue service performance measures.
| Performance Measure | Monitoring Frequency | Included in Monthly Operations Reports? | Included in Monthly Compliance Reports? |
|---|---|---|---|
| Ridership | Monthly | ✓ | ✓ |
| Passenger Revenue | Monthly | ✓ | |
| Passengers per Revenue Mile | Monthly | ✓ | |
| Passengers per Revenue Hour | Monthly | ✓ | |
| Revenue per Revenue Mile | Monthly | ✓ | |
| Revenue per Revenue Hour | Monthly | ✓ | |
| Farebox Recovery Ratio | Monthly | ✓ | |
| Cost per Passenger | Monthly | ✓ | ✓ |
| Cost per Revenue Mile | Monthly | ✓ | |
| Cost per Revenue Hour | Monthly | ✓ | |
| Net Cost per Revenue Hour | Monthly | ✓ | |
| Number of Total Accidents per Month | Monthly | ✓ | |
| Number of Preventable Accidents per Month | Monthly | ✓ | |
| Preventable Accidents per 100,000 Revenue Miles1 | Daily / Weekly | ✓ | ✓ |
| Number of Passenger Complaints2 | Monthly | ✓ | |
| Complaints per 100,000 Passengers | Monthly | ✓ | ✓ |
| Vehicles Operated in Maximum Service | Monthly | ✓ | |
| On-Time Performance (OTP)3 | Monthly | ✓ | ✓ |
| Missed Schedule | Monthly | ✓ | |
| Missed Trips | Monthly | ✓ | |
| Late Trips | Monthly | ✓ | |
| Number of Work-Related Injuries | Monthly | ✓ | |
| Customer Service Performance | Monthly | ✓ | |
| Traffic Citations | Monthly | ✓ | |
| Percent Employee Turnover | Monthly | ✓ | |
| Number of Delays/Rescues Regarding Wheelchairs and Mobility Devices | Monthly | ✓ | |
| Number of Mobility Device Issues4 | Monthly | ✓ |
Source:City of Tucson Transit System Management Services 2019, Sun Tran 2022b, and the transit agency survey for this study.
Note:1Preventable accidents are defined in the contract.
2Valid passenger complaints in the customer service database.
3On-time is between 1 minute early and 5 minutes late.
4Includes full bus events, equipment malfunctions, rescues, and full bay events.
The contract specifies how the contractor will calculate some of the performance measures, with consideration of the systems that have been in use for years and have been inherited from previous contractors. The City occasionally asks the contractor to propose augmented software (e.g., new tools or software modules).
Table 51 shows the performance measures that City staff use to determine if contract incentives or penalties are warranted based on the quality of Sun Tran service delivered under the contract. All incentives and penalties are assessed monthly unless otherwise stated in the table. According to the contract, the performance measures in Table 51 were selected to comply with the following guidelines:
- The contractor can largely control the indicator.
- The indicator can be readily tracked and evaluated.
Table 51. Sun Tran revenue service performance measures with incentives or penalties.
| Performance Measure | Performance Standard | Incentive or Penalty Details |
|---|---|---|
| Schedule Adherence (OTP) | 92 to 94% | Progressive incentive or penalty from +$500 to -$500 (see Table F-1 in Appendix F) |
| Passenger Complaints per 100,000 Boardings | 4 to 4.5 (including Sun Link) | Progressive incentive or penalty from +$500 to -$500 (see Table F-2 in Appendix F) |
| Total Preventable Accidents/Incidents per 100,000 Service Miles | 0.61 to 0.70 | Progressive incentive or penalty from +$1,000 to -$2,000 (see Table F-3 in Appendix F) |
| Annual Ridership | Maintain baseline | Incentive of $10,000 for each 1% increase in ridership above baseline (up to 10%) |
| Annual Traffic Citations | Less than 23 | Penalty of $1,000 per citation received over 22 citations (applied annually) (see Table F-4 in Appendix F) |
Source:City of Tucson Transit System Management Services 2019.
Note: Details of each incentive and penalty can be found in Appendix F.
- The performance goal for the indicator can be “specific, measurable, achievable, relevant, and timebound.”
Tables F-1 through F-4 in Appendix F display the incentives and penalties associated with revenue service performance measures. The dollar values of the incentives and penalties may seem small, because they are based on the management contractor portion of the contract budget, not on the overall Sun Tran budget. The contract stipulates that all reported data must be accurate, but there are no associated incentives or penalties for the accuracy of data.
Maintenance Performance Measures.
Table 52 describes the performance measures that the City uses to monitor the maintenance of Sun Tran assets. All the measures in the table are calculated by the contractor, and all measures identified as being included in MCRs are explicitly identified in the contract. The definitions in the table are from MOPs or the contract.
MCRs additionally require RATP Dev to report on fleet composition (e.g., fleet age and spare ratio) on a monthly basis. MCRs require quarterly reporting of rolling stock status.
Table 53 shows the performance measures that City staff use to determine if contract incentives or penalties are warranted based on how well the management contractor is maintaining Sun Tran assets. All maintenance-related incentives or penalties are assessed monthly. Details about how the incentives and penalties are determined can be found in Table F-5 and Table F-6 in Appendix F. As is the case of the service quality performance measures, the dollar values of the
Table 52. Sun Tran maintenance performance measures.
| Performance Measure | Monitoring Frequency | Included in Monthly Operations Reports? | Included in Monthly Compliance Reports? |
|---|---|---|---|
| Miles Between Road Calls | Monthly | ✓ | ✓ |
| Miles Between Bus Inspections | Monthly | ✓ | |
| Percent of Warranty Dollars Recovered1 | Monthly | ✓ |
Source:City of Tucson Transit System Management Services 2019, Sun Tran 2022b, and the transit agency survey for this study.
Note:1As part of total dollars repaired for vehicles under warranty.
Table 53. Sun Tran maintenance performance measures with incentives or penalties.
| Performance Measure | Performance Standard | Incentive or Penalty Details |
|---|---|---|
| Revenue Miles between Road Calls | 11,000 to 13,000 | Progressive incentive or penalty from +$500 to -$500 (see Table F-5 in Appendix F) |
| PM On-Time Performance | 90 to 95% | Progressive incentive or penalty from +$500 to -$500 (see Table F-6 in Appendix F) |
Source:City of Tucson Transit System Management Services 2019.
incentives and penalties for the maintenance performance measures are based on the management portion of the contract budget, not on the overall Sun Tran budget. The contract stipulates that all reported data must be accurate, but there are no associated incentives or penalties for the accuracy of data.
Challenges, Notable Practices, and Lessons Learned
Challenges.
City staff reported the following challenges related to contracting out fixed route bus operations and maintenance:
- Operator recruitment. Sun Tran’s biggest challenge right now is hiring and retaining bus operators. City staff expressed that it is hard to maintain the Sun Tran labor force at the needed levels.
- Complex management and operational structure. The City would like to simplify the management and operational structures of the region’s transit service but doing so would require the transition and potential re-evaluation of many employees and an amendment of the city charter, both of which would be politically unacceptable.
Notable Practices.
The team identified the following notable practices at the City of Tucson.
- Evolving contract language. Over time, the City has learned to include more language about FTA compliance in its transit management contracts.
- Building flexibility into contracts. City staff advises building into transit management contracts the flexibility to make adjustments (for example, including language that allows for negotiating needed contract changes).
- Reducing the number of contractors. The City used different management contractors for different transit modes before 2017. Shifting to a single management contractor improved system efficiency (e.g., by reducing contractor staffing duplication) and reduced City staff’s workload (e.g., by simplifying contractor oversight and coordination).
- Tracking contractor performance. City staff stated that there is no perfect system for contracting out operations and maintenance, but their method is “pretty compliant.” City staff stated that RATP Dev is transparent and has demonstrated that they can deliver service without close supervision, though there are always issues that have to be resolved as they manifest. One metric that City staff use to track if the management contractor is getting better at managing the transit system over time is the accumulation of incentive payments and penalties over the longer term. City staff reports that their incentive and penalty program has been effective in improving service quality and maintenance quality.
Lessons Learned.
The following are some lessons that City staff learned and that may be helpful to other cities or transit agencies:
- Contract detail. City staff advises that, generally, it is better to have more detail in transit management contracts than less. Such details should make it clear what the City’s expectations are and what it takes for transit service to be FTA-compliant.
- Challenges with contract rigidity. There are some cases in which having too much detail can be a problem, however. For example, RATP Dev’s management contract requires RATP Dev to be responsible for Sun Tran information technology, so transferring information technology employees from TTM to the City (as the City wanted to do at one point) was not consistent with the contract.
Summary
The City of Tucson’s decision to contract out transit management, operations, and maintenance was primarily driven by the city charter and secondarily driven by an interest in reducing costs and improving service quality. City staff provides oversight by reviewing detailed monthly reports, conducting audits throughout the year, and participating in frequent communication with the transit management contractor. A notable City practice for assessing the management contractor is tracking the accumulation of incentives versus penalties over time as an indicator of how well the contractor is managing the system. Another practice of note is the City’s decision to use a single contractor to manage and operate fixed route bus service, ADA paratransit service, and streetcar service. Before 2017, the City used different management contractors for the different modes; the City switched to a single management contractor to improve system efficiency.

Escambia County Area Transit (ECAT)
Escambia County Area Transit (ECAT) provides transit service in Escambia County and the City of Pensacola, Florida. The service area has a population of 241,661 and covers 189 square miles (FTA 2020c). ECAT service includes both fixed route bus and demand response. The fixed route bus service is directly operated and consists of 22 bus routes and 3 rubber-tired trolley routes, which mainly operate on weekdays, with select routes operating on weekends (ECAT 2022). ECAT’s beach trolley is seasonal and runs only in the summer. Table 54 displays 2020 operating statistics for ECAT’s fixed route bus service. Escambia County Community Transit is the demand-responsive service for coordinated medical and non-medical transportation, including complementary ADA paratransit (ECAT ADA) and the State of Florida-funded transportation disadvantaged program. All demand response service is outsourced, and the different demand response categories share the same vehicles and dispatching.
The team selected ECAT as a case example under Criteria 1 (switching from outsourcing to insourcing within the last 5 years). ECAT was one of the few agencies surveyed for this study that has recent experience transitioning from outsourcing to direct operation.
ECAT is currently run by the Mass Transit Department of Escambia County, which is governed by the Escambia County Board of County Commissioners. Previously, when all transit services were outsourced, the contracts were administered by two county employees housed within the county Department of Public Works.
Table 54. ECAT 2020 operating statistics for fixed route bus service.
| Statistic | Directly Operated Service |
|---|---|
| Peak Vehicles | 36 |
| Ridership | 921,987 |
| Revenue Hours | 92,384 |
| Revenue Miles | 1,010,188 |
Source:FTA 2020c.
History of Outsourcing
Fixed route bus service was outsourced from ECAT’s inception until the summer of 2017. ECAT went through several contract cycles and different contractors, but the key features remained the same. First Transit was the latest vendor. First Transit had a management contract with Escambia County and was responsible for bus operations and maintenance as well as all support functions (e.g., administration, scheduling, planning, dispatching, and street supervision). As previously noted, Escambia County had two staff members responsible for contract oversight. All other functions were performed by the contractor. The contractor did business as ECAT, but vehicles and facilities belonged to Escambia County. The typical contract duration was 3 years, with an optional 2-year extension. The payment structure was cost-plus, with Escambia County paying the contractor’s costs plus profit/overhead rates. The contract did not have specific performance targets for revenue service or maintenance.
Transition to Direct Operation
In 2017, the Escambia County Board of County Commissioners decided to stop outsourcing and bring fixed route bus operations in-house. This decision was motivated by several concerns about outsourcing, including the following:
- Lack of control over decision-making. With all management functions outsourced, the Board of County Commissioners had limited input. The union director acted as a liaison between the board and ECAT management, but more engagement was desired.
- Cost-effectiveness. The cost-plus payment structure did not incentivize the contractor to control costs. In procurement, the contractor had less buying power than the county and was paying higher unit prices to vendors. In CBA negotiations, the contractor was willing to concede most points to the union since the resulting costs were passed through to the county.
- Short-termism. Contractors tended to focus on short-term goals within the current contract duration and ignore long-term issues. For example, contractors were willing to apply for grants but were primarily interested in getting funds for operations and not for capital investment such as vehicle replacement or facility repairs. At the time of transition, the vehicles were outdated and beyond their useful life, and a building had suffered storm damage in 2014 and had outstanding maintenance needs.
When the decision to stop outsourcing was made, the management contract was allowed to expire and was not renewed or re-procured. The Board of County Commissioners and County Administrator initially considered setting up a transit authority to take over ECAT but eventually decided to create a full county department for Mass Transit. The transition period from management company to county department was short: approximately 30 days. Because the transition period was so short, the initial stand-up of the department prioritized continuity. A general manager from First Transit was brought on as the Director of Mass Transit, and all operational employees were absorbed from the contractor. There were 64 bus operators at the time of transfer. The CBA and memoranda of understanding between the union and First Transit were also absorbed by the new county department. Bus service was never paused during the transition.
Experience with Direct Operation
Running ECAT as a county department has come with both challenges and benefits.
The main challenges have been a loss of institutional knowledge, differences in procedural requirements, and management by crisis. While ECAT retained local staff, much of the data, resources, and information needed to operate transit was left with the management company.
Policies, procedures, databases, bus operator training resources, and central services staff (e.g., transit human resource specialists) were now left to ECAT to develop. Staff turnover after the transition has also contributed to gaps in institutional knowledge.
Another challenge was the differences in the policies and procedures used by the contractor versus those already in place for county departments. As a department of the county, ECAT now had to follow county guidelines and regulations (e.g., procurement procedures). ECAT is still in the process of writing job descriptions and reviewing salary scales and has had to harmonize these with similar positions, such as mechanics, that exist in other county departments. ECAT has also had to work out differences in wages and benefits between First Transit employees and county employees.
Finally, the demands of the transition combined with the effects of the COVID-19 pandemic have put ECAT staff in a position of reacting to existing problems, with little time available for formal training or applying innovation.
ECAT has seen several benefits from moving to direct operation, including improved stakeholder engagement, service quality, internal communications, and employee benefits. The ECAT Director now meets regularly with the Board of County Commissioners and can discuss challenges directly with the board. ECAT has been able to improve its engagement with the communities it serves and works with its stakeholders to improve service. In addition, now that transit is a department of the county, the county has more of a vested interest in the transit service. ECAT has also been able to focus on long-term needs by implementing a vehicle replacement program.
The current director has emphasized transparency and team building, including team building with other county departments. ECAT employees have greater stability as public employees, as well as improved retirement programs and health benefits.
Challenges, Notable Practices, and Lessons Learned
Challenges.
ECAT reported the following challenges related to transitioning from outsourcing to directly operating fixed route bus operations and maintenance:
- Resource availability. Contractors have access to shared resources, such as tools, experience, instructors for training, and contract transition specialists, that a public agency may not have. When the contract ended, those shared resources were no longer available to ECAT.
- Policy differences. Business practices, for example, procurement and disciplinary policies, have had to change to match county policies and procedures as well as rules for public agencies. These differences can take a while to reconcile, but the business of providing transit had to continue, even while policies and procedures are being revised.
- Harmonizing job descriptions and salary. The county absorbed the contractor’s local employees to smooth the transition but has had to harmonize job descriptions and salary scales with other county departments. For example, there was a significant pay gap between bus mechanics and other county mechanics.
Notable Practices.
The team identified the following notable practices at ECAT.
- Stakeholder engagement. Despite a somewhat challenging transition, ECAT is regularly working to improve its image in the community and to work with the Board of County Commissioners to ensure that service is continually improving.
- Dedicated team. The ECAT management team and staff have been able to stand up a working transit department in a short amount of time. Although not without its hiccups, the transition has gone as smoothly as it has because of the hard work and dedication of ECAT and other county staff. ECAT is continually working to build up staff by enhancing competencies, sending employees to training, and working with and across departments.
Lessons Learned.
The following are some lessons that ECAT learned that may be helpful to other transit agencies:
- Transition period. Setting up a new transit department takes significant effort. A 30-day transition period may be achievable for transit contractors who have specialized staff; dedicated central resources; and existing tools, policies, and procedures. A longer period is needed for a public agency starting a brand-new transit department.
- Communication with decision-makers. The transition to insourcing was a decision made by county leadership, and although the decision may have had merit, there was a lack of communication within the county that should have occurred to establish a reasonable transition to insourcing. Having reliable and open lines of communication with decision-makers could have helped Escambia County avoid the unrealistically short transition period or other sudden changes in county policy.
- Transparency. Good communication helps employees and other stakeholders to understand why change is happening and what the ultimate goals are. Without transparency in decision-making, employees may not all be on the same page. The transition from outsourcing to insourcing could have benefited from an analysis with accompanying messaging to help all stakeholders see why insourcing made sense.
Summary
ECAT is an example of an agency that has transitioned from outsourcing fixed route bus operations and maintenance to direct operation. Before the transition, ECAT had outsourced for many years using a management contract and a cost-plus payment structure. Because of concerns about lack of control, poor cost-effectiveness, and short-termism from the contractors, the Board of County Commissioners decided in 2017 to stop outsourcing. ECAT had only a 30-day transition period to stand up a new county department. The new department hired employees from the outgoing contractor and extended existing policies (e.g., the CBA) on an interim basis to keep service operating. ECAT now has several years of experience post-transition and reports that the main challenges of transitioning were losing the contractor’s resources and tools, policy differences between the contractor and the county, and harmonizing job descriptions/salaries with other county departments. Lessons learned included the value of a longer transition period, the importance of open and ongoing communication with decision-makers, and the necessity of transparency in decision-making to help all stakeholders understand why insourcing was necessary and to have time to adjust to in-house operations. Even though the transition has been a challenge, ECAT is satisfied with the results and is happy to have brought services in-house. ECAT staff continue to work through remaining transition issues and are dedicated to growing and developing internal staff while focusing on enhanced service quality for Escambia County.
Summary of Case Examples
Table 55 contains a summary of the performance monitoring, lessons learned, and notable practices from each case example.
Table 55. Summary of case examples.
| Agency | Summary of Contractor Performance Monitoring | Lessons Learned | Notable Practices |
|---|---|---|---|
| NICE Bus |
|
|
|
| MWRTA |
|
|
|
| San Diego MTS |
|
|
|
| Sun Tran |
|
|
|
| ECAT | N/A |
|
|
Legend:
![]() Outsources bus operations.
Outsources bus operations.
![]() Outsources bus maintenance.
Outsources bus maintenance.


