Third-Party Contracts for Fixed-Route Bus Operations and Maintenance: Performance Metrics (2023)
Chapter: Chapter 2 - Background

CHAPTER 2
Background
This chapter provides background information about contracting out bus service, including an analysis of NTD data and a summary of the literature review and industry scan. This chapter is divided into the following sections:
- Contracting Out in the United States, which discusses
- The prevalence of contracting out,
- The nature of contractual relationships, and
- Trends in contracting out.
- Literature Review, which discusses
- Justifications for contracting out or not,
- Strategies for a positive contracting experience, and
- Contractor performance management.
- Summary of Background Study
Contracting Out in the United States
The team downloaded and analyzed 15 years of NTD data for rural, tribal, and urban reporters operating MB service from 2006 to 2020 to answer the following questions:
- What is the prevalence of outsourcing bus service?
- Are there any differences in the prevalence of outsourcing based on agency size or reporter type (i.e., rural versus urban)?
- What is the prevalence of contracting out and directly operating service at the same transit agency?
- Are there any notable trends in the prevalence of outsourcing?
- What are some characteristics of current contractual relationships?
The team segregated transit agencies that contracted out by reporter type (rural versus urban) and by the size of their fixed route bus operation (including both insourced and outsourced services). Both rural and tribal agencies were classified as rural. The team used the number of bus peak vehicles (also called vehicles operated at maximum service, or VOMS) to determine the size category for each transit agency’s bus operation, as follows:
- Small: between 1 and 25 bus peak vehicles
- Medium: between 26 and 75 bus peak vehicles
- Large: 76 or more bus peak vehicles
Prevalence of Contracting Out
Out of the 1,188 transit agencies that reported VOMS data for bus service in 2020, 812 (68%) directly operated their bus services without any outsourcing (see Figure 2). The remaining
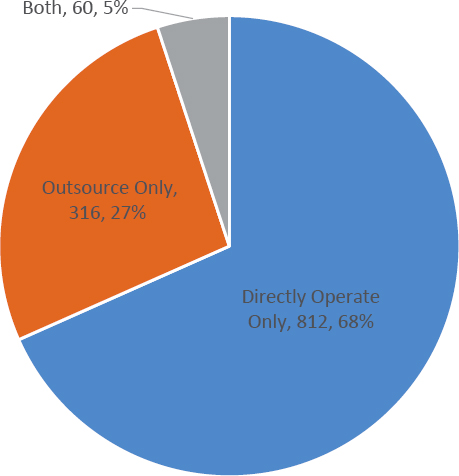
Figure 2. Percentage of transit agencies that directly operate versus outsource their bus service.
376 transit agencies (32%) either outsourced a portion of their bus service (60 transit agencies, 5%) or all of their bus service (316 transit agencies, 27%).
Transit agencies that both directly operated and outsourced their bus service typically outsourced less than half of their bus service (see Table 2).
Table 3 displays the number of outsourcing transit agencies by bus operation size and type. Out of the 376 transit agencies that outsourced bus service in 2020, most (80%) were urban agencies, and most outsourcing transit agencies’ bus operations were small, operating between 1 and 25 peak vehicles (70% of outsourcing agencies).
These 376 transit agencies outsourced 10,653 peak vehicles in 2020. Table 4 displays how those outsourced peak vehicles were distributed by bus operation size and type. As would be expected from a peak vehicles perspective, most outsourced vehicles (60%) are in operation at large urban bus operations, even though large urban bus operations represent only 13% of all outsourcing transit agencies (see Table 3).
Table 2. Amount of outsourced bus service for transit agencies that both directly operated and contracted out.
| % of Contracted Bus Service | Number of Transit Agencies | % of Transit Agencies |
|---|---|---|
| Less than 25% | 43 | 72% |
| Between 25% and 50% | 9 | 15% |
| More than 50% | 8 | 13% |
| Total | 60 | 100% |
Source: NTD 2020, including only agencies reporting VOMS data for MB service and that both outsourced and insourced their bus service.
Table 3. Distribution of transit agencies with outsourced bus services by bus operation size and agency type.
| Transit Agency Bus Operation Size1 | Rural | Urban | Grand Total | |||
|---|---|---|---|---|---|---|
| Count of Agencies | % of Grand Total2 | Count of Agencies | % of Grand Total2 | Count of Agencies | % of Grand Total2 | |
| Small | 75 | 20% | 190 | 51% | 265 | 70% |
| Medium | 1 | 0% | 62 | 16% | 63 | 17% |
| Large | 0 | 0% | 48 | 13% | 48 | 13% |
| Grand Total | 76 | 20% | 300 | 80% | 376 | 100% |
Source: NTD 2020, including only agencies reporting purchased transportation VOMS data in the MB mode.
Note: 1Bus operation size is based on bus peak vehicles: small = 1–25; medium = 26–75; large = 76 or more.
2The percentage of grand total is calculated as the count of agencies divided by 376 transit agencies.
Table 4. Distribution of outsourced bus peak vehicles by bus operation size and agency type.
| Transit Agency Bus Operation Size1 | Rural | Urban | Grand Total | |||
|---|---|---|---|---|---|---|
| Peak Vehicles | % of Grand Total2 | Peak Vehicles | % of Grand Total2 | Peak Vehicles | % of Grand Total2 | |
| Small | 401 | 4% | 1,622 | 15% | 2,023 | 19% |
| Medium | 27 | 0% | 2,187 | 21% | 2,214 | 21% |
| Large | 0 | 0% | 6,416 | 60% | 6,416 | 60% |
| Grand Total | 428 | 4% | 10,225 | 96% | 10,653 | 100% |
Source: NTD 2020, including only agencies reporting VOMS data for outsourced MB service.
Note: 1Bus operation size is based on bus peak vehicles: small = 1–25; medium = 26–75; large = 76 or more.
2The percentage of grand total is calculated as the count of peak vehicles divided by 10,653 peak vehicles.
The next question the team answered was how much bus service, in terms of revenue hours, was outsourced in 2020. Table 5 displays the results; in 2020, 20% of bus service was outsourced, with small- and medium-sized bus operations outsourcing 31 and 32% of their bus service, respectively. Agencies with large bus operations outsourced proportionally less than those with small or medium bus operations, outsourcing 17% of bus service.
Table 6 displays the same data as Table 5; however, the annual revenue hours are disaggregated by bus operation size and type. Rural transit agencies outsourced a smaller proportion of their bus services (12%) than urban transit agencies (21%). Moreover, within the rural and urban groups, transit agencies with small bus operations outsourced a larger proportion of their bus services than those with medium or large bus operations.
Table 5. Percentage of bus service outsourced based on annual revenue hours.
| Transit Agency Bus Operation Size1 | Outsourced Annual Bus Rev. Hours | Total Annual Bus Rev. Hours | % Outsourced Annual Bus Rev. Hours |
|---|---|---|---|
| Small | 5,009,369 | 16,356,908 | 31% |
| Medium | 6,043,863 | 18,859,618 | 32% |
| Large | 20,784,337 | 120,291,143 | 17% |
| Grand Total | 31,837,569 | 155,507,669 | 20% |
Source: NTD 2020, including only agencies reporting VOMS data for MB service.
Note: 1Bus operation size is based on bus peak vehicles: small = 1–25; medium = 26–75; large = 76 or more.
Rev. = revenue.
Table 6. Percentage of bus service outsourced based on annual revenue hours by bus operation size and agency type.
| Transit Agency Bus Operation Size1 | Rural | Urban | ||||
|---|---|---|---|---|---|---|
| Outsourced Annual Bus Rev. Hours | Total Annual Bus Rev. Hours | % Outsourced Annual Bus Rev. Hours | Outsourced Annual Bus Rev. Hours | Total Annual Bus Rev. Hours | % Outsourced Annual Bus Rev. Hours | |
| Small | 622,339 | 4,487,471 | 14% | 4,387,030 | 11,869,437 | 37% |
| Medium | 58,042 | 909,922 | 6% | 5,985,821 | 17,949,696 | 33% |
| Large | 0 | 57,111 | 0% | 20,784,337 | 120,234,032 | 17% |
| Grand Total | 680,381 | 5,454,504 | 12% | 31,157,188 | 150,053,165 | 21% |
Source: NTD 2020, including only agencies reporting VOMS data for MB service.
Note: 1Bus operation size is based on bus peak vehicles: small = 1–25; medium = 26–75; large = 76 or more.
Nature of Contractual Relationships
NTD also asks transit agencies with contractual relationships to report data on those relationships into the Contractual Relationship form (form B-30, which is filled out by full reporters only). In the 2020 contractual relationships data, there were 391 reports of contractual relationships reported by buyers of bus service. (There are more reports of contractual relationships than there are unique transit agencies that reported outsourcing bus service, because transit agencies with multiple contractors must report multiple contractual relationships.) A few key statistics from the contractual relationships data are summarized in Table 7. Appendix A provides definitions of the terms shown in Table 7.
Table 7. Characteristics of contractual relationships for bus service.
| Contractual Relationship Characteristic | Number of Agencies | % of Agencies |
|---|---|---|
| Type of Contract | ||
| Competitively Bid Contract | 334 | 85% |
| Negotiated Contract or Agreement | 57 | 15% |
| Total | 391 | |
| Primary Payment Structure1 | ||
| The Agency Pays the Contractor a Negotiated Fixed Rate Per Unit of Service | 305 | 78% |
| The Agency Reimburses the Contractor’s Net Operating Expenses, Based on an Approved Budget | 86 | 22% |
| Total | 391 | |
| Fares Retained by | ||
| Agency | 249 | 64% |
| Contractor | 142 | 36% |
| Total | 391 | |
| Provision of Capital Assets | ||
| Agency Supplies Vehicles to Contractor | 311 | 80% |
| Agency Provides Maintenance Facility to Contractor | 161 | 41% |
| Other Public Assets Provided | 16 | 4% |
Source: NTD 2020, including only agencies reporting contractual relationships data for MB service as the buyer of service.
Note: 1In the NTD form, this field is labeled “Primary Feature.”

Note: Value labels are only displayed for small operations and for the total to highlight the degree of growth over the 15-year period. Bus operation size is based on bus peak vehicles operated in the given year: small = 1–25; medium = 26–75; large = 76 or more. Agencies’ size classifications could be different in any given year.
Figure 3. Number of transit agencies contracting out bus service, 2006 to 2020.
Trends in Contracting Out
The team examined the number of transit agencies contracting out bus service over the 2006 to 2020 period (see Figure 3). The number of transit agencies contracting out increased over the analysis period, from 174 in 2006 to 376 in 2020 (a 116% increase), with a significant increase in the number of transit agencies outsourcing small bus operations beginning in 2014. The number of transit agencies contracting out medium and large bus operations has remained relatively consistent over the 15-year period.
Although the number of transit agencies contracting out bus service has increased substantially, the proportion of bus service contracted out has decreased at a much slower rate (see Figure 4). In 2020, the percentage of bus revenue hours that were outsourced increased to its highest level—around 20%. Interestingly, the large increase in the number of agencies contracting out small bus operations (seen in Figure 3) does not correspond to a significant increase in the proportion of service that is contracted out within small bus operations. This disparity is because of more agencies beginning to outsource only a small portion of their small bus operations, which adds to the count of outsourcing agencies but does not contribute much to the percentage of service being outsourced.
Literature Review
The literature on contracting transit service is extensive, ranging from very focused analyses of specific cases (e.g., Center for Urban Transportation Research [CUTR] 2002) to studies that attempted to analyze multiple years of NTD data (Iseki 2008). This chapter is not an exhaustive literature review on the subject of contracting out transit service but instead provides a sampling

Note: Value labels are only displayed for the total to highlight the consistent overall growth in outsourced revenue hours. Bus operation size is based on bus peak vehicles operated in the given year: small = 1–25; medium = 26–75; large = 76 or more. Agencies’ size classifications could be different in any given year.
Figure 4. Percentage of bus revenue hours contracted out 2006 to 2020.
of existing studies. To align the review with the scope of this project, the team focused the literature review on the following topics:
- Justifications for contracting out or not contracting out
- Strategies for a positive contracting experience
- Contractor performance management
Justifications for Contracting Out or Not
Deciding whether to outsource bus service can require complex analysis and weighing of pros and cons, assuming a transit agency has the legal authority to make the decision on its own. As noted in several sources (e.g., Iseki 2008), contracting out transit services became more common in the 1980s as a strategy to improve efficiency and reduce the cost of transit services. The team’s analysis of 2020 NTD data found that approximately 32% of transit agencies operating local fixed route bus service outsource at least some of their service (see Figure 2). Beyond fixed route bus service, contracting out at least some portion or mode of service is common, estimated to be a practice employed by 61% of U.S. transit agencies (United States Government Accountability Office [GAO] 2013).
Evidence for the perceived positive outcomes of outsourcing abounds. Boyle (2018) found that 58% of transit agencies responding to an industry survey reported their contracting efforts to be “very successful.” The Transportation Research Board (Committee for a Study of Contracting Out Transit Services 2001) found in its survey of more than 500 public transit agencies that nearly 80% of the managers that contracted out would do so again, given their positive experiences. The eight transit systems (four in North America and four internationally) in a 2021 study by the International Association of Public Transport (UITP) all reported seeing benefits from contracting out their services (UITP 2021).
However, quantitative data to determine whether contracting out is better than operating service in-house are difficult to come by—particularly because what constitutes “better” is often different from agency to agency. In addition, the cost savings of contracting out may come with trade-offs in service quality or customer satisfaction. Whether contracting out is right for any given transit agency will depend on several factors, some of which may be beyond traditional cost-driven analyses.
Justifications for Contracting Out.
The literature suggests that there are several potential reasons that transit agencies contract out, including
- Improved cost efficiency,
- Increased flexibility,
- Access to contractor expertise, and
- Historical, political, or legal reasons.
Each of these potential reasons is discussed in more detail below; however, readers are reminded that the findings of previous studies do not guarantee the same results in all situations. Potential benefits and justifications in support of contracting out are just that—potential—and actual outcomes will depend significantly on local contextual factors.
-
Cost efficiency. One potential benefit of outsourcing repeatedly mentioned in existing studies is lower operational costs and increased cost efficiency. The GAO (2013) report, which surveyed 463 transit agencies, cites “reducing costs and improving efficiency” (p. 8) as the most frequently cited consideration for agencies deciding to contract out services. Similarly, other studies, including Committee for a Study of Contracting Out Transit Services (2001); Frick, Taylor, and Wachs (2008); Reich and Davis (2011); Davis and Reich (2013); Boyle (2018); and Watson and Freeman (2019), all found cost savings or increased efficiency to be one of the main reasons that transit agencies outsourced services. However, many of the aforementioned studies were based on self-reports from managers at transit agencies that were already contracting out. In some of the same studies, managers at agencies that did not outsource their services reported they insourced because contracting out did not or would not result in cost savings (e.g., Committee for a Study of Contracting Out Transit Services 2001, Davis and Reich 2013, and GAO 2013).
Some studies have attempted to quantify the savings of contracting out by either analyzing NTD data or by analyzing the data from regions, states, or individual agencies (e.g., Iseki 2008 and Iseki 2010), with some mixed results. Often, definite improvements in cost efficiency could be seen at agencies that outsourced, but factors such as agency size, amount of service contracted out, and the nature of contracted service all play a role. UITP (2021) reported that LA Metro saw significant cost savings in its contracted operations, which cost between $95 and $105 per hour, while directly operated services cost between $130 and $140 per hour. Reich and Davis (2011) analyzed transit agencies in Florida and found that statewide, the cost per revenue hour for outsourced service ($54.27) was significantly lower than the cost per revenue hour for directly operated service ($98.10). However, Reich and Davis also found significant variation in the cost differences regionally and across transit agencies.
Although largely perceived as a benefit of contracting out, lower costs might also come with trade-offs. For example, the lower cost of outsourced service is typically made possible by the lower wages and benefits of the contractor’s employees—especially operators (Songju 2005; Frick, Taylor, and Wachs 2008). Contractors may also use more part-time employees (GAO 2013). Although lower wages and benefits can help reduce costs, there is a risk of higher employee turnover, more difficulty filling open positions, and decreased customer service.
- Flexibility. Another potential benefit of outsourcing repeatedly mentioned in the literature is increased flexibility (Frick, Taylor, and Wachs 2008; Davis and Reich 2013; Boyle 2018). When transit agencies outsource bus service, they can more easily start up new services (GAO 2013,
- Contractor expertise. Although this potential benefit may not apply to all outsourcing arrangements, transit agencies that outsource their bus service to larger, more mature companies also have the benefit of access to the extensive experience and network of the contractor (Davis and Reich 2013, Boyle 2018, Watson and Freeman 2019). Contractors often have established best practices, tools, and libraries that can be accessed and leveraged to solve local challenges and improve service.
- Historical, political, or legal reasons. In some cases, outsourcing may be done primarily for historical or political reasons, including statutory requirements. For example, in Massachusetts, Chapter 161A or 161B of General Laws, Part 1, Title XXII, prohibit regional transit authorities in the state from directly operating service (excluding the Massachusetts Bay Transportation Authority). In other cases, a public entity may choose to outsource service to a private company to preserve the bargaining rights of transit employees. In still other cases, outsourcing service is simply “how it’s always been done,” and, now, with years of past practice, there is no convincing reason to abandon outsourcing and go through the process of bringing services in-house. The most common reason that survey respondents gave for beginning to outsource and continuing to outsource is historical, political, or legal reasons (see Chapter 3).
Watson and Freeman 2019) and minimize the agency’s risk associated with trying out new or special services (Reich and Davis 2011) by avoiding the costs associated with service start-up and discontinuation.
Justifications for Not Contracting Out.
The literature also suggests that there are several potential reasons why transit agencies may not want to pursue or continue contracting out, including
- A lack of direct control over the service,
- Poor contractor performance, and
- Intensive contract administration.
Each of these potential reasons is discussed in more detail below; however, readers are reminded that the findings of previous studies do not guarantee the same results in all situations. Potential justifications in support of insourcing are just that—potential—and actual outcomes will depend significantly on local contextual factors.
- Lack of direct control. Several studies have found that one of the main reasons transit agencies choose not to contract out is the desire to maintain direct control over the service (Committee for a Study of Contracting Out Transit Services 2001, Davis and Reich 2013, GAO 2013, Boyle 2018). When service is contracted out, transit agencies can only indirectly influence service outcomes by collaborating with the contractor and through performance incentives and penalties, if they are contractually available. As such, the desire to maintain control over operations can be a strong deterrent to outsourcing (Reich and Davis 2011, Feigenbaum and Hillman 2020).
- Poor contractor performance. Another potential challenge associated with outsourcing is poor performance by the contractor. Transit agencies can have significant concerns about contractor performance, and these concerns may be cause for transit agencies to avoid outsourcing (Reich and Davis 2011, Boyle 2018). The performance issues could be related to the quality of the transit service (Reich and Davis 2011), the accuracy of the data and information (CUTR 2002), or the performance of customer service (Reich and Davis 2011).
- Intensive contract administration. Another potential challenge when outsourcing is the effort associated with administering the contract. To provide ongoing monitoring of the contractor, transit agencies often create specific departments dedicated solely to contractor oversight (GAO 2013). Additional effort is needed during the procurement phase, requiring labor hours to advertise, evaluate, and award the contract (Reich and Davis 2011). Obviously, the level of effort will be directly influenced by the complexity and scope of the outsourced services; however, even a simple, straightforward contract can require a significant amount of work.
Summary.
Based on the literature reviewed by the team, there are both benefits and challenges associated with contracting out. In some cases, outsourcing may be more cost-efficient, provide greater flexibility, and provide transit agencies with well-qualified contractors that are experts in transit operations and maintenance. On the other hand, outsourcing has also been associated with a lack of direct control over service, poor contractor performance, and intensive contract administration. Outsourcing is not a “magic bullet” that saves money while solving all service quality issues. Instead, outsourcing is a tool available to transit agencies that, when used in the right way in the right circumstances, could be beneficial to some transit agencies and their riders. But what is the “right way?” Studies also provide some guidance on what strategies may help increase the likelihood of successful outsourcing.
Strategies for a Positive Contracting Experience
In the team’s review of the literature, a few strategies emerged that appeared to help increase the likelihood of a positive experience when contracting out transit service.
- Consistent agency and contractor interaction. Several studies (as well as the survey results and case examples in this report) indicate that consistent, positive interactions between the transit agency and the contractor are critical to success. In their review of eight U.S. transit agencies, Mendez and Brown (2017) identified that involving contractors in the planning process, even if the contractor is not responsible for planning, can be beneficial and result in better outcomes. Boyle (2018) also found that surveyed transit managers were working to develop a “true partnership” with their contractors. Open and ongoing communication, in the form of ad-hoc conversations and regularly scheduled meetings, can greatly benefit both parties and improve operations (Committee for a Study of Contracting Out Transit Services 2001; Frick, Taylor, and Wachs 2008; Reich and Davis 2011; Lotshaw, Lewis, Bragdon, and Accuardi 2017) and create a productive and dynamic partnership between the transit agency and contractor (UITP 2021).
-
Adequate contractor oversight. Although positive, cooperative interactions are encouraged, transit agencies do need to maintain a significant focus on providing adequate oversight of the contractor. Boyle (2018) reports adequate oversight as a significant challenge for some transit agencies, especially those with limited staff. The GAO report (2013) found that 84% of contracting out agencies used an oversight “team,” a group of staff dedicated to contractor supervision. Transit agencies also need to ensure that contract oversight responsibilities are clearly delineated and that the provisions of the contract are enforceable (Davis and Reich 2013). UITP (2021) reiterates the importance of oversight staff having adequate monitoring tools in place, including both in-person quality checks (e.g., random or periodic on-site inspections) and performance measures and incentives.
Without contractually defined performance measures, there is no common ground to define what is satisfactory or unsatisfactory contractor performance.
-
Performance measures and standards. Performance measures (e.g., on-time performance) and performance standards (i.e., specific numeric goals tied to performance measures) help to ensure that agency goals and contractor goals are aligned. Committee for a Study of Contracting Out Transit Services (2001); Frick, Taylor, and Wachs (2008); and Reich and Davis (2011) all reiterate the importance of closely monitoring contractor performance through clearly defined performance measures.
When performance measures are contractually tied to incentives or penalties, agency goals also get aligned with the contractor’s motive to maximize its profit (Lotshaw, Lewis, Bragdon, and Accuardi 2017). Penalties can have a motivational force and are very common in transit service contracts (Boyle 2018); however, contractors would prefer to see a balance of incentives and penalties. Mendez and Brown (2017) found that incentives, especially those tied to
performance measures, can increase contractors’ motivation and ultimately result in improved service. The closer that incentives or penalties are aligned with measures that directly predict customer satisfaction, the more control transit agencies will have over the quality of the service without having to operate the service directly (Feigenbaum and Hillman 2020).
Jansson and Pyddoke attempted to empirically examine the relationship between incentives and outcomes and has found mixed results (e.g., Jansson and Pyddoke 2010). Jansson and Pyddoke hypothesized that if the investment the contractor must make to achieve the incentive is more than the incentive, or if the incentive or penalty is tied to events outside of the contractor’s direct control, the incentive or penalty is likely to have less effect on performance. Some researchers have attempted complex mathematical models to set the appropriate baselines and incentives to maximize contractor performance (e.g., Sheng, Meng, and Li 2021). A thorough review of the literature by Sheng and Meng (2020) also found mixed results regarding whether incentives are effective at improving service quality.
Contractor Performance Management
There are many different possible levels of activity that transit agencies may engage in related to contractor performance management, as shown in Figure 5. The activities in Figure 5 build on one another. Transit agencies must first have clearly defined performance measures (e.g., on-time performance) and regularly calculate the measures’ values—usually in the form of a weekly or monthly performance report. However, measurement alone is usually not enough to change performance. At the very minimum, monitoring is required. Monitoring is when transit agencies regularly review performance data (and hopefully) discuss performance with the contractor with an end toward solving problems and improving performance. However, without explicit standards, the transit agency and contractor may have different expectations about what is good or poor performance. Finally, even if the transit agency and contractor have the same standards for performance, there may be reasons that contractors find meeting a performance standard too cumbersome or difficult. Therefore, performance incentives or penalties can be tied to standards so that there is a financial motivation for the contractor to attempt to achieve the standard. Penalties are sometimes referred to as liquidated damages
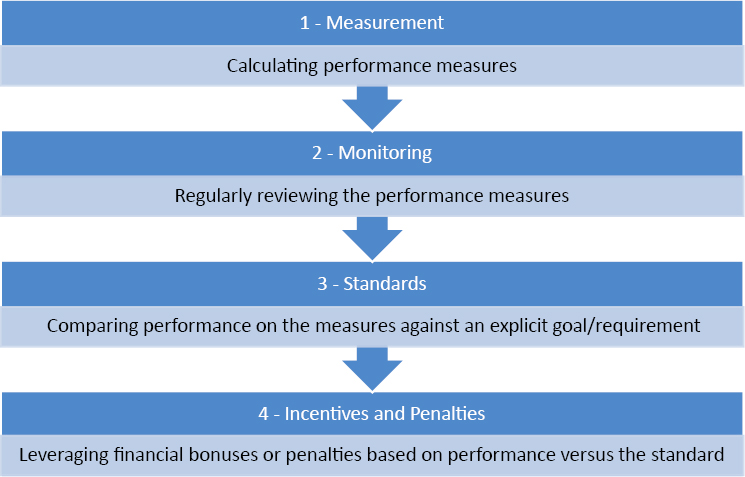
(LDs) and may not only be tied to a performance measure but also to the occurrence of specific incidents. For example, a contract could levy an LD for every occurrence of an operator not wearing the proper uniform.
As important as contractor performance management is, guidance is limited regarding what measures are the most important to track, how to define them, and what incentives or penalties are most appropriate. There are very few concrete examples of contractor performance measures, penalties, and incentives available to learn from. A review of contracting practices in five states uncovered a few examples of LDs in place at three transit agencies (Davis and Reich 2013). UITP’s case studies (2021) also resulted in a list of performance measures used to monitor contractors’ performance at several transit agencies. Appendix B contains excerpts from these two studies. Common themes between both studies included penalties and/or incentives associated with
- On-time performance,
- Missed trips or missed pull-outs,
- Vehicle cleanliness,
- Accidents, and
- Vehicle maintenance issues.
Summary of Background Study
The prevalence of outsourcing fixed route bus service appears to be increasing over time. The number of transit agencies outsourcing small bus operations has doubled in the last 15 years. However, the growth in the percentage of bus service being outsourced (in terms of revenue hours) is growing slowly, up to about 20% as of 2020.
Based on NTD data from full reporters, most contracts are competitively bid and use a fixed fee per unit of service payment structure. Although vehicles are most commonly provided by transit agencies to be used by the contractor, it was more common for contractors to provide their own maintenance facilities than to use the facilities provided by the transit agency.
There are several potential justifications transit agencies might use to decide to outsource, including improved cost efficiency, increased flexibility, access to the contractor’s extensive expertise and resources, and historical, political, or legal reasons. However, the evidence on these justifications is mixed—suggesting that achieving specific benefits from contracting out depends largely on local, agency-specific factors.
Overall, the study team found a dearth of information to help guide the decision-making process for selecting performance measures for contracted bus service, lending evidence to the need for this synthesis study.


