Launching Lifelong Health by Improving Health Care for Children, Youth, and Families (2024)
Chapter: 6 Insurance and Other Financing for Clinical Services
6
Insurance and Other Financing for Clinical Services
Long-term fiscal effects of Medicaid spending on children could offset half or more of the program’s initial outlays.
—Congressional Budget Office1
As discussed in prior chapters, children’s health care includes proactive care designed to prevent disease and promote health, as well as medical care designed to screen, diagnose, and treat health conditions. The former is often referred to as “primary prevention” and the latter as “secondary prevention” (identifying conditions as soon as possible); “tertiary prevention” is managing and minimizing consequences of worsening conditions. The nation’s investment in children’s health care, from primary to tertiary prevention, is financed through multiple and interweaving funding streams; a central example is commercial and public health insurance. Another stream occurs outside of the insurance mechanism through the federal grant-in-aid system for community and state initiatives related to child health.2 See Table 6-1 for an overview of federal investment in children’s health through insurance, health clinics, population health initiatives, and school-based services.
Federal funding for all health care programs in the United States leans heavily on insurance mechanisms. Funding for Medicare, Medicaid, and other health insurance assistance was $1.7 trillion in 2022, whereas other health-related expenditures totaled $242 billion, excluding U.S. Department
___________________
2The grant-in-aid system of federal support to states and communities includes several types of mechanisms, such as categorical grants, block grants, and general revenue sharing (Congressional Research Service, 2019).
TABLE 6-1 Major Federal Investments Addressing Children and Youth Health and Wellbeing
| Program | Federal Agency | Appropriation, in billions | Fiscal Year | % to Children and Mothers |
|---|---|---|---|---|
| Insurance Mechanisms and Clinical Care Services (discussed in this chapter) | ||||
| Medicaid | CMS/HHS | $699 | 2021 | 15.2% |
| Children’s Health Insurance Program | CMS/HHS | $15.8 | 2021 | 100% |
| Tax subsidies for employer-sponsored health insurance | ~$299 | 2022 | ||
| Community health centers (federally qualified health center/rural health clinic/look-alike) | HRSA/HHS | $5.6 | 2022 | 12% |
| Certified community behavioral health clinics | SAMHSA/HHS | $0.3 | 2022 | 27% (upper limit) |
| School-based health centers | HRSA/HHS | $0.03 | 2023 | 100% |
| CMS/HHS | $0.05 | 2024 | ||
| Indian Health Service | IHS/HHS | $6.96 | 2023 | NA |
| Public Health Initiatives (Child Care, Maternal and Early Child Health Care, Vaccines, Nutrition, Mental Health (treatment for stress, trauma, substance use disorder) (discussed in Chapter 7) | ||||
| Child care and development block grant | ACF/HHS | $5.9 | 2022 | 100% |
| Head Start (HS), Early HS, American Indian/Alaska Native HS, Migrant Worker HS | ACF/HHS | $11 | 2022 | 100% |
| Vaccines for children | CDC/HHS | $5.5 | 2022 | 100% |
| National Center on Birth Defects and Developmental Disabilities | CDC/HHS | $0.2 | 2022 | 100% |
| Preventive Health and Health Services Block Grant | CDC/HHS | $0.1 | 2020 | ~29% |
| Racial and Ethnic Approaches to Community Health | CDC/HHS | $0.04 | 2022 | NA |
| Good Health and Wellness in Indian Country | CDC/HHS | $0.04 | 2022 | NA |
| Maternal and Child Health Block Grant (Title V) | HRSA/HHS | $0.7 | 2022 | NA |
| Maternal, Infant, and Early Childhood Home Visiting | HRSA/HHS | $0.2 | 2022 | NA |
| National Child Traumatic Stress Initiative | SAMHSA/HHS | $0.08 | 2022 | 100% |
| Program | Federal Agency | Appropriation, in billions | Fiscal Year | % to Children and Mothers |
|---|---|---|---|---|
| Residential Treatment for Pregnant and Postpartum Women | SAMHSA/HHS | $0.03 | 2022 | 100% |
| Project LAUNCH (Linking Actions for Unmet Needs in Children’s Health) | SAMHSA/HHS | $0.02 | 2022 | 100% |
| Tribal Behavioral Health Grants | SAMHSA/HHS | $0.02 | 2022 | NA |
| Infant and Early Childhood Mental Health Grants | SAMHSA/HHS | $0.01 | 2022 | 100% |
| Supplemental Nutrition Assistance Program | FNS/USDA | $120 | 2022 | 44% |
| Special Supplemental Nutrition Program for Women, Infants, and Children | FNS/USDA | $6.9 | 2022 | 100% |
| School-Based Services (health promotion, nutrition, management of chronic conditions) (discussed in Chapter 8) | ||||
| Healthy Schools Initiative | CDC/HHS | $0.02 | 2022 | 100% |
| National School Lunch & Breakfast programs | FNS/USDA | $26.9 | 2022 | 100% |
| Child and Adult Care Food Program | FNS/USDA | $3.9 | 2022 | High |
NOTES: This table lists major federal investments; many other, smaller programs also invest in child and youth health and wellbeing. ACF = Administration for Children and Families; CDC = Centers for Disease Control and Prevention; CMS = Centers for Medicare & Medicaid Services; FNS = Food and Nutrition Service; HHS = U.S. Department of Health and Human Services; HRSA = Health Resources and Services Administration; IHS = Indian Health Service; NA = not available or not applicable; SAMHSA = Substance Abuse and Mental Health Services Administration; USDA = U.S. Department of Agriculture.
SOURCE: Generated by the committee.
of Defense (DoD) and U.S. Department of Veterans Affairs (VA) Medical Care.3 Another $287 billion in federal support goes to employer-sponsored health insurance through tax subsidies (Congressional Budget Office [CBO], 2019). This heavy reliance on insurance as a funding stream impacts how care is organized by valuing disease-focused medical services (delivered one-to-one) over universal or wellness-focused prevention services (delivered
___________________
3Per the Office of Management and Budget (n.d.), Table 15.1, “Outlays for Health Programs: 1962–2028 (in billions)”: Medicare ($905.6), Medicaid ($591.9), Federal Employees Health Benefits Program ($61.0), health insurance assistance ($79.5), other health ($24.02); excludes DoD ($55.4) and VA ($110.7).
one-to-many), which traditionally do not fit well into insurance models. Over the past four decades, the United States significantly expanded its investments in child health care through the health insurance financing mechanism to provide insurance coverage to all children. By 2015, health insurance coverage for children had stabilized at 95% in 2021 (Keisler-Starkey & Bunch, 2022; Census Bureau, 2021), although the pandemic increased coverage slightly, followed by the recent “unwinding” of Medicaid eligibility with the end of the pandemic public health emergency that reduced rates of children’s coverage.4 This coverage is a major policy success for children, yet the overall picture in the nation masks areas and populations with larger uninsured rates, such as children in the South (6.8%) and in states that have not expanded Medicaid (8.1%), as well as Hispanic children (9.5%) and children who are foreign born (22.6%) (see Figure 4 in Census Bureau, 2023b).
Changes to insurance coverage and financing are more likely to impact disease-focused than wellness-focused services. The share of spending through insurance as opposed to other funding streams varies depending on the type of care—primary, secondary, or tertiary prevention. The majority of secondary and tertiary prevention is delivered through the health care system and financed through insurance. By contrast, primary preventive health care can be delivered through the health care system and financed through insurance, but it is also delivered outside of the health care system and paid for with federal grants-in-aid.
The terms “clinical primary prevention” and “community-” or “population-based primary prevention” highlight the distinction in the delivery and financing of primary preventive care (Institute of Medicine [IOM], 2010). Clinical primary prevention usually involves services that are delivered one-to-one in a medical office setting by health care professionals and are covered by insurance and/or out-of-pocket payments by those receiving the services. Community-based primary preventive health care services can be provided one-to-one or one-to-many—such as a teacher providing socioemotional learning to a class of students, a community health worker providing multigenerational care to a family unit, or a community program or intervention sponsored by a local health department—and often involve health care delivered by nonmedical professionals, such as community health workers, peers, teachers, and other community members (Cuellar & Calonge, 2022). As discussed in Chapter 7, financial support for community-level services comes from federal grants, in addition to local and state
___________________
4Insurance coverage for children was 0.6% higher in 2021 than in 2020 because of congressional efforts to retain access to insurance during the COVID-19 pandemic (Mykyta, Keisler-Starkey, & Bunch, 2022). With the unwinding, coverage has returned to prepandemic levels.
funding mechanisms. These definitional boundaries are soft, the actors can overlap, and the multiplicity of actors and types of activities speaks to the importance of coordination and communication across clinical and community services.
The long horizon of some investments in children’s health has implications for framing strategies for federal budgeting and fund allocation across competing priorities. In scoring the fiscal impact of federal legislation, CBO has generally considered savings within only a 10-year projection period based on its statutory requirements. This long-standing approach leads to undervaluing longer-term investments and disproportionately impacts fiscal calculations around prevention in general and child health investments in particular (Ash et al., 2023; CBO, 2020). CBO can score legislation across multiple budgets, not limited to health care, and doing so could improve results for Medicaid and other investments. Lack of CBO outlays by age group also hampers assessment of investments and returns for children.
At the national level, spending on primary prevention is aimed at protecting against poor future health states among the nation’s population and their attendant costs. While not all health conditions are preventable, many have modifiable risk factors. Health care costs associated with such conditions are substantial. For example, a recent Lancet analysis estimated that in 2016, U.S. health care spending attributable to modifiable risk factors—including high body mass index, high blood pressure, high glucose, dietary risks, and tobacco use—was $730.4 billion, or 27% of total health care spending. Some of these costs are paid publicly through programs such as Medicare and Medicaid (Bolnick et al., 2020). Another example is mental health disorders, which are among the costliest of health conditions in terms of health care spending (Roehrig, 2016). Moreover, poor mental health in childhood has a range of lasting impacts on later-life outcomes, ranging from educational completion to employment and early death (Currie & Stabile, 2006; Fletcher & Wolfe, 2008, 2009; Goodman, Joyce, & Smith, 2011; Salm & Schunk, 2012; Wang, Frank, & Glied, 2023). Thus, federal spending on primary prevention can be seen as insurance against future costs for both health and nonhealth care (e.g., productivity) that can be attributed to preventable conditions.
This chapter’s discussion of spending on children’s health care focuses on clinical care funded mainly by insurance. Chapter 7 examines the role of investment in child health through population- and community-level primary prevention.5
___________________
5As a practical matter, drawing a line between what spending falls into public health (related to social determinants of children’s health) and what spending can be construed more narrowly as health care spending can be fraught.
HEALTH INSURANCE FOR CHILDREN
Health and medical care provided to children on an individual basis is paid for primarily through health insurance. Today, although some communities continue to have low rates of coverage, in many communities, nearly all children have health insurance coverage, the result of a series of child-related health policies spanning six decades (Cohen, Martinez, & Zammitti, 2015). This policy achievement has removed a major barrier to health care for most children and has positive short- and long-term health and education impacts. Remaining issues with primary insurance for children pertain to those who lack coverage, including undocumented children; intermittent loss of coverage; coverage for parents; access to providers willing to accept insurance, especially for children with Medicaid and for behavioral health and dental care; underinsurance, especially for middle-income children; and limitations of certain provider payment mechanisms.
Importance of Health Insurance for Children
Research has examined whether health insurance coverage improves short- and long-term child outcomes, largely based on expansions in Medicaid (Brown, Kowalski, & Lurie, 2015; Currie & Chorniy, 2021; Hakim, Boben, & Bonney, 2000; IOM, 1998; KFF, 2023b; Meyer & Wherry, 2012; Wherry et al., 2015). For example, a 1998 IOM report, America’s Children: Health Insurance and Access to Care, provided substantial evidence of the value of health insurance for children’s health. Buchmueller, Levy, and Valletta (2019) summarized the literature related to Medicaid expansions for children, concluding that the Medicaid expansions for children increased coverage, net of any reductions in commercial insurance due to crowd-out, and also increased access and utilization of care for children. Other studies found improvements in school achievement (Wehby, 2022). Early studies on Medicaid coverage expansions for pregnant women in the 1980s concluded that the expansions increased enrollment and modestly improved birth outcomes, but showed mixed evidence on prenatal outcomes (Howell, 2001). Improvements were greatest for families with very low incomes (Bellerose, Collin, & Daw, 2022; Currie & Gruber, 1996; Howell, 2001).
More recent studies have assessed the long-term impacts of the Medicaid expansions on children, suggesting that Medicaid plays an important role not only in increasing utilization of health care at young ages, but in improving health outcomes over the long term (Currie, Decker, & Lin, 2008; Miller & Wherry, 2019; Thompson, 2017). Studies have also found that Medicaid eligibility in childhood improves labor market and educational outcomes, including high school and college completion (Brown et al., 2020; Cohodes et al., 2016; Currie & Chorniy, 2021; Groves, 2020; Miller & Wherry, 2019; Wherry et al., 2015). The mechanism by which Medicaid eligibility at young ages drives these
long-term effects is not entirely clear, but candidate explanations include direct impacts of health insurance on health care and improved maternal physical and mental health (Guldi & Hamersma, 2023) and birth outcomes. Indirect explanations could include increased access to treatment for substance use disorder and decreased crime (Wen, Hockenberry, & Cummings, 2017); lower financial strain and stress on mothers or families, including reductions in mother’s employment changes during early childhood; increased connection to other social supports; and decreased rates of poverty (Aizer, Stroud, & Buka, 2016; Currie & Duque, 2019; Currie & Rossin-Slater, 2015; Sommers & Oellerich, 2013; Wherry, Kenney, & Sommers, 2016). As noted above, many of these longer-term impacts are not captured within the time frame in which legislation is proposed and scored in Congress. A recent CBO report modeled how a different approach could take these economic and budgetary gains into account explicitly and thus enable more comprehensive fiscal assessment of proposals to change health insurance for children (Ash et al., 2023).
Overview of Children’s Health Insurance
To clarify the role of health insurance for children, it is important to understand that children’s medical expenditures are, on average, very low (Figure 6-1), even among those with any expense (Figure 6-2), and much lower than for adults. Children under age 5 years who have a medical expense have higher spending than children ages 5–17, in part because of the high cost of some births. At the same time, as Figure 6-3 shows, conditional on having a medical event, the mean cost of a medical event can be very high, even for children.
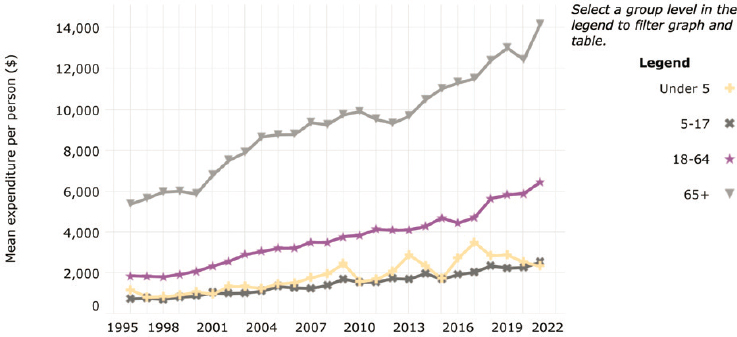
NOTE: Confidence interval is 95%.
SOURCE: AHRQ Medical Expenditure Panel Survey (https://datatools.ahrq.gov/meps-hc).
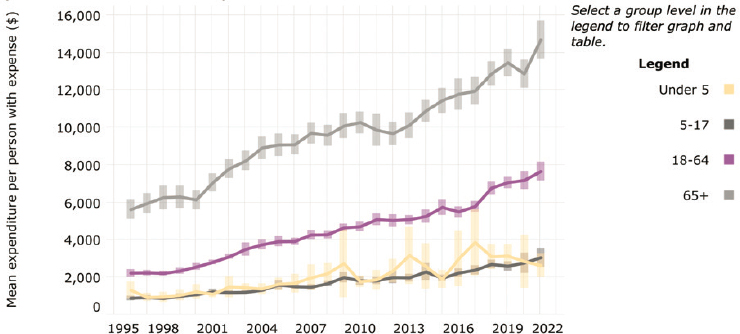
NOTE: Confidence interval is 95%.
SOURCE: AHRQ Medical Expenditure Panel Survey (https://datatools.ahrq.gov/meps-hc).
More than half of children (54.7%) have commercial health insurance through a parent’s employer-sponsored plan. In some cases, employees pay the full premium costs and in other cases employees share the premium costs with their employers; however, employer premium contributions can also be viewed as being paid for by the employee in the form of reduced wages. In general, employers subsidize employee coverage at a higher rate than they subsidize dependent coverage. Employer-provided health insurance is also
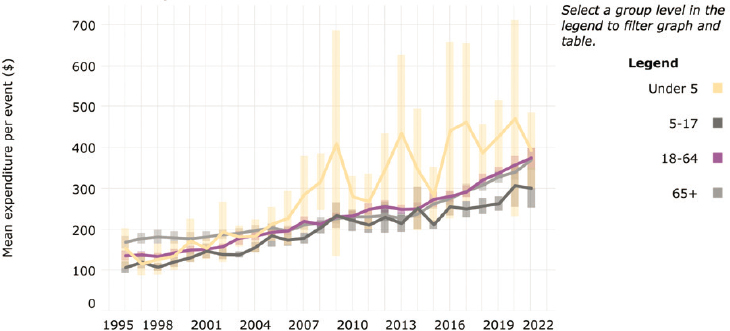
NOTE: Confidence interval is 95%.
SOURCE: AHRQ Medical Expenditure Panel Survey (https://datatools.ahrq.gov/meps-hc).
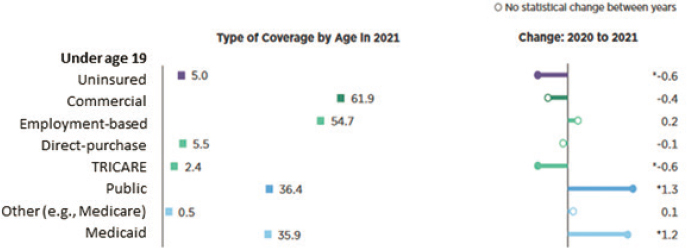
SOURCE: Based on data from the Current Population Survey; Keisler-Starkey & Bunch, 2022.
publicly subsidized through foregone tax revenue because these benefits are not considered taxable income. CBO (2019) and the Joint Committee on Taxation estimate that federal subsidies via tax benefits for employer-covered insurance for all ages totaled $287 billion in 2019, almost as high as the $314 billion in federal subsidies for Medicaid and the Children’s Health Insurance Program (CHIP).6 Another 5.5% of children are covered through direct-purchase commercial insurance (Keisler-Starkey & Bunch, 2022; see Figure 6-4). Since implementation of the Patient Protection and Affordable Care Act (2010), children are eligible for health insurance coverage as a dependent on a family’s plan that is purchased directly from the insurer or through a federal or state health insurance marketplace (e.g., healthcare.gov). Premiums for these plans can be paid for privately by a family or may be subsidized publicly, depending on the family’s income level, and thus combine private and public funding. Since 2019, the share of children with employer-sponsored or direct-purchased coverage has been stable, while Medicaid coverage increased especially during the pandemic (Federal Interagency Forum on Child and Family Statistics, 2023a).
Prior to the COVID-19 pandemic, just over one-third of U.S. children (36.9%) had health insurance coverage through one of two publicly funded health insurance programs: Medicaid, which is targeted to low-income and/or disabled children, and CHIP, created in 1997, which is targeted to children in families with somewhat higher income levels (CMS, n.d.b, 2024f). With the COVID-19 public health emergency and changed Medicaid rules, that percentage rose to over 50% (35.1 million on Medicaid; 4.3 million on CHIP). With the end of the public health emergency and the related “unwinding” of Medicaid coverage, that number decreased by about 3.8 million as of February 2024.7
___________________
6These estimates include children and adults under age 65.
The mix of public and commercial insurance for children is anything but uniform. In 2021, 58.7% of non-Hispanic Black or American Indian/Alaska Native children had public coverage, as did 38.1% of non-Hispanic multiracial children, 53.7% of Hispanic, 28.0% of non-Hispanic Asian children, and 28.1% of non-Hispanic White children (Branch & Conway, 2022). The differences in public and commercial coverage across race and ethnicity likely arise from a combination of factors associated with systemic disadvantage, including income; type of parental employment; immigration policy; and geographic factors, such as living in the South, where few states have expanded Medicaid, or living in states where the marketplace exchange is enrolling potential beneficiaries less actively than other states (Snowden & Graaf, 2023).
Regardless of the funding of an insurance plan (commercial, public, or a combination), the costs of health care services provided are typically shared between the insurance plan and the enrollee through outlays for copayments, deductibles, and noncovered services. However, unlike other insurance products, Medicaid allows almost no copays or deductibles for covered services.
PUBLIC HEALTH INSURANCE FOR CHILDREN
Publicly funded insurance coverage for children has expanded in three major waves, based on families’ income levels and children’s ages. Initially, in 1965, Medicaid coverage was limited to children enrolled in welfare, as well as children who were blind or disabled. The link to public welfare meant that income eligibility was very low—well below the federal poverty level (FPL). From 1980 to 1990, Medicaid expanded incrementally to cover all children under the FPL (National Research Council & IOM, 1998). Under the Balanced Budget Act (1997), the newly established CHIP allowed states to cover children up to age 19 whose parents were working and had incomes above the state Medicaid levels; it also permitted states to collect premiums and copays from enrolled families for coverage. In 2014, the Patient Protection and Affordable Care Act (ACA) created health insurance exchanges through which all individuals under age 65 with family incomes between 100% and 400% FPL became eligible for premium subsidies, and those with incomes below 250% FPL became eligible for reduced cost-sharing. Even though few children have direct-purchased commercial insurance through marketplaces, the broad-based enrollment activities supported by the ACA help both families and their children, with many families learning of their children’s eligibility for Medicaid through the ACA enrollment process. Furthermore, the ACA established a mandatory minimum Medicaid eligibility threshold for children at 133% FPL, regardless of the child’s age group. This shifted older children in some states from CHIP to Medicaid.8
___________________
8Prior to the ACA, the mandatory eligibility levels for children in Medicaid differed by age: States were required to cover children ages 0–5 years in Medicaid with family incomes up to 133% FPL and children ages 6–18 years with family incomes up to 100% FPL (MACPAC, n.d.).
Arguably, the COVID-19 public health emergency created a fourth wave of children’s health insurance coverage by expanding premium subsidies for families with incomes up to 600% FPL and incentivizing state’s continuous coverage for Medicaid and some CHIP programs. The extended Medicaid/CHIP coverage—under which enrolled persons stayed covered unless they voluntarily disenrolled, moved, or died—persisted for 3 years until passage of the Consolidated Appropriations Act (2022). Continuous coverage ended with states resuming eligibility assessments and coverage terminations as early as April 2023 (Wikle & Wagner, 2023). Under the law, states had up to 12 months to return to preemergency eligibility and enrollment operations, resulting in significant administrative chaos and lost coverage for eligible children (Bohra, 2023; Heberlein, 2023). The Consolidated Appropriations Act also requires Medicaid and CHIP to cover children up to age 19 who are enrolled in Medicaid or CHIP for 12 months continuously beginning January 2024 (Daugherty et al., 2024).
Medicaid and CHIP represent federal–state partnerships with joint funding but have different financing formulas. In both cases, the federal government, through the Centers for Medicare & Medicaid Services (CMS), provides the majority share of funds, a share that varies based mainly on the level of poverty in the state; this is called the Federal Medical Assistance Percentage (FMAP), which ranges from 50% to 83% (Medicaid and CHIP Payment and Access Commission [MACPAC], 2023a).9 States pay the remainder and, within federal parameters, they can manage their spending through decisions on eligibility, benefit scope, optional coverage, quality standards, and provider payment. In contrast, state CHIP programs are funded through a capped federal block grant to states, with an FMAP that is always higher than that of Medicaid. The corresponding fiscal commitment by states is also fixed.
Medicaid is an entitlement (i.e., states are required to enroll any eligible applicant). With the CHIP block grant, however, states can refuse enrollment once they reach the end of their grant funding. In contrast to CHIP, Medicaid is countercyclical, requiring more spending during recessions, but also offering greater protection when more individuals lose their jobs and poverty rates are higher. States are required to have balanced budgets, and the countercyclical nature of Medicaid is challenging for state governments, with increased demand and lower revenues in recessions. In the 2001 recession, the Great Recession, and the recent COVID-19 pandemic, Congress appropriated additional federal fiscal relief to state Medicaid programs to ameliorate the budgetary impact of these major economic disruptions (see, respectively, Jobs and Growth Tax Relief Reconciliation Act, 2003; American Recovery and Reinvestment Act, 2009; Families First Coronavirus Response Act, 2020).
___________________
9The FMAP was increased by 6.5 percentage points for 4 years from 2020 through 2023 as part of the federal COVID-19 pandemic response (Families First Coronavirus Response Act, 2020).
Medicaid
From the lens of Medicaid policy making, children are the largest group of Medicaid enrollees (39%), but they account for a smaller proportion of total spending than other groups (16%; Figure 6-5). All states currently offer Medicaid to low-income children. Child coverage is offered in 2 states for family incomes of 138–200% of FPL; in 30 states for 200–300% of FPL; and in 18 states and the District of Columbia for 300–405% of FPL. Some states offer coverage under federal options and others use “waiver authority” to expand coverage or add benefits to selected groups. For example, Michigan covers pregnant women and children up to 400% of FPL under waiver authority; five states have used the federal option to cover children with disabilities up to 300% of FPL (KFF, 2016; Musumeci et al., 2022).
As the major insurers of U.S. children and youth, Medicaid and CHIP provide a broad base of health insurance coverage for large numbers of children who would otherwise lack any health insurance. Children and youth of color are overrepresented among those with Medicaid coverage; thus, problems and progress in Medicaid and CHIP can either exacerbate or address major inequities in care and access (Michener, 2021). Medicaid improves equity by ensuring a strong health insurance base for large numbers of low-income children of color. As noted above, Medicaid coverage has been associated with a wide variety of short- and long-term improved
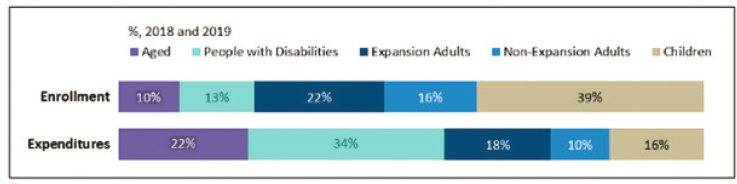
NOTES: The Centers for Medicare & Medicaid Services (CMS) calculated these figures for calendar years 2018 and 2019 using Transformed Medicaid Statistical Information System data to determine the percentage of total Medicaid expenditures accounted for by each beneficiary category; it then applied that percentage to the net total Medicaid expenditures (federal and state) states reported to the Medicaid Budget and Expenditure System using form CMS-64. These national estimates include state-reported data from the 50 states; Washington, DC; Puerto Rico; and the U.S. Virgin Islands. Total net expenditures exclude spending for administrative expenses and Medicaid disproportionate share hospital payments. May not sum to totals due to rounding.
SOURCE: CMS, 2022b; Congressional Research Service, 2023b.
health outcomes, as well as lower health care costs and needs in later life—in these ways, it has improved equity. But Medicaid and CHIP have limitations that make access and care more difficult for many children; thus, they may exacerbate inequities too.
States have several choices or options in designing and implementing their programs. Although they must meet base CMS standards for income eligibility, provider payment, quality measures, and enrollment procedures, they have flexibility beyond these basic standards. State choices lead to major variations in all these items across state lines. Children’s access to services therefore depends on where they live and not so much on what they need. A child in Kansas City, Kansas, may need specialized services for a relatively rare chronic condition available in Kansas City, Missouri—but the Kansas Medicaid program network may not include the Missouri provider in its network, may not include the service among its benefits, and may restrict that child’s access to appropriate services. State variations, coupled with the geographic concentration of certain racialized communities, Black and Hispanic in particular, have led to significant racial inequities in both health insurance coverage and the services received by a Medicaid- or CHIP-enrolled child. States also have different standards of quality measurement, although, as of fall 2024, CMS (2024a) began requiring a minimum common set of child health measures for the states.
About 85% of children covered by Medicaid receive their basic coverage through a comprehensive managed care organization (MCO), rather than the traditional fee-for-service system (MACPAC, 2023a). Through these MCOs, states contract out many Medicaid functions, including elements of enrollment; provider credentialing, networks, reimbursement, and rate setting; quality reporting and monitoring; service authorization and grievance processes; and utilization review, among others. For comparison, 52% of Medicare beneficiaries are enrolled in managed care plans (MedPAC, 2023a,b,c). Unlike most children with Medicaid coverage, all Medicare beneficiaries can choose to stay in the traditional fee-for-service system or enroll in an MCO, where they can select among an average of 41 plan choices (MedPAC, 2023c). Medicaid beneficiaries are less likely to have a choice of plans. In both Medicare and Medicaid, MCOs are paid a fixed monthly amount per enrolled person, although the payment details differ. Medicaid MCOs must provide services in the same “amount, duration and scope” as would be available under Medicaid fee-for-service (Coverage and Authorization of Service, 2024) and may not deny care because of a patient’s diagnosis, type of illness, or condition. Whereas Medicare plans operate largely under uniform national rules set and overseen by CMS, Medicaid rules at the federal level are broader, giving states the flexibility to make key design decisions.
In choosing to privatize major program functions through MCOs, governments must balance giving MCOs the flexibility to innovate and at the
same time ensure efficiency, quality, and access. In the Medicaid managed care program, states fall along a continuum of specificity and flexibility. By law, however, a state’s managed care program must follow federal Medicaid rules and carry out all elements of the state’s approved Medicaid plan.
In some states, the MCO contract becomes a significant vehicle that details expectations and performance provisions and promotes accountability (Rosenbaum & Johnson, 2023). Once a contract is awarded, MCOs have substantial leeway in their interpretation of the federal and state rules. States vary substantially in public inclusion and transparency in developing and reviewing contracts, as well as their strategies and mechanisms for ensuring that MCOs meet their contractual obligations (MACPAC, 2022). Federal regulations require that states have a managed care monitoring system (42 CFR § 438.66), which addresses 14 areas ranging from enrollment to encounter data, provider networks and grievances, among others (State Monitoring Requirements, 2024). Several oversight entities have proposed greater uniformity and transparency in states reporting on key managed care provisions, such as payments and grievances (MACPAC, 2015a, 2022). In general, states and MCOs have provided little evidence regarding how MCOs have met their obligations, and few data exist to determine how well MCOs meet their requirements regarding benefits and coverage for children and youth. New and proposed CMS rules seek to address some of these issues (CMS, 2023d, 2024a; Lopez et al., 2020).
Medicaid Physician Payment Levels and Structures
By law, Medicaid programs should pay providers (physicians, hospitals, and others) sufficiently to produce participation—and ensure that access to care is comparable to that of the general population.10 Other than state affirmation, however, CMS has little documentation of how well states meet this requirement.
Medicaid fee-for-service rates tend to be lower than Medicare rates for similar procedures (Zuckerman, Skopec, & Aarons, 2021; Zuckerman, Williams, & Stockley, 2009). In part, these lower fees have a long history in Medicaid policy (Fein, 2015; Ford & Michener, 2022). In 2019, Medicaid physician fees for 27 common procedures were estimated to be 72% of Medicare physician fees, with the Medicaid-to-Medicare fee index lower for primary care (0.67) than for obstetric care (0.80; Zuckerman, Skopec, & Aarons, 2021). These comparisons have been published sporadically in the research literature (Rosenbaum,
___________________
10See Social Security Act, State Plans for Medical Assistance (2024, § 1396a[a][30][A]): “payments are consistent with efficiency, economy, and quality of care and are sufficient to enlist enough providers so that care and services are available under the plan at least to the extent that such care and services are available to the general population in the geographic area.”
2014; Zuckerman, Skopec, & Aarons, 2021; Zuckerman, Williams, & Stockley, 2009), but the data are not routinely collected and made public by states or CMS. Recent Medicaid access rules require states to compare their Medicaid and Medicare payment rates for specific services, including primary care, obstetrical and gynecological services, and outpatient behavioral health (42 CFR Parts 430, 438, and 457). Notably, however, children’s specialty services are not covered under the proposed rule, nor is there a requirement that the rule be adjusted for volume of care, which would provide a more comprehensive picture of differences in payment rates and service mix, as well as the relative attractiveness of different payers to providers.
Several proposals have been made in the past to benchmark Medicaid-to-Medicare rates (Allen, Golberstein, & Bailey, 2022), in part because of the administrative simplicity of such a proposal. Given that half of children are covered by commercial insurers, a comparison between Medicaid and commercial rates for child-relevant services, such as primary care, obstetric, and specialty care services, would be more relevant to children. Gaps in payment rates for Medicaid versus commercial insurance particularly affect children from racially marginalized and rural communities, as both have high rates of Medicaid insurance coverage. Existing studies have not explored differences between Medicaid fee-for-service and commercial clinician rates, a notable gap in the literature on the child health care system.
A recent review found commercial rates for physician services 118–179% higher than Medicare rates (Lopez et al., 2020; MACPAC, 2015a). The range of estimates likely reflects the differences in the services examined (e.g., procedures vs. evaluation and management), the market power of the insurance plan, the market power of the physician group, the timing of the data (2010–2017 across the studies reviewed), and other geographic differences. Few studies examined rural areas. In a related study pediatric subspecialists seeing many patients with Medicaid insurance reported highly discounted fees (Forrest et al., 2024). These studies, combined with the Medicaid-to-Medicare studies, imply strongly that Medicaid fee-for-service rates for children’s services are also lower than commercial rates.
Most relevant to children’s coverage are rates paid to clinicians by MCOs. Medicaid MCOs, some nonprofit and many for-profit,11 are contracted to state Medicaid agencies to receive capitated payments. They have considerable autonomy in setting provider rates, although many continue enhanced fee-for-service payments for providers, sometimes with end-of-year adjustments for certain performance indicators. Little work documents the adequacy of MCO payments. While states use population-level capitation payments for MCOs, the many providers receiving fee-for-service
___________________
11Five for-profit entities (Centene, Elevance, CVS, United, Molina) control 50% of the MCO Medicaid market, and their profits are quite sizable.
payments from MCOs have limited incentives to improve care or appropriateness. States can impose provider payment schemes on MCOs (Hinton & Raphael, 2023; MACPAC, 2019, 2021a,c) and have demonstrated increasing interest in payment schemes that offer alternatives to fee-for-service payments to address misaligned incentives. Unfortunately, no data explore whether the alternative payment arrangements that MCOs have tested have increased Medicaid payments beyond average fee-for-service levels or improved quality.
The recent CMS access rules require states to submit an annual payment analysis that compares MCO payment rates for routine primary care, obstetrical and gynecological care, and outpatient mental health and substance use disorder services as a proportion of Medicare payment rates. While not required, similar analysis of Medicaid and commercial rates could also be performed. In 2021, Congress passed the Health Care PRICE Transparency Act (2021), making enormous amounts of hospital and insurer price data available to the public. The sheer quantity of data has been part of the challenge, since it is difficult to summarize and process, and, unfortunately, Medicaid MCOs are not included under the transparency mandate, limiting the value of this act for children’s care. The rule offers an alternative for obtaining MCO rates, assuming state reporting is reasonably complete and consistent.
Further complicating payment-rate comparisons is the fact that more than half of states make add-on Medicaid payments to providers outside of the regular payment formula (MACPAC, 2022). These “supplemental” and “directed” payments (discussed below) are captured as lump sums in public reporting and cannot be tied back to individual services in ways that facilitate a rate comparison with another payer (MACPAC, 2022). These additional payments are significant, with supplemental add-on payments accounting for $4 billion (or 33% of total fee-for-service payments to physicians) in fiscal year (FY) 2022 (MACPAC, 2023b), although the state variation here is wide, with Texas providing over half of the national total and California and Florida providing other large amounts. Most states provide relatively little physician and other provider supplemental funding. The total size of supplemental payments, relative to physician payments made by MCOs, is not reported. Also not available is the share of directed payments (totaling $38.5 billion) that are paid by MCOs and go to physicians (Government Accountability Office [GAO], 2023d).
Physician Participation
The central reason for policy concern around provider payment is to ensure that Medicaid programs can enlist enough providers such that their enrollees have access to covered services. By law, beneficiaries’ access should
be the same as for the general population in the same geographic area (Congressional Research Service, 2023a,b), regardless of whether coverage is by fee-for-service, through MCO fee-for-service to clinicians, or through an MCO alternative payment model. However, lower provider participation in Medicaid arises in large part from lower provider payment rates (Hing, Decker, & Jamoom, 2015; Zuckerman, Skopec, & Aarons, 2021), on top of disproportionate administrative burdens imposed by Medicaid programs.
Evidence that Medicaid rates are too low relative to commercial rates is bolstered by findings that providers are less willing to participate in Medicaid or accept new patients than in Medicare or commercial plans (Holgash & Heberlein, 2019; Tang et al., 2018). Clinicians may even misstate their willingness to see Medicaid patients in surveys because they may feel scrutinized (Rankin et al., 2022). “Secret shopper” studies, wherein researchers contact providers posing as patients, corroborate prevalent access problems for Medicaid patients. Across several children’s specialty services, Medicaid patients were less likely to receive appointments than patients with other forms of insurance; furthermore, even when the provider accepted Medicaid patients, their appointment delays were longer (Bisgaier & Rhodes, 2011; Chaudhry et al., 2013; Galbraith et al., 2005). Low payment leads to low revenue which also impacts providers’ ability to sustain innovation in pediatric health care delivery, particularly models focused on health equity. Challenges with MCO provider networks, and how they are monitored to ensure robust provider participation, are discussed at greater length below.
MCOs must meet federal and state provider networks’ adequacy provisions, but these networks also have potentially important gaps. A recent four-state study of Medicaid MCOs found skewed patient loads, with 50% of participating pediatric primary care providers seeing 150 or more Medicaid-enrolled clients per year (Ludomirsky et al., 2022). At the same time, 29% of listed pediatric Medicaid MCO providers saw just 10 or fewer clients, and roughly half of these saw zero clients. Listed providers who see zero patients are sometimes called Medicaid “ghost” providers, and while they are problematic in pediatric primary care, they are also common in adult primary care (15%), particularly in psychiatric care (35%). Low actual participation of providers in an MCO network may indicate that a network meets a state’s requirements on paper but does not provide adequate access in practice.
Low payment rates and low provider participation have generally led to recommendations to increase rates. Payment rate increases could enhance access in several ways: more providers could participate, providers could serve more Medicaid enrollees, or providers could extend visit length. However, the evidence is somewhat mixed on whether historical payment rate increases have been successful. A recent systematic review identifies seven studies of Medicaid fee changes and likelihood of provider participation
(Saulsberry, Seo, & Fung, 2019). Of these seven, five were conducted before 2001 and two examined the effects of the ACA fee increase for primary care physicians, which was relatively modest and temporary. One study found positive effects of fee increases on the probability of participation; one found a slightly negative effect; and three studies found no significant association, including two studies that examined the ACA fee bump. Among the seven studies, six examined Medicaid fee changes and the impact on patients seen per physician. Two studies found positive associations between fees and volumes, including one study of obstetrical care and one of physicians seeing children, and four studies found no significant effects. Unfortunately, the older studies predate large expansions in insurance coverage, and major increases in the consolidation and integration of physicians with hospitals, meaning the results may not apply today. Moreover, these studies examined Medicaid fee increases but did not account for payment increases of the magnitude associated with recent state supplemental payments, which could affect provider participation differently (as was the goal). Few studies address payment rate changes for subspecialty care (see National Academies, 2023e), although several hospital-based subspecialties, especially those with high hospital usage, receive supplemental payments, as discussed below.
Access to Clinicians
Another indicator that provider rates may be too low is consumer-reported access to care. A recent study by Haley and colleagues (2023) used 2016–2019 data from the National Survey of Children’s Health (NSCH) and the 2016–2018 National Health Interview Survey (NHIS) to examine access barriers for children enrolled in Medicaid/CHIP (before the COVID-19 pandemic). These researchers reported that 4.0% of Medicaid/CHIP-enrolled children ages 17 and under had at least one unmet need for medical, dental, vision, hearing, mental health, and/or other services (with dental care the highest at 2.0%); in the NHIS, 8.2% of Medicaid/CHIP-enrolled children ages 2–17 had some sort of need for care being unmet because of cost (most commonly dental care). In the NSCH the most common reasons for not receiving needed care were problems getting appointments (2.0%) and cost (1.9%), comparable to similar barriers reported in the NHIS. In the NHIS 6.6% of parents with children covered by Medicaid/CHIP reported delays in care from appointment waits, compared with 3.6% for commercially insured and 4.4% for uninsured children (Haley et al., 2023, Table 2), with 8.2% of Medicaid-covered children reported to have an unmet need due to cost, compared with 4.8% and 26.6% for commercially insured and uninsured children, respectively.
Haley and colleagues (2023) found that 23% of parents with children covered by Medicaid/CHIP experienced at least some frustration when
trying to get care for the children in the past 12 months, compared with 13% for commercially insured children, and 28% for uninsured children. At the same time, 22% of all children were reported to have no preventive medical visit in the previous 12 months (Haley et al., 2023), with stark variations by race and ethnicity (38.2% for American Indian/Alaska Native children; 32.0% for non-Hispanic Asian children; 21.9% for non-Hispanic Black children, 25.4% for Hispanic children, and 18.4% for non-Hispanic White children). These rates fall well below the American Academy of Pediatrics (AAP)/Bright Futures goal of all children receiving an annual preventive visit and the CMS goal of at least 80% of children receiving such visits (AAP, 2017). Arranging appointments can be frustrating and add to parental stress, and the presence of frustrations and stress may indicate that they lack alternatives. Haley and colleagues (2023) also found that children insured by Medicaid/CHIP had higher rates of access to preventive care than uninsured children but lower rates than commercially insured children.
Early and Periodic Screening, Diagnosis, and Treatment
Medicaid pioneered coverage of preventive services, particularly for comprehensive prenatal care and early and periodic screening, diagnosis, and treatment (Wiley, 2016).12 The statute titled Early and Periodic Screening, Diagnosis, and Treatment (EPSDT, 1968) provides a consistent, national standard for covered benefits, and states are required to use it as the base for children’s benefits. EPSDT’s statutory language refers to coverage of services necessary to “correct or ameliorate” physical or mental health conditions (42 USC § 1396d, 2024)—that is, if screening and diagnosis identify a problem needing services not included in the state’s benefit package, the state must still provide that service for children and youth up to age 21 years (42 USC § 1396d, 2024). Nonetheless, CMS and the states have administered and enforced the EPSDT benefit inconsistently and inequitably. Concerns about the regulatory base of EPSDT and its implementation in the states led to language in the Bipartisan Safer Communities Act (2022) to require CMS to review state implementation of EPSDT. That review is under way, along with calls to modernize EPSDT regulations (Rosenbaum & Johnson, 2023).
The lack of a national definition for “medical necessity” allows states and MCOs flexibility, which has led to many denials of services, especially for children and youth with long-term health care needs and autism spectrum disorder (Baseman & Zettle, 2024; Grimm, 2023). EPSDT provides an important base for the services that children and youth need and has helped
___________________
12For additional information, see https://www.medicaid.gov/medicaid/benefits/early-and-periodic-screening-diagnostic-and-treatment/index.html
many receive services; nonetheless, issues in its implementation have limited access for many. A recent GAO report reviewed MCO prior authorization decisions restricting care and called for additional systematic oversight from the states. Specifically, the GAO asked CMS to provide guidance for whether MCOs can set their own EPSDT medical necessity standards when the state lacks an EPSDT standard (GAO, 2024).
Children and Youth with Chronic Conditions and Special Health Care Needs
Medicaid plays an important role for children with disabilities and special health needs in several respects (Berry et al., 2021). It is the sole form of health insurance for approximately 36% of the total 13.9 million children estimated to have special health care needs, according to 2019 NSCH data (Williams & Musumeci, 2021). Low-income households have disproportionately higher rates of children with special health care needs, in part because parents are less likely to work or more likely to work less, in order to meet their child’s care needs, but also because of the long-term effects of poverty on health and birth weight leading to higher rates of chronic conditions and disability among low-income populations (Kuhlthau & Perrin, 2001; Thyen, Kuhlthau, & Perrin, 1999). Furthermore, the EPSDT benefit requires states to support a broad array of services that commercial insurance often does not cover, especially long-term care services, including institutional and noninstitutional services provided in the home or community, such as attendant care, assistive technology, and case management services (National Academies, 2018), encouraging some families to seek Medicaid coverage for their child with chronic conditions. Thus, while EPSDT applies to all children in Medicaid, it can be particularly important for children with special needs and children in foster care, many of whom also have special health care needs.
While the core Medicaid program supports some long-term services, others are covered through waivers available to states,13 again leading to wide variation among states (Manatt & Phillips, 2022; Williams & Musumeci, 2021). Main waivers that apply to home and community services include 1915c waivers and a specific “Katie Beckett” waiver that is meant to reduce hospitalizations for people under age 19 with disabilities.
Medicaid also supports populations of young children with disabilities through a wraparound program, in which children with commercial
___________________
13An important waiver supports states’ coverage of noninstitutional services for children with disabilities who are under age 19 who without these services would be placed in an institution. This so-called “Katie Beckett” option (Tax Equity and Fiscal Responsibility Act waiver) is available in 49 states and Washington, DC. States can also apply for 1915c waivers, which support home- and community-based services for people with disabilities (not limited to younger populations), and some states include children and youth in their waiver population.
insurance that does not pay for home- and community-based services may receive Medicaid support for those services. As a result, 8% of children with special health care needs nationally have both commercial and wraparound Medicaid coverage, with Medicaid covering long-term services and supports. This proportion varies by state depending on state coverage rules, and children typically must meet a fairly high level of severity to receive such support (Alker et al., 2015; Gusmano & Thompson, 2018; MACPAC, 2018a). Because coverage of long-term services and supports for children is more extensive under Medicaid than with commercial insurance, families with children and youth with special health care needs are more likely to report reasonable out-of-pocket costs, greater benefit adequacy, and greater provider access if they have supplemental Medicaid coverage than if they have commercial coverage only. Nevertheless, families of children with special health care needs with Medicaid coverage more commonly report trouble covering basic needs, including not being able to afford enough to eat, compared with those who have commercial coverage (Williams & Musumeci, 2021).
Children’s Health Insurance Program
As noted earlier, CHIP was created in 1997 to expand coverage of children in low-income families by including eligibility to those below 200% of FPL but above the state Medicaid coverage level. This program permits states to collect premiums and copays from enrolled families for coverage. While Medicaid is an entitlement program with specified income eligibility and spending that reflects changes in enrollment, payment rates, and benefits, CHIP is not. CHIP funding is distributed as block grants to states, each receiving a fixed funding allotment that must be matched with state funds (Schneider, Klukoff, & Lehan, 2023). The matching requirement is lower than that for Medicaid (MACPAC, 2023a,b).14
CHIP is a significantly smaller program than Medicaid. In FY2020, children enrolled in CHIP totaled 9 million, while 35.2 million were enrolled in Medicaid (CMS, n.d.g). Nationally, 89% of CHIP-enrolled children are in families with incomes under 250% of the FPL (MACPAC, n.d.). Because CHIP programs do not have a federally imposed mandatory minimum or maximum income eligibility (other than the state’s Medicaid income base), states vary widely in their CHIP eligibility rules, ranging from 170% FPL in North Dakota to 400% FPL in New York. Under CHIP, states also have the option to cover pregnant women and unborn children (CMS, n.d.a; Social Security Administration [SSA], n.d.).
States choose how to implement CHIP funding. Some states use CHIP to expand Medicaid eligibility levels, while others cover children through
___________________
a separate state CHIP program; still others use a combination of the two approaches. Forty percent (40%) of CHIP-enrolled children are in a state program that is separate from Medicaid (MACPAC, 2020).
When CHIP is structured as a separate program, it can differ greatly from Medicaid, in that (1) states can require copays, (2) EPSDT is not mandated, and (3) states need not enroll eligible applicants if they have already used up the current year funding allotment. Stand-alone CHIP programs must offer “benchmark coverage” that is substantially equal, in actuarial terms, to the health benefits coverage in selected federal or state plans, and they must offer well-child care, dental coverage, behavioral health care, and vaccines (CMS, n.d.h). Many states use Bright Futures recommendations, developed jointly by the Health Resources and Services Administration (HRSA) and AAP (AAP, 2017), as their guide to well-child coverage.
Of the 34 states that operate stand-alone CHIP programs, 27 also contract with MCOs (Schneider, Klukoff, & Lehan, 2023). CHIP MCO contracts are not subject to the Medicaid protections, such as minimum loss ratios, provider network adequacy provisions, transparency requirements, or quality monitoring, unless managed care plans enroll both CHIP and Medicaid enrollees under the same contract (Schneider, Klukoff, & Lehan, 2023).
Commercial Insurance
Most commercial insurance for children is employer based and is funded by premium contributions from employers and individuals. When firms offer health insurance coverage, 77% of workers accept that coverage (KFF, 2021; note that because these data are based on surveys of large and small employers, covered children cannot be examined separately from adults). The employee take-up rates vary by firm size and by workers’ income and age. Most employers (75%) who offer coverage offer just one plan choice. Twenty six percent (26%) of workers were in firms where the single plan was a high-deductible health plan. Larger firms are more likely than small firms to offer two or more health plan options. Overall, 46% of covered workers were enrolled in preferred provider organizations; followed by 28% in high-deductible health plans, which have lower premiums but higher cost-sharing than other plans; and 25% in health maintenance organizations or point-of-service plans, which limit provider choice through narrow provider networks. For young families with limited incomes, high-deductible health plans are attractive—premium costs are low and, in general, preventive services are excluded from cost determinations. Children with chronic conditions, however, are subject to higher out-of-pocket costs in a high-deductible health plan for the same set of services, and families may forgo needed treatment because of costs. For these families, high-deductible health plans may not be a good financial choice (Galbraith et al.,
2009, 2010, 2011; Kullgren et al., 2010; Kusma & Davis, 2021; Larson et al., 2021).
Based on employer surveys, the average annual premium in 2022 was $22,221 for family coverage, compared with $7,739 for single coverage (KFF, 2021). Employees contributed on average 28% of the premium for family coverage and 17% of the premium for single coverage. The premium amount depends on the type of coverage and is lower for plans with tighter provider networks, such as health maintenance organizations, and for plans with high deductibles (Figure 6-6). Premiums are also lower for private than for public firms, firms with more low-wage workers, and firms with many young workers. On average, differences in family premiums across firm size, worker age, low and high incomes, and firm ownership are under 15% (KFF, 2021a). However, the full range of family premiums is wide, with 15% of employers offering family coverage at $16,500 per year and 10% of employers offering family coverage at premiums of $29,000 per year or more (KFF, 2021).
The ACA eliminated out-of-pocket costs for selected preventive clinical services for employer- and exchange-based commercial insurance (Seiler et al., 2014). The specific services identified in the ACA must be offered without any form of cost-sharing (e.g., deductibles, coinsurance,
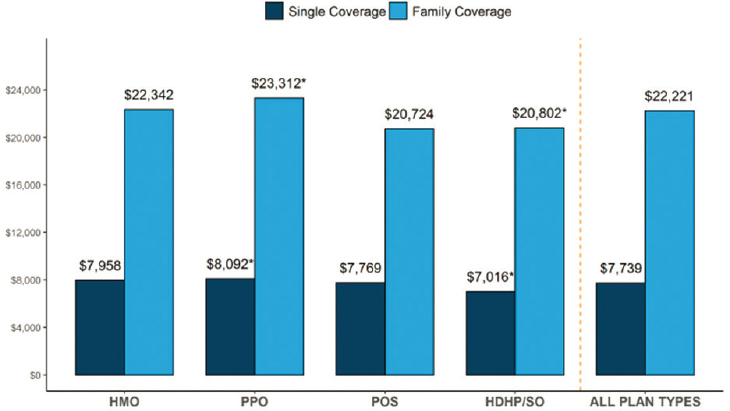
NOTES: *Estimate is statistically different from “all plan types” (p < .05); HDHP/SO = high-deductible health plan/savings option; HMO = health maintenance organization; POS = point of service; PPO = preferred provider organization.
SOURCE: Employer Health Benefits Survey (KFF, 2021).
copayments) and are sometimes referred to as “Section 2713 services” after the relevant paragraph in the Public Health Service Act (Coverage of Preventive Health Services, 2023). They include services with a grade of A or B from the U.S. Preventive Services Task Force; immunizations recommended by the Advisory Committee on Immunization Practices; services recommended for infants, children, and adolescents by Bright Futures; and services for women recommended in the Women’s Preventive Services Guidelines (CMS, 2024a; HRSA, 2024b).
Insurance Coverage for Parents
Adults caring for young children play a critical role in ensuring their children’s access to clinical care. They are responsible, for example, for ensuring their children have health insurance, identifying providers, navigating the health care system, making appointments, transporting children to care, paying for care, and obtaining needed prescription drugs or otherwise following up on a treatment plan. Whether a parent has health insurance is a key factor in children’s access to health care—including whether or not the child is insured (Hamersma, Kim, & Timpe, 2019; Hudson & Moriya, 2017), receives recommended preventive care (Venkataramani, Pollack, & Roberts, 2017), or goes without needed health care (DeVoe, Tillotson, & Wallace, 2009). Furthermore, the health and wellbeing of parents are key elements of support needed by children (see National Academies, 2019e, and earlier chapters in this report). Children raised by healthy parents have better health and outcomes.
Despite the importance of parental insurance coverage for children, an estimated 27.5 million individuals were uninsured in 2021, including 12.2% of adults under age 65 (Tolbert, Drake, & Damico, 2023). For low-income families who live in non-Medicaid expansion states, the median income for Medicaid eligibility is lower than the FPL (Tolbert, Drake, & Damico, 2023). And parents with incomes above the Medicaid eligibility threshold may lack access to premium tax credits for coverage through the Health Insurance Marketplace, which are designed to make that insurance more affordable (Drake et al., 2024). Ensuring access to affordable—and continuous—health insurance coverage for parents is a critical component of transforming the health care system for children. Increased health care coverage of adults increases health care coverage of children.
The 10 states that have yet to adopt the ACA Medicaid expansion (KFF, 2024) as of the writing of this report are predominately in the Southeast region of the country (see Figure 6-7). And in 2021, 44% of low-income Black adults and 37% of low-income Hispanic adults lived in the 12 states that had yet to expand Medicaid at that time (Baumgartner, Collins, & Radley, 2023). These inconsistent Medicaid policies for adults prior to, during, and after pregnancy impact children and child health even before conception and well after delivery.
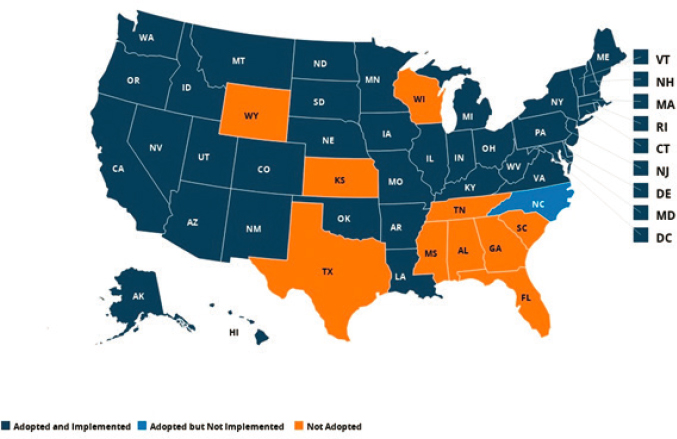
SOURCE: KFF, 2024.
Direct Clinical Services Support
Community Health Centers
First launched in 1965 as “neighborhood health centers,” the goal of community health centers is to improve the health and lives of Americans regardless of their ability to pay for medical services. Funding for these centers is determined annually by Congress and is discretionary. Community health centers receive funding through insurance-enhanced payment and funds administered through HRSA to provide additional resources for capital expenditures, training, and other support. In addition, they receive funding from Title X for family planning services and revenue from public and commercial payers, as well as through a sliding scale for out-of-pocket payments established by a board of directors (National Academies, 2021b). Community health centers (which include federally qualified health centers [FQHCs], rural health clinics, school-based health clinics, migrant health centers, health centers for residents of public housing, and look-alikes15) have consistently received bipartisan support and expanded significantly since 2010, more than doubling their number of locations and removing
___________________
15“Look-alikes” is a term used by HRSA. Health center program look-alikes are HRSA-designated health centers that provide comprehensive, culturally competent, high-quality primary health care services while meeting all health center program requirements, but they do not receive federal award funding (HRSA, 2023e).
barriers to care in many communities (Behr et al., 2022; HRSA, 2023e). However, not all communities have experienced increased access to community health centers equally; studies show that recent expansions were less likely to occur in rural areas or areas of high poverty (Chang, Bynum, & Lurie, 2019; Varshney, 2022).
As noted in Chapter 5, community health centers provide a comprehensive array of services to predominantly low-income populations who are uninsured or have Medicaid insurance. In 2021, community health centers served about 33% of individuals living in poverty and 20% of individuals living in rural areas (National Association of Community Health Centers [NACHC], 2022); FQHCs served more than 30 million patients, including about 12% of all children in the United States (NACHC, 2022).
Medicaid uses a prospective payment system for FQHCs rather than a fixed per-visit rate, as is common in fee-for-service systems. Rates are based on various indicators of center costs and prevailing health center rates in the area. Centers can achieve higher payment rates when they increase staff—for example, adding mental and behavioral health practitioners. The additional costs are then included in the negotiated rates for the prospective payment. States may use alternative payment models other than the prospective payment system for their contracts with FQHCs, but only if the resulting payment will be at least as high as it would be in the prospective payment system. Although usually not labeled as an alternative payment model, the prospective payment system has the advantage of supporting practice transformation with movement to teams for clinical care. The growth of managed care has also affected the payment arrangements for FQHCs, with many MCOs not following the prospective payment system rules of Medicaid.
Notably, FQHC governing boards are required to be composed of at least 51% of people who live in the communities served by the center and reflect the demographic characteristics of its population, making them uniquely community oriented. Community health centers must also complete a community needs assessment every 3 years, make and maintain relationships with other clinicians in their catchment to help coordinate care outside their center, and annually assess the geographic boundaries of their patient population. These centers must provide service to everyone regardless of their ability to pay.
Community health centers offer several important advantages and improved outcomes over traditional delivery systems for some populations with previously limited access (Heisler, 2017; Rieselbach et al., 2019). FQHCs offer transportation, translation, and case management services in addition to on-site care and referral to specialty care. These services help decrease disparities in access and outcome by race and ethnicity, and income and insurance status (Topmiller et al., 2023). HRSA-funded health
center members who utilize enabling services such as transportation or translation are more likely to get routine checkups, receive primary care, and report higher patient satisfaction than those who do not utilize such services. Overall, FQHC members have fewer hospitalizations than comparable populations, and FQHCs spend less on inpatient and specialty care while outperforming other delivery systems across measures of quality and outcomes, cost-effectiveness, and patient satisfaction (National Academies, 2021b). In caring for children, community health centers save 35% in emergency services, prescription drugs, and ambulatory care, compared with other types of providers (Bruen & Ku, 2017). Mothers receiving care at FQHCs, despite tending to be more at-risk individuals, are less likely to have an infant with a low birth weight compared with national averages across racial/ethnic groups (NACHC, 2020). For children, integrated behavioral and primary care at FQHCs improves detection and treatment of behavioral health conditions, such as attention deficit hyperactivity disorder (ADHD; Sheldrick et al., 2022). Communities with a new FQHC have had an associated 5% drop in teen birth rates, with declines largest among Black teens and in counties with more than one FQHC (Farid, 2020).
The community health center model has been successful in meeting primary preventive care needs, but its growth (serving 24% more individuals from 2015 to 2021) has not kept pace with community needs (the number of individuals without a usual source of primary care has doubled since 2014; NACHC, 2023b). Some challenges in expanding the model relate to workforce shortages and financing. Although community health centers provide services nationally for roughly 16% of Medicaid recipients, they receive less than 2% of Medicaid payments (National Academies, 2021b). Moreover, their funding has not kept pace with medical care inflation (Brill, 2023).
Certified Community Behavioral Health Clinics
The Community Mental Health Act (1963) established community mental health centers across the United States. However, initial efforts resulted in a fragmented system that did not meet community needs (National Academies, 2024a). The certified community behavioral health clinic (CCBHC) model—administered by the Substance Abuse and Mental Health Services Administration (SAMHSA) in partnership with the Office of the Assistant Secretary for Planning and Evaluation (ASPE) and CMS—has evolved to provide coordinated, comprehensive behavioral health care based on community needs assessments. CCBHCs have been designed for mental health and substance use disorders to reach individuals across the lifespan with developmentally appropriate care. They are required to serve anyone who requests care, regardless of their ability to pay, place of
residence, or age. CCBHCs must meet standards for the range of services they provide, including those for screening, family-centered treatment, and peer- and family-support services, and they are required to get people into care quickly. Such features include 24/7 access to crisis services, mobile crisis response within 3 hours, urgent noncrisis need seen within a day, and routine care within 10 days (National Academies, 2024a). CCBHCs must provide clinicians with training on cultural competency; person-centered, family-centered, and recovery-oriented services; and trauma-informed care. Trainings must also be aligned with the National Standards for Culturally and Linguistically Appropriate Services (U.S. Department of Health and Human Services, n.d.). Furthermore, governing boards of CCHBCs are to have members representing individuals and families with lived experiences of mental health conditions and/or substance use disorders. A 2020 report to Congress noted that CCHBCs in participating states outperformed state Medicaid benchmarks in quality metrics for children and adolescents receiving an initial evaluation within 10 days, and for follow-up care after mental health hospitalization and after ADHD medication initiation and continuation (ASPE, 2020a).
An evaluation of the initial 2 years of the CCBHC demonstration found that, depending on the state, 8–27% of CCBHC clients were children or adolescents, 3–22% were African American, <1–8% were American Indian and Alaska Native, and 5–41% were Hispanic. Services provided to children and families were reported to include community wraparound services; dialectical behavioral therapy; peer support for families; and supported employment, housing, and education. Subgroup findings in this evaluation did not suggest that the CCBHC model systematically impacted service use differently for children and adolescents across the participating states (Brown et al., 2022).
CCBHCs can be supported through the Section 223 CCBHC Medicaid Demonstration of the Protecting Access to Medicare Act through SAMHSA-administered CCBHC expansion grants, or through independent state programs separate from the Section 223 CCBHC Medicaid Demonstration. In FY 2022, CCHBCs were appropriated $315 million through SAMHSA (2022c).
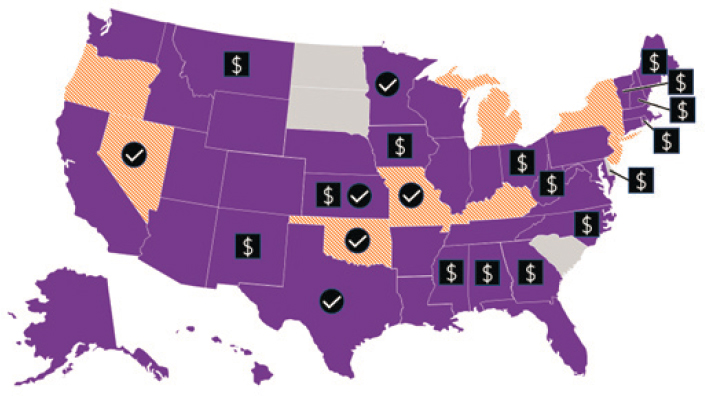
Currently, more than 500 CCBHCs are operating across the country, as either CCBHC expansion grantees, as clinics participating in their states’ Medicaid demonstration, or as a part of independent state CCBHC programs (see Figure 6-8). The CCBHC model has been designed to integrate a number of promising approaches discussed in this report. The effects of the model and expansion on child and family mental health have yet to be determined. Appropriate oversight will be necessary to ensure these centers make progress toward health equity and mental health goals and reach communities most in need.
NOTES:
 Federal CCBHC Medicaid Demonstration (and Substance Abuse and Mental Health Services Administration [SAMHSA] Expansion grants)
 State contains at least one local SAMHSA expansion grantee in the state
 Centers for Medicare & Medicaid Services–approved payment method for CCBHCs via state plan amendment or 1115 waiver separate from Demonstration
 Chosen to receive 1-year planning grant needed to join Medicaid Demonstration starting in March 2023
SOURCE: SAMHSA, 2023a.
School-Based Health Centers
School-based health centers are important settings where children can receive clinical care; moreover, centers located in low-income areas improve children’s health and education outcomes (Community Preventive Services Task Force [CPSTF], 2016a). For schools specifically, Medicaid allows simplified processes for calculating payment rates, for documenting services delivered, for determining Medicaid coverage (using estimated ratios of eligible children applied to services delivered, rather than person-specific eligibility determination), and for qualifying participating providers. In addition, through administrative matching funds, schools can support Medicaid outreach, enrollment, and care coordination (CMS, 2023c). In 2023, CMS released guidance on how Medicaid can fund services in schools (e.g., preventive, behavioral health, physical therapy). While Medicaid and commercial insurance can be billed, barriers exist including lack of effective billing infrastructure and at times primary care approval or preauthorization for certain school-based services.
Despite this flexibility, the fundamental structure of Medicaid as an insurance program does not support other effective school-based interventions, aside from school-based clinical services (Moore et al., 2024), such as schoolwide positive behavior supports, universal school-based programs to reduce violence or increase mental health (CPSTF, 2019b), enhanced school-based physical activity, school-based nutritional interventions, or multitiered services (Moore et al., 2024), or approaches that support school staff and teachers. See Chapter 8 for further discussion of school-based care services.
Indian Health Service
The Indian Health Service (IHS) provides direct health care services to eligible Native American individuals and Alaska Natives. About half of Native American individuals are eligible for this program, and in 2020, the IHS served 64% of the eligible population (National Academies, 2023d). IHS clinics include federal, tribal, and urban Indian health organizations that provide comprehensive care across the lifespan in rural areas; on reservations; and, increasingly, in urban population centers (IHS, 2020a). Some have been designated as FQHCs (IHS, 2005, 2020b).
IHS receives funding through congressional appropriations (mainly discretionary), which are supplemented by a small share of reimbursement collections from Medicaid, CHIP, and commercial insurance. Financing of IHS through annual discretionary allocation with specific spending limits is very different from Medicaid as an entitlement program with no annual spending caps. This impacts not only the year-to-year delivery of health care services but its long-term sustainability and the ability to update infrastructure and respond to public health crises (e.g., COVID-19 pandemic) or other unexpected events. IHS’s global budget structure also means that as the number of community members served increases, the per capita spending declines. It is also notable that Medicaid, with its relatively low reimbursement rates, comprised nearly 70% of third-party collections at IHS facilities during the federal FY2019 (MACPAC, 2021b). This creates a compounded and insidious inequity in how health care services for Native Americans are financed.
Currently, funding for IHS has been estimated to address only 48.6% of the health care needs of Native Americans (ASPE, 2022b). IHS funding for urban health has been only around 1% of the current allocation, even though 70% of Native Americans live in urban areas (ASPE, 2022a; National Council of Urban Indian Health [NCUIH], 2023). In 2018, the funding gap for direct care services for children and mothers eligible for IHS was estimated to be $7.8 billion (National Academies, 2023f). See the recent report by the National Academies titled Federal Policy to Advance
Racial, Ethnic, and Tribal Health Equity for a broader discussion of IHS structure and inadequate funding levels, its history and federal responsibility, and policy solutions for addressing health inequities for all ages of American Indian and Alaska Native people (National Academies, 2023e).
More than 60% of IHS appropriations are administered by tribes through self-determination contracts (25 USC § 5301; IHS, 2020b). The self-determination option allows tribes to leverage tribal leaders’ knowledge to assess needs and tailor services to their communities. The self-determination approach could be useful for providing child, family, and community-oriented care; however, as discussed above, the IHS to date is chronically underfunded (GAO, 2018; Heisler & McClanahan, 2020; Lofthouse, 2022; _National Academies, 2021e; Tribal Budget Formulation Workgroup, 2022; United States Congress, 2024).16
Hospital Supplemental Payments
Policy discussions about Medicaid hospital payment include both Medicaid base payment rates but also several special payment programs (MACPAC, 2017), with a significant share of Medicaid hospital payments routed outside the usual fee-for-service or MCO payment system. These supplemental payments tie to various policy goals (MACPAC, 2021a, 2023b). Some payments are used to “top up” Medicaid base rates, while others support the care of uninsured groups, and still others are tied to quality or access goals.
One type of hospital supplement is the Disproportionate Share Hospital (DSH) program, which was originally designed to strengthen financing for hospitals with large proportions of low-income, especially uninsured, patients. However, a recent MACPAC (2024a) report found low correlation between DSH payment amounts and uncompensated care at the hospital level, suggesting that these funds may not be well targeted. Other supplemental payments go to hospitals, physicians, or other large providers (mental health centers, nursing homes; MACPAC, 2021a).
One important distinction across providers is that supplements to physicians are not tied to upper payment limits (MACPAC, 2021a, 2023a), whereas several hospital supplements are capped at Medicare equivalents (i.e., with the goal of raising Medicaid rates to the upper limit of prevailing Medicare rates). Most supplements are tied to provider fee-for-service payments, but a rapidly growing category of special payments, called “directed
___________________
16“The 2023 omnibus spending package provided IHS with $6.96 billion for FY 2023, and, in a historic change, also included advance appropriations totaling $5.13 billion for FY 2024 (NCUIH, 2023). However, it is not clear if advance appropriations will continue past 2024” (National Academies, 2023c, p. 268).
payments,” targets MCOs, with the major growth of MCOs replacing fee-for-service Medicaid arrangements. With these arrangements, states can direct MCOs to pay certain state-selected providers additional sums (GAO, 2023d; MACPAC, 2022). In total, supplemental payments constituted 52% of total fee-for-service Medicaid payments to hospitals (MACPAC, 2023b) and 33% of total payments to physicians and other practitioners (MACPAC, 2023b). GAO (2023d) estimates that providers received a net $32 billion from directed payments in 2022.
As with many dimensions of Medicaid policy, the national averages mask large underlying state variation. Furthermore, the data do not distinguish pediatric from other hospitals. States differ in the total amounts, mix, goals, and distribution of funding to providers (MACPAC, 2021c, 2023b). To illustrate, physician supplements most often benefit public (state or county) academic medical centers or teaching hospitals (MACPAC, 2021c), but 20 states have no supplemental payments to physicians, and shares in other states range from less than 1% to over 92% (MACPAC, 2023a). All but five states with MCOs have directed payments ranging from under $100 million to more than $1 billion.
One appeal of supplemental payments, relative to increasing the base payment levels, is that supplements are capped in aggregated, more predictable ways, and they are less likely to rely on state general funds (GAO, 2023d). Hospitals frequently share in the financing of the supplemental payments (i.e., putting up a portion of the state share through intergovernmental transfers, health care provider taxes, or certified public expenditures), again with large state variation. For government-owned (county or state) health care systems, states can also increase their federal match through intergovernmental transfers, providing substantial financing for public institutions (GAO, 2023d). Once these health care systems contribute a share of the costs, those funds are then reimbursed through the supplement.17
Historically, states did not report supplemental payment amounts at the provider level, making it difficult to assess which providers benefit and where payment gaps remain (MACPAC, 2023a). Federal law (Consolidated Appropriations Act, 2022) now requires provider-level reporting for certain supplemental payments, although this provision has not yet been implemented through regulations and it omits several kinds of supplemental payments. The lack of transparency and insufficient evaluation surrounding supplemental (and directed) payments have been raised repeatedly as policy challenges: neither their impact on the child health care system nor on the distribution of health care resources to reduce child health disparities is
___________________
17GAO (2023d) estimates that 75% of intergovernmental transfers are returned to local government providers and 80% of provider taxes are returned to the same providers.
clear (GAO, 2021, 2023d). However, many of these mechanisms likely have major impact on the financing of children’s inpatient care. In some cases, a children’s hospital may be the only provider of specialized pediatric services in a community, and it may therefore qualify for DSH payments. In other cases, the upper-payment-limit strategy can improve hospital financing; and in still others, state pediatric inpatient units can receive additional funds through the Medicaid pass-through program.
MACPAC (2017) published a seminal analysis of hospital payment rates in Medicaid, including comparisons with Medicare rates, finding that hospital fee-for-service rates, overall, were comparable or higher than Medicare for a selected set of common services, once adjustments were made to the Medicaid fees based on supplemental hospital payments. These supplemental payments on average accounted for 49% of total Medicaid payments to hospitals. This general conclusion aligned with estimates from the American Hospital Association (AHA, 2016). As anticipated, large state-specific differences emerged: for 18 selected conditions, the average Medicaid payment was higher than Medicare in 25 states and lower than Medicare in 22 states (AHA, 2016). MACPAC (2017) also documented very large differences in hospital payment rates within and across states, within and across individual hospital services, and in the distribution of supplemental hospital payments.
KEY CHALLENGES OF HEALTH INSURANCE
On the positive side, children have high rates of insurance coverage. However, high out-of-pocket costs; gaps in covered benefits; limited provider participation, particularly for mental health and dental care; and periodic gaps in coverage and other administrative burdens create uncertainty and financial stress in families, with detrimental effects for child health. Several persistent challenges remain in providing equitable health insurance coverage for children.
Racial and Geographic Variation
Employer-Sponsored Insurance
Most children’s commercial health insurance financing is tied to their parents’ employer; consequently, the choices employers make about the insurance policies they offer to their employees can perpetuate structural racism and health inequities for children. A 2022 analysis of health disparities among employer-sponsored insurance enrollees found that those with low to moderate incomes had high rates of both difficulty paying medical bills and emergency department utilization; overall, among individuals with
employer-sponsored insurance, racial disparities persisted in areas such as maternal and behavioral health (Morgan Health & NORC, 2022).
Because employer-sponsored insurance plans are not required to cover mental health, dental care, or other preventive services not required in Section 2713 (29 CFR), coverage of these services becomes an employer-specific decision, leading to wide variability in the experience of children and families. For example, 54% of employer-sponsored plans do not cover pediatric dental services, half do not cover applied behavioral analysis therapy, and 31% of small employer plans and 20% of large employer plans do not cover autism services (MACPAC, 2015b). Currently, few data describe differences among employer-sponsored plans in coverage or access to speech, physical, or occupational therapies for children (MACPAC, 2016). However, an analysis of children continuously enrolled for 1 calendar year in an employer-sponsored insurance plan found that children with noncomplex and complex chronic disease and those who sought behavioral health services experienced significantly higher rates of out-of-network care and associated higher rates of cost-sharing.
Employer-sponsored insurance has clear benefits, including coverage of young adults through their parents’ insurance up to age 26 (Conway, 2020). This provision effectively publicly subsidizes (because the value of employer-sponsored benefits such as insurance are not taxed) young adults from wealthier families, who are more likely to have access to employer-sponsored insurance than those in lower-income families, extending the impact of structural racism on economic opportunity (McMorrow et al., 2015). Figure 6-9 (Hill, Artiga, & Damico, 2024) illustrates that Asian and White children and their families are more likely to get insurance coverage through employers. A previous National Academies report states, “This policy creates tax inequity, as it benefits those with employment and provides greater subsidies to those with higher incomes” (National Academies, 2023e, p. 229). Large employers are more likely to offer employer-sponsored health insurance; employers with a large percentage of low-wage workers are less likely to offer health insurance (MACPAC, 2016). Previous data show that 74.9% of White children’s parents were offered employer-sponsored insurance, compared with 60.7% of Black and 51.4% of Hispanic children’s parents (Pylypchuk & Selden, 2008). This is consistent with more recent data that also found that only a few firms that offer coverage to employees do not offer it to other dependents and that low-wage workers with families are more likely to be employed in small firms and so less likely to be offered employer-sponsored health insurance. Around 19% of employers offered health benefits to part-time workers in 2015, and only 3% offered any coverage to temporary workers (MACPAC, 2016). A Brookings Institution report found that Latino/a, Black, and women workers were overrepresented in the low-wage workforce, with White and
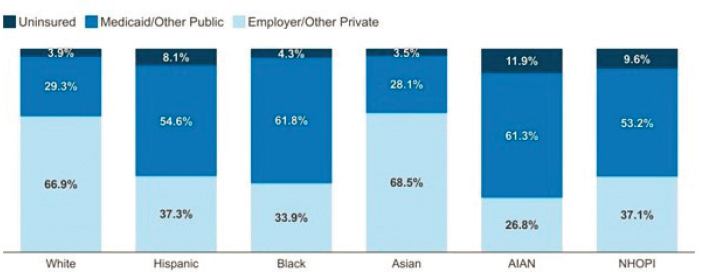
NOTES: Includes children ages 0–18 years. Persons of Hispanic origin may be of any race but are categorized as Hispanic for this analysis; other groups are non-Hispanic. AIAN = American Indian and Alaska Native; NHOPI = Native Hawaiian or Other Pacific Islander. Totals may not sum to 100% because of rounding.
SOURCE: KFF (2024) analysis of 2022 American Community Survey, 1-year estimates.
Asian Americans underrepresented (Ross & Bateman, 2019); additionally, 40% of low-wage workers were noted to be raising children.
Uninsured Children
The complexity, inconsistency, variations, and structural racism inherent in the system of health care financing for children means that 5.4% of children remain uninsured (Alker & Osorio, 2023). These numbers are notably higher in American Indian and Alaska Native (13.3%), Hispanic (8.6%), and Native Hawaiian and other Pacific Islander (7.1%) communities, which have the highest rates of uninsured children and youth (Branch & Conway, 2022).
Compare these with uninsurance rates for adults ages 65 and older, which have been below 1% since 2019 (Cohen & Cha, 2023)—although disparities exist even among older populations, with increased rates in older people from Hispanic (3.6%), Native Hawaiian and other Pacific Islander (2.0%), and Asian (2.3%) communities (Branch & Conway, 2022). This high rate of coverage largely comes from the financing and structure of Medicare, which is an entitlement program with eligibility based primarily on age and citizenship status. Medicare has full federal financing, with funding stemming from a combination of general revenues, payroll taxes, income taxes, premiums for those not eligible for premium-free coverage, and interest earned on the two trust fund accounts set up and held by the U.S. Treasury exclusively for Medicare, with little to no variation in coverage among states or territories.
In contrast, Medicaid relies on general revenues. In 2021, federal Medicare spending for the 63,964,675 enrolled members was $900 billion, while spending on the 85,809,179 individuals in Medicaid and CHIP was $734 billion (CMS, 2021a,b, 2023i, n.d.g).
Disparate COVID-19 Relief
The federal government’s response to the COVID-19 public health emergency illustrates how current health care financing undervalues pediatric care and exacerbates long-standing racial and health inequities. In addition to the continuous Medicaid and CHIP eligibility policies noted earlier, as part of the Coronavirus Aid, Relief, and Economic Security (CARES) Act (2020), Congress provided direct funding to eligible hospitals and providers (Schwartz & Damico, 2020). Funding included targeted Medicare distributions through a “high-impact distribution,” which went out automatically in two rounds. Payments were determined through a formula set by CMS, relying in part on the hospital’s share of fee-for-service Medicare payments out of total Medicare payments in 2019 for the initial round (Franco, 2020). A similar formula was used for the Provider Relief Fund administered by HRSA (n.d.d), relying on revenues from 2018. The stated intent was to assist hospitals that had significant decreases in the volume of care. However, given that the formula for distribution of funds relied on a prepandemic health care system with known inequities, the result of these initial allocations was that funding went disproportionately to larger, wealthier health care systems that were less likely to serve Medicaid and uninsured patients or those from rural or racially marginalized communities (Rau, 2020a,b). This initial allocation of funding by revenue instead of by need had a disparate impact on Black populations in particular (Kakani et al., 2020). Subsequent analyses showed that hospitals with a larger proportion of Medicaid patients saw relatively increased pandemic relief funding; however, critical access hospitals and those in rural communities saw lower levels of CARES Act funding (Cantor et al., 2021).
Immigration Status and Health Insurance
A child or their caregiver’s immigration status also impacts their likelihood of having health insurance and accessing care (Norris, 2023; Pillai et al., 2023; Rosenberg et al., 2022). In 2021, approximately 44.7 million immigrants lived in the United States, including 20.8 million noncitizens (both documented and undocumented individuals) and 23.9 million naturalized citizens (KFF, 2023a,b). Many families have mixed immigration status—that is, citizens and documented and undocumented individuals living in the same home. Twenty percent (20%) of children have at least one
parent who is an immigrant; 12% of children who are U.S. citizens have at least one noncitizen parent (KFF, 2023a,b).
Legislation enacted by Congress in 1996 prohibited federal funding of Medicaid for individuals who have had legal permanent-resident status (often referred to as having a “green card”) for 5 years or less (Broder & Lessard, 2023). Certain groups, such as refugees and asylees, veterans, and their families, do not have to wait 5 years. States are allowed to cover these individuals with state-only funds; 29 states—plus Washington, DC, and the Commonwealth of the Northern Mariana Islands—have chosen to cover pregnant women and children in these groups through Medicaid without a 5-year waiting period, while 21 of those states also cover them through CHIP (Health Insurance Marketplace, n.d.). Individuals in these groups can also get coverage for emergency care for certain conditions through Medicaid. Additionally, all documented individuals are eligible for coverage through the federal health insurance marketplace, as well as emergency Medicaid.
Although noncitizen immigrants have high employment rates, they frequently have low-wage jobs in industries that do not offer employer-sponsored insurance. States that have extended coverage to children regardless of immigration status have found a decline in forgoing preventive or needed medical and dental care. Similar expansion of coverage for pregnancies through Medicaid was associated with improved birth weights and average gestation for newborns (KFF, 2023a,b).
However, recent federal policy changes, notably “public charge” rules regarding entry to the United States and/or eligibility for a green card or citizenship (Pillai & Artiga, 2022), have contributed to declines in enrollment in Medicaid among mixed-status and immigrant families. Indeed, many noncitizen immigrants pay taxes that support the very programs they cannot access. In 2018 undocumented immigrants contributed an estimated $20.1 billion in federal taxes and $11.8 billion in state and local taxes (New American Economy, n.d.).
Continuity of Health Insurance Coverage for Children
Even with four waves of health insurance coverage expansion for children over multiple decades, 2.5 million children (Tolbert, Drake, & Damico, 2023) were eligible but never enrolled in Medicaid, even during the public health emergency. These eligible families may not have enrolled out of lack of awareness of eligibility, administrative burdens, or for other reasons (Buchmueller, Ham, & Shore-Sheppard, 2016). State and federal rules often create administrative barriers to continuous enrollment in Medicaid, requiring frequent redetermination of eligibility, which is often a time-consuming task for parents (e.g., time spent gathering relevant information). Thus, many
children lose coverage for administrative reasons; in other words, they are disenrolled from Medicaid despite being eligible (this is also called “churn”). Churn is a persistent challenge in insuring children (ASPE, 2022c; Corallo et al., 2021; Frenier & McIntyre, 2023), as was made starkly clear during the recent Medicaid “unwinding.” As of May 2024, more than 5 million children and youth had lost Medicaid coverage, often through administrative problems rather than ineligibility (Center for Children and Families, n.d.).
The ACA requires states to coordinate eligibility and enrollment across Medicaid, CHIP, and coverage on health insurance exchanges with an eye toward reducing coverage gaps as families’ incomes and other circumstances change. Despite common income, application, and electronic data transfer provisions, several nuanced differences among the health insurance programs’ rules and paperwork requirements can lead to gaps in coverage (MACPAC, 2022). A recent MACPAC study (2022) examined gaps in coverage for children with Medicaid or CHIP. After a coverage gap, one-third to half of children did not transition to new coverage within 12 months (this rate was lower than that of adults; 65%).
As the recent Medicaid unwinding has also documented, administrative barriers create major problems for families who must regularly provide information about their continuing eligibility. Additionally, immigrant parents who are concerned about public charge rules (e.g., applications for U.S. citizenship face scrutiny if an adult uses various public programs) may avoid enrolling their (often U.S. citizen) children in Medicaid (Gonzales, Haley, & Kenney, 2023; Raphael et al., 2020). Many states require burdensome eligibility checks, and in recent years, federal assistance with enrollment has been reduced. What is more, reauthorization of CHIP funding was delayed in 2017 (Brooks, Park, & Roygardner, 2019). Entities such as MACPAC (2022) have made numerous recommendations for marginal administrative changes that would reduce churn and loss of coverage in transitions.
Another policy lever for reducing gaps in coverage is for states to expand the length of continuous coverage for Medicaid and CHIP. Federal policy made a significant step toward coverage continuity in 2023. Whereas 17 states previously did not have continuous 12-month eligibility for Medicaid or CHIP, beginning in 2024, all states must do so for children under age 19 years (Consolidated Appropriations Act, 2023). In addition, states may cover pregnant women for 12 months postpartum. States may also opt to further extend continuous coverage. In 2023, Oregon began offering multiyear coverage through age 6 years, plus 2-year continuous eligibility for children over age 6 (Buettgens, Nichols, & Dorn, 2023; KFF, 2023d). Washington and New Mexico now also offer multiyear coverage, and several other states (California, Colorado, Illinois, Minnesota, North Carolina, New York, Ohio, and Pennsylvania) are in the process of developing relevant policies (Burak, 2023). Rationale for these policy innovations includes
the low cost to federal and state budgets (0.1%; Buettgens, Nichols, & Dorn, 2023) and relatively low rates of change in eligibility in younger families (Oregon Health Authority, 2021), as well as evidence that gaps in health care insurance coverage for children lead to higher likelihoods of unmet medical, prescription, and dental needs; delays in accessing urgent care; and lower likelihoods of attending well-child visits or having a usual source of care (Cassedy, Fairbrother, & Newacheck, 2008). Additionally, policy makers have pointed to the well-documented critical window of the first 5 years in a child’s development, as well as the priority for continuous coverage for communities that historically experience the brunt of structural racism and inequity (Burak, 2018; Chomilo, 2022).
Underinsurance
While the problem of uninsurance among children has declined, the challenge of underinsurance has risen. “Underinsurance,” when individuals with health insurance coverage still face financial risk (Lavarreda, Brown, & Bolduc, 2011), can be caused by coverage that stops and starts and from limited covered benefits, limited provider networks, or high out-of-pocket costs—challenges especially common to children with commercial insurance and in stand-alone CHIP programs. From 2016 to 2019, the proportion of U.S. children experiencing underinsurance rose from 30.6% to 34.0%, representing an additional 2.4 million children (Yu et al., 2022). Many families with commercial insurance face high out-of-pocket costs for health care. In fact, underinsurance is particularly notable among commercially insured children (Daw et al., 2023), likely because of the more limited benefits and higher copayments and premium costs than in Medicaid. In 2021, 33.0% of commercially insured children reported inadequate coverage (i.e., experiencing gaps in benefit adequacy, provider access, or out-of-pocket costs), compared with 12.2% of publicly insured children (Daw et al., 2023).
The risk of underinsurance also depends on children’s health status (Kogan et al., 2010; Perrin, Kenney, & Rosenbaum, 2020; Yu et al., 2022). Children with disabling conditions or special health care needs face greater underinsurance challenges than other children (40% vs. 30.8%; Validova et al., 2023). Children in these groups represent 13.3%, or 9.7 million children, according to the NSCH (Census Bureau, 2024).18 Another group at risk of underinsurance is children in families with middle incomes, meaning
___________________
18The category of “children with chronic conditions” is defined as those experiencing one or more of the following health consequences: (1) elevated need or use of medical services; (2) limitations in day-to-day activities; (3) need or use of specialized therapies (e.g., physical and occupational therapy); and/or (4) need or use of treatment of an emotional, behavioral, or developmental condition (as defined in Bethell et al., 2015).
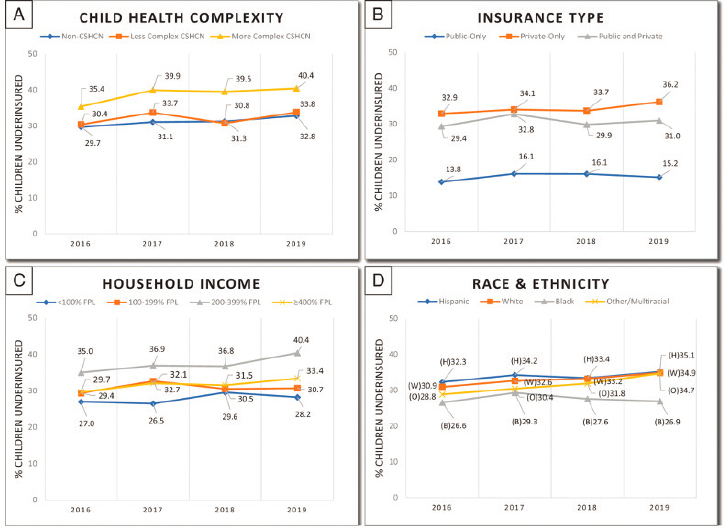
NOTE: CSHCN = children with special health care needs; FPL = federal poverty level.
SOURCE: Yu et al., 2022.
households earning 200%–399% FPL (36.7% are underinsured). The concentration of underinsurance among middle-income families underscores how commercial insurance can leave families vulnerable to financial insecurity (see Figure 6-10).
Variations in Medicaid and CHIP Policies in U.S. Territories
Although not often included in conversations about health care system and policy changes, approximately 3.5 million individuals live in the territories of the United States. All five territories offer both Medicaid and CHIP, and the percentage of their populations covered by Medicaid/CHIP varies widely based on different policies and social conditions within the territories. However, “under the Social Security Act (the Act) the territories are considered states for the purposes of Medicaid and CHIP, unless otherwise indicated (§ 1101(a)(1) of the Act)” (MACPAC, 2021b, p. 1). Two of the five territories, American Samoa and the Commonwealth of the Northern Mariana Islands (CNMI), utilize a Section 1902 waiver uniquely available
to them that “allows the Secretary of the U.S. Department of Health and Human Services to waive or modify any Medicaid requirement except for the statutory annual limit on federal Medicaid funding, the federal medical assistance percentage (FMAP), and the requirement that payment can only be for services otherwise coverable by Medicaid” (MACPAC, 2021b, p. 1). As a result, these two territories are not required to provide all of Medicaid’s mandatory benefits; the other territories must follow the same Medicaid rules as states.
The percentage enrolled in Medicaid or CHIP in U.S. territories was highest in American Samoa, at 68.4%, and lowest in Guam, at 21.2%, as of June 2019 (MACPAC, 2021b)—in spite of the fact that the rate of poverty has historically been higher among communities in the territories than in the states (Hall, Rudowitz, & Gifford, 2019). Financing plays a significant factor in this variability, as although individuals born in the U.S. territories are citizens or considered U.S. nationals, their public programs are financially differently from the programs in the 50 states and Washington, DC (Hall, Rudowitz, & Gifford, 2019). Annual Medicaid funding for the territories has been fixed in statute with a cap on the FMAP, whereas funding for the 50 states and DC is uncapped and adjusted annually based on state per capita income. The FMAP for territories was increased from 50% to 55% with the passage of the ACA in 2014 (along with a higher FMAP for nondisabled adults without children); the 2023 Consolidated Appropriations Act increased the FMAP to 83% for American Samoa, CNMI, Guam, and the U.S. Virgin Islands (USVI), and extended Puerto Rico’s FMAP of 76% for 5 years. However, because of a block grant or capped funding, territories still have less Medicaid funding per capita than states with comparable or lower per capita incomes. Once a territory has spent all of its funds, unless it received temporary relief funding, it no longer receives federal matched funding for the remainder of the fiscal year. This impacts decisions around who is offered coverage; notably, three territories—Guam, Puerto Rico, and USVI—are “statutorily exempt from providing Medicaid coverage to certain mandatory coverage groups including poverty-related children and pregnant women” (MACPAC, 2021b, p. 1). This also impacts the availability of certain services, as not all territories are required to offer mandatory Medicaid benefits, such as nonemergency medical transportation. Additionally, recent natural disasters, due in part to human-driven climate change, have significantly impacted the territories’ ability to meet the health care needs of Medicaid and CHIP members because of destruction of facilities and erosion of the health care workforce (Michaud & Kates, 2017; Seervai, 2017; Velázquez, 2022). So while all territories offer the EPSDT benefit; prescription drugs; and clinic, dental, and eye services, they have also seen increased costs, as members must increasingly seek their care off island.
Access to Providers in Networks
Access concerns for children and youth covered by Medicaid include whether a given MCO offers an adequate provider network. The state’s MCO contract provides a vehicle for establishing provider adequacy and related provisions (SSA, n.d.), but federal and state monitoring of pediatric network adequacy has been limited. Although CMS access rules require states to document adequate network and service access, reporting is left to the states, which mainly need to affirm satisfactory or adequate access.
Importantly, as discussed in previous chapters, subspecialty network needs are very different for children than for adults. Most childhood chronic conditions are rare, while adults experience relatively high rates of common chronic conditions. Thus, knowledgeable pediatric subspecialists are far less common than for adults. MCOs typically develop “narrow” networks for adult care as one way to curb costs. However, while children needing subspecialty care require a larger network geographically to ensure access (e.g., to a specialized pediatric cardiologist), few MCOs offer different networks for specific populations.
Adequacy requirements are measured in several ways—for example, time–distance requirements relative to beneficiary locations, provider-to-beneficiary ratios, appointment wait times, and geographic comparisons (Lipson et al., 2017). These requirements may vary by service specialty or apply differentially to urban and rural areas, although states typically do not call out specific network adequacy for younger populations (Cuellar, 2022). Recent federal regulations call for improving access in several ways. First, they require assessing and improving wait times for three areas: primary care, maternity care, and outpatient mental/behavioral health care. They require improvements in provider directories and their accessibility to enrollees, including secret shopper strategies to assess access. These approaches also address network adequacy (whether beneficiaries have similar access to services as others in the community), although these requirements do not address different needs for network capacity for children compared with adults.
The new rules also call for transparency in payment rates in the three areas and comparison with prevailing Medicare rates for the same services. New rules also address access to home- and community-based services, as well as states’ use of directed payments through their MCOs. Finally, the rules clarify and expand opportunities to use nontraditional services that can improve health (“in lieu of service and setting” rule; e.g., certain allowable housing and nutritional supports that are medically appropriate and cost effective; CMS, 2024a,b; Georgetown University Center for Children and Families, 2024; Whitener, 2024).
Access to Mental Health Providers
Many children and adolescents face challenges locating a provider willing to treat them, even when they have insurance. This is a particularly acute problem in mental health care as illustrated in a recent secret shopper study (King et al., 2024). Secret shopper studies seek to capture the experiences of families seeking treatment, in this case for an adolescent with substance use disorder. The focal child in the study case was uninsured but likely eligible for Medicaid. Notably, using a variety of search engines and listings, the study identified only 160 residential treatment centers across the United States that, when called, would accept a patient under age 18 who had a recent nonfatal fentanyl overdose. In 10 states researchers found no residential treatment center for adolescents. Furthermore, the findings related to access by Medicaid versus self-pay are striking. Fifty-seven percent (57%) of facilities called accepted Medicaid, but in 23 states researchers were not able to identify any adolescent residential treatment centers that accepted Medicaid. What is more, most centers accepting Medicaid had waitlists (57% of all facilities that accepted Medicaid reported a waitlist, compared with 19% of facilities that did not accept Medicaid; King et al., 2024).
Access problems in mental health are not limited to residential care; and they are not limited to Medicaid. Similar secret shopper studies found that pregnant women were more likely to face challenges when seeking care for substance use treatment than nonpregnant women and that many behavioral health providers accepted only cash and no insurance (Patrick et al., 2020). Moreover, over one-third of patients with Medicaid or commercial insurance were unable to make appointments (Patrick et al., 2020). For pregnant women, the provider access challenges were not statistically significant between Medicaid or commercial insurance, pointing to systemic problems in behavioral health care beyond the bounds of insurance. Other studies support the widespread nature of this problem. The percentage of psychiatrists accepting commercial insurance declined over time from 70.7% in 2007–2008 to 59.6% in 2015–2016 (Carlo et al., 2024), while Medicare participation among psychiatrists also declined from 68.0% to 62.7%. In contrast, commercial insurance acceptance by nonphysician mental health specialists remained at 88.0% over time. Medicaid acceptance rates are lower than other types of coverage (46.8% for psychiatrists and 77.5% for nonpsychiatrists in 2015–2016), with no statistically significant change since 2007–2008 (Carlo et al., 2024). Medicaid expansion for adults, despite the large reduction in uninsured rates, has not increased Medicaid acceptance among psychiatrists or nonpsychiatrists (Carlo et al., 2024; Wen et al., 2019).
NEW PROVIDER PAYMENT MODELS TO TRANSFORM INSURANCE PAYMENT FOR CHILDREN’S HEALTH CARE
As discussed, traditional payments to providers use a fee-for-service arrangement, with providers rewarded when they increase the volume of care, all else equal, even when such care is of marginal value. While this model is administratively straightforward and promotes access to care, it also incentivizes more health care utilization, which can lead to unnecessary treatment and higher costs that are not associated with improvement in the health of the population. Fee-for-service payments rarely and inconsistently cover many services that children and families need, such as coordination of care, school liaisons, and community connections, although some payers have included some of these services. Adding services to current fee systems requires substantial effort, usually involving the American Medical Association’s (n.d.) Relative Value Scale Update Committee (RUC), followed by CMS approval. The structure and constraints of the RUC value surgical procedures and interventions over many cognitive services, a major barrier to reforming fee-for-service payments. Some have called for a specific pediatric RUC as a strategy for adapting fee-for-service models for pediatric contexts (Committee on Coding and Nomenclature et al., 2014).
The limitations of the fee-for-service model have led to interest in alternative payment models. Most of the efforts to change payment arrangements have come from programs for adults, where overall costs are higher than for populations under age 20. The driving goals of alternative payment for older populations have been to increase quality and patient satisfaction with care and to lower costs. Variations in spending in different areas of the country without obvious health benefits have also motivated the search for more cost-effective ways of paying for care (Bronner & Skinner, 2022).
CMS (2021c, 2022b), through the Center for Medicare and Medicaid Innovation (CMMI), has stimulated a number of alternative payment models, mostly under Medicare, with variable results in cost savings and quality improvement (CMS, 2022a, 2024d,j). The alternative models range from fixed, per-patient payments for primary care physicians, to service- or disease-specific bundles, to payments to larger health care systems via accountable care organization (ACO) payments. Narrower alternative payment models that focused on reducing acute or specialty care or that targeted specific populations were more likely to show favorable savings and utilization results than broader models.
The appeal of the various payment designs is that they seek either to tie payment to outcomes or to control spending relative to fee-for-service payment, or both; but the potential returns for children and youth differ substantially from those for older populations. ACO models for Medicare beneficiaries have generated savings relative to annual benchmarks from
reductions in postacute care, inpatient care, tests, and imaging; however, child health care has fewer opportunities for such savings (Medicare Payment Advisory Commission, 2018). The total health care expenditures for children and youth are lower than for adults, and their use of expensive treatments and hospitalizations is lower as well, which limits the potential, short-run financial return on investment to ACOs and to payers.
Medicaid programs in 12 states have implemented ACO payment programs under which coordinated groups of health care providers come together to improve quality of care, patient experience, and efficiency of care delivery over a defined, broad population of beneficiaries (KFF, 2023d). Six states include both children and adults in their ACO programs, and three of these six contract with child-only ACOs, meaning ACOs that have children’s hospitals and pediatric providers (Center for Health Care Strategies, 2022). In addition, in Ohio, three exclusively pediatric Medicaid ACOs sponsored by children’s hospitals now contract with the state’s MCOs for regional Medicaid pediatric care (see Chapter 9 for an illustration of innovations under way in Ohio). In some states, ACOs have formed specifically for subpopulations of children covered by Medicaid, such as children in foster care (e.g., Texas) (Perrin et al., 2017). While early conceptualizations of ACOs occurred in the Medicare program for adult populations, the Medicaid program has more flexible rules regarding their design and implementation. For example, Medicaid states can mandate coverage through an ACO, as is the case in Oregon (Oregon Health Authority, 2023).
A recent review summarized 32 studies of Medicaid ACOs, 10 of which evaluated outcomes for infants, children, or maternal health and the majority of which focused on Oregon, Minnesota, and Ohio (Holm, Pagán, & Silver, 2024). Findings on quality, utilization, and costs were mixed. Results across studies suggest improved primary care and well-child care for children, improved prenatal care, reduced readmissions after childbirth, mixed evidence with respect to infant and maternal morbidity, and evidence of lower costs for some services. However, the substantial variability of the populations analyzed and differences in implementation made identifying elements associated with success difficult (Holm, Pagán, & Silver, 2024).
Beyond Medicaid ACOs for children, CMMI launched demonstrations of the Integrated Care for Kids (InCK) model in seven locations across the country, seeking to promote comprehensive, multidisciplinary, team-based care for children that coordinates with multiple service sectors (Alley, Ashford, & Gavin, 2019; CMS, n.d.e), improves child health, and reduces hospitalizations and out-of-home placements (Jones & Lucienne, 2023). The InCK model also emphasizes health-related social needs and locally designed delivery models that seek to coordinate care across health care and other child services. including early childhood care, education, food, housing, Title V, child welfare, and mobile crisis response (CMS, 2024f).
Furthermore, the demonstrations were charged with implementing at least some form of alternative payment model, either broad or focused. For example, in North Carolina’s InCK, MCOs give incentives to integrated networks of providers based on standard measures such as depression screening and emergency department visits, and also on measures such as promotion of kindergarten readiness and screening for housing and food insecurity (but not outcomes from other sectors; CMS, 2024e; James et al., 2023).
A major challenge to applying adult-designed alternative payment models, such as ACOs, to children is that adult models have a relatively narrow focus on changing delivery of physician and hospital services, improving quality and patient experience in these domains, and recovering savings from the health care system. By comparison, better child health can lead to improved education and employment outcomes for children, as well as savings to special education and criminal justice sectors (Flanagan, Tigue, & Perrin, 2019). As this report reiterates, health and wellbeing in early life help establish a positive life course trajectory. Currently, neither fee-for-service arrangements nor alternative payment models provide incentives to achieve improvement in these longer-term outcomes. This represents an opportunity to design and evaluate different payment approaches to shape health care to meet the needs of children and youth.
Several considerations are important when designing alternative payment models for children (Perrin et al., 2017). One is an ex ante, actuarial exercise to understand how much spending falls on primary care, specialty physician care, hospital care, nonhospital facility care, medication, and other services. This includes, for example, assessing the average level of per-person spending, determining the variation in spending that creates financial risk, and further assessing spending by population or patient condition. Alternative payment rates are generally based on historical overall fee-for-service payment levels, meaning that they may not lead to higher revenues for providers where access challenges are greatest. Another design element are the ex post economic incentives, which are created once a payment scheme is in place. For instance, payers generally engage in greater monitoring of overutilization under a fee-for-service payment model, but the focus would shift to greater monitoring of underutilization with payment schemes that have more financial risk and incentivize providing less care. A recent National Academies report calls for partial capitation payments for primary care, providing flexibility to achieve the report’s goals including whole person care and team-based care, while maintaining fee-for-service incentives for specific desired services (National Academies, 2021b). The recent Massachusetts 1115 Medicaid waiver implements a similar partial capitation approach, also incentivizing certain specific services (Brykman, Houston, & Bailey, 2021). Capitation covers most services (with an effort to adjust risk for more complex patients), along with additions to
the capitation rates for including various practice enhancements, such as integrated mental and behavioral health staff, community health workers, or school liaison personnel. Such models may provide guidance for new payment arrangements for child health care.
Other design elements to weigh for child populations are whether to separate adult and child populations entirely (Brykman, Houston, & Bailey, 2021), how to incorporate existing school-based or other clinical services in the community (CMS, 2024b) to avoid incentives to shift costs, and how to leverage existing population screening that is performed, for example, in schools around food insecurity and school lunch programs. Furthermore, in order to anticipate the likelihood of desired and undesired behaviors, models also need to assess nonhealth outcome measures carefully, both from an ex ante, actuarial perspective, which would tally costs across sectors, and from an ex post economic perspective, including whether the providers in question have meaningful control over the outcome (Counts, Mistry, & Wong, 2021a). Holding health care providers financially accountable for home visiting to promote early attachment or medical screening to promote school readiness have very different implications from holding health care systems financially accountable for grade-appropriate reading levels or high school graduation rates, which are primarily under the control of the education system. Novel models could test combinations of alternative payment to providers and simultaneous investment in community prevention—for example, around school-based mental health or physical activity—to see which approaches generate the greatest improvements in child health.
A further payment model design consideration is which population subgroups are more likely to be treated (or undertreated) under one scheme versus another. For example, schemes that reward better health outcomes may incentivize providers to focus on those subgroups that are most likely to succeed, all else equal—typically those who are healthier or face fewer social disadvantages. Payers resort to adjusting payments for this risk, although most risk adjusters so far do not work well for younger populations, other than the small number of children with quite severe conditions (National Academies, 2016a).
Transformation from fee-for-service to health outcome–based payment is complex (Farmer et al., 2016; Tieder et al., 2018). Population-management payment models may need fairly long time windows to succeed, to allow for investments in care coordination, team staffing, information technology, and data analytics to ultimately achieve improvements in health and other outcomes (CMS, 2021c; Perrin et al., 2017). Such changes place significant demands on providers and require a level of technical sophistication and investment that many providers currently lack.
Adjusting payments for social needs also requires careful consideration, as shown for adults. In a recent Medicare study, researchers found that populations with higher social needs had similar or lower spending after
adjusting for health risk, compared with populations with lower social risk. This finding suggests forgone care for higher-risk patients and that adjusting for social risk in this manner would increase, not reduce, disparities (McWilliams et al., 2023). Oregon and Washington have experimented with improving social risk assessment for children. Massachusetts, recognizing the perverse incentives of allocating more resources to higher users, has also worked to pay for care needed rather than basing pay on previous utilization (Alcusky et al., 2023; Ash & Ellis, 2012; Dyer et al., 2023).
While alternative payment models may hold some promise over fee-for-service models for improving the health of children, fundamental challenges associated with their design and implementation must be recognized and potential solutions for addressing them must be developed and tested. These considerations include the longer-term nature of potential cost savings for children in the case of alternative payment models (vs. shorter-term cost savings for adults from reduced health care spending), the optimal design of payment rates, decisions about what children’s health outcomes to measure and prioritize, the need for strategies that avoid inadvertently incentivizing a narrow focus on youth populations whose health status may more amenable to improvement, consideration of social risk adjustment, and ensuring providers are able to manage technical aspects of implementation.
CONCLUSION
Children’s health insurance coverage comes from a mix of commercial, employer-sponsored, and public health insurance through Medicaid and CHIP, which cover a large majority of children, along with a few other sources. Current health insurance coverage for children is high—around 95% have some insurance, although major periodic fluctuations in Medicaid and CHIP can change coverage levels significantly, as seen in the recent loss of coverage by millions of children with the unwinding at the end of the pandemic public health emergency.
During the pandemic, Medicaid and CHIP alone provided coverage for about half of all U.S. children and youth—a higher percentage for any age group dependent on public health insurance, other than populations over age 65 with Medicare coverage. Medicare and Medicaid/CHIP have very different administrative structures. Medicare is fully funded by the federal government and administered nationally. Medicaid and CHIP, in contrast, have joint federal and state funding (although the federal government provides at least 50% of each state’s Medicaid costs), and the states administer the programs under federal guidelines and requirements.
Key Medicaid strengths include that it is an entitlement—i.e., any eligible person applying must be included. Furthermore, Medicaid has no copays or premiums and has a statutory benefit for children and youth up
to age 21—the EPSDT program that guarantees access to medically necessary services that children need, even if that service is not usually included in the state’s allowed services. CHIP programs, however, need not follow the same requirements as Medicaid.
Public insurance through these programs follows a complex series of rules and options that can help or hinder access to needed pediatric services. Opportunities exist to standardize key characteristics across states, including eligibility, enrollment, scope of services, payment, and quality. The poor state of health of U.S. children and youth and the lasting impact of child health on adult morbidity and mortality (see Chapter 4) threaten the readiness of the nation’s military and workforce and, in turn, economic stability. These findings support the need for Medicaid and CHIP reform to eliminate inequities in access to care and improve care and outcomes for all children and the adults they will become. Reform will require decreasing state variation in program policy and administration, strengthening the critical EPSDT program, and ensuring adequate payment for services.
Many states have carried out innovative strategies for improving their programs, providing some guidance for payment reform and the changes recommended by the committee. However, many current payment reform efforts have ignored younger populations and have incentives that are better directed to older patients. There is a critical need for experimentation and analysis of new strategies for improving payment for children’s health care.
This page intentionally left blank.


