Diagnostic Assessment and Countermeasure Selection: A Toolbox for Traffic Safety Practitioners (2024)
Chapter: 5 Perception-Response Time as a Contributing Factor to Crashes

CHAPTER 5
Perception-Response Time as a Contributing Factor to Crashes
5.1 Objectives
The objectives of this tool are to
- Describe the importance of time, and perception-response time (PRT) in particular, to road user performance and safety;
- Review the factors that affect driver PRT;
- Describe the relationship between driver PRT and driver expectations, visual conspicuity, and vehicle speed; and
- Provide diagnostic questions that can aid the practitioner in identifying factors that may reduce driver PRT in a given roadway area.
5.2 Background
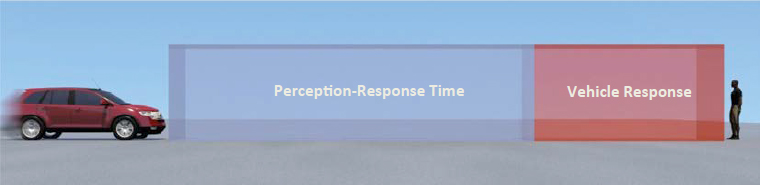
A critical and common thread in circumstances that lead to roadway crashes is time—specifically, a lack of time for the driver to respond to an object in the roadway, a change in roadway characteristics, or a navigation demand. Time is not just a road user variable, it is also a design variable. Aiding the driver in ways that give them more time to perceive, decide, and respond to situations and conditions is perhaps one of the most direct ways that the roadway designer can improve safety performance. Probing both infrastructure and driver factors that relate to time and how they might impact safety supports improved diagnostic assessment of crashes and the selection of effective countermeasures to reduce crash potential. Time—and especially how drivers use the time they have—is crucial to assessing driver behavior in the context of crashes. The time drivers have to perceive and respond to an obstacle or object in the vehicle’s path is called PRT, which is followed by the interval of time it takes for the vehicle to stop or change lanes (see Figure 9).
5.2.1 What Is Perception-Response Time?
PRT is comprised of four stages: detection, identification, decision, and response (Summala, 1981; Triggs and Harris, 1982; Olson and Sivak, 1986; Muttart, 2005). The PRT interval typically begins when an object of interest enters the driver’s field of view and ends when the driver has just initiated the chosen response (e.g., begins turning the steering wheel or depressing the brake pedal) (Campbell et al., 2012). The four stages are as follows.
- During the detection stage, the driver initially perceives an object of interest in the environment, which can involve seeing an object in their path of travel or hearing a noise somewhere in the distance.
- Once the object is detected, the driver must identify it and determine whether it presents a hazard.
- Next, the driver must decide what to do to avoid the hazard, if anything, such as braking, steering, or accelerating.
- After the decision has been made to respond, the driver must initiate and carry out that action, such as moving the foot from the accelerator and depressing the brake pedal.
The four stages are not always present in every driving situation (e.g., there may not be a clearly defined moment during which the object is available to be seen by the driver, or the driver’s initial identification may be erroneous) (Francis et al., 2020).
A large body of research involving laboratory and on-road studies has helped estimate approximate driver PRT values under a variety of situations. Although this range is wide (roughly 0.5 to 2.5 seconds), the data on PRTs can have significant utility in crash diagnostics and roadway design. AASHTO’s A Policy on Geometric Design of Highways and Streets (commonly referred to as the “Green Book”) recommends a design criterion of 2.5 seconds to include the capabilities of most drivers under most highway conditions, but actual PRTs will be situation-dependent (AASHTO, 2018).
For example,
- In a simple scenario where drivers respond to an expected situation during daytime (e.g., brake lights of another vehicle), PRT can be well under 1 second (Olson and Sivak, 1986; Fambro et al., 1998).
- When the situation is unexpected (e.g., a large plastic object hurled into one’s path), PRT values can be as high as at least 1.5 seconds (Rice and Dell’Amico, 1974; Olson and Sivak, 1986; Fambro et al., 1998).
- During nighttime conditions, particularly in rural areas that are not well-lit, PRT values are closer to 2.5 seconds or higher (Summala, 1981; Triggs and Harris, 1982).
Therefore, driver PRT is determined by several factors that, under certain circumstances, affect one or more of the PRT components. Such factors include the driver’s expectation of the situation or condition (e.g., an object in the roadway), its conspicuity within the larger visual field, the driver’s visual capabilities, and the complexity of the required response. Although these (and other) factors can influence PRT, it is important to note that some are determined more by individual factors (e.g., age) or vehicle factors (e.g., handling), while others are more environmentally determined (e.g., lighting at nighttime). In practice, these factors act in concert, representing a complex relationship between drivers and their perception of the surrounding environment. PRT can also be affected by driver behavior issues such as impairment or distraction, but the discussion here is limited to human factors.
Various design resources conceptualize time differently and provide further guidance on the topic. The “Green Book” reviews some response time literature and provides formulas to calculate sight distance for stopping, passing, decision, and intersection visibility (AASHTO, 2018). The HFG (Campbell et al., 2012) has several guidelines related to response time and also
summarizes much of the “Green Book” material on sight distance. According to the World Road Association’s Human Factors in Road Design, drivers need 4 to 6 seconds to adapt to their normal driving program in case of unusual or complex information processing demands, apart from the standard response time for a sudden need to stop, which they call the “6 Seconds Rule” (PIARC, 2012). According to the authors, drivers would never expect a sudden change without an advance warning 6 seconds ahead. Given this, the authors recommend that when it is not practicable for critical points to be visible 6 seconds in advance, traffic signs or other advance warnings be provided to inform drivers of any critical point ahead (PIARC, 2012). Although this is a useful rule of thumb, it may not account for things like the speed of the vehicle or attention levels at a given moment.
5.2.2 What Factors Influence PRT?
Table 7 summarizes some of the driver and situational/environmental variables that can influence PRT (see also Campbell et al., 2012 and Muttart, 2005). Some of the more relevant factors identified in Table 7 are addressed in further detail in this section.
Expectancy, target conspicuity, and speed selection, which are three notable factors that affect PRT, are discussed in detail as follows.
Expectancy is a crucial component that can vastly impact PRT. In particular, if there is a sudden change in roadway characteristics potentially requiring a driver response (e.g., an upcoming sharp curve or grade, high-volume pedestrian crosswalk, change in posted speed limit, or freeway interchange), then it is reasonable to assume that a driver may not be prepared to quickly respond by braking or steering. Unusual roadway characteristics, such as left-hand freeway exits, may also contribute to increased PRT and crash rates. It is worthwhile to consider these variances in expectation in crash diagnostics and to implement advance warnings or signage in countermeasure selection.
The conspicuity of an object in the roadway will influence the driver’s ability to detect it. Such failures in detection are associated with objects that are off-axis from the driver’s line-of-sight, have diminished contrast relative to their background, and/or are small in size. Visual clutter is another roadway factor that can influence conspicuity and, therefore, PRT. Examples of visual
Table 7. Examples of driver and situational/environmental variables that can influence PRT.
| Driver or Situational Factor | Examples that May Increase PRT |
|---|---|
| Expectancy | Unexpected high-volume pedestrian crosswalk |
| Target conspicuity | Stopped vehicle without hazard lights on |
| Speed selection | Driving above the speed limit when cyclist darts out, even in well-lighted conditions |
| Target location | Pedestrian crossing mid-block |
| Driver fatigue | Overtired driver |
| Cognitive load | Talking on a cell phone |
| Age | Older driver |
| Contrast | Nighttime in a rural area |
| Visual glare | Increased glare from oncoming headlights |
| Familiarity | Novel or unfamiliar neighborhood |
| Visual complexity | Lots of signs, billboards, and lights (i.e., visual clutter) at a busy intersection |
Table 8. Distances (ft) traveled as a function of speed (mph) and time (sec.).
| Time | 15 | 25 | 35 | 45 | 55 | 65 | 75 |
|---|---|---|---|---|---|---|---|
| 1 | 22.0 | 36.7 | 51.3 | 66.0 | 80.7 | 95.3 | 110.0 |
| 2 | 44.0 | 73.3 | 102.7 | 132.0 | 161.3 | 190.7 | 220.0 |
| 3 | 66.0 | 110.0 | 154.0 | 198.0 | 242.0 | 286.0 | 330.0 |
| 4 | 88.0 | 146.7 | 205.3 | 264.0 | 322.7 | 381.3 | 440.0 |
| 5 | 110.0 | 183.3 | 256.7 | 330.0 | 403.3 | 476.7 | 550.0 |
| 6 | 132.0 | 220.0 | 308.0 | 396.0 | 484.0 | 572.0 | 660.0 |
| 7 | 154.0 | 256.7 | 359.3 | 462.0 | 564.7 | 667.3 | 770.0 |
| 8 | 176.0 | 293.3 | 410.7 | 528.0 | 645.3 | 762.7 | 880.0 |
| 9 | 198.0 | 330.0 | 462.0 | 594.0 | 726.0 | 858.0 | 990.0 |
| 10 | 220.0 | 366.7 | 513.3 | 660.0 | 806.7 | 953.3 | 1100.0 |
clutter include multiple, confusing, misleading signage, or a particularly complex intersection or section of roadway.
Speed is perhaps the most obvious influence on PRT; the faster an individual is driving, the quicker they will travel a given distance and the less time they will have to respond to a potential object in the roadway. Table 8 shows how far a vehicle travels as a function of speed and time. For example, a vehicle traveling at 55 mph will travel 80.7 feet in 1 second and 242 feet in 3 seconds. While speed limits influence driver speed choice, these are not the only or the most important influences. In addition to controlling speed by way of strictly enforcing appropriate speed limits (Richard et al., 2018), human factors research reveals that infrastructure elements (e.g., lane width, presence of shoulders, amount and location of vegetation on the roadside) can influence drivers’ speeds, even subconsciously (Campbell et al., 2012). Even though direct speed information is available to drivers via their speedometers, drivers rely on sensory cues from the outside world (e.g., visual, auditory, tactile) to judge their speeds (Campbell et al., 2012). Although certain factors can lead to misperceptions of one’s driving speed (e.g., rural roads without roadside trees can cause drivers to underestimate their travel speed; Campbell et al., 2012), research shows that certain countermeasures can have substantial impacts on actual driving speed. Specifically, drivers select speed using perceptual and “road message” cues. Understanding these cues and the messages they can communicate to drivers can help in establishing self-regulating speeds.
5.3 Key Concepts: How PRT Can Impact Safety Performance
Figures 10–12 provide an example of highway design cues that do not support timely and effective driver decisions and behaviors. In addition, the example highlights how time can interact with both expectations and workload as the driver approaches the decision point after passing complex and sometimes conflicting information from the highway design elements.
Figure 10 depicts the approach to an interchange that sets up some driver expectations for the upcoming interchange and depicts multiple destinations per sign/arrow. Note also that the “Exit Only” lane is indicated on the sign but not by the pavement markings, which can unnecessarily influence PRT.
Figure 11 shows that about 600 ft after the first set of signs, the next overhead sign content is inconsistent with the previous signs in both format and content. From the previous sign in Figure 10, it appeared that City Center would be in the same direction as Seattle (i.e., going North), but Figure 11 has no mention of City Center (or Beaverton). This inconsistency can cause additional workload as drivers attempt to reconcile the inconsistent information as the decision point approaches.
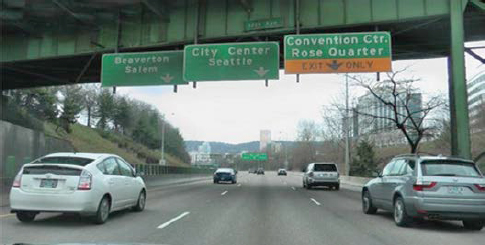
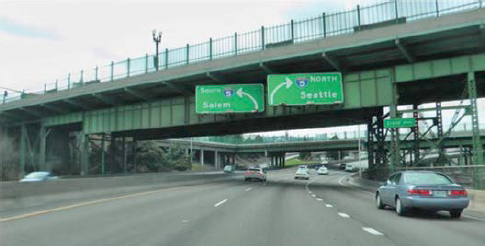
Figure 12 depicts the signs at the interchange, about 500 ft beyond the second set of signs in Figure 11, which is the critical decision point for the driver. This decision point appears with limited warning because of the preceding overpass blocking the driver’s view of the upcoming interchange (see Figure 11). The four signs at the interchange provide a great deal of information for the driver to perceive and comprehend (but which is once again inconsistent with previous signs) within a very short amount of time (approximately a second) before making a maneuver
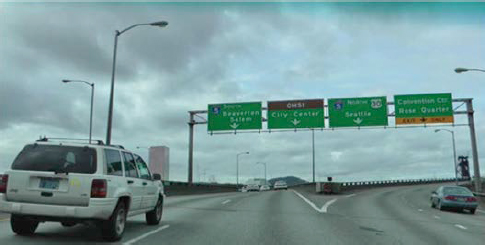
decision and then acting. If the driver is already in the lane that splits, this can likely be accommodated without any kind of abrupt maneuver, but if the driver needs to make a full lane change to go in the right direction (e.g., Seattle), sudden braking and steering maneuvers could impact safety performance.
Key Concepts
- Aiding the driver in ways that give them more time to perceive, decide, and respond to situations and conditions is perhaps one of the most direct ways that the roadway designer can improve safety performance.
- A large body of driver behavior research has helped estimate approximate driver PRT values under a variety of situations; most PRT values seen in the driver behavior research are between 0.5 and 2.5 seconds,
- Driver PRT is determined by several factors that, under certain circumstances, affect one or more of the PRT components; these factors include driver expectations, conspicuity of detected roadway objects, and driver state (e.g., using a cell phone or not).
5.4 Diagnostic Questions Related to PRT
As summarized in this chapter, the amount of time available to respond to a changing driving demand or potential object in the roadway and how drivers use that time are critical components of roadway crashes. Having a better understanding of how concepts such as driver PRT and speed contribute to crashes is crucial to improving diagnostic assessments and ultimately preventing crashes with the implementation of effective countermeasures. When investigating a roadway crash (or crashes), the practitioner can consider different crash characteristics, keeping in mind how many seemingly subtle factors can have profound impacts on a driver’s response time or speed. For example, it is crucial to consider the following:
- Can the driver see the upcoming object with sufficient time to react?
- Specifically, is the encountered object in the roadway clearly visible (i.e., conspicuous) and in the driver’s line of sight, or is it inconspicuous amid visual clutter and therefore detected later?
- For nighttime, is the encountered object retroreflective and in the driver’s line of sight, or is it inconspicuous because of factors such as limited lighting, low-beam headlights, headlamp glare, or physical obstructions such as trees?
- Has there been a change in the roadway, signs, or marking (such as a change in lane width, a new unlit pedestrian crosswalk, or a temporary sign) that may require the driver to make unexpected maneuver decisions?
- Does the signage that alerts drivers to upcoming situations and/or conditions appear in time for them to respond effectively?
- Is there advance signage to give drivers sufficient time to maneuver into appropriate lanes for upcoming highway exits, junctions, and transitions?
- Are the guidance messages on advance signage clear and consistent, such that drivers do not require more time to comprehend the messages?
- Can upcoming intersections be recognized by drivers in sufficient time from all approaches?


