Diagnostic Assessment and Countermeasure Selection: A Toolbox for Traffic Safety Practitioners (2024)
Chapter: 8 Task Demand as a Contributing Factor to Crashes

CHAPTER 8
Task Demand as a Contributing Factor to Crashes
8.1 Objectives
The objectives of this tool are to
- Define workload and task demands as they relate to roadway safety,
- Describe the importance of demand (workload) on road user responses and performance,
- Describe how the demands of the driving task can lead to road user errors and mistakes, and
- Provide diagnostic questions that can aid the practitioner in assessing the demands that a facility places on road users.
8.2 Background and Key Concepts
Workload refers to the demands placed on an individual by a particular task, including effort, complexity, time requirements, and the nature of possible interference between concurrent tasks (Gartner and Murphy, 1979; Gawron, 2000; Angell et al., 2006). Consideration of the demands imposed on a user by a roadway facility is crucial to safety performance, as many crashes happen when the demands of the roadway environment exceed the capabilities of the roadway user. Table 9 provides some examples of situations that reflect this demands versus capabilities pattern and includes human factors issues and aberrant driver behaviors.
Although workload is a multidimensional construct, a useful shorthand for thinking about workload is to consider the time available to complete a task relative to the specific demands of the task; in other words, workload = time/task. While effort and time pressures are key aspects of workload, in the driving domain, workload is frequently described in terms of the following (Richard et al., 2006):
- Perceptual requirements (e.g., detecting and making sense of what is seen, heard, and felt)
- Decision-making/cognitive requirements (e.g., making decisions to go, stop, or turn; integrating what you perceive with things you know, such as rules of the road; or using your previous experience with a roadway facility to help decide what maneuver is appropriate)
- Psychomotor/response requirements (e.g., executing a decision, or taking action such as a driver changing their point of gaze to somewhere else within the visual scene, braking, or changing lanes)
These would include the demands placed on
- Drivers as they approach an intersection (e.g., seeking out the status of the traffic signal, maintaining lane position, and monitoring for pedestrians),
- Pedestrians crossing a roadway (e.g., planning a path and monitoring for vehicles), and
- Bicyclists riding within the lane or on the shoulder of a rural road (e.g., maintaining position, avoiding in-path objects).
Table 9. Examples of how the demands of the roadway environment can exceed the capabilities of the roadway user.
| Situations that Create Strong Demands for Road Users | Ways that Road User Capabilities Can be Exceeded by These Strong Demands |
|---|---|
| Inconsistent signing regarding correct lane selection ahead of a complex interchange on a freeway | There may be a mismatch between formed expectations for lane position and actual required lane, under short time constraints—not enough time to change lanes safely. |
| Low levels of roadway lighting on a 45 mph arterial roadway with a pedestrian crossing mid-block at night wearing dark clothes | There may be insufficient luminance/contrast for many drivers to detect the pedestrian. |
| A vehicle making a left turn from a median lane into a strip mall driveway against heavy traffic from oncoming vehicles that includes bicycles in a bike lane | The driver of the left-turning vehicle is to perceive and track multiple hazards to find an acceptable gap, decide to turn, and then make the turn. This high workload can interfere with detecting other targets, like a pedestrian. |
| A speeding driver on the freeway (85 mph vehicle speed versus 65 mph posted speed) driving in the exit-only lane | The vehicle’s speed may provide insufficient time to react to a suddenly appearing hazard, such as a vehicle attempting to reach the off-ramp through a series of sudden lane changes. |
| A driver looking down at their cell phone on a crowded freeway for extended periods of time | Reduced visual attention to the roadway can lead to a lane drift and a crash with another vehicle. |
| An alcohol-impaired driver approaching a line of slowing vehicles at a construction zone | Alcohol impairment can interfere with the driver’s normal abilities to see, process, and react to slowing vehicles. |
Driving even under the best of conditions is a demanding activity, as drivers are continuously performing several tasks at the same time while often moving at a high rate of speed. These tasks include visual scanning of the environment, perception and identification of task-relevant elements (e.g., other vehicles, pedestrians, traffic signs, and traffic signals), lane maintenance, and speed control. Critically, the driving environment is ever-changing, often requiring relatively high vigilance and attention to these tasks.
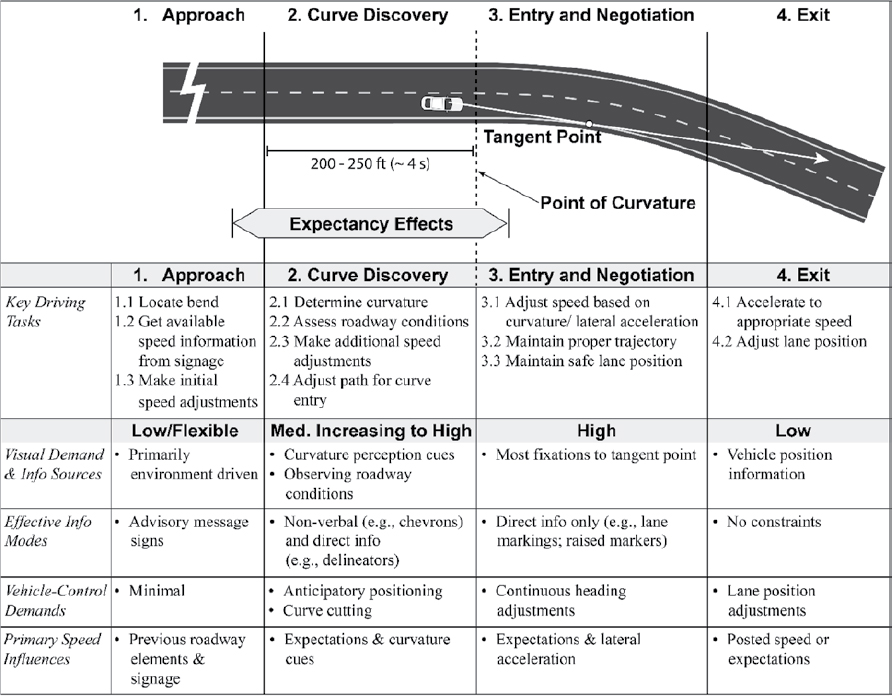
Driver demands associated with navigating a horizontal curve were included in the Human Factors Guidelines for Road Systems (Campbell et al., 2012) and can serve as an example of how consideration of demands can help understand how roadway design impacts performance. Figure 16 describes the activities drivers typically perform while navigating a single horizontal curve. This example shows that certain tasks—like maintaining speed and lane position while entering and following the curve—are more demanding and challenge the driver to pay closer attention to basic vehicle control and visual information acquisition. Also, since the analysis identifies the key information and vehicle control elements in different parts of the curve driving task, it can illustrate how and when driver demands are influenced by design aspects, such as placement of signs, nearby driveways, design consistency, degree of curvature, and lane width. In particular, identifying highly demanding (or high-workload) components of the curve driving task indicates where drivers might benefit from information regarding delineation or the elimination of potential visual distractions.
Assessing the impacts of task demands on workload and user performance has been an integral part of the system development process in other domains for decades. For example, the focus of the United States Army’s Human Systems Integration program is to make sure that all fielded equipment and systems are designed to account for the capabilities and limitations
of users (United States Army, 2014). Rigorous assessment of users’ tasks and their associated workload is a well-understood and routine activity conducted as part of the design and development of tanks, helicopters, military/commercial aircraft, and process control facilities such as power plants.
8.2.1 How Do Demand and Workload Contribute to Crashes?
As discussed above, when the demands of navigating the roadway exceed user capabilities, errors, mistakes, and crashes are more likely to occur. Designers and traffic engineers conducting diagnostic assessments can consider the ways that roadway design and operational decisions could impact driver workload and try to avoid demanding too much of roadway users. Research into the relationships between driver workload and the frequency and severity of crashes makes clear that high driver workload is a significant contributor to driver errors and subsequent safety performance. In a study that links such errors to workload, Wierwille et al. (2002) examined the specific types of errors that lead to crashes through a series of analyses and data collection activities. They cite numerous such errors linked directly to high workload—usually involving visual demand. For example, in the context of discussing driver errors made while turning left at signalized intersections, they note that higher approach traffic speeds,
greater traffic densities, and large vehicles causing greater visual obstructions all make left turns more challenging to the driver. Specifically, there are more information-gathering points for left-turning drivers to sample, more vehicle-to-vehicle closing rates to estimate, and more chances of a missed detection. In the context of discussing errors made during merging maneuvers, Wierwille et al. (2002) note the following:
A merging maneuver is considered to have a high level of driver workload associated with it; therefore, it requires a large amount of driver attention to complete safely. Drivers must be cognizant of traffic in the adjacent lane as they merge. In addition, drivers must judge the gaps between vehicles to be able to merge safely into the traffic flow, while monitoring any vehicle directly in front. A merging maneuver increases in difficulty when the speeds of the vehicles in the adjacent lanes are substantially different. Driver workload also increases when vehicles in adjacent lanes are weaving, that is, vehicles are switching positions between lanes. While a merging maneuver in and of itself has a high driver workload, decreasing the length of the merge lane greatly increases this workload, especially when traffic volume is high. (p. 172)
A concise summary of the problem associated with excess demand in the roadway was provided by Lerner et al. (2003):
Drivers are frequently confronted with a multitude of information displays, which they must perceive, comprehend, and evaluate while they are simultaneously controlling their vehicles, monitoring other traffic, dealing with distractions, and navigating to a destination. In most metropolitan areas, one can readily find examples of freeway sites where within a few minutes of driving time there are dozens of elements of route guidance information, in addition to other information sources and distractions. The need for signing is frequently associated with complex traffic operations, geometrics, or potentially hazardous situations, so that the information load confronting the driver is often greatest when the demands of vehicle control, guidance, and crash avoidance also impose their greatest workload. When drivers are confronted with more information than they can process, they may decelerate severely or drive too slowly, make late or erratic maneuvers, take an improper route alternative, ignore critical information, fail to monitor other traffic, or have excessive episodes of eyes-off-the-road time. These behaviors have obvious safety and operational consequences. (p. 4)
In short, the workload imposed by infrastructure features on road users matters because mismatches between the demands imposed by the infrastructure and the capabilities of road users can lead to driver errors and crashes.
8.2.2 Identifying Task Demands and Workload Across Different Roadway Facilities
Workload is a challenge to measure, in part because it reflects characteristics inherent to the individual being measured—such as experience, ability, age, and so forth—but also because it depends on task- and environment-specific characteristics that influence demand and difficulty.
More detailed procedures are provided for measuring demands in Chapter 11, but—briefly—several researchers have developed workload assessment methodologies aimed at the safety practitioner. For example, Messer et al. (1979) emphasized the relationship between roadway features and driver workload, noting that workload increases
- With the increasing geometric complexity of highway features perceived to be potentially hazardous,
- With speed and reductions in sight distance for a given amount of work to be performed over a section of roadway, and
- For motorists who are surprised by the occurrence or complexity of geometric features.
Specifically, such situations will require more time and mental effort to decide on an appropriate speed and path. Using Messer’s approach as a starting point, Krammes and Glascock
(1992) studied the statistical relationship between geometric inconsistencies and driver workload and found that driver workload measures could be good predictors of crash experience on two-lane rural highways (Messer et al., 1979). More recently, Tignor (2022, 2023) presented an approach to quantifying the frequency of infrastructure demands placed on road users by road designers. His focus is on elements of the infrastructure that users must interact with and respond to, including time between driveways, alternating curve and tangent renewal times, alternating horizontal and vertical curve renewal times, time spacing of warning and regulatory signs by direction, percent grades and grade travel time, and percent horizontal curve and travel time. Tignor’s approach focuses on simple counts of these roadway elements—or workload “ticks”—to quantify workload as a function of roadway segments. Thus, he focuses on roadway elements beyond geometrics and simplifies the methodology for easier day-to-day use by the practitioner. Tignor’s approach, in particular, focuses on assessing (1) static infrastructure elements within fixed roadway segments such as driveways, intersections, signs, changes in geometry, and transitions as well as (2) dynamic elements such as the number and movements of other road users, and typical vehicle speeds.
Access locations and associated access activities (e.g., entering and exiting vehicles, left turns and crossing traffic, freeway ramps, high-occupancy vehicle activities) are especially useful to account for as they are a chief source of dynamic conflicts and therefore increase task demands on the part of drivers who have to perceive and react to these access locations and related road user movements.
The nature and source of high task demands will vary considerably across different roadway types and driving conditions. Table 10 shows some typical roadway types and highlights features that could increase demands.
Related to time is the need to consider the effect of concurrent tasks on workload and the possibility of interference between competing demands on information processing resources. Road users have a finite amount of mental resources available to meet the demands of driving, walking, or cycling. These resources can be thought of as a “pool” of mental capability that is used to meet a variety of mental operations, from the visual processing required to comprehend a single road sign to the more complex processing required to extract meaning from a scene such as a crowded, multi-lane urban intersection.
This shared pool of resources is allocated across different tasks, modalities (e.g., visual and auditory), and processing requirements (Wickens, 2008). Interference between concurrent tasks reflects basic human limitations; for example, drivers cannot look at two separate locations in the visual field at once, and drivers have difficulties listening to navigation instructions while carrying on a conversation with a passenger. Concurrent tasks that “pull” from the same mental resources can interfere with operator performance on one or both tasks. This understanding of finite mental resources helps explain how very difficult individual tasks (e.g., making a left turn across traffic) can run into processing difficulties (e.g., high visual demand) and how multi-task performance is more likely to be hampered by performing similar tasks (e.g., looking at and manually tuning a radio while needing to monitor the forward roadway) than by performing dissimilar tasks (e.g., merely listening to the radio while driving).
In the driving environment, drivers often have concurrent and competing demands. For an example of competing for visual demands, consider a driver having to change lanes on a crowded freeway to reach an exit lane. The driver must balance the need to visually check traffic in adjacent lanes while visually tracking the location of the exit. From a response perspective, the driver may be making steering wheel inputs while adjusting speed. In general, higher demand is associated with multiple, concurrent demands that compete for the same mental resources.
Table 10. Roadway elements that can increase demands on road users (photos by Samuel Tignor, 2021; used with permission).
| Roadway Types | Elements That Can Increase Demands on Road Users |
|---|---|
Interstate Highways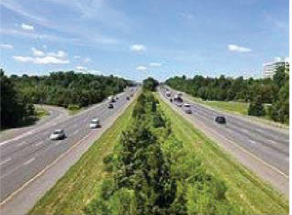 |
|
State Routes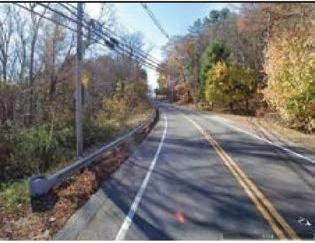 |
|
Rural Roads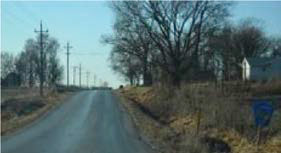 |
|
Urban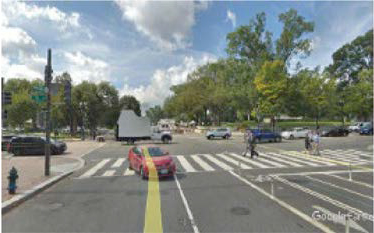 |
|
City Center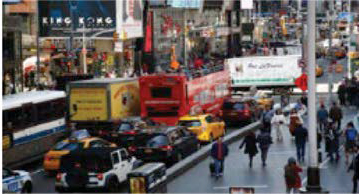 |
|
Individual characteristics play a role in workload considerations as well. Consider an older driver with reduced perceptual capabilities (e.g., difficulties seeing at night) or reduced physical capabilities (e.g., slower braking response). Certain situations might place higher demands on that older driver, leading to a higher workload relative to a younger driver. However, differences in skills and abilities across drivers play a role as well. A highly-skilled driver may experience less workload than a lower-skilled driver when navigating a particular section of roadway for the first time.
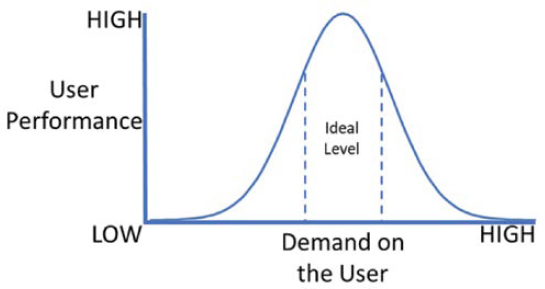
Overall, whether because of task difficulty, time demands, interference between competing mental resources, or individual differences (or some combination of these factors), consideration of the demands a facility places on road users is key to evaluating safety performance. Road-user errors are more likely to occur when the demands of the roadway environment exceed the capabilities of the roadway user. While overload is the most common problem faced by road users (as seen in the examples in Table 10), this mismatch between demands versus capabilities can occur when the demands are too high or too low. Figure 17 shows the general relationship between task performance and task demands. As seen, performance can be impacted when the workload is high (e.g., having to read many critical guidance signs in a short period) but also when it is too low (e.g., driving along a straight highway with little traffic for long periods) if road users become bored, unengaged, or complacent.
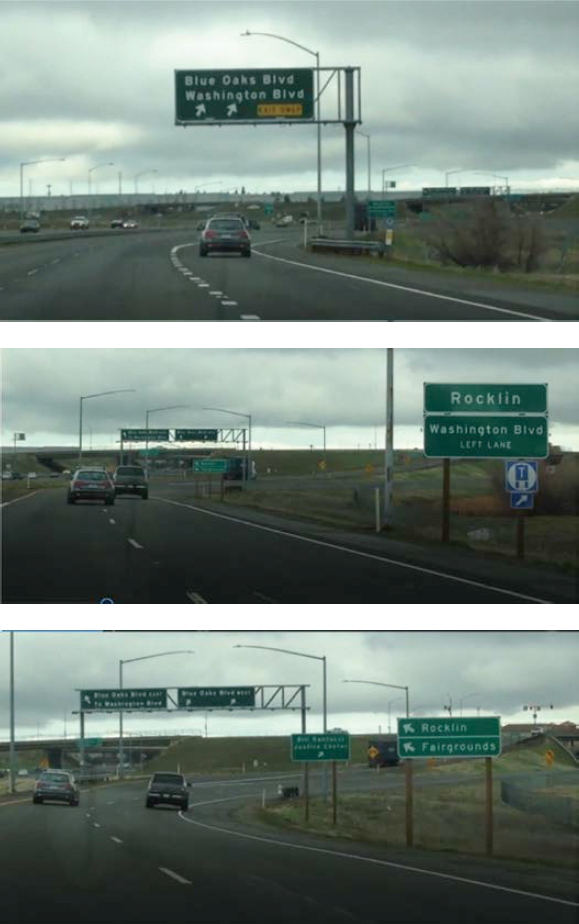
8.2.3 Example of How High Workload Can Impact Safety Performance
The sequence of photographs in Figure 18 provides an example of roadway features at a freeway offramp that can lead to high levels of driver workload and impact safety performance. The signs depicted in the top photograph indicate that either of the two right-most lanes may be used for both Blue Oaks Boulevard and Washington Boulevard. The middle photograph, however, shows that, of these two lanes, Washington Boulevard can only be accessed by the lane on the left. The third photograph depicts some additional signage to the right and a final set of overhead signs to be comprehended if the driver needs to decide about going westbound or eastbound on Blue Oaks Boulevard. Overall, this offramp presents a driver with a great deal of information to perceive, comprehend, and react to, which may be challenging for a driver unfamiliar with this location to process. This example combines issues with setting up incorrect expectations (the message on the first sign) with strong demand in the form of information overload through many signs presented in a short period.
Key Concepts
- Many crashes happen when the demands of the roadway environment exceed the capabilities of the roadway user.
- A useful shorthand for thinking about workload (or demand) is to consider the time available to complete a task relative to the specific demands of the task; in other words, workload = time/task.
- Practitioners conducting diagnostic assessments can consider the ways that roadway design and operational decisions could impact driver workload and try to avoid demanding too much of roadway users.
8.3 Diagnostic Questions Regarding Demand and Workload
- Consider all demands within the context of available time and speed—do posted speeds allow for enough time to meet individual demands?
- From the crashes/conflicts observed, are there any patterns that would indicate that workload was a contributing factor? Are there any discernible patterns between or among crashes/conflicts and crashes/conflicts involving serious injuries or fatal crashes that could relate to demand?
- Within the facility, are there any possible sources of confusion for a road user trying to extract information from the road geometry and traffic control information? Specifically, is there consistency and meaning to the collective use of geometrics, signs, markings, and traffic control devices that road users rely on?
- Taking into consideration user tasks and subsequent workload demands, are there any activities that suggest the presence of competing roadway demands that might unduly increase perceptual, cognitive, or psychomotor requirements for the road user?
- Are there any unique environmental or road conditions that substantially increase road user stress, time to perceive and extract roadway information, or time to respond to hazards at conflict points (e.g., short acceleration/deceleration lanes, unexpected roadside hardware placement, quickly narrowed lane widths, significant visibility restrictions, steep grades, and so forth)?
- Are crashes occurring at or near access points (e.g., consider locations of driveways in relation to the intersections, turning traffic, and sight obstructions at driveways)? [Harwood et al. (2010)]
- Are dilemma-zone crashes occurring at intersections because drivers might be having difficulty making stop/go decisions? [Harwood et al. (2010)]
- Are crashes occurring because of turning drivers failing to detect pedestrians, bicyclists, or scooters? Are there environmental elements at these locations that could be causing distractions? Do pedestrians walk onto the road while waiting to cross moving transit or seeking to catch buses? [PIARC (2019b)]
- Are signs and markings collectively clear, unambiguous, and consistent? [PIARC (2019b)]
- Have unnecessary signs been avoided or eliminated? [PIARC (2019b)]
- Are signs clearly visible when other roadway noise is present (community banners, advertisements, vegetation)?
- Are the movements for all road users, including VRUs, guided clearly and easy to understand? [PIARC (2019b)]


