Diagnostic Assessment and Countermeasure Selection: A Toolbox for Traffic Safety Practitioners (2024)
Chapter: 3 Diagnostic Assessment in the Safe System

CHAPTER 3
Diagnostic Assessment in the Safe System
3.1 Objectives
The objectives of this tool are to provide the following:
- A Safe System approach to help identify potential contributions to crashes and injuries that could be impacting the safety performance of a roadway.
- A process for assessing crash and site data to summarize patterns and findings related to contributing factors.
- Diagnostic questions to help identify crash patterns, crash types, and contributing factors.
3.2 Background
Traditional models of crash causation that take into account potential hazards at various stages may not sufficiently consider the complex and often nuanced relationships between all road users and roadway features. For example, assigning a single, unitary crash-relevant conflict as the proximal cause of a safety-critical event without considering additional contributing factors is a limitation and would not address all the factors involved in the cause of crashes (Dunn et al., 2014). This emphasis on the role of interactions in roadway crashes is well-supported by crash data (Treat et al., 1979). Figure 5 in Chapter 2 shows that while drivers contributed to 93% of crashes, they were the sole cause of only 57% of crashes; the crash percentages in the shaded regions of the figure highlight the role of driver/roadway/vehicle interactions as causal factors in crashes. Similarly, traditional approaches may not address the needs of all road users (e.g., bicyclists and pedestrians) or the pre- and post-crash factors that might influence injury prevention and reduction.
The Safe System approach seeks to create a road environment that maximizes safety performance by not accepting that death and serious injury are a natural consequence of using a road system (Finkel et al., 2020; Signor et al., 2018; Welle et al., 2018). Rather than relying primarily on improving human behavior, this approach seeks to plan, design, and operate a road system that recognizes humans make mistakes, have limited physiological abilities to safely negotiate complex situations, and have a limited tolerance of kinetic energy forces. The Safe System approach incorporates five elements: safe road users, safe vehicles, safe speeds, safe roads, and post-crash care. The fifth “E” (evaluation) should exist at every stage of the safety management process and not just toward the end of the process as part of countermeasure evaluation, meaning that the diagnostic process should be considered an evaluative activity.
A goal of this approach is to create a system that reduces the risk of kinetic energy transfer occurring in the first place and reduces the amount of energy transfer in the event of a crash to an amount that can be tolerated by humans. Part B of the HSM (AASHTO, 2010) provides methods for network screening and crash diagnosis to understand potential contributing factors
and identify treatments and methods for selecting and prioritizing projects. The HSM does support an approach to crash diagnostics that would reveal multiple contributing factors. However, it provides few procedures for assessing a broad range of driver/roadway interactions and does not incorporate the holistic approach envisioned by Safe System. The systems approach advocated by Safe System applies not just to planning and design activities, but also to the procedures for diagnosing crashes and identifying focused countermeasures to address them. In short, holistic design and countermeasure selection require a holistic approach to crash diagnostics.
3.3 Key Concepts: A Safe System Approach to Diagnostic Assessment
William Haddon developed the Haddon Matrix to improve emergency responses for people injured in crashes and provide a technique and tool for looking at factors related to personal attributes, vehicle attributes, and environmental attributes before, during, and after an injury or death (Haddon, 1972; Haddon, 1980). The goal of applying this type of tool is to help the practitioner think about and list the individual road user, vehicle, and environment factors (and any possible interactions) that could contribute to driver confusion, misperceptions, high workload, distraction, or other problems and errors. Research studies and governmental investigations have applied the Haddon Matrix to roadway crash causation to generate ideas on crash prevention and countermeasure implementation.
Haddon’s epidemiological view of injury outlines three phases: (1) A pre-crash phase with those factors that influence whether a crash will occur and result in injuries; (2) A crash event phase with those factors that influence injury severity during the crash event; and (3) a post-crash phase with those factors that influence the survivability of the crash after the event (for a summary, see also: Haddon, 1972; National Committee for Injury Prevention and Control, 1989). Haddon’s original matrix included examining contributory factors to these phases according to human, vehicle, environmental, and socioeconomic factors. To augment this approach, Milton and van Schalkwyk (J. Milton and I. van Schalkwyk, personal communication, January 17, 2022) have developed a framework that considers all road users (e.g., the volume of biking and walking) and the supporting social safety environment. Consistent with the Safe System approach, it includes user-mix considerations and interactions between these factors (see also the HFIM in Campbell et al., 2018). Table 5 shows a Modified Haddon Matrix (developed by John Milton and Ida van Schalkwyk of the Washington State Department of Transportation and used with their kind permission) applied to crashes in the Safe System.
This modification of the original Haddon and Human Factor Interaction Matrices aims to present a framework that more directly considers all road users and the supporting social safety environment. In doing so, these characteristics are highlighted to provide safety professionals an expanded view of the issues related to human factors within the Safe System approach.
By introducing social environment factors, safety professionals are asked to consider the implications of attitudes, biases, and equity decision-making frameworks for humans operating in the roadway environment. Doing so expands the potential diagnostic assessments that safety professionals perform. It considers laws intended to reduce potential severity (Signor et al., 2018) or the frequency of crashes and the road user’s willingness to accept those laws to process the importance of understanding their current situation (e.g., high level of speeding, drinking/ drugs, mid-block crossings) and how these can be used to address potential safety outcomes. Furthermore, equity is considered since it may not be correct to assume accessibility to vehicles or to personal protective equipment (PPE), especially within a particular location (e.g., a lower-income and overburdened community) where road users may not have the income to purchase a vehicle or a bicycle helmet. Moreover, in their respective community, sidewalks and pedestrian lighting may not exist, leading to lower levels of safety and security.
Table 5. Modified Haddon Matrix applied to motor vehicle crashes in the Safe System.
| Factors | ||||||
|---|---|---|---|---|---|---|
| Phases | Human | Vehicle | Physical Environment/Context | Social Environment | User-Mix Considerations | Interactions Between Users |
| Pre-event(Before the crash occurs) Factors that may increase the likelihood of the crash before the crash event |
|
|
|
|
|
|
| Event (During the crash) Factors that may influence the injury or severity of the crash during the crash event |
|
|
|
|
|
|
| Post-event(After the crash) Factors that may influence the survivability of the crash after the event |
|
|
|
|
|
|
Note: A blank template of this matrix is available in Chapter 12.
Most often, road-user mix is not an explicit consideration in safety decision-making. The Modified Haddon Matrix is intended to help practitioners assess all road users’ perspectives—not just those of vehicle drivers—and to consider how decisions are made by those walking, biking, or rolling on the road. It is also intended for the safety professional to consider potential human factors related to the relationship between vehicle drivers and VRUs (e.g., difficulties associated with judging closing speed and distance or that a VRU may not be recognized, seen, or reacted to).
3.4 A General Tool and Process for Diagnostic Assessment
A diagnostic assessment process that incorporates holistic elements is not markedly different from the diagnosis procedures traditionally used by practitioners and documented in sources like the HSM (AASHTO, 2010) and the HSM/HFG Primer (Campbell et al., 2018). It explicitly incorporates not just general consideration of road users but also
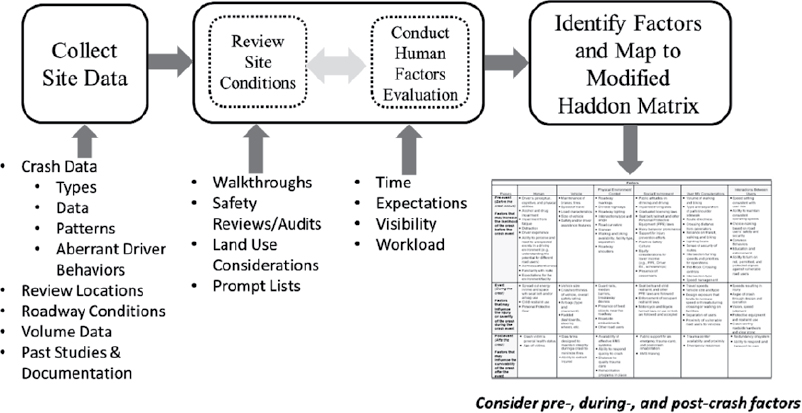
- Considers pre-, during-, and post-crash factors that might have contributed to the crash itself, as well as post-crash survivability;
- Addresses specific issues related to the role of expectations, visibility, workload, and perception-response time in crashes; and
- Produces a detailed summary of possible contributing factors as well as their likely interactions.
The discussion in this section and the steps depicted in Figure 7 are adapted from Primer on the Joint Use of the Highway Safety Manual (HSM) and the Human Factors Guidelines (HFG) for Road Systems (Campbell et al., 2018) that was developed to provide the practitioner with information from both the HSM and the HFG to aid in assessing the contributing factors to crashes and selecting countermeasures.
In addressing the information in the Modified Haddon Matrix (Table 5), the objective is to consider and document the possible road user, vehicle, and environment issues that could contribute to confusion, errors, and crashes at the site or traffic situation that is under evaluation. While addressing a broader range of pre-, during-, and post-crash factors is desirable and supportive
of Safe System, valuable information supporting possible countermeasures can be obtained through a more modest analysis of the crash, site, and human factors data. Key inputs to the development process of a Modified Haddon Matrix include
- The basic crash or conflict data compiled in the site visit results (including relevant site data, such as the types of vehicles, cross-section dimensions, traffic volumes, speed limits, and the kind of traffic control),
- Considerations of infrastructure elements upstream of individual crash sites, and
- The crash data summaries.
At this early stage, it is best to generate a Modified Haddon Matrix that includes all possible factors impacting safety performance. Specifically, the matrix should include any factors and combinations of factors (interactions) that could reasonably contribute to the known or suspected opportunities for reducing crash potentials at the site under investigation. Broad considerations should include crash or conflict type, frequency, severity, and contributing factors, as well as on-the-scene observations of the facility and representative traffic movements (including pedestrians, bicyclists, and transit vehicles). In this regard, some interactions may be quantitative and very specific, while others may be qualitative and reflect possible impacts.
The diagnostic process can consider both context classification and functional classification during the identification of contributing factors to crashes. In particular, consideration of the position and type of service being provided by roadways (traditional functional classification), the environment surrounding the roadway, and how the roadway fits into and serves the community and multimodal needs and issues (context classification) can be helpful to crash diagnostics.
Most crashes (or conflicts and near-misses) will result from interactions among two or more of the individual factors. Therefore, identifying known or possible crash- or conflict-relevant interactions will be critical for identifying possible countermeasures. As a virtual road user, carefully think through ways in which the individual factors could—in combination—create confusion, distraction, uncertainties, or misperceptions on the part of actual road users. Document those factors likely to negatively affect driving scenarios and road user behaviors, especially considering the site-specific crash and safety data.
This chapter’s discussion regarding a process for diagnostic assessment is intended to support populating the Modified Haddon Matrix to the extent possible. Figure 7 summarizes this part of the process and is primarily intended to emphasize the importance of considering not just crash and site data but also human factors issues that are often the key contributing factors to crashes. It will also be useful to incorporate aberrant driver behaviors (such as impaired or distracted driving) into the analysis. In this regard, a key activity will be distinguishing driver behavior issues from human factors issues when considering countermeasures (see Chapter 4).
Finally, keep in mind that solutions (in the form of countermeasures or treatments) are not being sought at this stage. The focus here is on thinking like a virtual road user and identifying and understanding those roadway components that could contribute to confusion, poor visibility, misperceptions, high workload, distraction, or other potential road user errors at a particular site.
3.4.1 Collect Site Data
- Compile the data necessary to assess the traffic safety performance at the intended site quantitatively and qualitatively.
- The three critical types of data needed for this process include crashes, traffic volumes, and recent projects that might impact crash potential (e.g., lane widening projects, horizontal curvature, or the installation of new sidewalks).
- Obtain crash data.
- Crash data is commonly collected at three levels: crash, vehicle, and person. Crash-level data is the most summative and generally includes information describing the crash or facts that apply to all parties involved (i.e., time, location, and highest injury severity in a crash).
- Each crash database has its intricacies and limitations—consider data quality.
- Compile volume data (including recent project site revisions).
- Use volume data with enough information to distinguish important traffic patterns. For example, if an intersection with two-way stop control is being evaluated, it is important to know not just the total volume of the intersection but the major versus minor road traffic and any turning traffic.
- The most recent volume data available should be used. If there was a major change in traffic during the crash analysis period, it might be prudent to use volume data reflecting this change for the appropriate years.
- Any quality issues or known limitations of the crash/conflict data should be described.
- Account for roadway revision projects (e.g., lane widening, changes in horizontal curvature, installation of sidewalks, or new mailboxes and signs) that might have impacted safety performance. Projects occurring within the data analysis period need to be considered for their impact on traffic patterns and safety performance.
- Consider the role of deliberate, aberrant driver behaviors in the crash data, including speeding, distraction, and impaired driving. Chapter 4 may help practitioners distinguish between human factors issues and aberrant driver behaviors.
- The outcome of this activity should be a time-consistent collection of crash, traffic, and project data describing the safety, behavioral, and roadway data relevant to the site.
3.4.2 Review Site and Existing Conditions
- During peak and off-peak hours, visit the site during daytime and nighttime conditions. If a site visit is not possible, Google Maps Street View or Google Earth could be used. Conduct a qualitative analysis of existing roadway, behavioral, and human factors conditions at the site. Visiting the site at a variety of times will help facilitate an understanding of the conditions facing road users under a variety of circumstances. The purpose of these visits is to determine the conditions facing road users and potentially affecting traffic safety. Conditions may include infrastructure, human, behavioral, and operational factors.
- Infrastructure–Focus on the built environment at the site. What is the state of the infrastructure road users are dealing with? Is the infrastructure operating/functioning as intended? Items to consider include pavement and sidewalk condition, sign and marking visibility, presence of dynamic roadway/roadside elements, drainage issues, shoulder condition, vegetation maintenance, properly functioning signals (including pedestrian signals), roadway/intersection lighting, differences, if any, in up-stream geometric or traffic control conditions that may impact user decisions, and so forth.
- Behavioral and Human Factors–How are road users responding to the built environment and traffic within and upstream of the project? Items to consider include drivers’ use of passing or turning lanes, line of sight issues (to both signal and other traffic control devices), bicyclists or pedestrians traveling along the shoulder, pedestrian mid-block crossings, and so forth.
- Operational–How can drivers be better directed and informed to travel more efficiently and with less potential for a crash? Items to consider include large queues from turning traffic, traffic frequently blocking intersections, signal timing, non-conforming signing and marking, cues that might lead to road user indecision, and so forth. Where does the current design include TSM&O strategies as the countermeasures? Consider VRUs and factors
- such as long pedestrian wait times at intersections, no pedestrian signals, limited crosswalks, permitted left turn signals, distances to cross the street, and so forth.
- These site visits are similar to Road Safety Audits (RSAs)—and may be conducted as informal RSAs.
3.4.3 Identify Crash Patterns and Contributing Factors
- Quantitatively describe the safety performance at the site by mode, year, crash type, and contributing factor through an analysis of crash patterns. Police reports are a key part of this, but may not be comprehensive enough for crash diagnostic purposes.
- Understanding crash patterns for the site is crucial for quantitatively assessing the site’s potential for crash reduction. There are several ways to effectively summarize crash patterns, and there is no one correct set of tables or charts to develop. While the quantity, format, and style of the patterns are up to the designer or traffic engineer, it is important to describe the crash statistics clearly and completely by mode, year, and severity.
- Use the number of crashes and the count of injuries for the crash trend analysis.
- Develop a statement of significant patterns and findings based on the totality of the crash/ conflict analysis. The state of significant patterns and key findings should focus on the more severe crashes and look for crash types and contributing factors where the severe crashes are over-represented.
- Some key questions to ask include the following:
- What is the nature of the crashes/conflicts observed? Are there any discernible patterns between or among property damage only (PDO) crashes/conflicts and crashes/conflicts involving serious injuries or fatal crashes?
- What do the most common crash types (e.g., rear-end collisions, run-off-road crashes, and vehicle-hit pedestrians) indicate about the relative contribution of road users, vehicles, and environmental issues to the crashes?
- What are the most common contributing factors cited in the crash records?
- What is the nature of the crashes/conflicts observed? Are there any discernible patterns between or among property damage only (PDO) crashes/conflicts and crashes/conflicts involving serious injuries or fatal crashes?
3.4.4 Conduct Human Factors Evaluation
Chapters 5 to 8 present more detailed discussions of the role of perception-response time, expectancy, visibility, and workload/demand in crashes. The following is a summary of key points related to human factors evaluation.
- Review crash or conflict data summaries and the site visit results to identify possible human factors issues for consideration in developing robust, science-based safety countermeasures.
- A human factors evaluation of a specific roadway site should start with understanding the human factors approach to driving and road safety performance. Several data sources could aid this assessment, including PIARC (2012), Theeuwes and van der Horst (2012), and Campbell et al. (2012). At its core, this approach considers and accounts for road user needs, capabilities, and limitations in (1) the design and operation of roads, vehicles, and pedestrian/bicycle/transit facilities, and (2) the identification of causal factors underlying conflicts and crashes.
- The road-user factor most often includes capabilities and limitations related to expectations, visibility, workload/demand, and perception-response time. It may also include driver attributes that influence capabilities and limitations such as age, training, and road familiarity. The environment factor includes elements such as road geometry, traffic control devices, and the luminance levels of signs and markings. The vehicle factor includes automobile and truck components such as tires, brakes, or special safety systems.
- Safety performance reflects how well these components (i.e., road user, environment, and vehicle factors) interact and work together to support road users’ full and accurate extraction
- of information and understanding of environmental cues and emerging situations that lead to effective decision-making by those road users.
- Some key questions to ask include the following:
- From the perspective of a road user (both the typical road user as well as a road user who may be older or impaired in some way), what might be some sources of confusion when trying to extract the most meaningful information (MMI) from the road geometry and traffic control information?
- In general, is there consistency and meaning to the geometrics, signs, markings, and traffic control devices that road users rely on?
- How might unique issues associated with vehicle type contribute to crashes or conflicts?
- For example, does vehicle size play a role in how well the driver or road user can see signs, markings, and other road users, or how well the driver can navigate through a roadway with narrow lanes and no shoulders?
- Are there any unique environmental and road conditions that substantially increase road user stress, comprehension time to roadway information, or response maneuvers to hazards at conflict points?
- Examples may be short acceleration/deceleration lanes, unexpected roadside hardware placement, quickly narrowed lane widths, significant visibility restrictions, steep grades, and so forth.
- Are there any unclear or misleading cues between the roadway and the user?
- Such cues may be the lack of a timely presentation of geometric, signing, or pavement marking information, or a conflicting presentation of such information. Examples include using non-standard or non-maintained lanes or shoulders, less than standard sight distance for conditions, or less than standard distance for acceleration or deceleration of the vehicle or situations where the speed differential is more than 15 mph.
- Consider not just the factors present at the exact time of a crash but also factors or events that could have occurred before the crash interactions.
- From the perspective of a road user (both the typical road user as well as a road user who may be older or impaired in some way), what might be some sources of confusion when trying to extract the most meaningful information (MMI) from the road geometry and traffic control information?
At this early stage, it is best to generate a Modified Haddon Matrix (e.g., Table 5) that includes all possible factors impacting safety performance. Specifically, the matrix should include any factors and combinations of factors (interactions) that could reasonably contribute to the known or suspected opportunities for reducing crash potentials at the site under investigation. Broad considerations should include crash or conflict type, frequency, severity, and contributing factors, as well as on-the-scene observations of the facility and representative traffic movements (including pedestrians, bicyclists, and transit vehicles). In this regard, some interactions may be quantitative and very specific, while others may be qualitative and reflect possible impacts. As indicated in the matrix in Table 5, pre-, during-, and post-crash factors should be included in the analysis.
The diagnostic process should very much be considered to be an evaluative activity, as the fifth “E” (evaluation) should exist at every stage of the safety prevention process and not only toward the end of the process as part of countermeasure evaluation. Planners, designers, safety analysts, and so forth play different roles throughout the safety prevention process, and thereby the evaluative perspective of why the crash happened and how to select countermeasures is gathered and used as input at every stage.
3.4.5 Next Steps
The Modified Haddon Matrix generated during this process should yield several contributing factors that can serve as a starting point for design revisions or countermeasure selection.
Chapter 9 discusses how to link these contributing factors to countermeasures so that the countermeasures that are selected and implemented are more likely to address actual issues
associated with a set of crashes; Chapter 10 provides a series of decision trees to aid the selection of specific countermeasures.
However, most users of this toolbox may benefit from additional information to aid and sharpen their crash diagnostic process. Chapters 4 to 8 provide more details on key human factors issues (i.e., mismatches between the capabilities and limitations of road users and the demands placed on them by a particular roadway) as well as focused diagnostic questions to assess these issues.
Key Concepts
- Adopting a Safe System approach to diagnostic assessment will help the practitioner (i.e., designers, traffic engineers, and others) assess a broad range of driver/roadway interactions and incorporate a holistic approach to identifying the contributing factors to crashes.
- This does not require a re-invention of crash diagnostics—a Modified Haddon Matrix provides a framework for diagnostic assessment that more directly considers all road users and the supporting social safety environment and is consistent with Safe System principles.
- Looking at interactions as part of the diagnostic assessment process is crucial: most crashes (or conflicts and near-misses) will result from interactions among two or more of the individual factors. Therefore, identifying known or possible crash- or conflict-relevant interactions will be critical for identifying possible countermeasures.


