Diagnostic Assessment and Countermeasure Selection: A Toolbox for Traffic Safety Practitioners (2024)
Chapter: 11 Procedures for Assessing Road User Demands

CHAPTER 11
Procedures for Assessing Road User Demands
11.1 Quantifying Workload in Driving Tasks
Description. Practitioners can use this diagnostic method to identify the key elements of the driving task that shape the demands placed on the road user. This chapter provides step-by-step procedures for conducting workload analysis for a given roadway segment and driving task and shows how these methods can be adapted based on the scope and resources allocated toward this effort. Examples are provided to explain how to translate the results of these analyses into recommendations for revising roadway elements and traffic operations.
When to use: Driver errors occur because the demands of the driving task—the workload imposed on the drivers—exceed the driver’s capabilities, especially when time is limited. As noted in Chapter 8, a useful shorthand for thinking about workload is to consider the time available to complete a task relative to the specific demands of the task; in other words, workload = time/task. Task analysis and workload assessment techniques can help practitioners answer basic questions about their roadway involving driver perception and behaviors (e.g., what is the roadway communicating to road users? How are drivers likely to respond?). The resulting information can help diagnose existing issues while reviewing environmental conditions, identifying crash patterns, and supporting countermeasure selection as part of the cost-benefit analysis of treatment or new design options. These techniques may also be used to support network screening and RSA activities. Both task analysis and workload assessment are established and well-documented techniques. Key data sources used to quantify workload-driving tasks include Richard et al. (2006), Tijerina et al. (1995b), Tignor (2022, 2023), and Messer (1980).
11.2 Introduction
The objective of this tool is to help practitioners assess roadway design and operations and to identify elements that impose a high demand on drivers. These methods aim to consider what a roadway requires of drivers and include at the very least the number of static and dynamic elements that require the driver’s attention, comprehension, decisions, and potential action. The methods described in this tool are intended to help quantify the relative demand of the built environment. For example, the tool can be used to assess the differences between a minimally signed rural road with no access points versus one with multiple access points and extensive roadside signage; specific roadway contexts (e.g., illumination, geometry, and driver differences) can also be included in the analysis.
It is suggested that practitioners carefully read the material presented in sections 11.2.1 to 11.3 of this chapter because they provide the computational components that are used in the working example given in section 11.5 of this chapter.
11.2.1 What Is Workload?
Workload can be defined as the demands placed on an individual (e.g., drivers, pedestrians, bicyclists) by a particular activity, including effort, task complexity, time requirements, and the nature of possible interference between concurrent tasks (see Gartner and Murphy, 1979, Angell et al., 2006, and Gawron, 2000). Chapter 2: Human Factors of the HSM (AASHTO, 2010), discusses driver workload and human information processing limitations.
Workload is an internal construct—similar to attention—that describes the relationship between the demands of a task within an operating environment and the capabilities of the user or operator. In a roadway safety context, workload reflects the cumulative effect of specific demands imposed on the road user by the requirements of a specific task. These would include the demands placed on
- A driver as they approach an intersection or complex interchange,
- A pedestrian crossing a roadway, or
- A bicyclist riding on the shoulder or in a lane on a rural road.
For example, to complete their tasks, drivers, pedestrians, and bicyclists continuously perform several more granular subtasks at the same time, reflecting the multidimensional nature of travel. These tasks include
- Visually scanning the roadway environment,
- Identifying task-relevant elements (e.g., other road users, vehicles, geometric elements, traffic signs, and traffic signals),
- Maintaining position in a driving lane or a sidewalk, and
- Controlling speed.
Critically, the travel environment is ever-changing, and responsive road users allocate relatively high levels of vigilance and attention to these tasks.
What are some specific examples of these demands? As summarized in Chapter 8, typically the combined effects of three key types of demands are considered: perceptual (e.g., detecting and making sense of what drivers see, hear, and feel), decision-making/cognitive (e.g., integrating what you perceive with things you know, such as rules-of-the-road or your previous experience with a roadway facility to decide what to do), and psychomotor/response (e.g., executing a decision-taking action, that is, changing your gaze to somewhere else within the visual scene, braking, or changing lanes) (Richard et al., 2006).
11.2.2 Workload and Driving Performance
Performance can be impacted whenever there is a mismatch between task/environmental demands and road user capabilities, that is, if workload is too high or too low (see Chapter 8). Generally, though, the issues arise when workload is too high; driver overload is a significant contributor to driver errors and subsequent road safety (Singh, 2015). Road user performance errors might include the following:
- Failure to perceive conditions because of distraction and/or inattention
- Incorrect assumptions about appropriate behaviors
- Failure to respond to demands or hazards in an appropriate and/or timely fashion
- Incorrect action (see also Wierwille et al., 2002)
For drivers, a low workload may increase fatigue, and drivers who are already fatigued may exhibit errors under a high workload because fatigue reduces a driver’s available resources (cognitive resources) (Matthews and Reinerman-Jones, 2017). Determining measures of driver
workload is important to reduce driver error and plan, design, and operate road systems that can tolerate driver error (see Chapter 3: Diagnostic Assessment in the Safe System).
Workload is a challenge to measure, in part because it reflects characteristics inherent to the individual being measured—such as experience, ability, age, and so forth—but also because it depends on task- and environment-specific infrastructure elements that influence task demand and difficulty. Specifically, measuring workload requires an activity to quantify; thus, task analysis and workload measurement go hand-in-hand.
Three different approaches to measuring workload that vary in terms of their complexity and focus are discussed in this chapter. There are relatively few studies that have examined workload in the roadway context, and those studies have focused on driver workload. Thus, much of the discussion focuses on drivers and driver activities. However, the same general principles and procedures used to assess workload for drivers can be used to assess workload for pedestrians and bicyclists.
As discussed in Chapter 8, task and workload analyses are routinely conducted during the development and design of many human-machine systems, especially military systems. In this regard, a favored approach to assessing workload that has been used in the past in the aviation domain is the Task Analysis/Workload (TAWL) technique (Hamilton et al., 1991). It is especially useful for assessing and analyzing workload in situations where other measures of workload (e.g., direct measures of performance or subjective measures from actual users) are unavailable or otherwise impractical to obtain. Some key benefits of the TAWL approach are that it connects workload estimates to the mental and physical requirements of specific tasks associated with the activity. Thus, the approach supports the identification of design alternatives that could lower workload.
Originally developed to assess workload for helicopter pilots, the TAWL technique involves the successive decomposition of a scenario (e.g., making a left turn at a signalized intersection) into segments, tasks, and subtasks, with specific information processing requirements and workload estimates developed at the subtask level. Critically, the application of these techniques requires no formal training in psychology, human factors, or the measurement or analysis of workload. This approach has been used to conduct workload analyses for the FHWA (Richard et al., 2006) and is discussed below as the Direct Driver Measurement, Task Analysis, and Relative Workload approach (see section 11.3 of this chapter).
However, the decomposition of tasks into subtasks does not directly provide information about the relative demands of the driving task that can impact driving performance. Three key task elements relating to the context of a specific roadway are relevant to measuring and analyzing workload:
Task Time: In the driving context, many tasks are time-limited based on speed, with greater speeds translating into reduced task time. Generally, more difficult tasks take more time to complete, and generally, reduced time to complete tasks translates into a higher workload with possible impacts on driver performance and safety. Road users can make trade-offs between task time and accuracy (e.g., a driver coming to a full stop at a stop sign) (Angell et al., 2006). Related to this is the “time window” a user has to complete a task. Within the time window, tasks can be
- Forced-paced, where task timing and execution are mostly determined by factors outside of the driver’s control, or
- Self-paced, where the driver is mostly in control of task timing and execution (Richard et al., 2006).
In the case of a driver making a left turn across the path, the driver’s task includes finding an acceptable gap in the opposing traffic and then turning. This task is forced paced if the driver is
forced to act within a tightly prescribed time window (e.g., making a left turn across traffic as the traffic signal changes from yellow to red). On the other hand, this task is a self-paced task if the driver has more control over the timing of the task (e.g., making a left turn across traffic at an uncontrolled intersection).
Task Concurrency: Road users have a finite pool of mental resources (see Chapter 2) that can be applied to the travel tasks at hand such as catching a bus, driving on an urban street, or riding a bicycle along a trail. In general, a higher workload is associated with multiple demands that compete for the same mental resources (e.g., multiple signs on both sides of the street at the same location competing for the driver’s visual attention). Interference between concurrent tasks reflects basic human limitations; for example: (1) drivers cannot look at two separate locations in the visual field simultaneously and (2) their ability to attend to navigation instructions while carrying on a conversation is degraded. Concurrent tasks that draw from the same mental resources can interfere with operator performance on one or both tasks. This understanding of flexible but finite mental resources helps explain how challenging single-tasks (e.g., making a left turn across traffic) can run into processing issues and how dual-task performance is more likely to be hampered by simultaneously performing similar tasks (e.g., looking at and manually tuning a radio while driving) than by simultaneously performing dissimilar tasks (e.g., merely listening to the radio while driving).
Individual Differences: Driver populations may experience different levels of workload along a similar stretch of roadway because of their capabilities, expectations, and driving skills. Consider an older driver with reduced perceptual capabilities (e.g., degraded night vision) or reduced physical capabilities (e.g., slower braking response); certain situations might place higher demands on that older driver, leading to a higher workload relative to a younger driver. Other factors, such as driving skill and familiarity, also play a role; a highly skilled driver may experience less workload compared to a less-skilled driver when navigating a particular section of roadway for the first time. Individual differences (e.g., for the older road user) will often have unique performance implications based on transportation modality (e.g., older driver, older pedestrian, older cyclist).
11.3 Methods for Assessing Driver Workload
Practitioners can answer basic driver perception and behavior questions about their roadway using TAWL techniques (e.g., what is the roadway communicating to road users?). How are drivers likely to respond to specific driving requirements? The resulting information can help diagnose existing issues while identifying crash patterns and supporting countermeasure selection as part of the cost-benefit analysis of treatment or new design options. These techniques may also be used to support network screening and RSA activities.
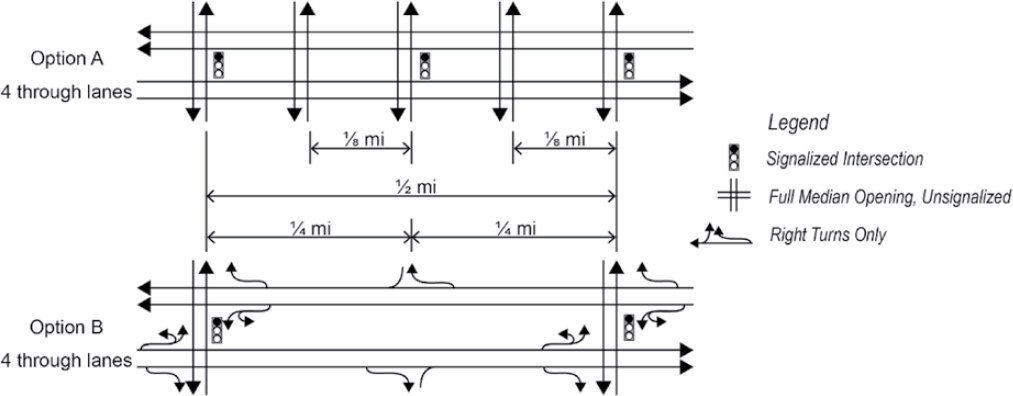
For example, in Figure 103, two roadway designs are being compared during a planning effort. Option A, with a quarter-mile signal spacing, and Option B, with half-mile signal spacing with access control, may be compared based on travel time and travel delay spacings, but they can also be evaluated based on roadway demands. For example, Option B reduces conflict points (i.e., points of potential collision where vehicle paths overlap) and creates greater spacing between conflict areas which helps simplify the driving task and reduces driver workload and travel time.
Figure 104 outlines a sequence of steps that can be used to select a workload measurement method and conduct a workload analysis. There are several options for measuring and modeling workload (see reviews by Gawron, 2000; Matthews and Reinerman-Jones, 2017), and in general, for conducting task analyses. This tool describes three approaches, each with their respective strengths and limitations (see Table 18) and the level of information they incorporate into the workload assessment (see Table 19).
Two of these methods (Approaches 1 and 3) use a hierarchical-task analysis as the basis for the workload analysis (Stuster, 2019). The more robust, empirical approach, Direct Driver Measurement, Task Analysis, and Relative Workload, defines the roadway tasks and associated workload based on actual observations of real tasks completed by real drivers and identifies key “information bottlenecks” and locations and activities where roadway demands can exceed the capabilities of road users (sections 11.3.1, 11.3.2, and 11.3.9 of this chapter). The second approach, Analytical Inventory of Demands based on Roadway Features, enables the practitioner to generate estimates indicating where high roadway demands exist as a proxy for driver overload (sections 11.3.1, 11.3.3, 11.3.4, and 11.3.9). It involves examining the location of roadway elements relative to each other and to the tasks drivers are expected to perform to provide insight into locations or elements that might expose them to roadway demands that they are unable to meet without experiencing degraded task performance (section 11.3.4 of this chapter). The third approach, Analytical Task Analysis and Relative Workload, also identifies information bottlenecks, but rather than requiring empirical data from actual drivers, the practitioner bases their roadway assessment on existing data (perhaps from previously published task/workload analyses), virtual or real drive-throughs on a particular facility, and their own experience (sections 11.3.1, 11.3.3, and 11.3.5 to 11.3.9). Thus Approach 3 replaces empirical data obtained from actual drivers in Approach 1 with some form of expert judgement. The second approach may be completed relatively quickly compared to the first and third approaches, but it may not capture how drivers interact with specific roadway features and may not account for cumulative demands. Specifically, a particular stretch of roadway could be deemed to be high workload using these techniques because it might have many driveways, even though most are highly visible and known to be lightly traveled. Conversely, even a freeway interchange can truly be a high workload if it lacks infrastructure support, such as signs and markings. In short, caution is advised—while counts of key infrastructure elements are an indicator of possible demand, they may not always equate to a higher workload.
11.3.1 Collect Roadway Section Data
Perform a walk-through for the roadway of interest, and document potential hazards (e.g., conflict points), information sources (e.g., signs, traffic control devices), and road characteristics (e.g., horizontal curves, grades, bridges, roadside hardware) along the route. When evaluating
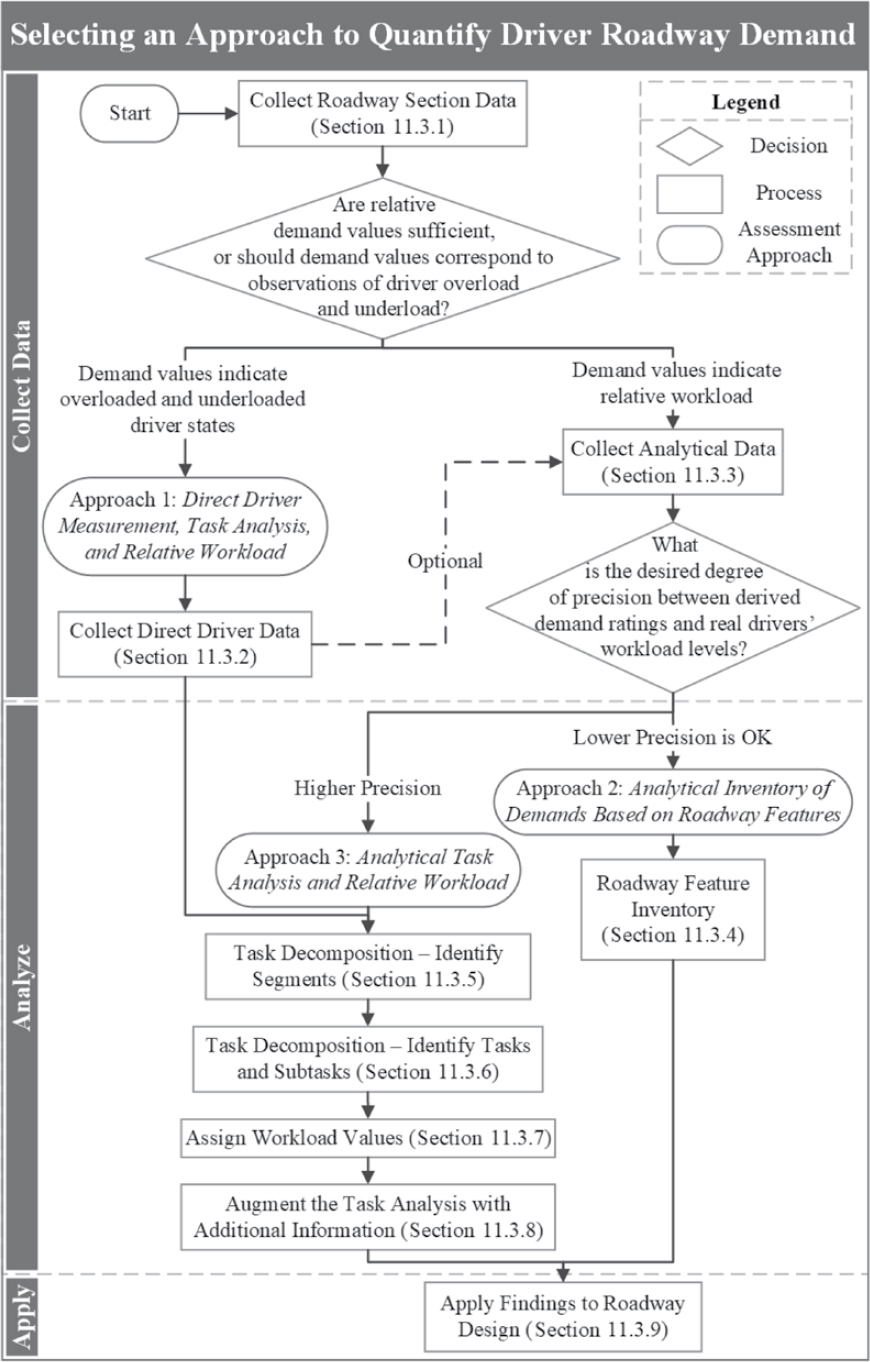
Table 18. An overview of strengths and limitations of each of the three approaches presented in this toolkit for measuring workload.
| Strengths, Limitations, and Examples | Approach 1: Direct Driver Measurement, Task Analysis, and Relative Workload | Approach 2: Analytical Inventory of Demands Based on Roadway Features | Approach 3: Analytical Task Analysis and Relative Workload |
|---|---|---|---|
| Strengths |
|
|
|
| Limitations |
|
|
|
| Examples |
Stuster and Roesch, 2001 Shafer, 1996 |
Tignor, 2022, 2023 Habib et al., 2019 |
Richard et al., 2006 Richard and Lichty, 2013 Hamilton et al., 1991 |
Table 19. Key tasks elements that can be obtained through each of the three approaches presented in this toolset.
| Individual differences and capabilities | Concurrent tasks and competing demands | Time | |
| Direct Driver Measurement, Task Analysis, and Relative Workload (Approach 1) | ● | ● | ● |
| Analytical Inventory of Demands based on Roadway Features (Approach 2) | ◯ | ● | |
| Analytical Task Analysis and Relative Workload (Approach 3) | ● | ● |
Note: ◯ Tool Provides Partial Information
● Tool Provides Significant Information
Blank cells indicate the tool provides little or no information for the respective category.
existing roads, useful data can be gathered by driving the roadway in both directions while recording forward video on a dashboard camera. When evaluating roads that have not yet been implemented (e.g., during a planning activity), practitioners may identify key roadway characteristics from drawings, area photographs, MUTCD design requirements, and videos of roadways with similar facilities. Analytical tools used by the practitioners to collect roadway section data include route maps, existing task analyses for generic road designs, videos, drone footage, internet-based mapping applications (e.g., Google Maps), and photographs.
This is a key step in determining which of the three approaches to measuring workload will be required. As indicated in Figure 104, once these basic data have been obtained, the analyst should determine if relative workload/demand values are sufficient (i.e., Approaches 2 or 3), or if more precise estimates of driver workload are needed (i.e., Approach 1).
11.3.2 Collect Direct Driver Data
Obtaining workload measures directly from drivers is the key distinction between Approach 1 and Approach 3. In Approach 1, the most direct way to identify driving tasks is by observing real drivers driving through a facility and obtaining workload data directly from them based on what they do. Although it requires time and resources to collect such data, the value of this activity is that the practitioner can build a task structure based on real driving tasks, collect objective or subjective data on demand imposed in the specific driving context, and collect information that reflects individual differences across drivers. Direct data collection for workload can be performed on small groups of drivers [e.g., Tijerina et al. (1995b) observed seven drivers in a pilot study and 37 drivers in a follow-up study (Tijerina et al., 1996) where they could account for individual differences]. This analysis also allows the practitioners to observe individual differences between driver groups of interest (e.g., familiar versus unfamiliar drivers and older versus younger drivers) that may be useful for design considerations.
- For example, a specific roadway sign can impose a demand on the driver that depends on the moment-to-moment requirements of the task and
- The sign’s meaning to the driver,
- Driver expectancy,
- Driver experience,
- Driver familiarity with the roadway and road segments, and
- Individual differences in performance capabilities.
The most straightforward option for direct data collection is to use dashboard-mounted cameras to record roadway-facing and driver-facing videos. These videos may be analyzed to identify specific actions drivers take, when drivers are taking those actions, and the general location of visual data sampled by the drivers before those actions. Common tasks and themes may be compared across drivers to form the basis of the task analysis.
As part of this data collection effort, several optional methods exist to measure and model workload (Gawron, 2000; Matthews and Reinerman-Jones, 2017). For example, an eye tracker may provide more granular information about visual cues sampled by drivers, requesting drivers to respond to subjective workload scales after driving or after roadway segments of interest. Similar efforts use the Cooper-Harper Scale (Fitzpatrick et al., 2000) and NASA Task-Load Index (TLX) (Xie et al., 2019). For practitioners with access to the appropriate equipment, collecting data from participants using occlusion goggles in the presence of a safety driver can provide real-time measures of workload based on how frequently participants request visual information via a foot pedal on the floor of the vehicle (Shafer, 1996). Analytical tools used by the practitioners to collect direct driver data include videos, surveys, eye trackers (optional), and occlusion goggles (optional).
11.3.3 Collect Analytical Data
In the absence or as an accompaniment to original data collection, the practitioner can collect data about relevant driving tasks using alternative data sources, including existing literature that describes relevant task analyses and other data sources describing how drivers are expected to complete certain maneuvers to be an attentive driver or what kind of information they may encounter within specific-roadway environments (e.g., state driver manuals, MUTCD). Practitioners may also facilitate task identification by recording driver-facing videos of themselves or project team members driving through a facility. However, a single driver video may be useful to identify tasks, but these observations may not apply to the broader driving population. Analytical tools used by the practitioners to collect analytical data include videos, state driver guides, MUTCD, and existing task analyses.
11.3.4 Roadway Feature Inventory
As noted earlier, the second approach, Analytical Inventory of Demands based on Roadway Features, enables the practitioner to generate estimates indicating where strong roadway demands exist as a proxy for a more driver-based workload assessment. This approach involves examining the location and measurable characteristics of static and dynamic roadway features. Similar to identifying roadway segments, here, the practitioner divides the segment of interest into clusters and non-clusters (i.e., roadway segments between clusters) based on their determination that the geometric and traffic conditions within the clusters are qualitatively different, based on relative counts of the static and dynamic elements, along with exposure time within segments. Static and dynamic feature metrics are examined between all segments of interest (i.e., clusters and non-clusters) to provide insight into locations or elements that might expose them to roadway demands that they are unable to meet without experiencing degraded task performance. This approach may be completed relatively quickly, but it may not capture how drivers interact with specific roadway features and may not account for cumulative demands. Data gathered during the diagnostic process may be augmented with lidar, drone footage, and GPS data, especially for analyzing horizontal and vertical curve parameters (e.g., Habib et al., 2019; Tignor, 2022, 2023).
In this step, the practitioner quantifies the demands placed on road users by the presence of infrastructure elements relative to cluster traversal time and renewal time (i.e., time between clusters). Potential metrics to collect are
- The number of geometric features (e.g., channelized intersections and railroad grade crossings) (Messer, 1980; Habib et al., 2019);
- The time between driveways, curves, and tangents;
- Time spacing of warning and regulatory signs by direction;
- Percent grades and grade travel time;
- Percent next to the guardrail and rock fences;
- Percent horizontal curve and travel time (Tignor, 2022, 2023); and
- The number of conflict and access points (the number and type of conflict points impact safety) (FHWA, 2022c).
These individual metrics may be tabulated and compared between roadway segments or proposed designs. In addition, several ways are proposed in the literature to create aggregate metrics based on pre-determined demand ratings by geometric feature tables (Messer, 1980) or for derived demand ratings (Tignor, 2022, 2023).
While roadway feature inventory approaches are helpful because they explicitly link driver workload to static and dynamic infrastructure features—especially geometric features—they focus on macro features of the infrastructure; they lack, in exchange for simplicity, a detailed
assessment of the specific demands that are placed on the driver by a conjoint set of driving demands for a particular driving maneuver. For example, these approaches do not consider perceptual, cognitive, and psychomotor demands in a time-sequenced manner that would more precisely identify roadway sections with high workload. Thus, a particular stretch of roadway could be deemed high workload through these techniques because it might have many driveways, even though most are highly visible and known to be lightly traveled. Conversely, even a freeway interchange can truly be a high workload if it lacks infrastructure support, such as signs or markings. That is, an increase in infrastructure elements may or may not equate to a higher workload. Simplified approaches may or may not provide diagnostic information that can identify effective countermeasures when the workload is too high. Analytical tools used by practitioners to quantify roadway feature demands include generated roadway segments, optional lidar and GPS data, and workload rating lookup tables (Messer, 1980; Tignor, 2022, 2023).
11.3.5 Task Decomposition–Identify Segments
The roadway being evaluated may be divided into a series of time- or location-based segments, usually three to six per roadway of interest (Richard et al., 2006). Segments generally represent a related set of driving tasks geared toward a common goal or driving objective (e.g., decelerating or executing a turn). Changes in roadway speed may also be used to define segments since changes in driver speed affect time constraints and the rate of information presented from the roadway environment (Richard et al., 2006).
11.3.6 Task Decomposition–Identify Tasks and Subtasks
Driving tasks may be decomposed into successively smaller activities to characterize what a driver does and how they do it. The tasks represent information that needs to be obtained, decisions that need to be made, and actions that need to be taken during a particular roadway segment. The objective of this task decomposition is to identify the relative amounts of workload within a task and the nature of the workload and to establish when drivers might experience workload peaks that could lead to a reduction in driving performance. Task decomposition may be applied to standard roadway designs as well as roadway segments or locations that have unique designs or operational issues.
Task decomposition stops when the tasks and subtasks are decomposed into information processing elements (e.g., perceptual, cognitive, and psychomotor).
Perceptual subtasks involve sensing (e.g., seeing, hearing, smelling, and feeling, as the most common driving task senses) stimuli from the environment, which can range from the simple detection of brake lights to visually inspecting a gauge status to actively searching for a roadway guide sign.
Cognitive subtasks involve decisions and judgments where a driver processes, interprets, or evaluates information they possess to complete a task. Relevant activities can range from basic decisions, like emergency braking, to judging the distance until an upcoming stop sign to judging the distance and speed of oncoming vehicles when making a left turn.
Psychomotor subtasks involve physical actions, such as making simple adjustments to the steering wheel to maintain lane position on a straight road or manually turning a radio dial to find a station, to more complex actions such as the coordinated movements used to change gears when operating a manual transmission. Head and eye movements that support and quantify eye glances are not included since this level of granularity reduces the practicality and efficiency of this method.
Although not all tasks or subtasks identified in the task decomposition will be performed exhaustively by all drivers, these lists indicate reasonable sets of tasks drivers are likely to perform to successfully navigate a section of roadway.
11.3.7 Assign Workload Values
As shown in Table 20, within each task, workload values for subtasks can be assigned based on a workload estimation tool for perceptual, cognitive, and psychomotor information processing demands in driving described in a previous FHWA report (Richard et al., 2006). The total perceptual, cognitive, and psychomotor workload values are summed for each task. These total values were used to estimate the workload that tasks imposed on the drivers during each segment on the roadway of interest. Analytical tools used by practitioners for assigned workload values
Table 20. Workload estimation tool from Richard et al. (2006).
| Estimate (Perceptual) |
Definition (Perceptual) |
Example (Perceptual) |
|---|---|---|
| 1 | Register or detect visual or auditory stimulus; detect motion | Detect brake lights or onset of headlights and register vehicle heading and relative speed. Hear siren. |
| 2 | Discriminate differences in visual or auditory stimuli | Determine traffic signal status. Determine if a sound is car horn or siren. |
| 3 | Visually inspect general viewing/check or listen to sound | Check fuel gauge status. Listen to music. View roadway feature. |
| 4 | Visually locate/align or orient to sound | Determine position of a roadway object or feature. Determine the location from where a siren is coming. |
| 5 | Visually track/follow or monitor | Track a potential hazard (e.g., cyclist approaching on cross street). Monitor the position of a moving vehicle. |
| 6 | Visually read (symbol) | Read an unfamiliar street sign. |
| 7 | Visually scan/search or find object | Search for hazards. Search for street signs. |
| Estimate (Cognitive) |
Definition (Cognitive) |
Example (Cognitive) |
| 1 | Simple, automatic response | Perform emergency braking. Maintain lane. Respond automatically or with conditioned responses (shoulder check during lane change). |
| 2 | Alternative selection | Decide response. Is traffic signal green? Is a vehicle stopped? |
| 3 | Sign/signal recognition | Recognize street sign or familiar intersection or roadway furniture. Determine if-then relationships. |
| 4 | Evaluation/judgment of single aspect | Judge distance to intersection. Determine whether a decelerating vehicle is stopping/time estimation. |
| 5 | Encoding/decoding, recall | Remember instructions or an address. Interpret an unfamiliar traffic sign. Extrapolate posted traffic rules into allowable driving actions. |
| 6 | Evaluation/judgment of several aspects | Judge the safe gap sizes given speed, distance, and traction of oncoming traffic. |
| 7 | Estimation, calculation, conversion | Convert miles into kilometers. |
| Estimate (Psychomotor) |
Definition (Psychomotor) |
Example (Psychomotor) |
| 1 | Simple, feedback controlled, automatic responses | Make steering wheel adjustments for lane maintenance. Head/eye movements. |
| 2 | Discrete actuation | Depress button. Activate signal. Perform emergency braking. |
| 3 | Continuous adjustment | Change extent to which the accelerator is depressed to change speed. Turn steering wheel through a turn. |
| 4 | Manipulative | Tune digital radio. |
| 5 | Symbolic production | Write down instructions. |
| 6 | Serial discrete manipulation | Dial phone number. Use telematics system. |
| 7 | Temporally coordinated unlearned serial actions | Learning to drive a manual transmission. |
include generated subtasks and workload-rating lookup tables (Richard et al., 2006). If Approach 1 is being used, the drivers can provide these workload values during or after the test drives.
11.3.8 Augment the Task Analysis with Additional Information
To create the graphical workload estimation profiles, tasks and subtasks are characterized by temporal limitations and constraints (e.g., time windows, self- versus forced-paced activities, concurrent tasks). In practice, scenario segments may be divided into four to six time intervals representing different periods when each task can occur. The tasks are then arranged into intervals based on the logical precedence of the tasks and whether individual tasks may occur concurrently (similar to the approach seen in Richard et al., 2006). The workload estimates from all tasks within each interval are summed to create the workload profiles. When tasks are self-paced rather than forced-paced, the workload for the task is only summed into the initial segment time interval where the driver could complete it. The purpose of this method is to identify intervals within each scenario where demands placed on the driver are higher relative to other intervals instead of drawing conclusions about driver performance or vehicle safety from the workload values. The rationale is that it will be more difficult for drivers to cope with driving demands during intervals where they attempt more tasks or tasks with a higher difficulty level than during intervals with fewer or easier tasks (Richard et al., 2006). Thus, the workload profiles depict where multiple factors (e.g., forced-paced tasks and high workload) may converge to create potential information processing bottlenecks (Richard et al., 2006).
11.3.9 Apply Findings to Roadway Design
The purpose of these methods is to help support driver safety and performance through facility design. In their implementation of Approach 2: Analytical Inventory of Demands based on Roadway Features, Habib et al. (2019) found that their Workload Index ratings were correlated to observed collision rates on the roadways of interest: for every one-unit increment on the Workload Index, the collision rate increased by 7.1%. A practical application of the information derived from these methods would be to identify (1) locations where complex signage could create roadway demand peaks and (2) locations where signage would support timely driver perception and interpretation of task-relevant information.
The three methods described in this toolset can help place workload in the context of task demands, where task demands refer to the requirements that the facility or roadway segment or a maneuver within the facility or roadway segment places on a road user in terms of perceiving and interpreting the environment, making decisions, and then executing those decisions. Furthermore, Approach 1: Direct Driver Measurement, Task Analysis, and Relative Workload and Approach 3: Analytical Task Analysis and Relative Workload allow for a comparison of task demands to the capabilities of the driver. Using Approach 1, the practitioner may observe real drivers and identify instances of driver overload and underload through direct observational data (e.g., video, eye tracking), subjective data obtained from the drivers (e.g., NASA TLX), or through changes in driving performance (Gawron, 2000; Matthews and Reinerman-Jones, 2017). The practitioner can also determine aspects of demand shaped by
- Driver expectancy,
- Driver experience,
- Driver familiarity with the roadway, and
- Individual differences in performance capabilities.
Approach 2: Analytical Inventory of Demands based on Roadway Features provides a simplified method of estimating workload by road segments.
All three approaches allow the practitioner, with varying levels of precision, to quantify relative demands that drivers are expected to cope with while driving through a facility and
identify parts of the roadway where multiple factors (e.g., forced-paced tasks and high workload) may converge to create potential information processing bottlenecks (Richard et al., 2006). A key limitation of these approaches is that conducting effective workload analyses benefits from some applied experience. However, at a basic level, the purpose of these approaches is to provide practitioners with ways to think about, question, and identify design choices that could place excessive demands on drivers traversing a facility. The outcomes of these methods can serve to help the practitioner consider or address the following questions:
- From the crashes/conflicts observed, do there seem to be any patterns that would indicate that workload was a contributing factor? Are there any discernible patterns between or among PDO crashes and conflicts compared to crashes and conflicts involving serious injuries or fatal crashes?
- What features may impose workload (e.g., signs, traffic signals, dynamic movement of vehicles and pedestrians, watching for hazards, or changing geometric features)?
- Where are potential conflict points and how many are there?
- What expectations may drivers form based on how information is communicated throughout the facility? Can these expectations lead to unintended driver behaviors?
- Within the facility, are there any possible sources of confusion for a road user trying to extract information from the road geometry, infrastructure, and traffic control information? Specifically, is there consistency and meaning, or a lack thereof, to the geometrics, signs, markings, and traffic control devices that road users rely on?
- Taking into consideration user tasks and subsequent workload demands, are there any activities that suggest the presence of information processing bottlenecks (i.e., competing concurrent roadway demands that might cause task interference or unduly increase perceptual, cognitive, or psychomotor requirements for the road user)?
- Are there any unique environmental or road conditions that substantially increase road user stress, provide insufficient time for the road user to perceive and extract roadway information, or respond to hazards at conflict points (e.g., short acceleration/deceleration lanes, unexpected placement of roadside hardware, unexpected quickly narrowed lane widths, significant visibility restrictions, steep grades, and so forth)?
- What design or operational changes could help manage workload or align design intention with driver expectations? Could drivers be provided with more time to perceive and react appropriately to roadway information? Can these issues be mitigated by changes to geometry, signage, and/or traffic operations?
11.4 Working Example of Approach 2: Analytical Inventory of Demands based on Roadway Features
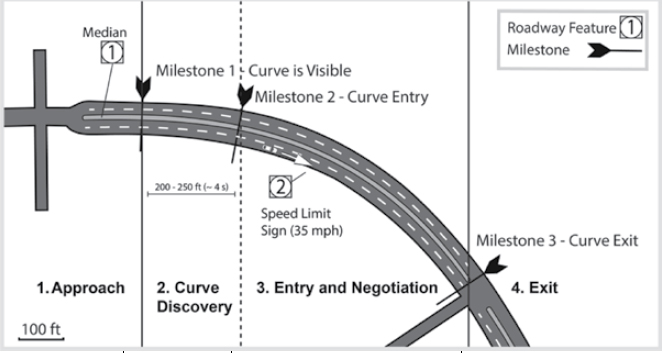
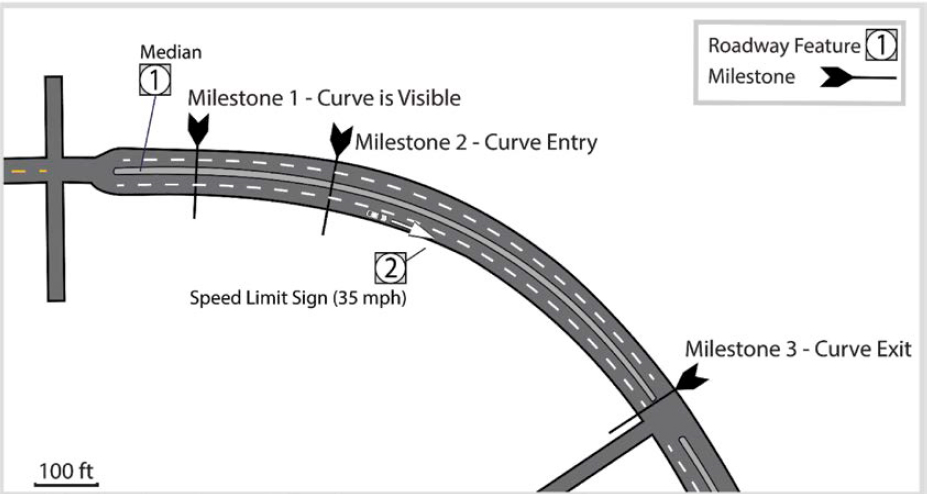
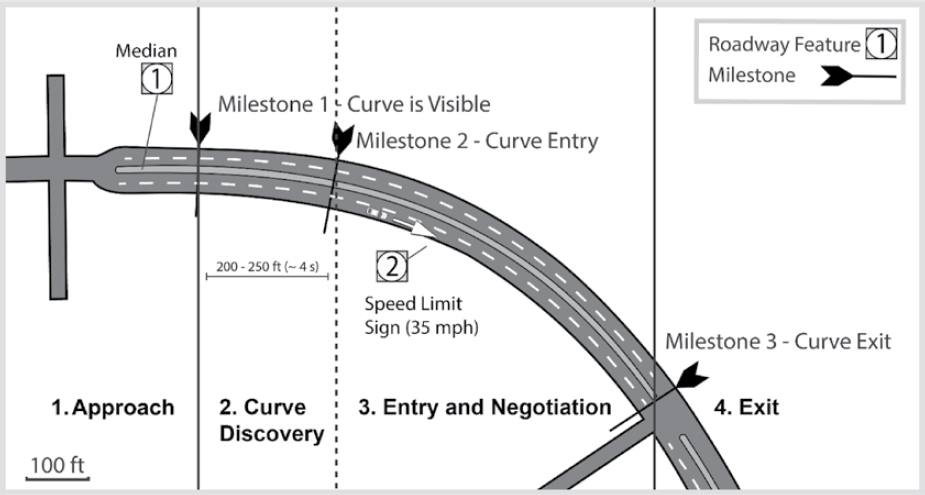
The following example is a short application of Approach 2: Analytical Inventory of Demands based on Roadway Features. This approach usually breaks up a roadway segment into clusters and non-clusters that have geometric and traffic conditions that are inherently different from one another. To support the comparison of the driver workload assessment approaches within this toolset, the following example applies Approach 2 to the same roadway and roadway segments used in the working example for Approach 3 (section 11.5 of this chapter). In addition, Approach 2 can document both dynamic and static roadway features, but this example focuses on static roadway features. Practitioners may refer to Tignor (2022, 2023) for thorough step-by-step demonstrations of Approach 2. This example breaks down the steps used to characterize and evaluate the relative workload of a driver traveling northeast on a curve located on Sand Point Way NE in Seattle, WA.
- Step 1: Collect roadway section data (Tool: section 11.3.1)
- Step 2: Roadway feature inventory (Tool: section 11.3.4)
- Step 3: Quantify roadway feature demands (Tool: section 11.3.4)
Table 21. The documented route information after the collect roadway section data step is complete includes a schematic of the roadway of interest.
 |
||||
| Total Workload Ticks | ||||
In Step 1, the roadway is characterized and documented using route maps, photographs, drone footage, and videos collected by the practitioner. Static elements of interest (e.g., curve entry, regulatory signs, and intersections) are identified, and their locations are documented (Table 21). Usually, the practitioner would break up the roadway of interest into clusters and non-clusters that have geometric and traffic conditions that are inherently different from one another; however, in this case, the roadway has been divided into the clusters based on the roadway segments used in the Approach 3 working example. In this example, Segment 1: Approach starts after the left-most intersection (Table 21).
In Step 2, the static elements of interest are quantified and the number of static roadway features of interest within the clusters is identified (Table 22).
In Step 3, additional metrics are derived from the roadway feature counts to normalize these data based on cluster distance or traversal time. Then the individual metrics are tabulated and compared between clusters. In each metric row, the “most” demanding workload values are bolded and counted as one workload “tick.” The total number of ticks in each segment column is summed to provide a measure of the relative demand exerted on the road user by the roadway features and infrastructure (Table 23).
11.5 Working Example of Approach 3: Quantifying the Demands and Relative Workload for a Heavy Truck Driver Traversing Around a Curve
The following example is a specific, but partial application of Approach 3: Analytical Task Analysis and Relative Workload and demonstrates how a practitioner could apply the general methods and tools described in sections 11.3.1, 11.3.3, and 11.3.5 through 11.3.8 of this chapter. This example breaks down the steps used to characterize and evaluate the relative workload of heavy truck drivers traversing a curve in normal driving conditions. Note that the example does not include dynamic roadway features. However, dynamic roadway features should be
Table 22. The documented route information after the roadway feature inventory step is complete includes the initial metrics associated with the roadway’s features of interest.
 |
||||
| Travel distance (ft) | 100 | 250 | 700 | 200 |
| Speed limit (mph) | 35 | 35 | 35 | 35 |
| Lane width (ft) | 10 | 10 | 11 | 11 |
| Shoulder width (ft) | 4 | 4 | 3 | 5 |
| Driveway frequency (#; #/mi) | 1; | 4; | 1; | 0; |
| Regulatory signs (#) | 0 | 1 | 7 | 2 |
| Warning signs (#) | 0 | 0 | 0 | 1 |
| % horizontal curve | 0 | 0 | 100% | 0 |
| % grade | 2% | 2.8% | 2.3% | 0% |
| Unsignalized intersections | 0 | 0 | 0 | 1 |
| Bus stops | 0 | 1 | 0 | 0 |
| Total Workload Ticks | ||||
included in the task and workload analysis if they are likely to be experienced by a typical driver while driving the facility under study.
- Step 1: Collect roadway section data (Tool: section 11.3.1; Example: section 11.5.1)
- Step 2: Collect analytical data (Tool: section 11.3.3; Example: section 11.5.2)
- Step 3: Task decomposition–identify segments (Tool: section 11.3.5; Example: section 11.5.3)
- Step 4: Task decomposition–identify tasks and subtasks (Tool: section 11.3.6; Example: section 11.5.4)
- Step 5: Assign workload ratings (Tool: section 11.3.7; Example: section 11.5.5)
- Step 6: Augment the task analysis with additional information (see section 11.3.8; Example: section 11.5.6)
This working example uses a series of tables to show how the practitioner might document the outcomes of each step. Table 24 to Table 26 show how to document roadway characteristics, segments, and tasks. Table 27 to Table 30 demonstrate, for one segment (i.e., Segment 3: Entry and Negotiation) how to decompose tasks into subtasks and document the subtask’s information processing element (e.g., perceptual, cognitive, and psychomotor). Table 31 to Table 34 show how to assign each subtask a workload rating. In the full application of Approach 3, the practitioner would then create additional tables to document the subtasks for all roadway segments of interest, but these are not included for brevity. Therefore, Figure 106 to Figure 108 skip ahead to demonstrate the categorization of tasks (i.e., forced-paced versus self-paced) and development of the detailed workload estimates for all segments, even though the derivation of workload
Table 23. The documented route information after the quantify roadway feature demands step is complete includes the derived roadway feature metrics and the total workload ticks for each column.
 |
||||
| Travel distance (ft) | 100 | 250 | 700 | 200 |
| Speed limit (mph) | 35 | 35 | 35 | 35 |
| Lane width (ft) | 10 | 10 | 11 | 11 |
| Shoulder width (ft) | 4 | 4 | 3 | 5 |
| Driveway frequency (#; #/mi) | 1; 52.8 | 4; 84.5 | 1; 7.5 | 0; 0 |
| Regulatory signs (#) | 0 | 1 | 7 | 2 |
| Warning signs (#) | 0 | 0 | 0 | 1 |
| % horizontal curve | 0 | 0 | 100% | 0 |
| % grade | 2% | 2.8% | 2.3% | 0% |
| Unsignalized intersections | 0 | 0 | 0 | 1 |
| Bus stops | 0 | 1 | 0 | 0 |
| Total Workload Ticks | 1 | 4 | 3 | 2 |
ratings for subtasks in Segments 1, 2, and 4 are not shown. The final presentation on workload relative to road segments is depicted in Figure 109.
Although this example focuses on a specific modality for succinctness, in practice, the practitioner might complete these steps to create multiple workload rating graphs that would cover the variety of modalities and road user populations relevant to the roadway under consideration.
11.5.1 Step 1. Collect Roadway Section Data
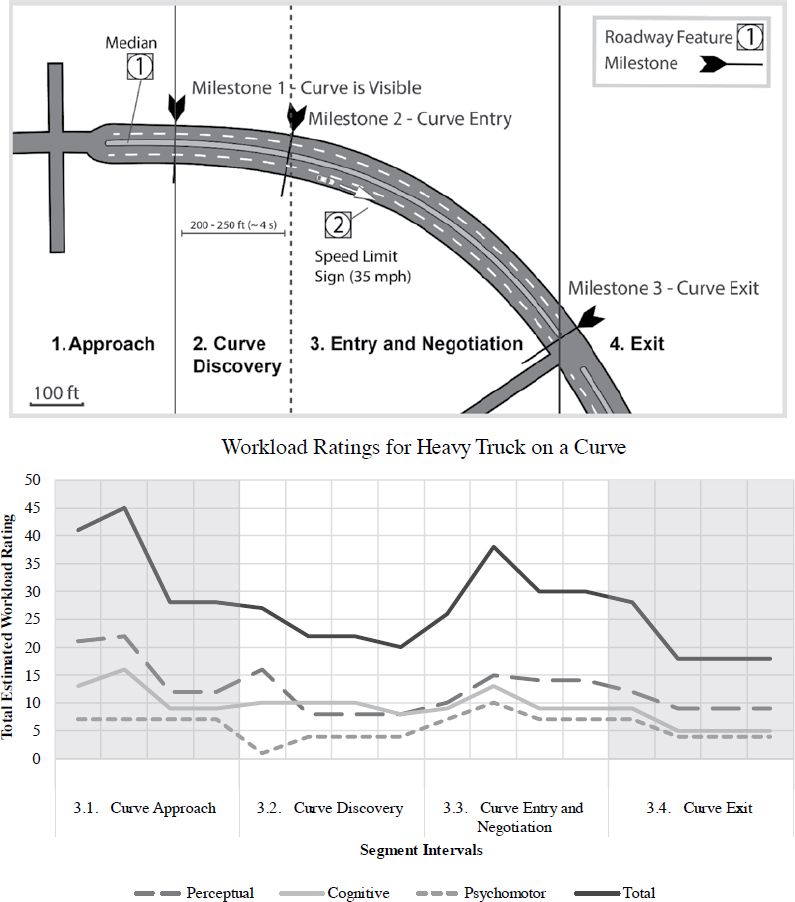
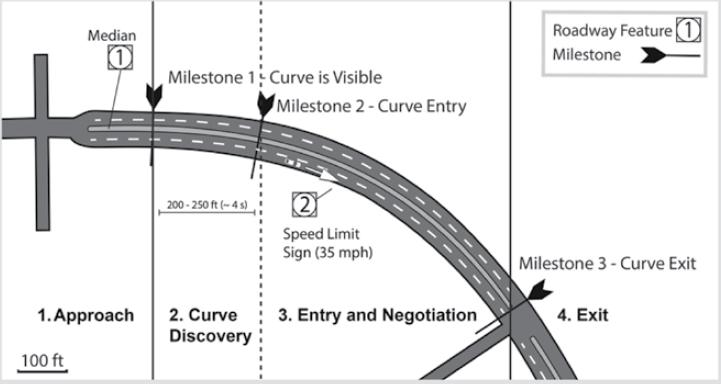
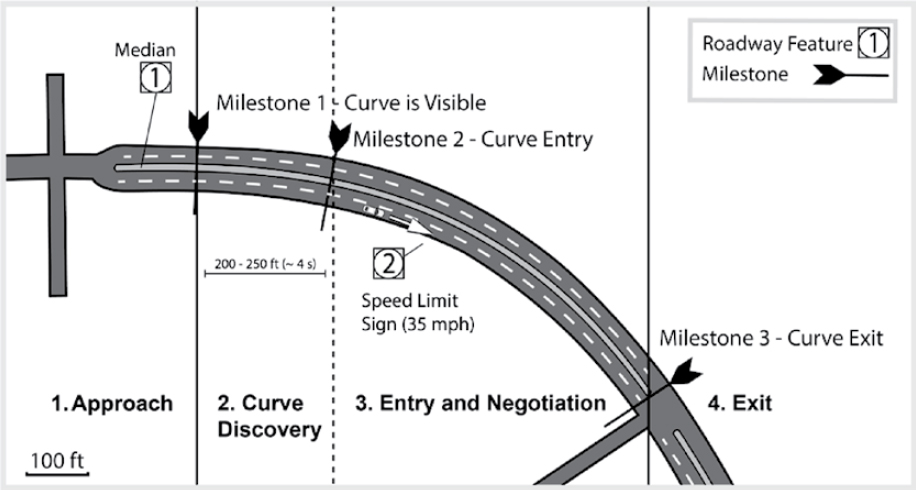
The roadway is characterized and documented using route maps, photographs, and videos collected by the practitioner (Figure 105). Static elements of interest (e.g., curve entry, signs) are identified, and their locations are documented (Table 24).
11.5.2 Step 2. Collect Analytical Data
Existing literature and reports that describe task analyses relevant to traversing a curve (Campbell et al., 2012) and heavy truck operation [Turanski and Tijerina, 1996; Washington State Department of Licensing (WDL), 2022] are identified. In this case, the practitioner did not have access to a heavy truck or truck drivers, so they did not record any driver-facing video of the facility.
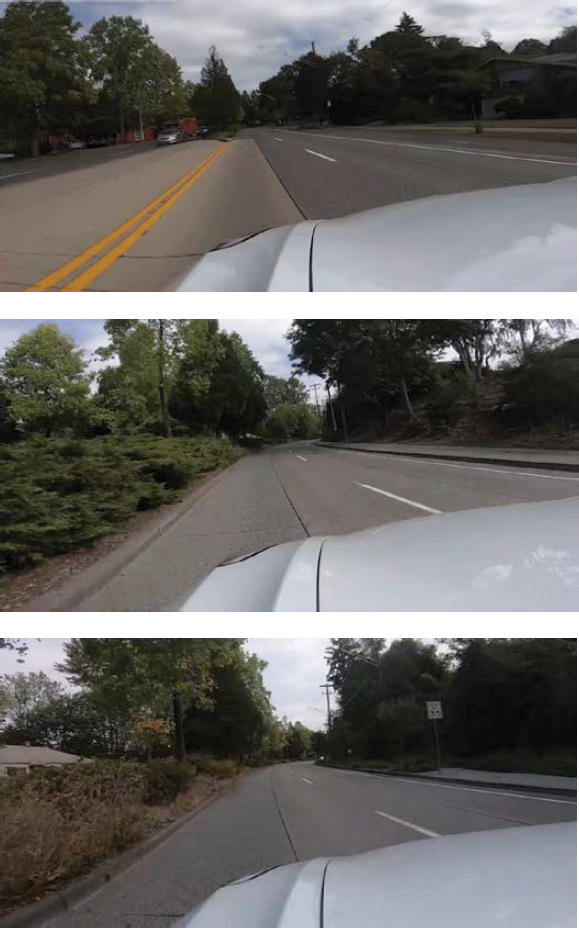
Table 24. The documented route information after the roadway-section data collection step is complete includes a schematic of the roadway of interest.
 |
||||
| Segments | ||||
| Key Driving Tasks | ||||
| Visual Demands and Information | ||||
| Sources | ||||
| Effective Information Modes | ||||
| Vehicle-Control Demands | ||||
| Primary Speed Influences | ||||
Note: A blank template of this table is available in Chapter 12.
11.5.3 Step 3. Task Decomposition–Identify Segments
The curve is broken down into four primary segments, with each segment generally representing a related set of driving actions (Table 25).
11.5.4 Step 4. Task Decomposition–Identify Tasks and Subtasks
Driving tasks are then selected and decomposed successively into smaller activities to characterize how a heavy truck driver may traverse the curve (Table 26). Although not all tasks or subtasks identified in the task decomposition will be performed exhaustively by all heavy truck drivers, this list indicates reasonable tasks drivers are likely to perform to successfully navigate a section of roadway. Note that task decomposition is iterative. A practitioner may find value in reorganizing segments, tasks, or subtasks once they have produced an initial list. For brevity, the breakdown of tasks into subtasks is only shown for Segment 3: Entry and Negotiation (Table 27 to Table 30).
11.5.5 Step 5. Assign Workload Ratings
As shown in Table 20, within each task, workload values for subtasks are assigned based on a workload estimation tool for perceptual, cognitive, and psychomotor information processing demands in driving described in a previous FHWA report (Richard et al., 2006). As a first step,
Table 25. The documented route information after the identify segments step is complete includes driving issues by roadway segment: visual demands, information modes, vehicle control, and speed issues.
 |
||||
| Segments | 1. Approach | 2. Curve Discovery | 3. Entry and Negotiation | 4. Exit |
| Key Driving Tasks | ||||
| Visual Demands and Information Sources |
|
|
|
|
| Effective Information Modes |
|
|
|
|
| Vehicle-Control Demands |
|
|
|
|
| Primary Speed Influences |
|
|
|
|
Table 26. After creating the road user task list, the documented route information is updated to include the key driving tasks that occur in each segment.
 |
||||
| Segments | 1. Approach | 2. Curve Discovery | 3. Entry and Negotiation | 4. Exit |
| Key Driving Tasks |
1.1 Locate Bend 1.2 Determine Curve Speed 1.3 Maintain Cruise Speed 1.4 Maintain Lane Position 1.5 Assess Roadway Conditions |
2.1 Determine Curvature 2.2 Assess Roadway Conditions 2.3 Make Speed Adjustments 2.4 Adjust Path for Curve Entry |
3.1 Adjust Speed Based on Curvature/Lateral Acceleration 3.2 Adjust Trajectory 3.3 Maintain Safe lane Position 3.4 Assess Roadway Conditions |
4.1 Attain Intended Cruise Speed 4.2 Maintain Lane Position 4.3 Assess Roadway Conditions |
| Visual Demands and Information Sources | Primarily environment driven | Curvature perception cues Observing roadway conditions |
Most fixations to tangent point | Vehicle position information |
| Effective Information Modes | Advisory/message signs | Non-verbal (e.g., chevrons) and direct info (e.g., delineators | Direct info only (lane markings; raised markers) | No constraints |
| Vehicle-Control Demands | Minimal | Anticipatory positioning Curve cutting | Continuous heading adjustments | Lane position adjustments |
| Primary Speed Influences | Previous roadway elements and signage | Expectations and curvature cues | Expectations and lateral acceleration | Posted speed or expectations |
Table 27. Subtask breakdown for Segment 3, Task 3.1–Adjust speed based on curvature/lateral acceleration.
| Task: Adjust Speed Based on Curvature/Lateral Acceleration (Campbell et al., 2012) | Workload Estimate | Process | Supplementary Notes |
|---|---|---|---|
| Subtask: Perceive curvature cues–lateral acceleration | Perceptual | Within the curve, the operator primarily uses heavy truck handling and lateral acceleration cues to adjust speed (Campbell et al., 2012). | |
| Subtask: Determine speed adjustment | Cognitive | No supplementary notes. | |
| Subtask: Accelerate slightly in the curve–foot on throttle or release throttle | Psychomotor | Accelerating in the curve helps the operator maintain control (WDL, 2022). Hard braking in a curve could be dangerous; the wheels can lock and cause a skid (WDL, 2022). |
Note: A blank template of this table is available in Chapter 12.
Table 28. Subtask breakdown for Segment 3, Task 3.2–Adjust trajectory.
| Task: Adjust Trajectory (Campbell et al., 2012) | Workload Estimate | Process | Supplementary Notes |
|---|---|---|---|
| Subtask: Perceive curvature cues–tangent point | Perceptual | During curve negotiation, the operator spends most of their visual resources looking at the tangent point, or the forward horizon on gradual curves, to keep the heavy truck aligned with the roadway (Campbell et al., 2012). Visual demands are highest in this segment and peak immediately after the point of curvature (Campbell et al., 2012). Therefore, communicating curve information in this segment could be done at the curve (e.g., lane markings) or within an area that operators could perceive with their peripheral vision (e.g., raised reflective markings in dark conditions) (Campbell et al., 2012). | |
| Subtask: Determine target trajectory | Cognitive | No supplementary notes. | |
| Subtask: Hold the steering wheel firmly with both hands | Psychomotor | The operator controls direction via the steering wheel (Turanski and Tijerina, 1996). If the heavy truck hits a curb or pothole, the operator can maintain a firm hold to continue steering (WDL, 2022). |
Table 29. Subtask breakdown for Segment 3, Task 3.3–Maintain safe lane position.
| Task: Maintain Lane Position (Richard et al., 2006) | Workload Estimate | Process | Supplementary Notes |
|---|---|---|---|
| Subtask: Visually observe the roadway ahead | Perceptual | The heavy truck operator can look at lane markings and road geometry and be aware of changes in the road scene (Turanski and Tijerina, 1996). | |
| Subtask: Verify the correct lane position | Cognitive | No supplementary notes. | |
| Subtask: Hold the steering wheel steady or adjust the steering | Psychomotor | The heavy truck operator controls direction, lane position, and spacing via the steering wheel (Turanski and Tijerina, 1996). They can make necessary adjustments to avoid over or under-steering the heavy truck (WDL, 2022). They may keep both hands on the steering wheel at all times unless they are actively shifting (WDL, 2022). In practice, heavy truck operators use only one hand for continuous steering 50% of the time (Kiger et al., 1992). |
Table 30. Subtask breakdown for Segment 3, Task 3.4–Assess roadway conditions.
| Task: Assess Roadway Conditions | Workload Estimate | Process | Supplementary Notes |
|---|---|---|---|
| Subtask: Look for potential hazards and obstacles ahead–visual; Listen for potential hazards–auditory | Perceptual | Heavy truck licensing materials advise that heavy truck operators look at least 12 to 15 seconds ahead (WDL, 2022). They can check upcoming traffic (WDL, 2022), lane markings, and road geometry, and be aware of changes in the road scene (the primary visual task) (Turanski and Tijerina, 1996). Changes in the road scene include monitoring weather, monitoring road conditions, and scanning for upcoming obstructions that may have been hidden on a roadway with a short sight distance (e.g., a curve or a hill). | |
| Subtask: Monitor heavy truck cab for indications of potentially challenging driving conditions | Perceptual | Heavy truck licensing materials advise operators to follow up on cues (tactile, olfactory, visual, auditory) that indicate an issue with the heavy truck (WDL, 2022). Operators may glance at the gauges (Turanski and Tijerina, 1996) or the instrument panel to perceive these cues (e.g., a change in ambient weather conditions could be perceived by temperature information on the instrument panel, a thermometer, over the radio, or be physically perceived by the operator). | |
| Subtask: Determine if perceptual cues indicate a potential crash or potentially challenging driving conditions | Cognitive | No supplementary notes. | |
| Subtask: Turn head to glance at mirrors (Turanski and Tijerina, 1996) | Psychomotor | The operator turns their head to glance at either west coast (side) mirror (Turanski and Tijerina, 1996). The operator checks traffic in all directions (WDL, 2022). Quick mirror checks allow for visual attention to mainly focus on the road ahead (WDL, 2022). |
the qualities of the subtask are matched to the description and examples in the reference table (Table 20) then the associated workload value is assigned (Table 31 to Table 34 outline how this would be done for the four tasks within Segment 3: Curve Entry and Negotiation). Workload values may be incremented if the subtask context is particularly complex [e.g., perceiving degraded signs or markings (Richard et al., 2006)].
11.5.6 Step 6. Augment the Task Analysis with Additional Information
To create workload estimation profiles (Figure 108), scenario segments were divided into four time intervals to help represent when a driver may perform a task within a segment (Figure 106). Tasks were then arranged into intervals based on their logical order or whether a driver could potentially perform the tasks concurrently. Tasks were also categorized based on whether they were forced-paced or self-paced. Next, the workload estimates from all tasks within each interval were summed. For example, to sum the workload estimates for Segment 3, Task 3.4—Assess roadway conditions, the practitioner would reference Table 24. Within this task, the ratings of the two perceptual subtasks sum to eight. This task has one cognitive subtask and one psychomotor subtask, so the summed cognitive workload and psychomotor workload ratings are 4 and 1 respectively.
Although self-paced tasks can be performed within any time interval within the driving segment, when tasks were self-paced rather than forced-paced, the workload for the task was only summed into the initial segment time interval where the driver could complete it (Figure 107). The summed workload ratings for concurrent perceptual, cognitive, and psychomotor tasks
Table 31. Subtask workload ratings for Segment 3, Task 3.1–Adjust speed based on curvature/lateral acceleration.
| Task: Adjust Speed Based on Curvature/Lateral Acceleration | Workload Estimate | Process | Supplementary Notes |
|---|---|---|---|
| Subtask: Perceive curvature cues–lateral acceleration | 1 | Perceptual This subtask involves registering motion. |
Within the curve, the operator primarily uses heavy truck handling and lateral acceleration cues to adjust speed. |
| Subtask: Determine speed adjustment | 4 | Cognitive This subtask involves the evaluation of and judgment about a single aspect. |
No supplementary notes. |
| Subtask: Accelerate slightly in the curve–foot on throttle or release throttle | 3 | Psychomotor This subtask involves a continuous adjustment action. |
Accelerating inside the curve can help the operator maintain control. Braking in a curve is dangerous; the wheels can lock and cause a skid. |
Table 32. Subtask workload ratings for Segment 3, Task 3.2–Adjust trajectory.
| Task: Adjust Trajectory | Workload Estimate | Process | Supplementary Notes |
|---|---|---|---|
| Subtask: Perceive curvature cues–tangent point | 5 | Perceptual This subtask involves visually tracking curvature cues. |
During curve negotiation, the operator spends most of their visual resources looking at the tangent point, or the forward horizon, on gradual curves to keep the heavy truck aligned with the roadway. Visual demands are highest in this segment and peak immediately after the point of curvature. Therefore, communicating curve information in this segment could be done at the curve (e.g., lane markings) or within an area that operators could perceive with their peripheral vision (e.g., raised reflective markings in dark conditions). |
| Subtask: Determine target trajectory | 4 | Cognitive This subtask involves the evaluation of and judgment about a single aspect. |
No supplementary notes. |
| Subtask: Hold the steering wheel firmly with both hands | 3 | Psychomotor This subtask involves a continuous adjustment action. |
The operator controls direction via the steering wheel. If the heavy truck hits a curb or pothole, the operator can maintain a firm hold to continue steering. |
Table 33. Subtask workload ratings for Segment 3, Task 3.3–Maintain safe lane position.
| Task: Maintain Lane Position | Workload Estimate | Process | Supplementary Notes |
|---|---|---|---|
| Subtask: Visually observe the roadway ahead | 1 | Perceptual This subtask involves registering vehicle heading. |
The heavy truck operator can look at lane markings and road geometry and be aware of changes in the road scene. |
| Subtask: Verify the correct lane position | 1 | Cognitive This subtask involves a simple conditioned response. |
No supplementary notes. |
| Subtask: Hold the steering wheel steady or adjust the steering | 3 | Psychomotor This subtask involves a continuous adjustment action. |
The heavy truck operator controls direction, lane position, and spacing via the steering wheel. They can make necessary adjustments to avoid over or under-steering the heavy truck, and they may keep both hands on the steering wheel at all times unless they are actively shifting. In practice, heavy truck operators use only one hand for continuous steering 50% of the time. |
Table 34. Subtask workload ratings for Segment 3, Task 3.4–Assess roadway conditions.
| Task: Assess Roadway Conditions | Workload Estimate | Process | Supplementary Notes |
|---|---|---|---|
| Subtask: Look for potential hazards and obstacles ahead–visual; Listen for potential hazards–auditory | 7 | Perceptual This subtask involves scanning for potential obstacles and hazards and listening for unsafe situations. |
Heavy truck licensing materials advise that heavy truck operators look at least 12 to 15 seconds ahead. They can check upcoming traffic, lane markings, and road geometry and be aware of changes in the road scene (the primary visual task). Changes in the road scene include monitoring weather, monitoring road conditions, and scanning for upcoming obstructions that may have been hidden on a roadway with a short sight distance (e.g., a curve or a hill). |
| Subtask: Monitor heavy truck cab for indications of potentially challenging driving conditions | 1 | Perceptual This subtask involves detecting visual, auditory, or olfactory stimuli. |
Heavy truck licensing materials advise operators to follow up on cues (tactile, olfactory, visual, auditory) that indicate an issue with the heavy truck. Operators may glance at the gauges or the instrument panel to perceive these cues (e.g., a change in ambient weather conditions could be perceived by temperature information on the instrument panel, a thermometer, over the radio, or be physically perceived by the operator). |
| Subtask: Determine if perceptual cues indicate safe or unsafe conditions | 4 | Cognitive This subtask involves the evaluation of and judgment about a single aspect. |
No supplementary notes. |
| Subtask: Turn head to glance at mirrors | 1 | Psychomotor This subtask involves a simple automatic behavior. |
The operator turns their head to glance at either west coast (side) mirror. The operator checks traffic in all directions. Quick mirror checks allow for visual attention to mainly focus on the road ahead. |
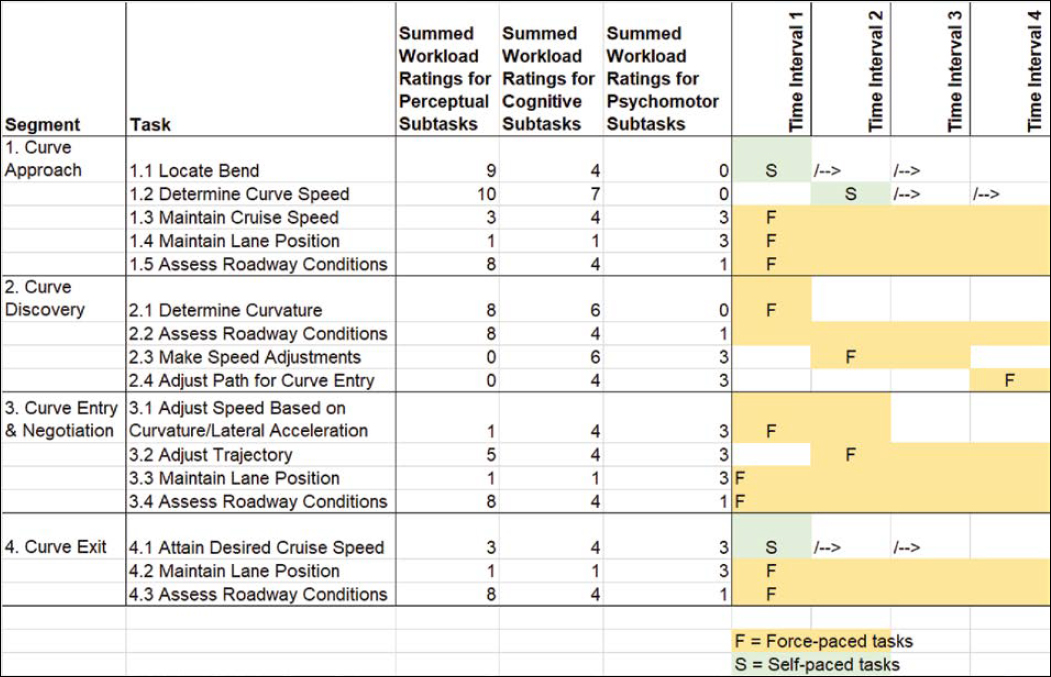
Figure 106. Subtask workload ratings are summed for each task. The tasks are categorized as forced-paced tasks or self-paced tasks and are then arranged into time intervals based on their logical sequence and pacing.
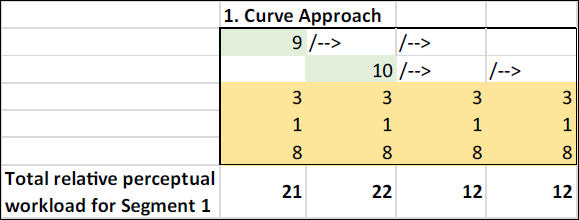
Figure 107. An example of how relative workload is derived for each segment based on task arrangements. When tasks were self-paced rather than forced-paced, the workload for the task was only summed into the initial segment time interval where the driver could complete it.
(Figure 108) were used to create a workload profile for the entire roadway of interest (Figure 109). Peaks in the workload profile in the unshaded regions indicate where multiple demands incurred by the driver from the roadway environment may peak and create information processing bottlenecks reflecting high workload/demands. The implication of these workload rating peaks is that adding additional load (e.g., complex signage) in these peak areas, especially of the same demand type (e.g., perceptual) is more likely to lead to scenarios where drivers do not have the resources to process the roadway. Peaks in the workload profile in the gray-shaded regions indicate where information bottlenecks could occur because of driving task demands, but because of one or more of the driving tasks being self-paced, drivers may be able to allocate resources optimally in these regions to avoid overload.
The purpose of this method is not to draw firm conclusions about driver performance or vehicle safety from the workload values but rather to identify intervals within each scenario where the workload is higher relative to other intervals. The derived workload profile can help a designer identify parts of the roadway where multiple factors (e.g., forced-paced tasks and high workload) may converge to create potential information processing bottlenecks (Richard et al., 2006).
In this example, demands on a heavy truck driver’s perceptual processes are relatively high and temporally constrained at the beginning of the Curve Discovery and throughout the Curve Entry and Negotiation tasks. A practical application of this information would be to avoid putting complex signage in locations where these tasks occur to increase the likelihood that drivers will perceive the signs and reduce the likelihood of task interference. Note that if the practitioners augmented this work with direct observation (e.g., video, eye tracking) to observe real drivers traversing the roadway, it would be possible to identify instances of overload and underload through those observations or through changes in driving performance (e.g., Gawron, 2000; Matthews and Reinerman-Jones, 2017).
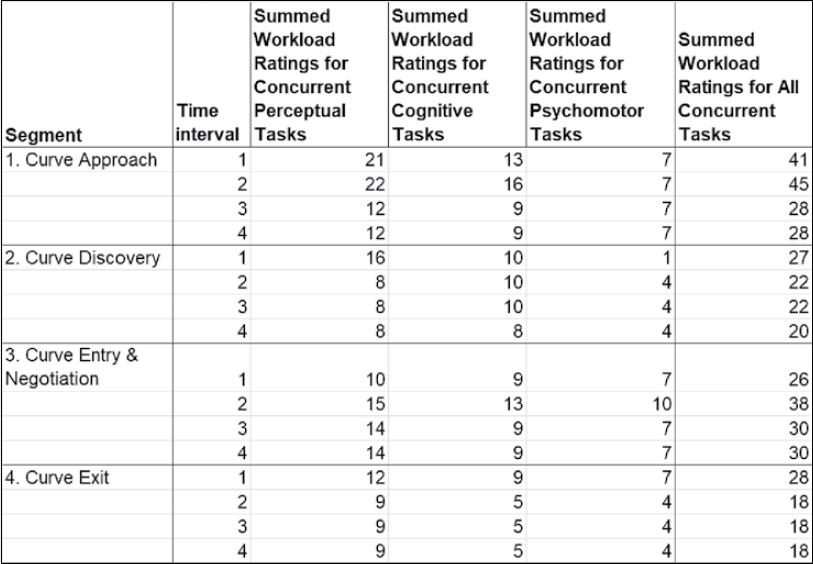
Figure 108. Workload ratings are summed by intervals for perceptual, cognitive, and psychomotor demands.