Diagnostic Assessment and Countermeasure Selection: A Toolbox for Traffic Safety Practitioners (2024)
Chapter: 10 Decision Trees to Support Countermeasure Selection

CHAPTER 10
Decision Trees to Support Countermeasure Selection
10.1 Background
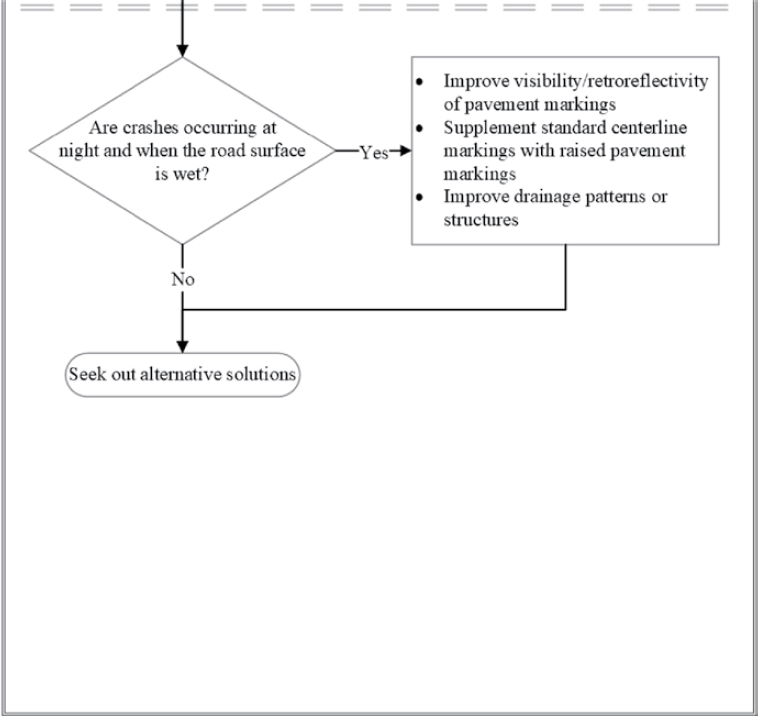
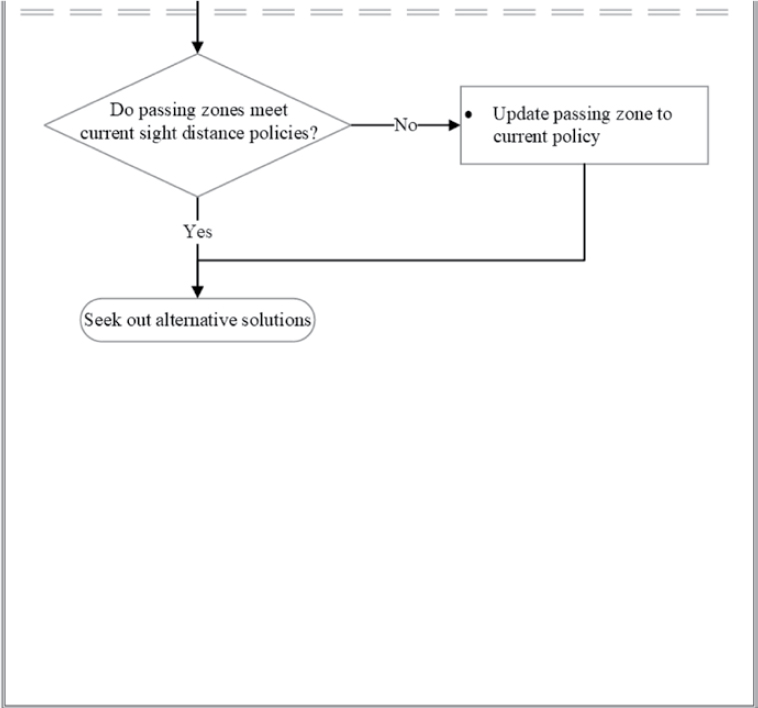
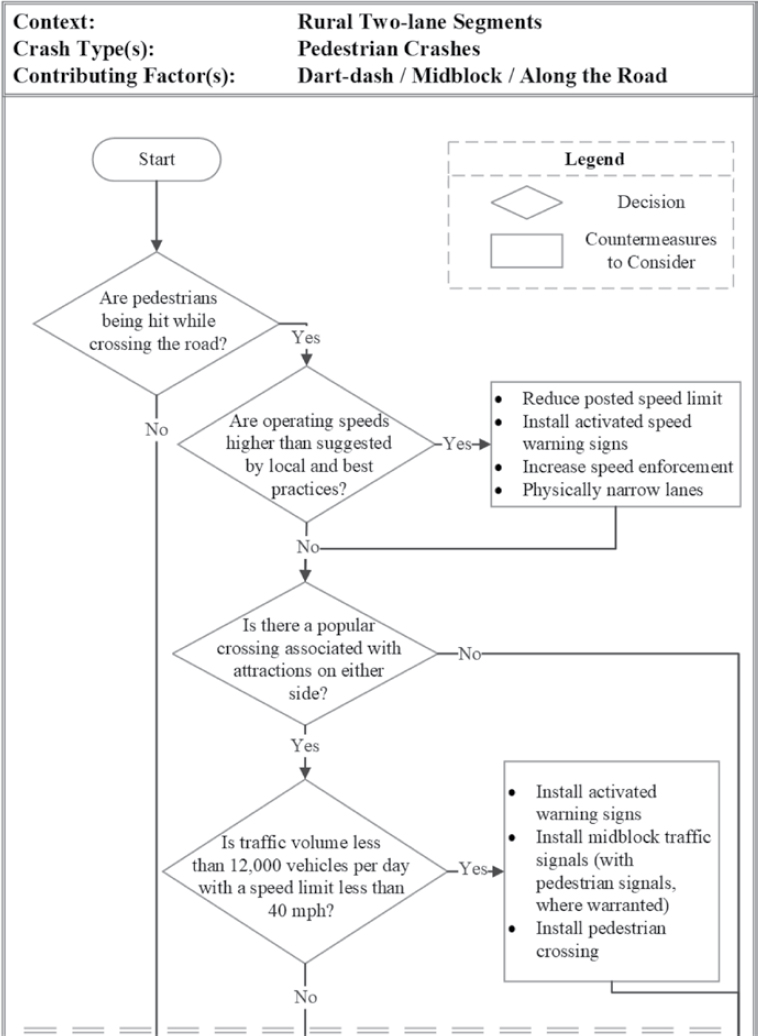
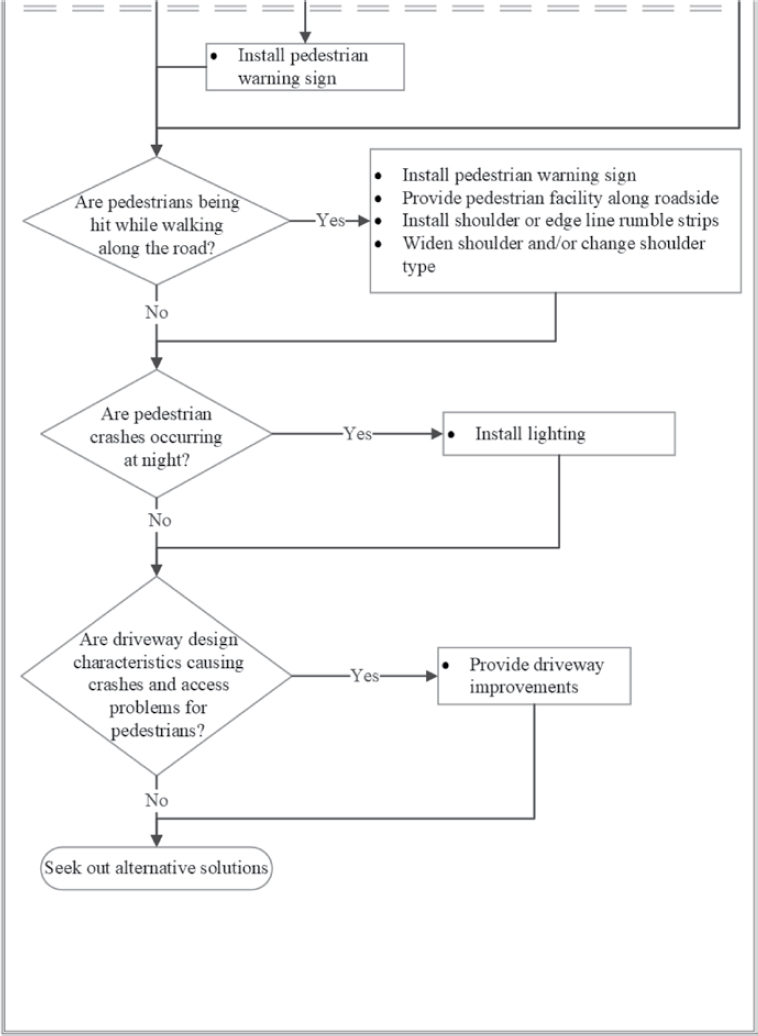
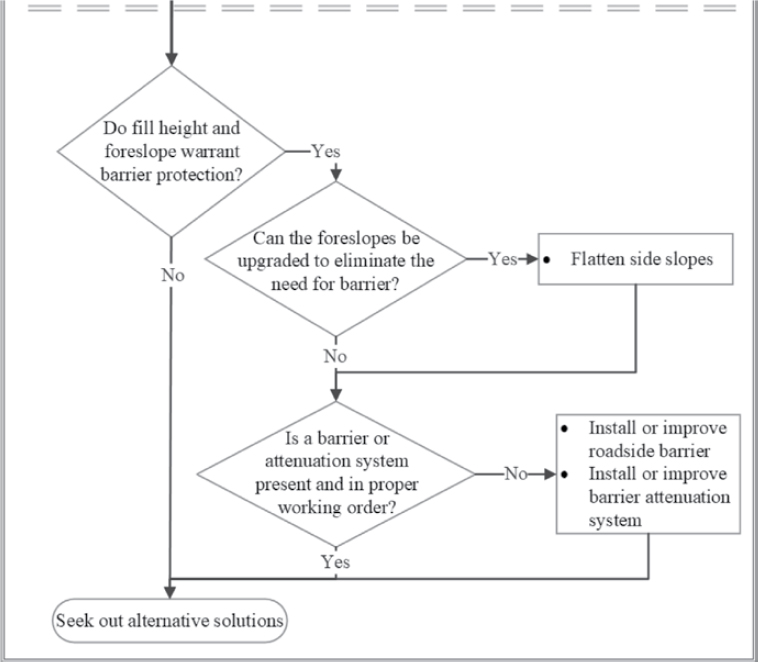
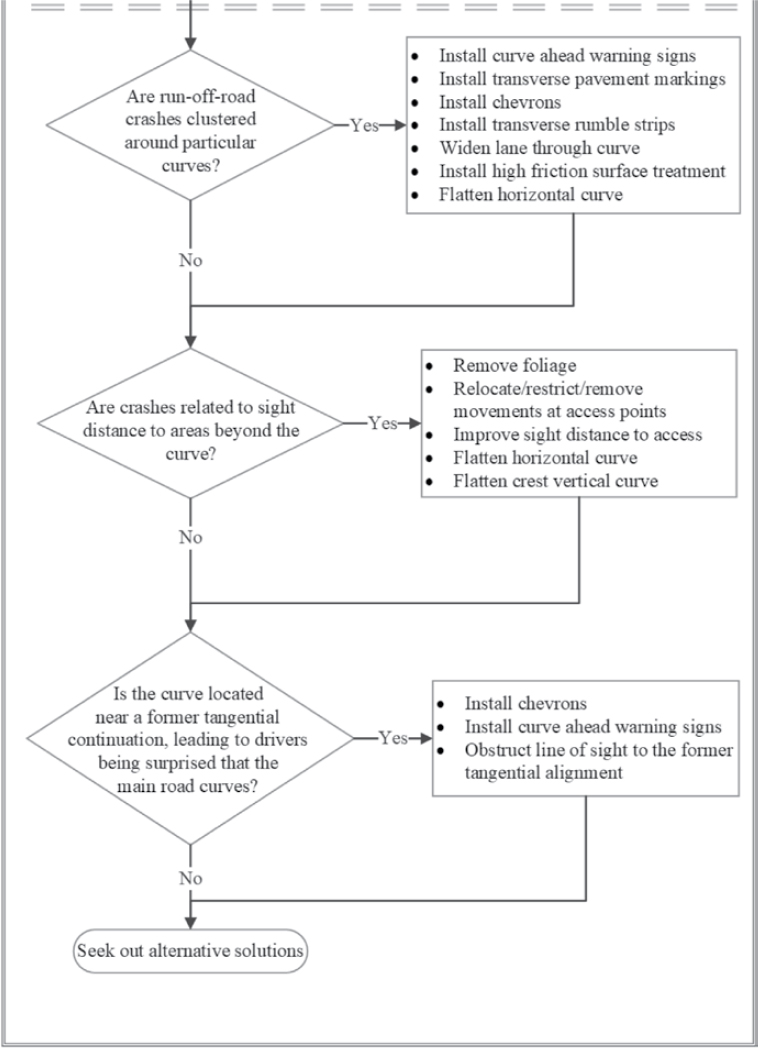
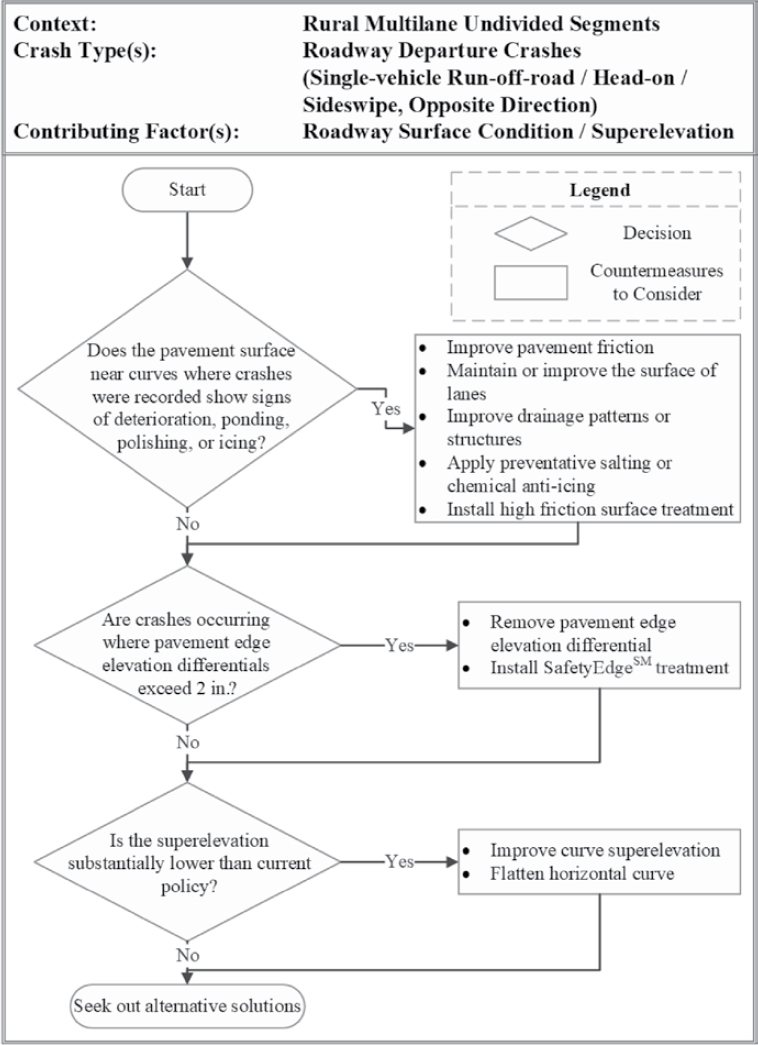
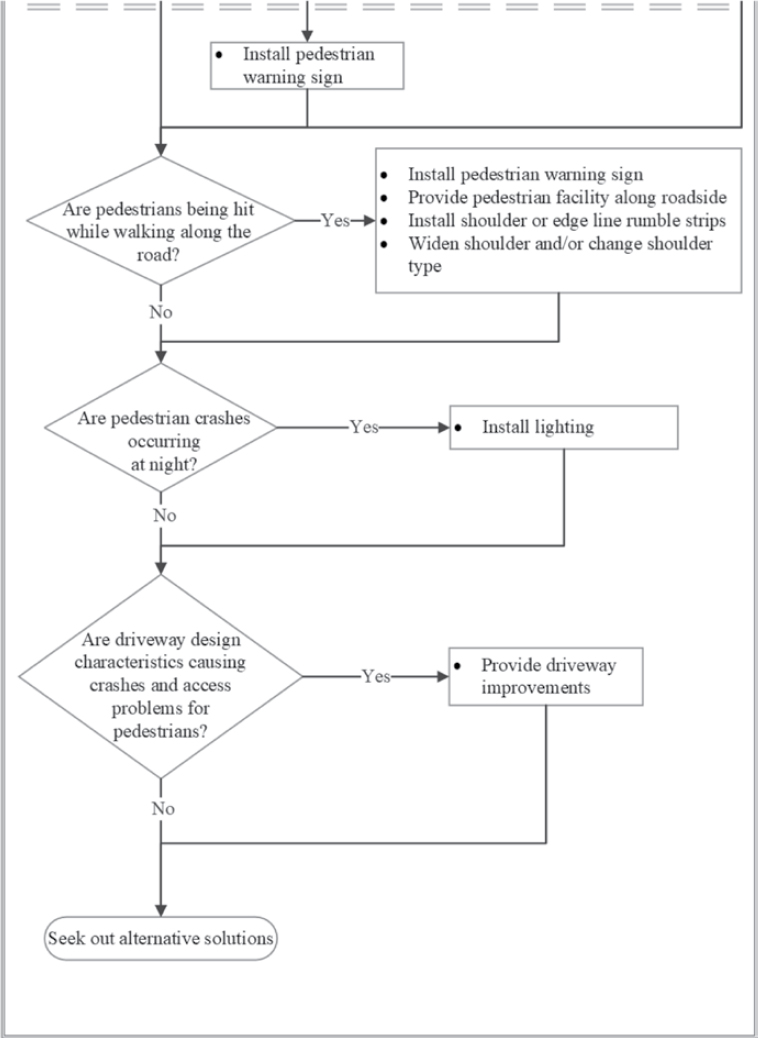
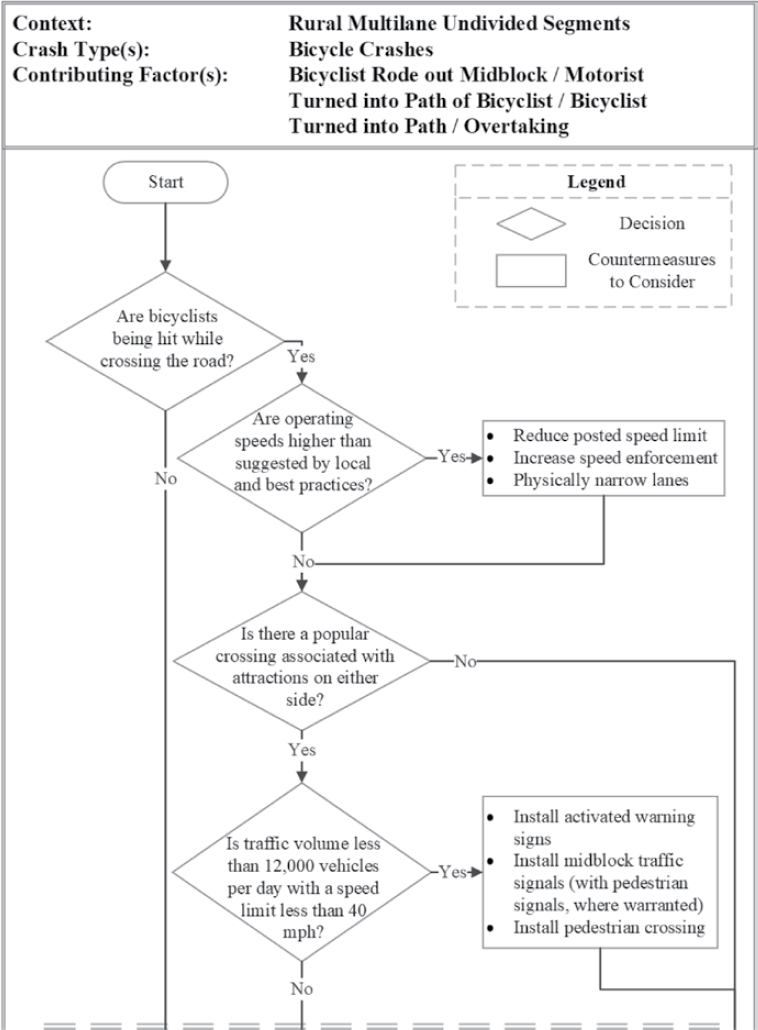
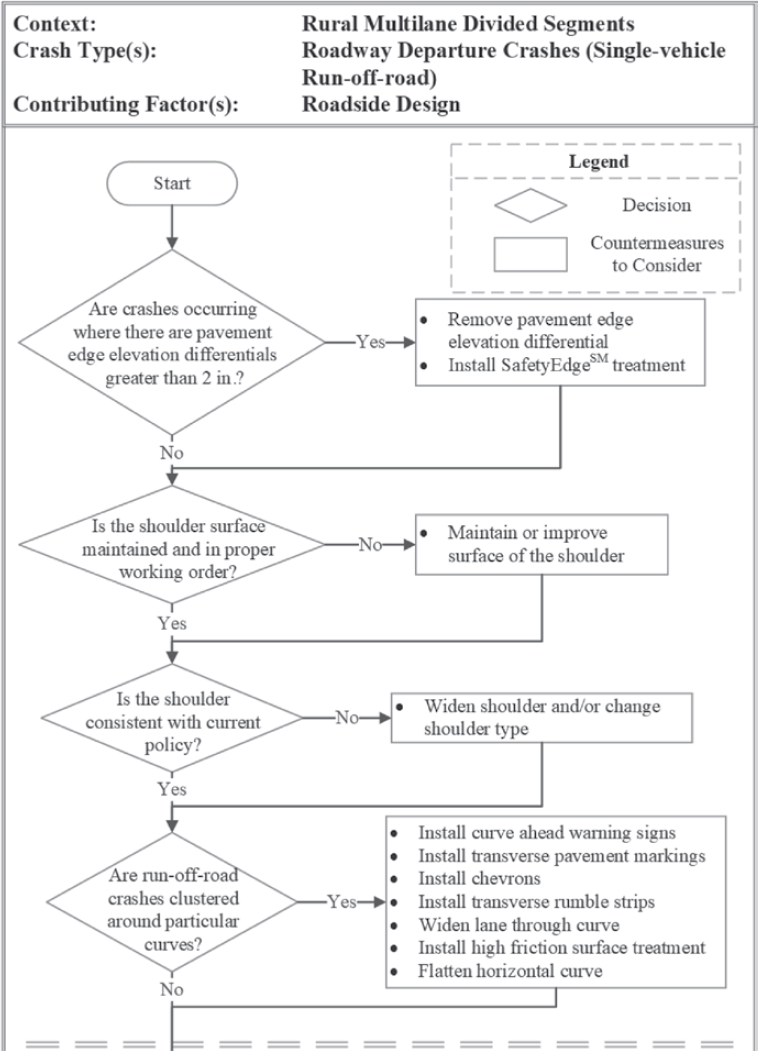
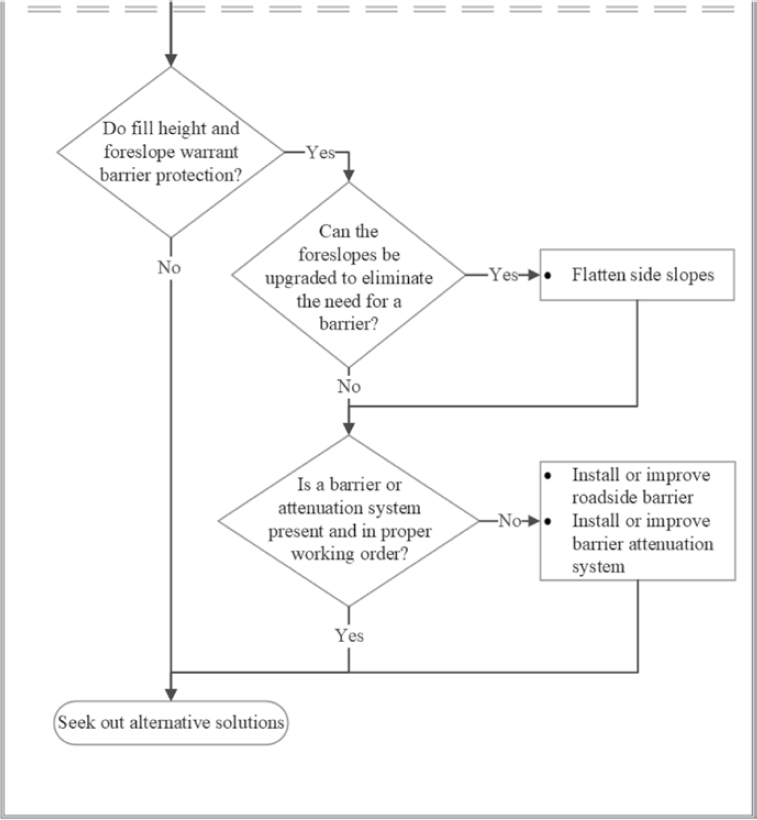
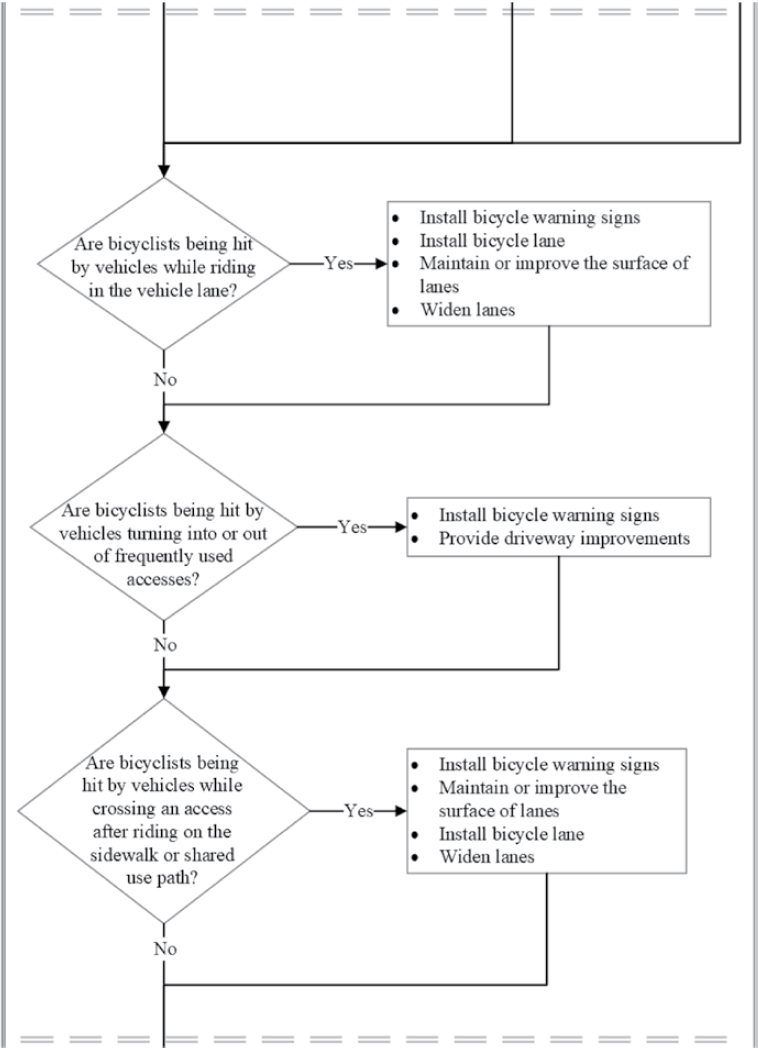
This chapter provides a series of decision trees to help practitioners select countermeasures to address target crash types and facility types. Decision trees provide a visual framework for decision-making. Practitioners can select from a series of decision trees that lead them through diagnostic questions to help identify countermeasures that could potentially address crash-contributing factors associated with the crash pattern of interest. Selecting countermeasures for potential implementation, matched to underlying contributing factors to target crash types, is expected to reduce crashes to the greatest extent possible.
The decision trees presented here are based on the logic of the diagnostic scenarios incorporated in the Safety Analyst software (Harwood et al., 2010), a former AASHTOWare product that implemented and automated the six main steps of the roadway safety management process outlined in HSM Part B. As part of the third step in the roadway safety management process, the software led an engineer/analyst through a series of questions to identify crash-contributing factors related to particular crash types at a site and identify potential countermeasures to remedy the contributing factors associated with the crash type of interest. The primary result of reviewing and answering the diagnostic questions is a list of potential countermeasures for further consideration in the economic appraisal and project prioritization process to select those countermeasures for implementation that are most cost-effective.
In addition to the logic of diagnostic scenarios incorporated in the Safety Analyst software, the decision trees presented here have been adapted to include additional diagnostic questions and reflect additional countermeasure information gathered from sources including the following:
- PEDSAFE: Pedestrian Safety Guide and Countermeasure Selection System (FHWA, n.d.c)
- BIKESAFE: Bicycle Safety Guide and Countermeasure Selection System (FHWA, n.d.a)
- United States Road Assessment Program (usRAP) (Roadway Safety Foundation, 2024b)
- The HFG for Road Systems: Fourth Edition (upcoming)
- CMF Clearinghouse (FHWA, n.d.b)
- Field Guide for Selecting Countermeasures at Uncontrolled Pedestrian Crossing Locations (Blackburn et al., 2018)
10.2 Crash Types
Decision trees have been developed to address common crash types and countermeasures included in many state SHSPs and for which states use HSIP funds. According to the HSIP 2019 National Summary Report (Albee and Gross, 2021), states use HSIP funds to address several predominant infrastructure-related crash types, including roadway departure, intersection,
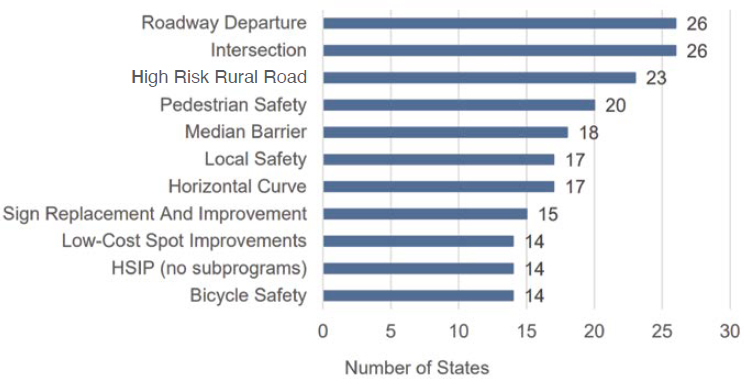
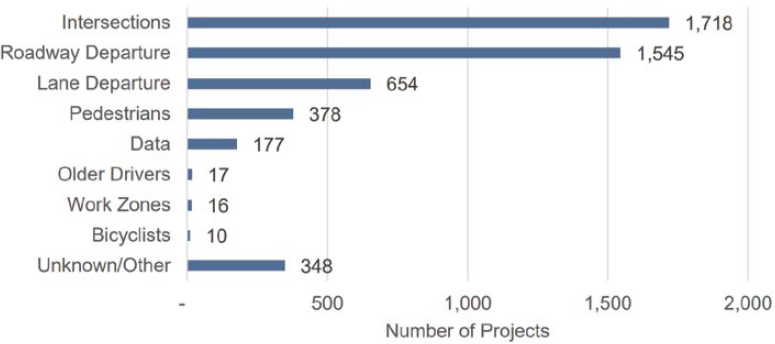
and pedestrian crashes. Current data on HSIP activities and success stories in the United States are compiled and published by the FHWA (FHWA, 2023a). Figure 20 shows the top 11 state safety programs administered under HSIP. Over half of the states have roadway departure (26 states) and intersection (26 states) safety programs, while 20 states have pedestrian safety programs, and agencies are spending their HSIP funds on projects consistent with their top programs. Figure 21 presents the number of HSIP projects categorized by common SHSP emphasis areas. Approximately 35% of the HSIP projects were categorized as intersections, 32% were categorized as roadway departures, and 8% were categorized as pedestrians.
Thus, the decision trees included here are consistent with the common crash types and types of safety projects being addressed by states. The decision trees also address pedestrian and bicycle crashes as these are of high interest to agencies across the United States, as evidenced by the U.S. DOT announcing new guidance to improve the safety of VRUs (FHWA, 2022b).
Table 16 presents a roadmap for the decision trees to help guide countermeasure selection. Decision trees address common crash types that occur along rural and urban roadway segments and intersections, including the following:
- Rural two-lane roadway segments
- Rural multilane undivided roadway segments
- Rural multilane divided roadway segments
- Urban two-lane roadway segments
- Urban multilane undivided roadway segments
- Urban multilane divided roadway segments
- Rural and urban signalized intersections
- Rural and urban unsignalized intersections
The crash types are further categorized according to common crash contributing factors. Through the diagnostic process, practitioners should get a sense of the factors contributing to the crash pattern of interest. Then, by reviewing the respective decision trees, following the logic, and responding to the questions, practitioners will be able to identify a list of potential countermeasures for further consideration in the economic appraisal and project prioritization process. When selecting countermeasures for potential implementation, practitioners should also consider building redundancy into the system consistent with a Safe System.
As shown in Table 16, some of the crash types and contributing factors are common across the various roadway contexts (i.e., site types). As such, some of the diagnostic scenarios apply
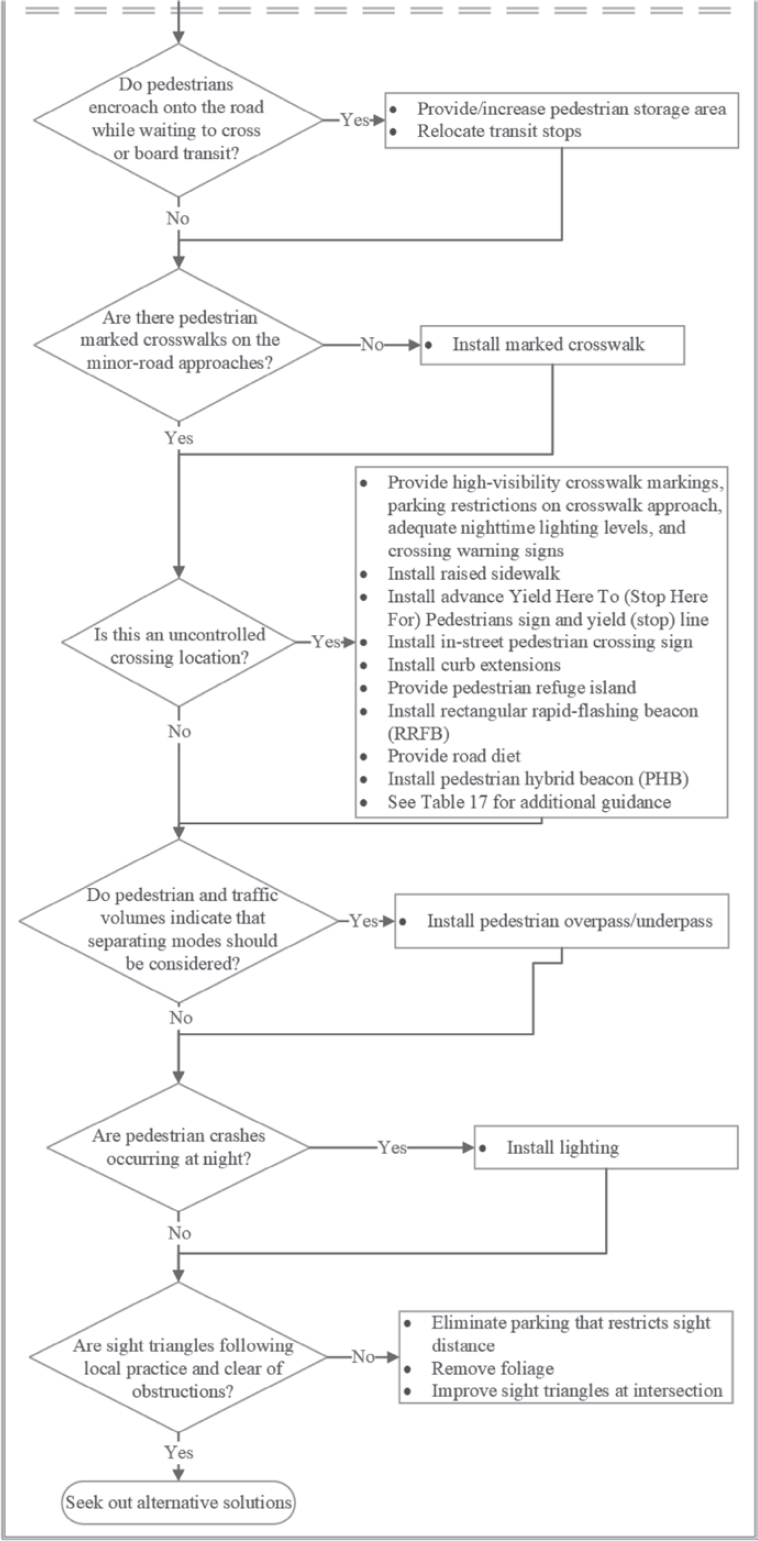
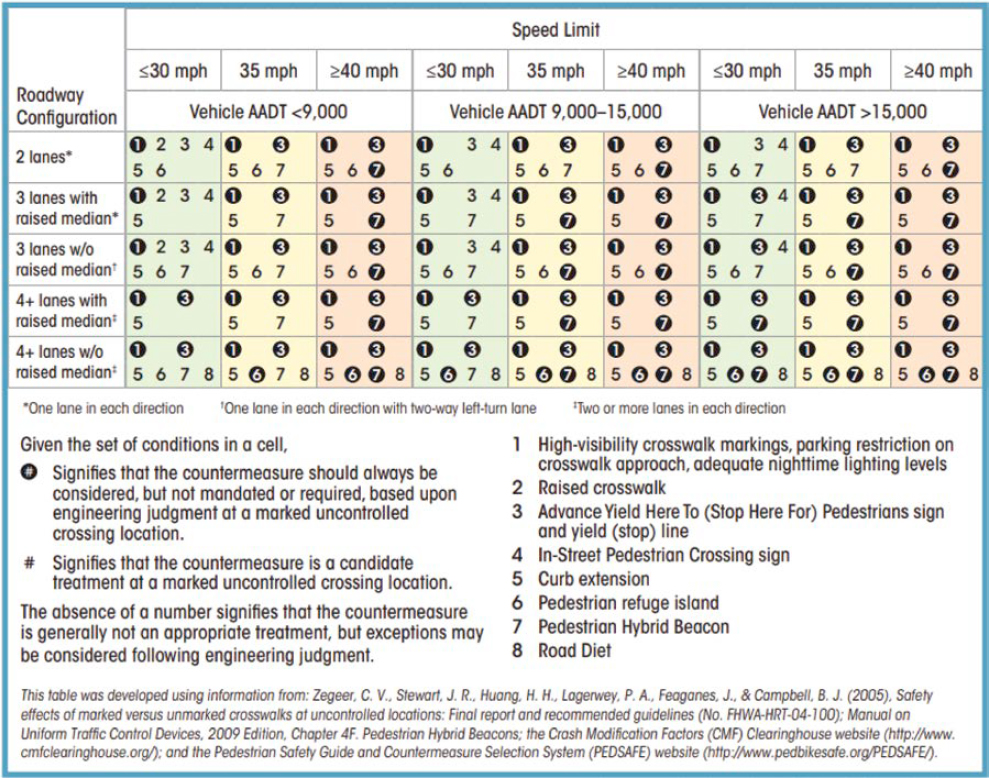
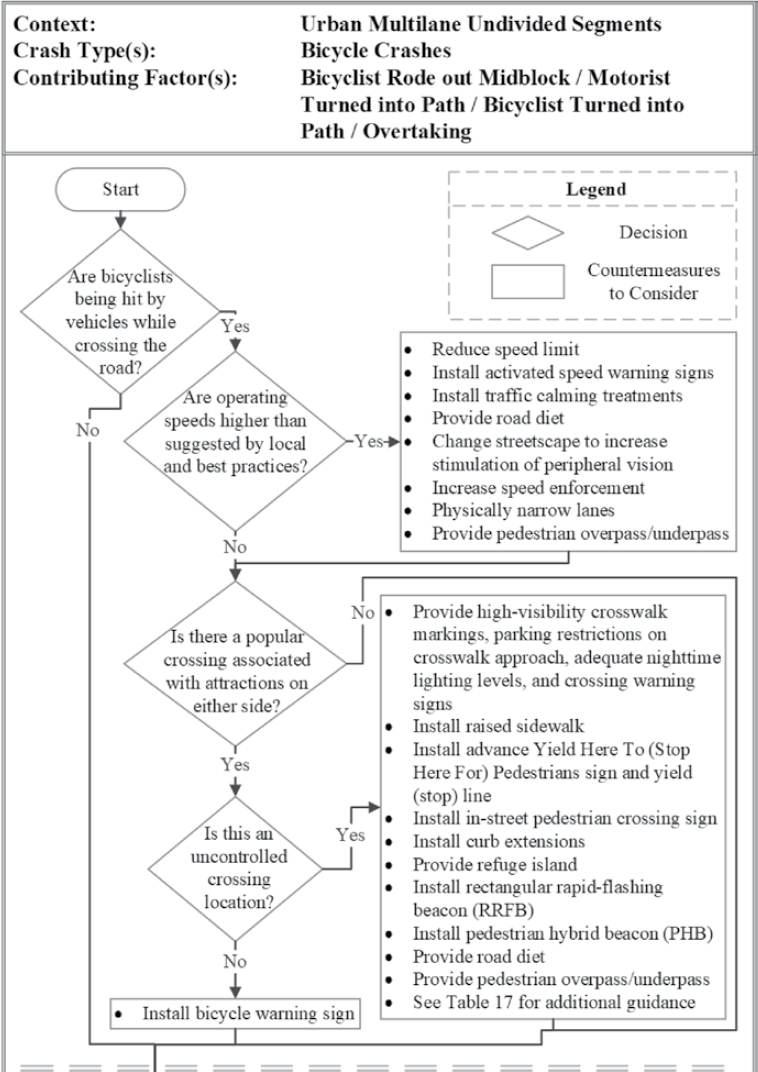
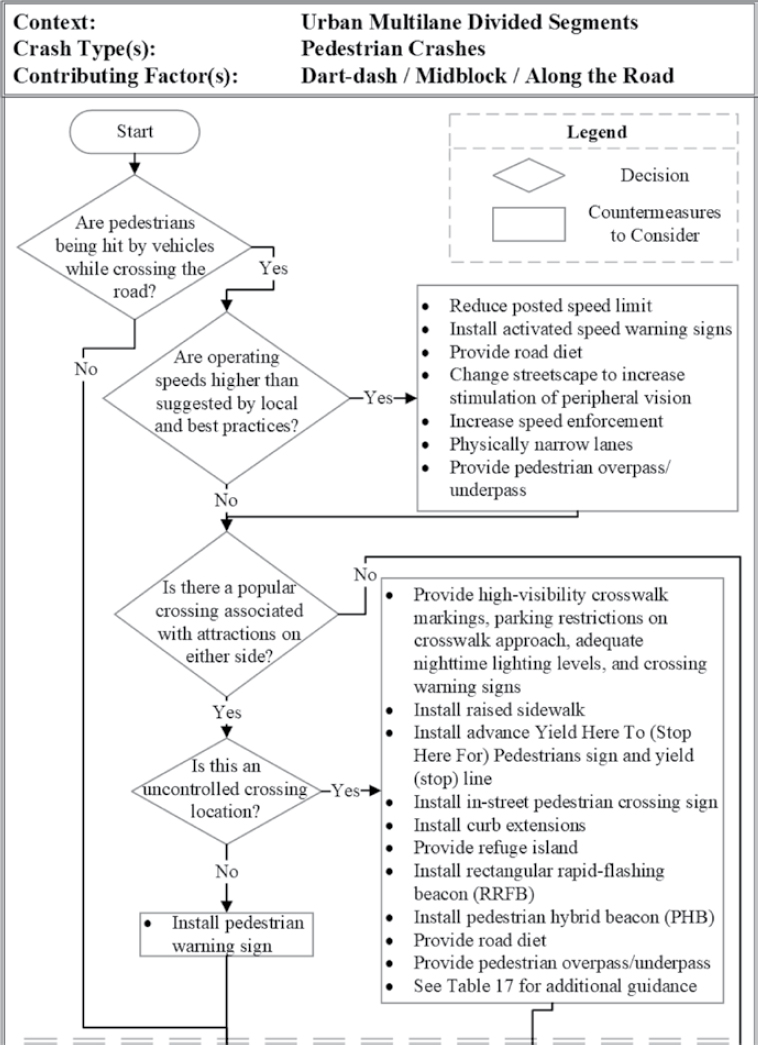
to more than one context (i.e., site type). In some situations, though, the same diagnostic questions may be asked, but the potential countermeasures may differ given the context. Table 17 can be used in conjunction with several decision trees for pedestrian and bicycle crashes, including the decision trees in Figures 62, 63, 71, 72, 76, 77, and 101, as these decision trees refer to Table 17 for additional guidance related to countermeasures for uncontrolled crossing locations.
As users of this toolbox work through the logic of these decision trees to identify a list of potential countermeasures for further consideration in the economic appraisal and project prioritization process, users should exercise engineering judgment and identify trade-offs to assess the applicability of the potential countermeasures to the individual site or sites of interest. The potential countermeasures identified through the diagnostic scenarios may not apply to the individual site or sites of interest. Also, the list of potential countermeasures identified is not necessarily exhaustive. That is, users should also consider the potential implementation of additional countermeasures not identified through the diagnostic scenarios. These decision trees serve to address general conditions and the potential countermeasures identified through the diagnostic scenarios should not be considered as the only countermeasures applicable to remedy the target crash type at the site or sites of interest.
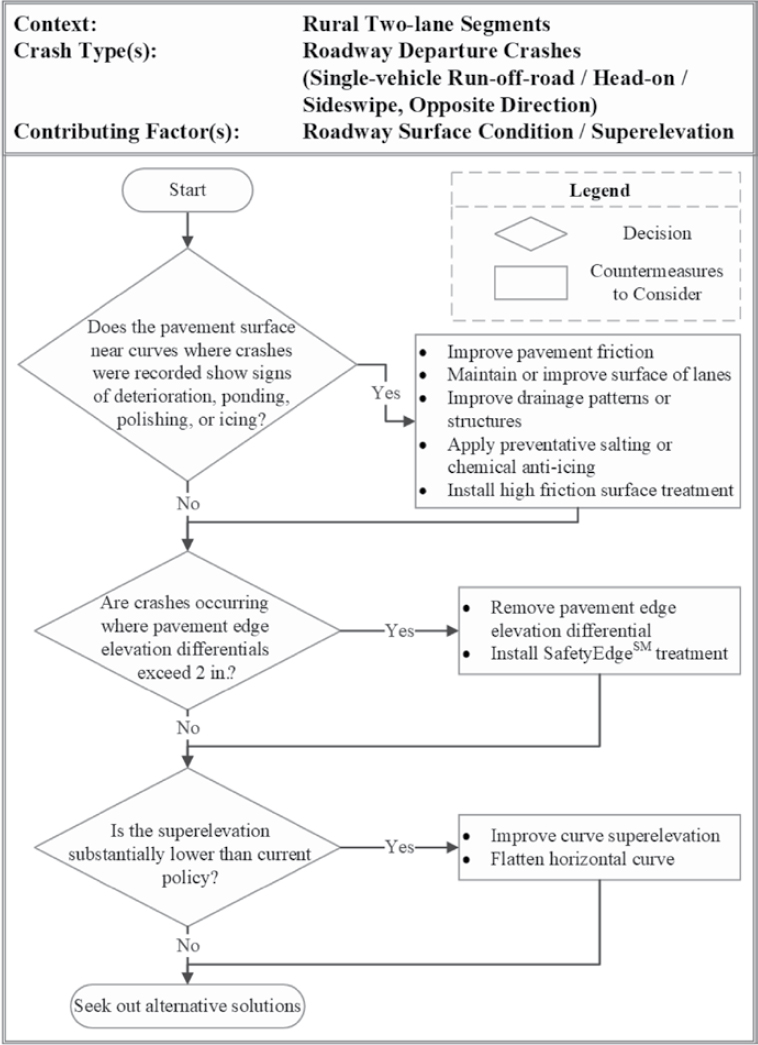
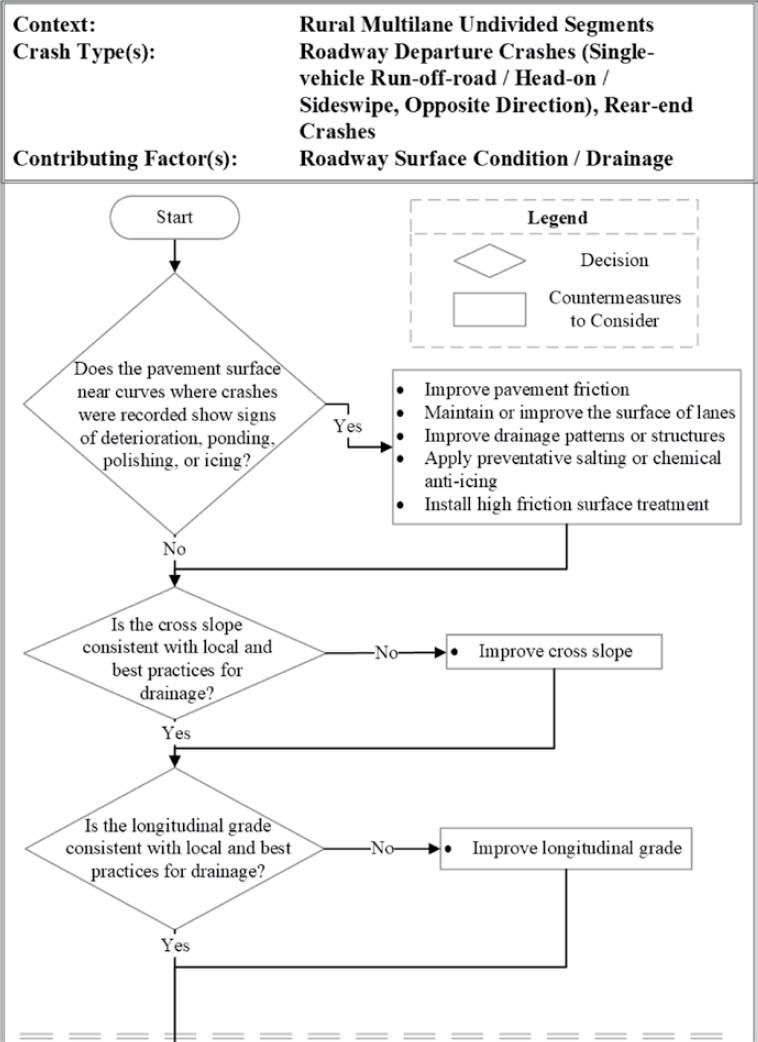
Additionally, the list of potential countermeasures that may be identified using the logic of a given decision tree is not presented in any type of prioritized order for implementation. For example, the first diagnostic question of Figure 26 in reference to rural two-lane segments, roadway departure crashes, and road surface conditions is, “Does the pavement surface near curves where crashes were recorded show signs of deterioration, ponding, polishing, or icing?” If the user responds “Yes,” the potential countermeasures for implementation are presented for consideration as follows:
- Improve pavement friction
- Maintain or improve the surface of lanes
- Improve drainage patterns or structures
- Apply preventative salting or chemical anti-icing
- Install high-friction surface treatment
The order of countermeasures presented from top to bottom in the decision tree figures is not intended to signify any type of prioritization for countermeasure selection or implementation. Priority for selection and implementation is to be based on the applicability of the countermeasure to remedy the crash type of interest at the given site, the cost effectiveness of the implementation of the countermeasure, and other factors, such as trade-offs in safety and
Table 16. Decision trees to support countermeasure selection.
| Crash Type | Type of Segment and Contributing Factor | Figure No. | Page No. |
|---|---|---|---|
| Rural Two-Lane Segments | |||
| Roadway departure crashes (single-vehicle runoff-road) | Driver inattention / impairment | 22 | 90 |
| Roadside design | 23 | 92 | |
| Speed / curvature / guidance | 24 | 95 | |
| Roadway surface condition / superelevation | 25 | 97 | |
| Roadway surface condition / drainage | 26 | 98 | |
| Roadway departure crashes (head-on / sideswipe, opposite direction) | Driver inattention / impairment | 27 | 100 |
| Roadside design | 28 | 102 | |
| Overtaking | 29 | 103 | |
| Speed / curvature / guidance | 30 | 105 | |
| Roadway surface condition / superelevation | 25 | 97 | |
| Roadway surface condition / drainage | 26 | 98 | |
| Rear-end crashes | Driveways / accesses | 31 | 106 |
| Roadway surface condition / drainage | 26 | 98 | |
| Pedestrian crashes | Dart-dash / midblock / along the road | 32 | 108 |
| Bicycle crashes | Bicyclist rode out midblock / motorist turned into path of bicyclist / bicyclist turned into path / overtaking | 33 | 110 |
| Rural Multilane Undivided Segments | |||
| Roadway departure crashes (single-vehicle runoff-road) | Driver inattention / impairment | 34 | 112 |
| Roadside design | 35 | 114 | |
| Speed / curvature / guidance | 36 | 117 | |
| Roadway surface condition / superelevation | 37 | 119 | |
| Roadway surface condition / drainage | 38 | 120 | |
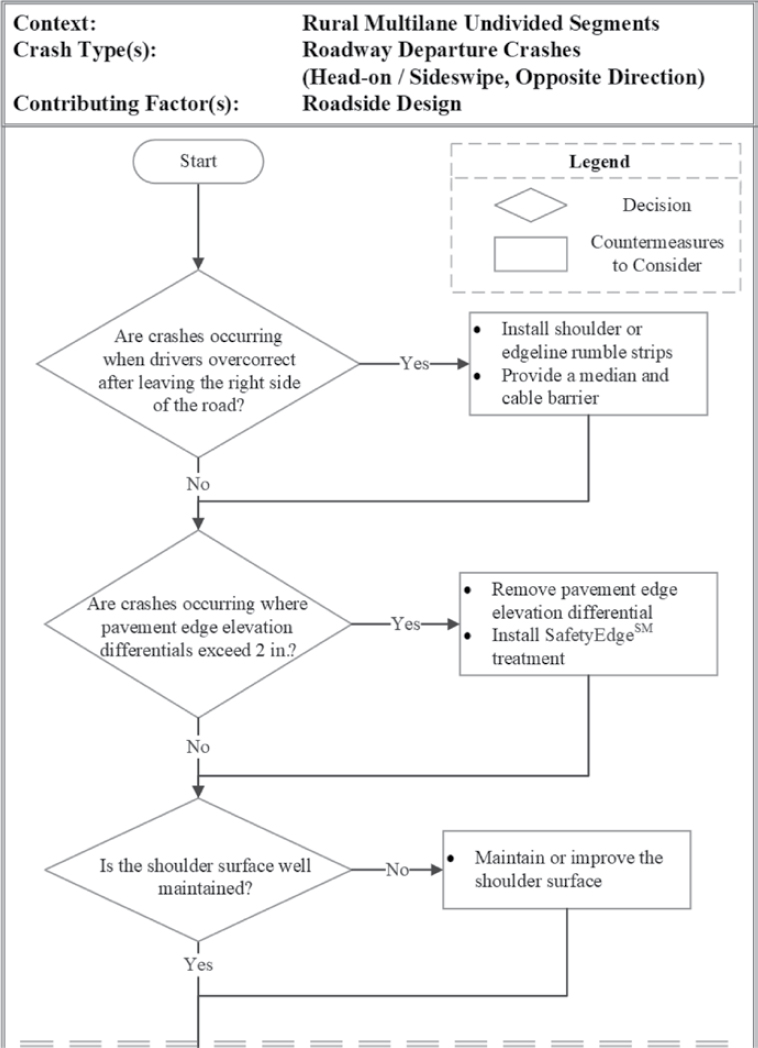
| Roadway departure crashes (head-on / sideswipe, opposite direction) | Driver inattention / impairment | 39 | 122 |
| Roadside design | 40 | 123 | |
| Speed / curvature / guidance | 41 | 125 | |
| Roadway surface condition / superelevation | 37 | 119 | |
| Roadway surface condition / drainage | 38 | 120 | |
| Rear-end crash | Driveways / accesses | 42 | 126 |
| Roadway surface condition / drainage | 38 | 120 | |
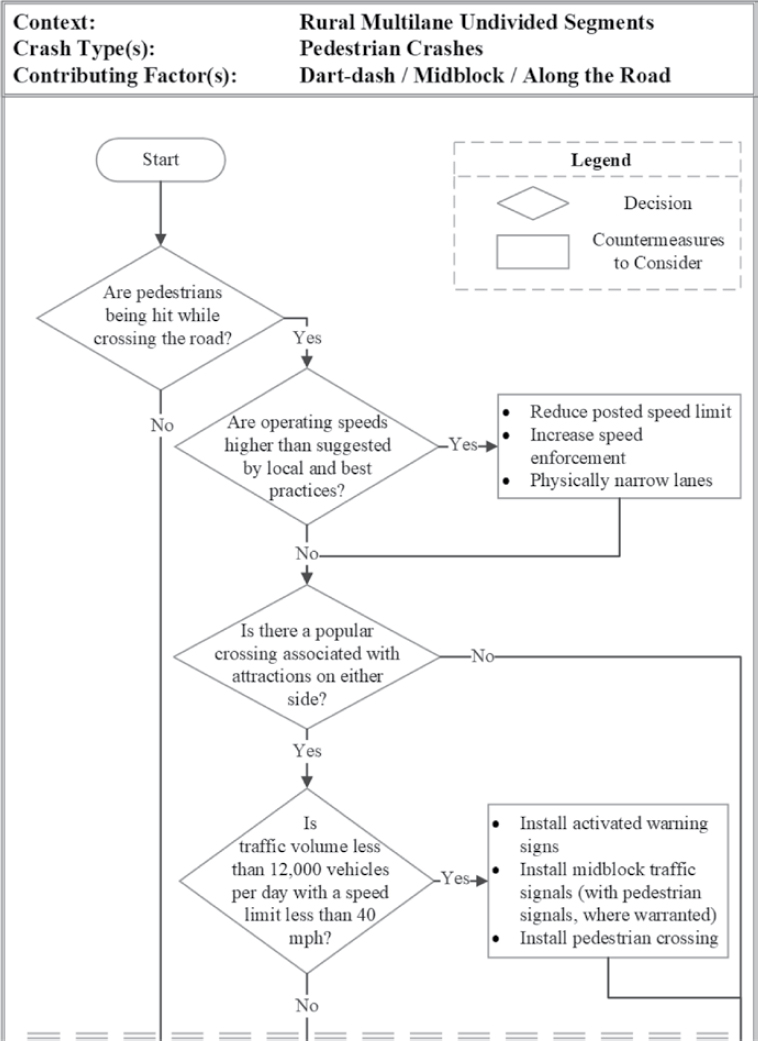
| Pedestrian crashes | Dart-dash / midblock / along the road | 43 | 128 |
| Bicycle crashes | Bicyclist rode out midblock / motorist turned into path of bicyclist / bicyclist turned into path / overtaking | 44 | 130 |
| Rural Multilane Divided Segments | |||
| Roadway departure crashes (single-vehicle runoff-road) | Driver inattention / impairment | 45 | 132 |
| Roadside design | 46 | 134 | |
| Speed / curvature / guidance | 47 | 137 | |
| Roadway surface condition / superelevation | 48 | 139 | |
| Roadway surface condition / drainage | 49 | 140 | |
| Roadway departure crashes (head-on / sideswipe, opposite direction) | Driver inattention / impairment | 50 | 141 |
| Median design | 51 | 142 | |
| Speed / curvature / guidance | 52 | 143 | |
| Rear-end crash | Driveways / accesses | 53 | 145 |
| Roadway surface condition / drainage | 49 | 140 | |
| Pedestrian crashes | Dart-dash / midblock / along the road | 54 | 147 |
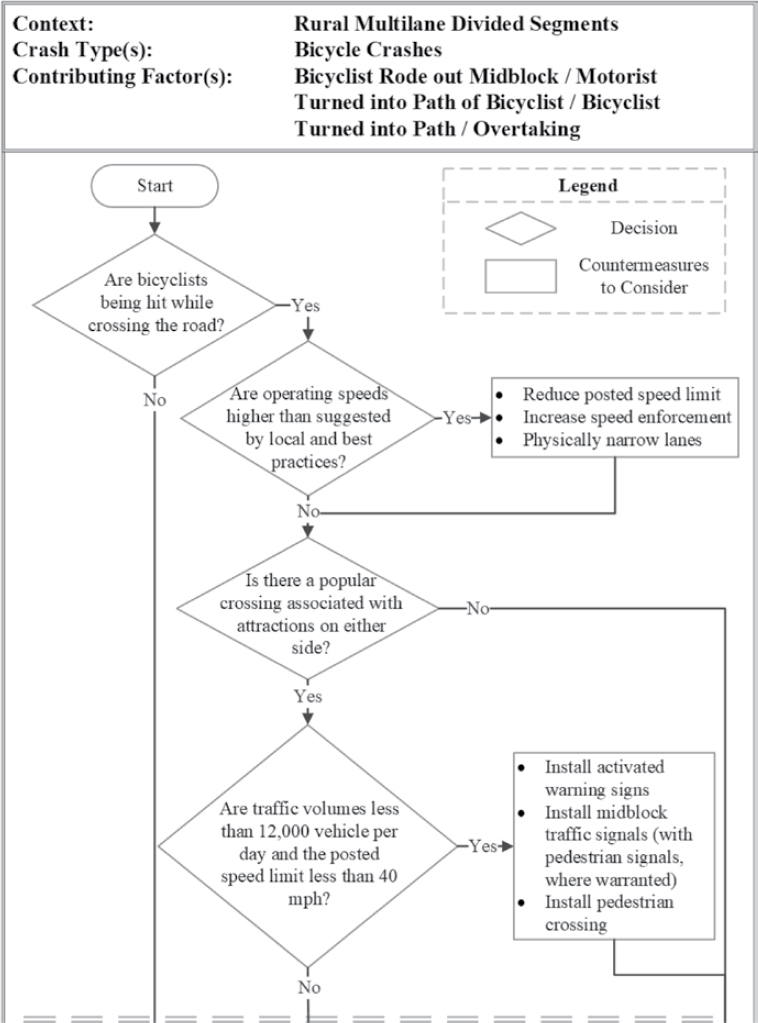
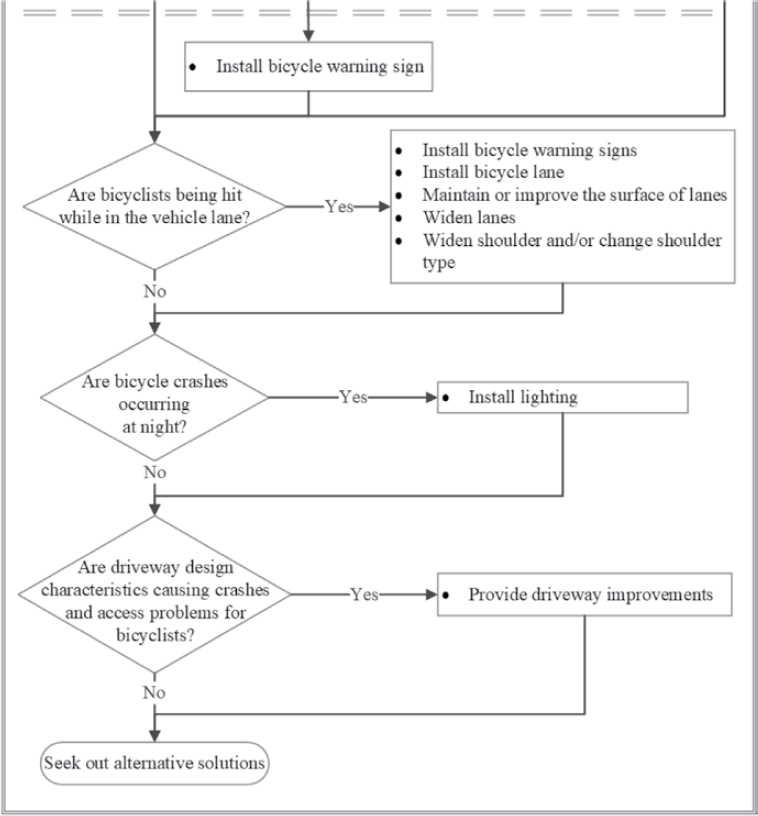
| Bicycle crashes | Bicyclist rode out midblock / motorist turned into path of bicyclist / bicyclist turned into path / overtaking | 55 | 149 |
| Urban Two-lane Segments | |||
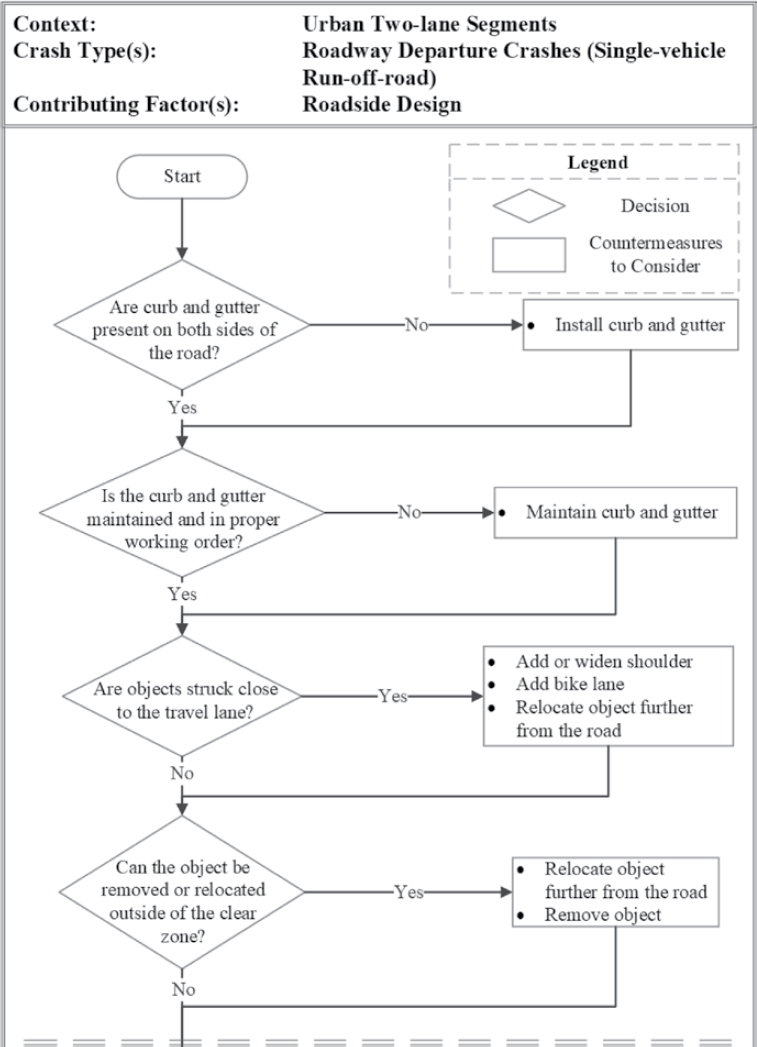
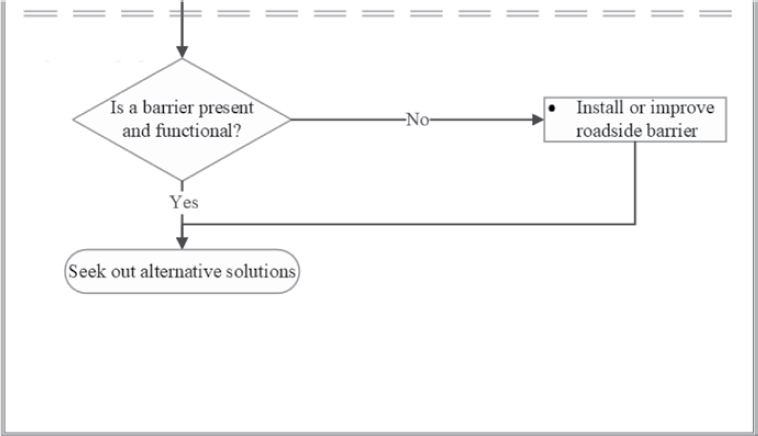
| Roadway departure crashes (single-vehicle runoff-road) | Roadside design | 56 | 151 |
| Speed / curvature / guidance | 57 | 153 | |
| Roadway surface condition / drainage | 58 | 154 | |
| Roadway departure crashes (head-on / sideswipe, opposite direction) | Roadway surface condition / drainage | 58 | 154 |
| Overtaking | 59 | 156 | |
| Driver inattention / impairment | 60 | 157 | |
| Rear-end crashes | Roadway surface condition / drainage | 58 | 154 |
| Driveways / accesses | 61 | 158 | |
| Angle crashes | Driveways / accesses | 61 | 158 |
| Pedestrian crashes | Dart-dash / midblock / along the road | 62 | 160 |
| Bicycle crashes | Bicyclist rode out midblock / motorist turned into path of bicyclist / bicyclist turned into path / overtaking | 63 | 162 |
| Urban Multilane Undivided Segments | |||
| Roadway departure crashes (single-vehicle runoff-road) | Roadside design | 64 | 164 |
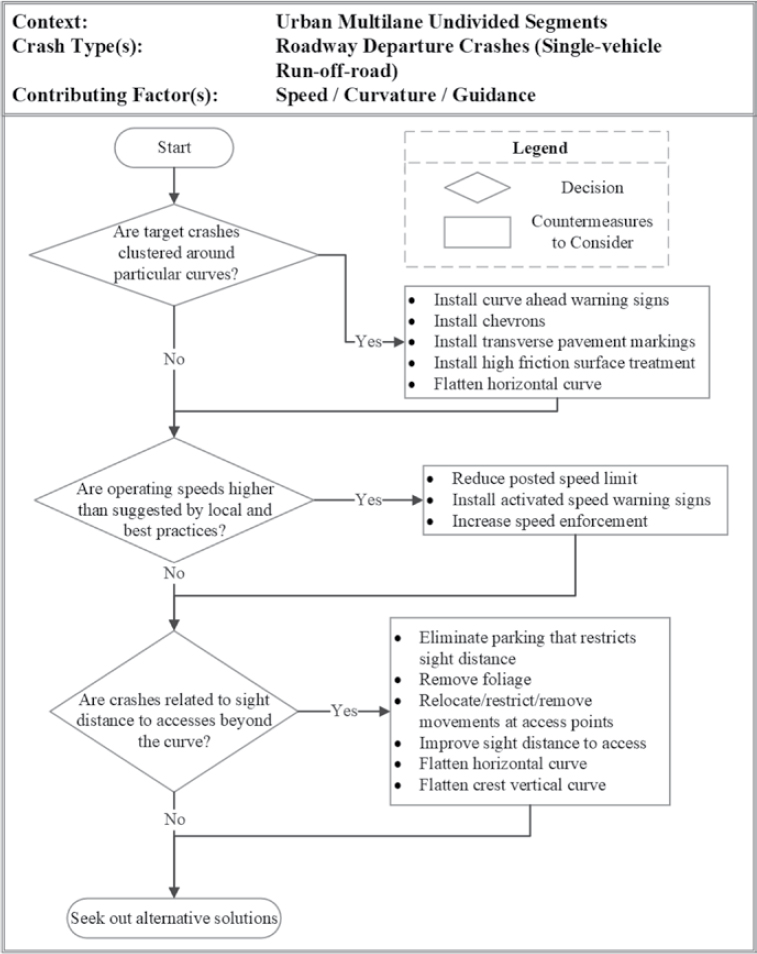
| Speed / curvature / guidance | 65 | 165 | |
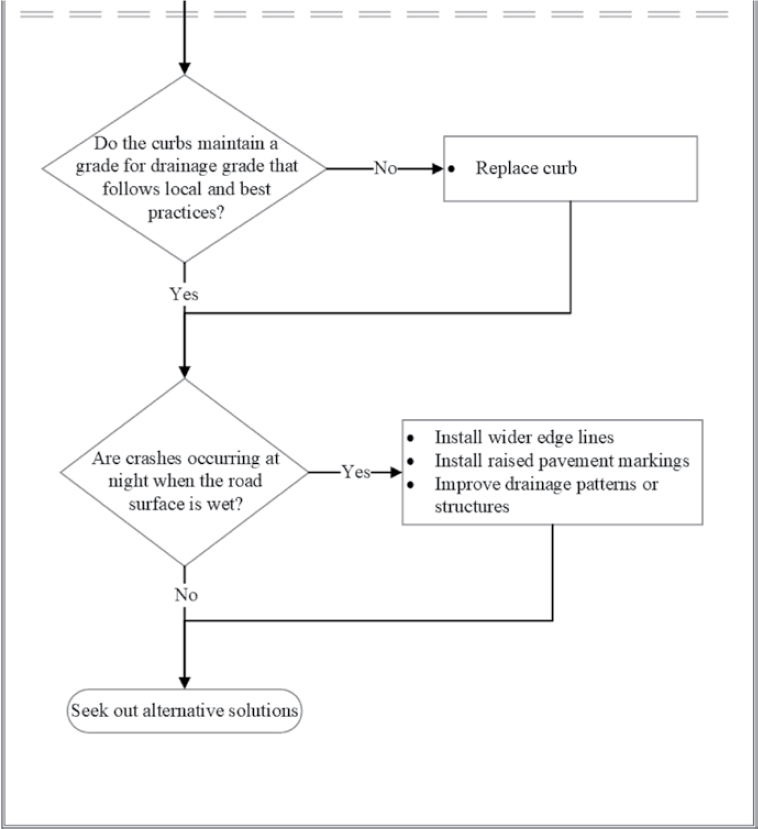
| Roadway surface condition / drainage | 66 | 166 | |
| Roadway departure crashes (head-on / sideswipe, opposite direction) | Roadway surface condition / drainage | 66 | 166 |
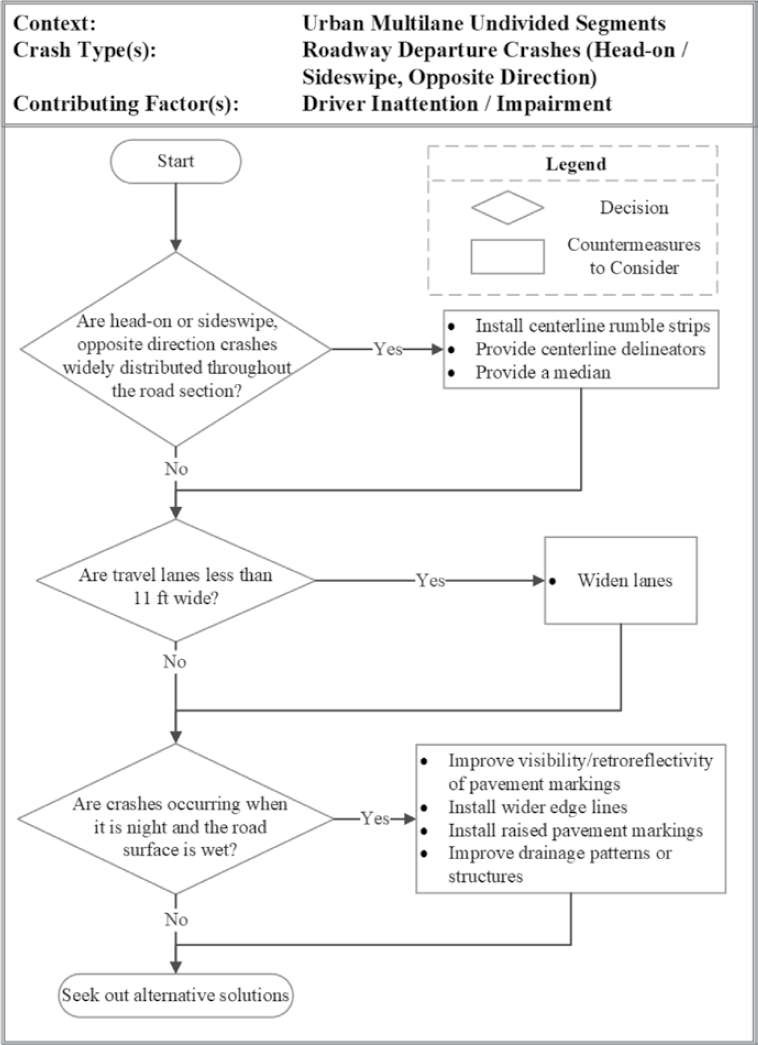
| Driver inattention / impairment | 67 | 168 | |
| Speed / curvature / guidance | 68 | 169 | |
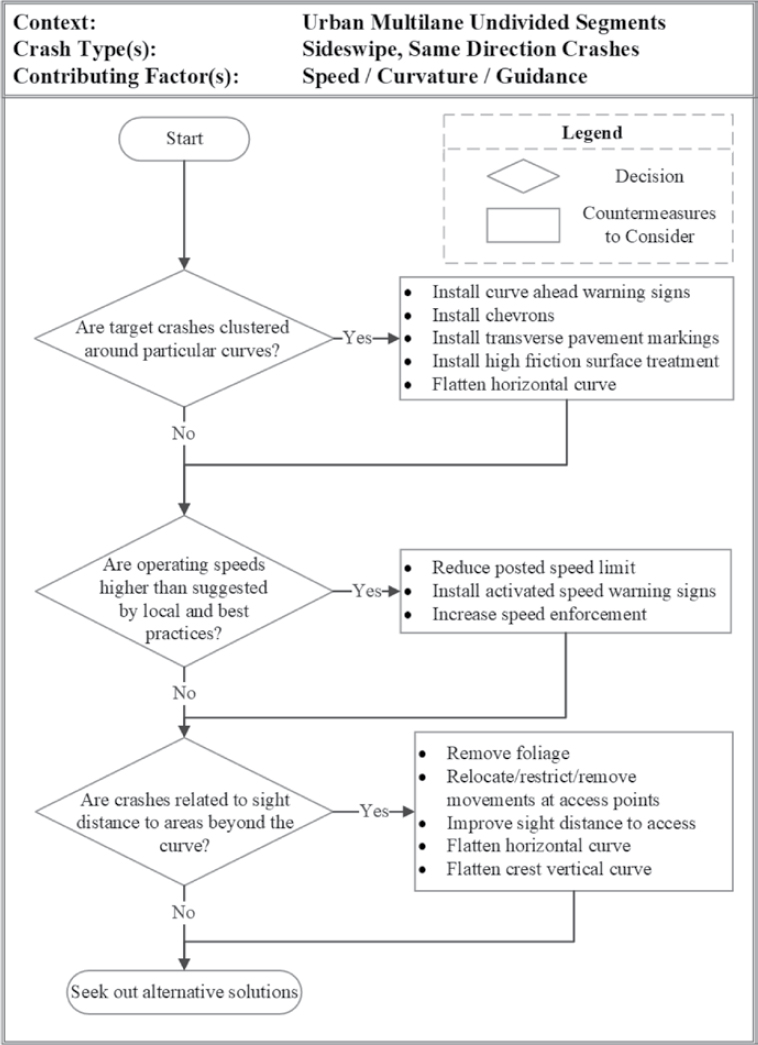
| Sideswipe, same direction crashes | Speed / curvature / guidance | 69 | 170 |
| Driveways / accesses | 70 | 171 | |
| Rear-end crashes | Driveways / accesses | 70 | 171 |
| Angle crashes | Driveways / accesses | 70 | 171 |
| Pedestrian crashes | Dart-dash / midblock / along the road | 71 | 173 |
| Bicycle crashes | Bicyclist rode out midblock / motorist turned into path of bicyclist / bicyclist turned into path / overtaking | 72 | 175 |
| Urban Multilane Divided Segments | |||
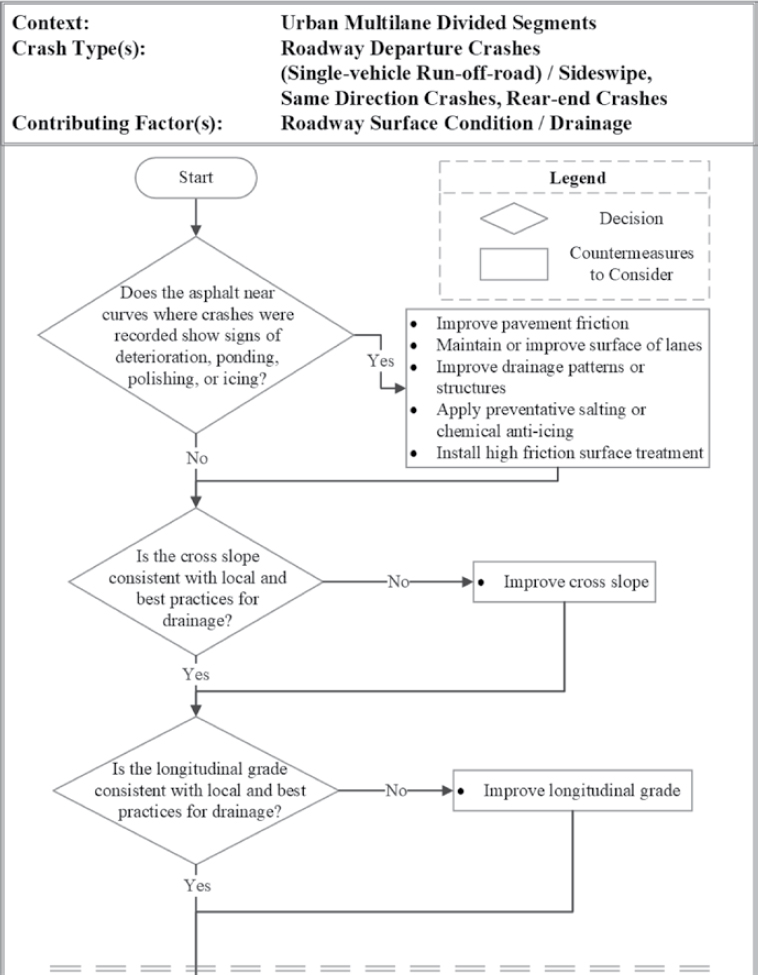
| Roadway departure crashes (single-vehicle runoff-road) | Roadway surface condition / drainage | 73 | 177 |
| Speed / curvature / guidance | 74 | 179 | |
| Sideswipe, same direction crashes | Roadway surface condition / drainage | 73 | 177 |
| Speed / curvature / guidance | 74 | 179 | |
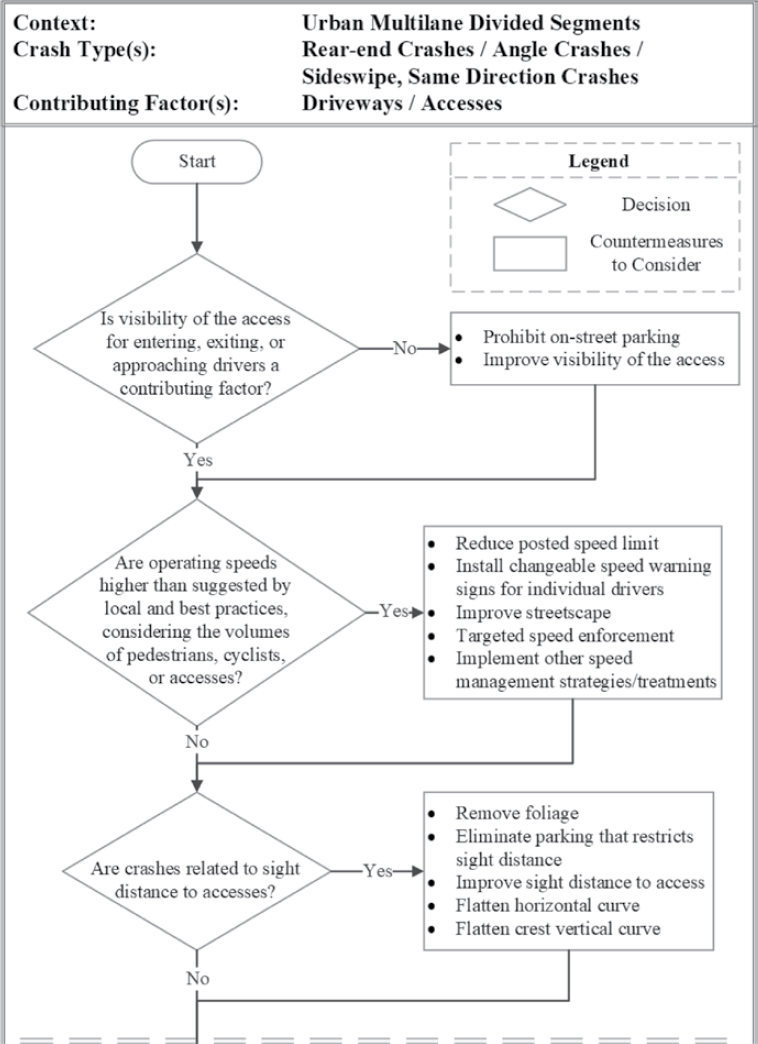
| Driveways / accesses | 75 | 180 | |
| Rear-end crashes | Roadway surface condition / drainage | 73 | 177 |
| Driveways / accesses | 75 | 180 | |
| Angle crashes | Driveways / accesses | 75 | 180 |
| Pedestrian crashes | Dart-dash / midblock / along the road | 76 | 182 |
| Bicycle crashes | Bicyclist rode out midblock / motorist turned into path of bicyclist / bicyclist turned into path / overtaking | 77 | 184 |
| Rural and Urban Signalized Intersections | |||
| Angle crashes | Signal visibility | 78 | 187 |
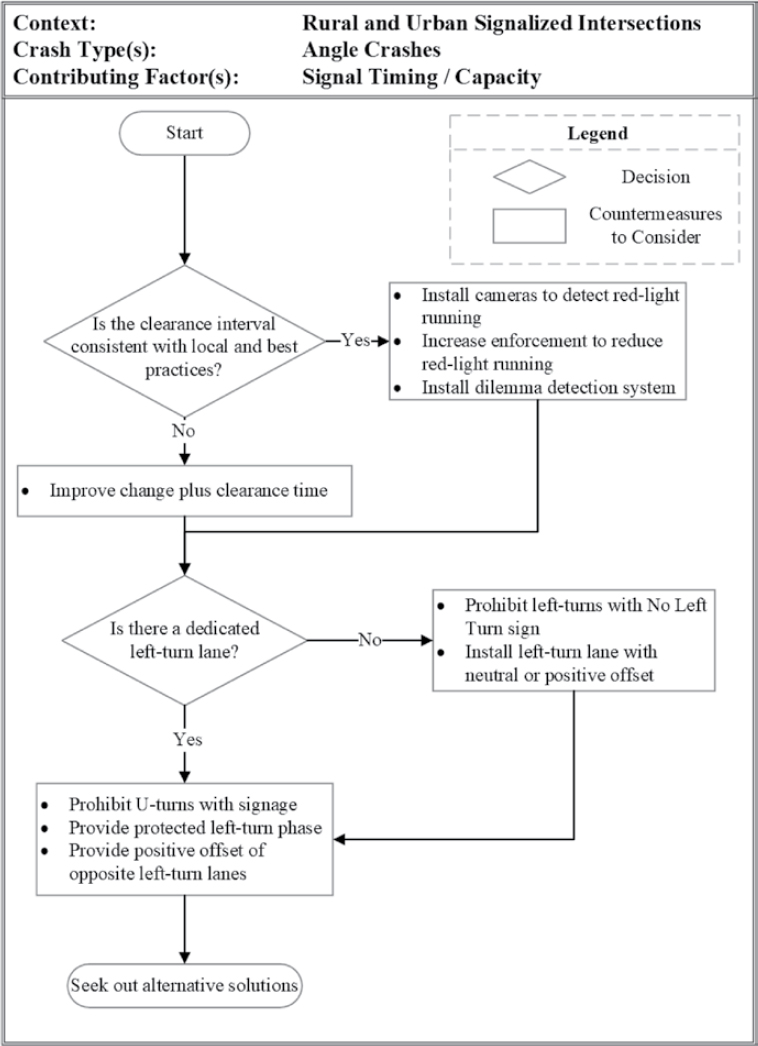
| Signal timing / capacity | 79 | 189 | |
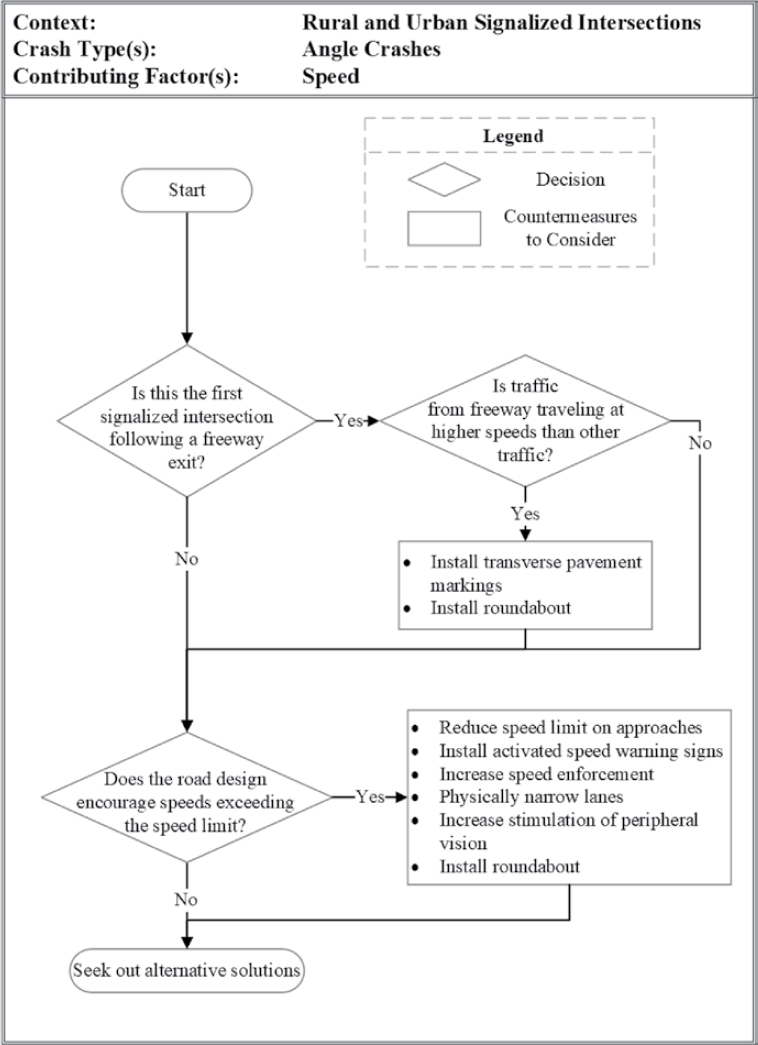
| Speed | 80 | 190 | |
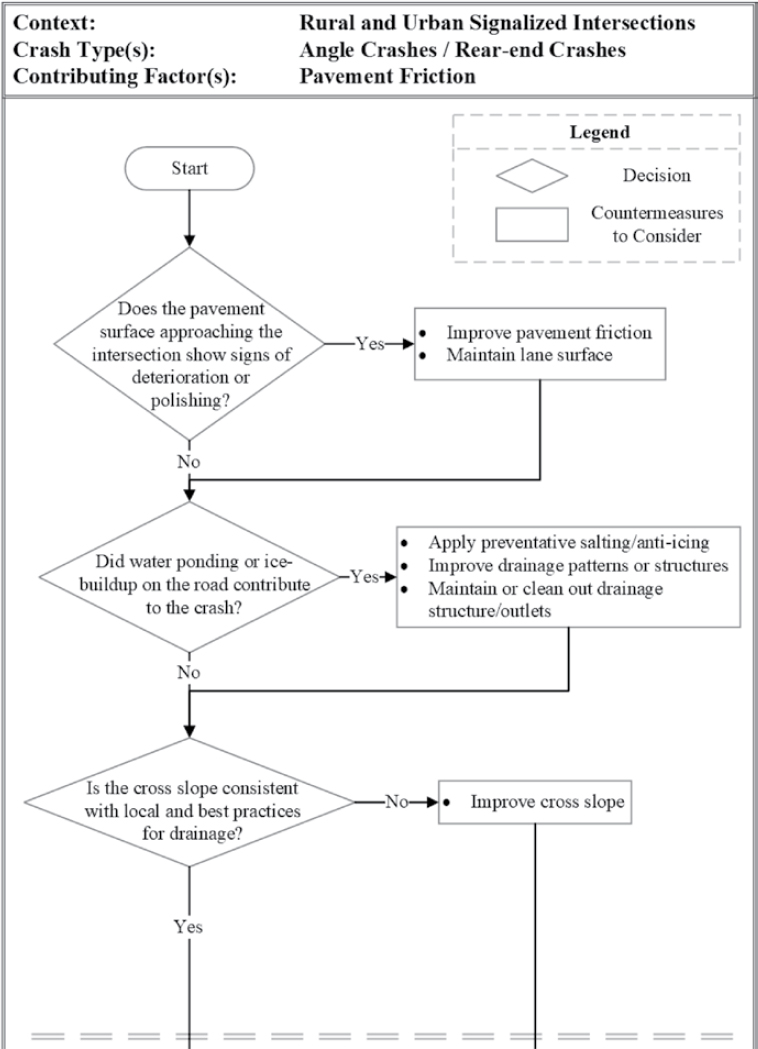
| Pavement friction | 81 | 191 | |
| Sight distance | 82 | 193 | |
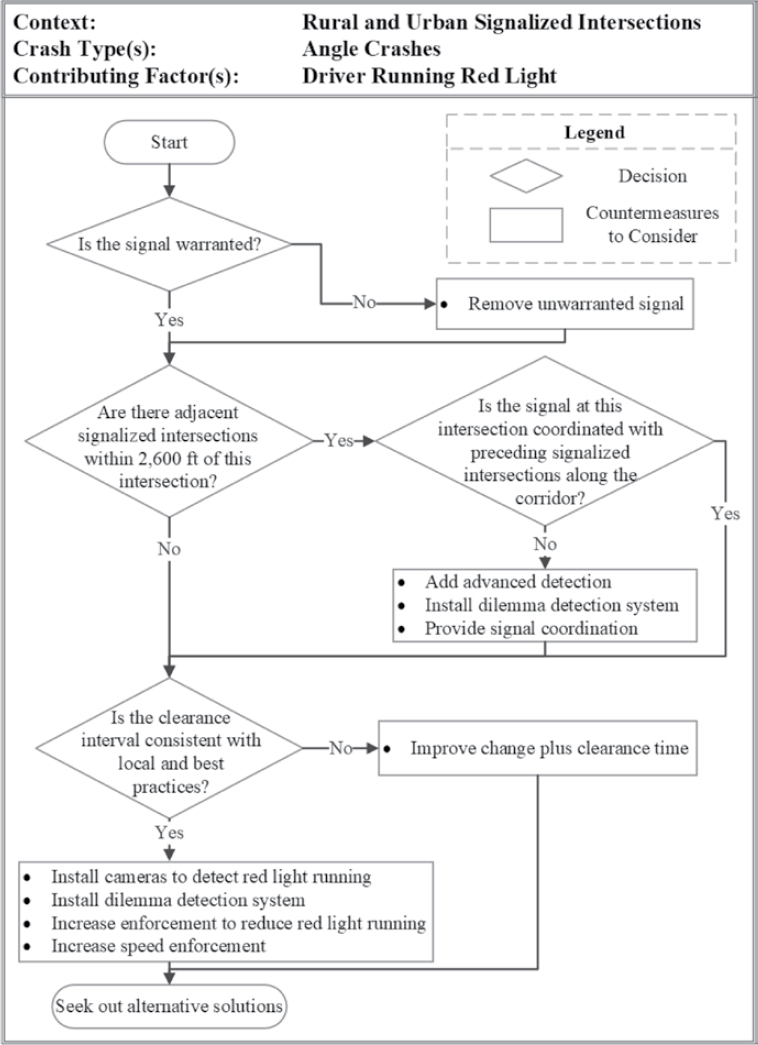
| Driver running red light | 83 | 194 | |
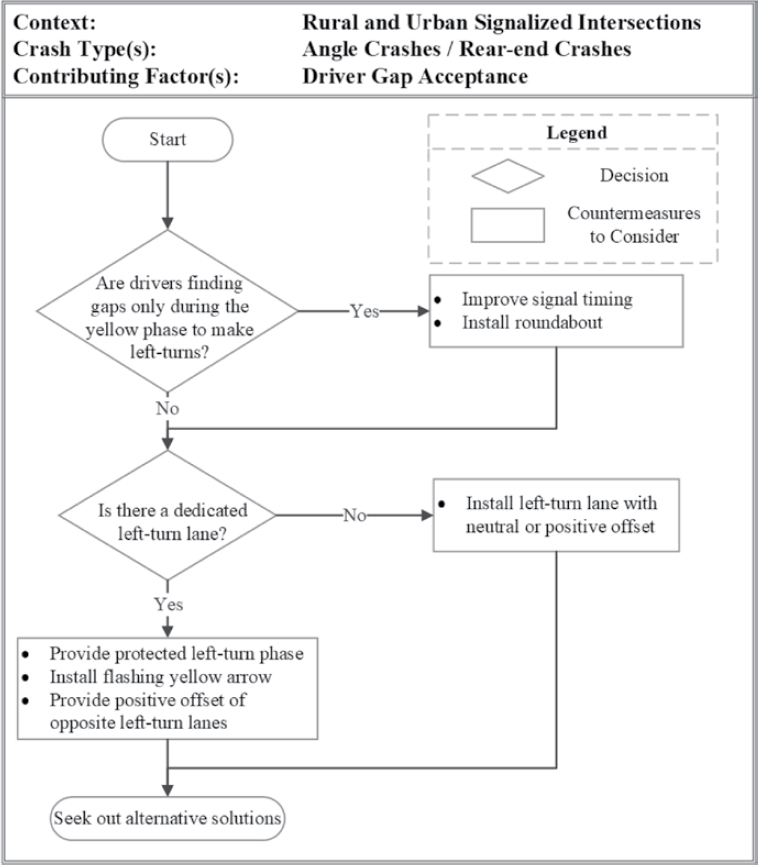
| Driver gap acceptance | 84 | 195 | |
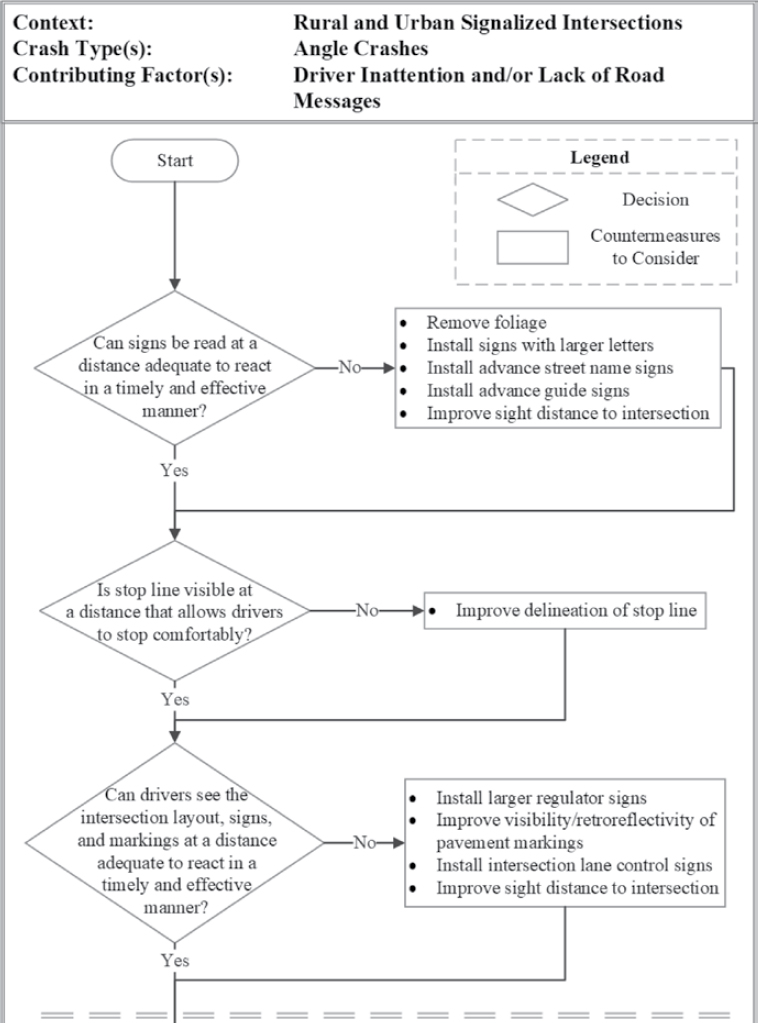
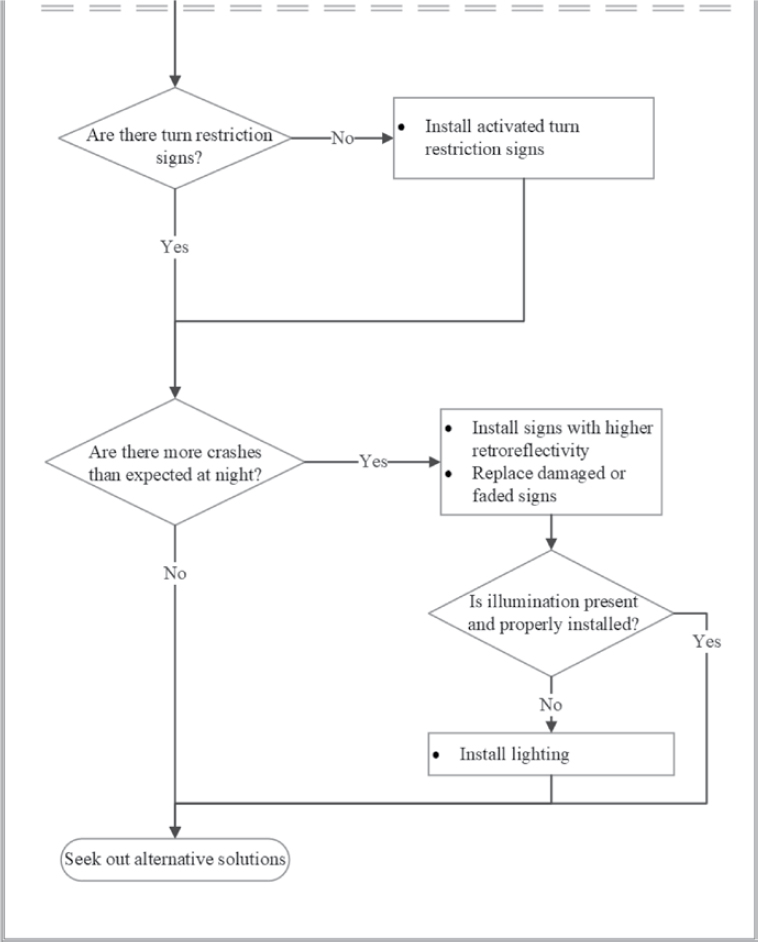
| Driver inattention and/or lack of road messages | 85 | 196 | |
| Driveways / accesses | 86 | 198 | |
| Rear-end crashes | Signal visibility | 78 | 187 |
| Signal timing / capacity | 87 | 200 | |
| Speed | 88 | 202 | |
| Pavement friction | 81 | 191 | |
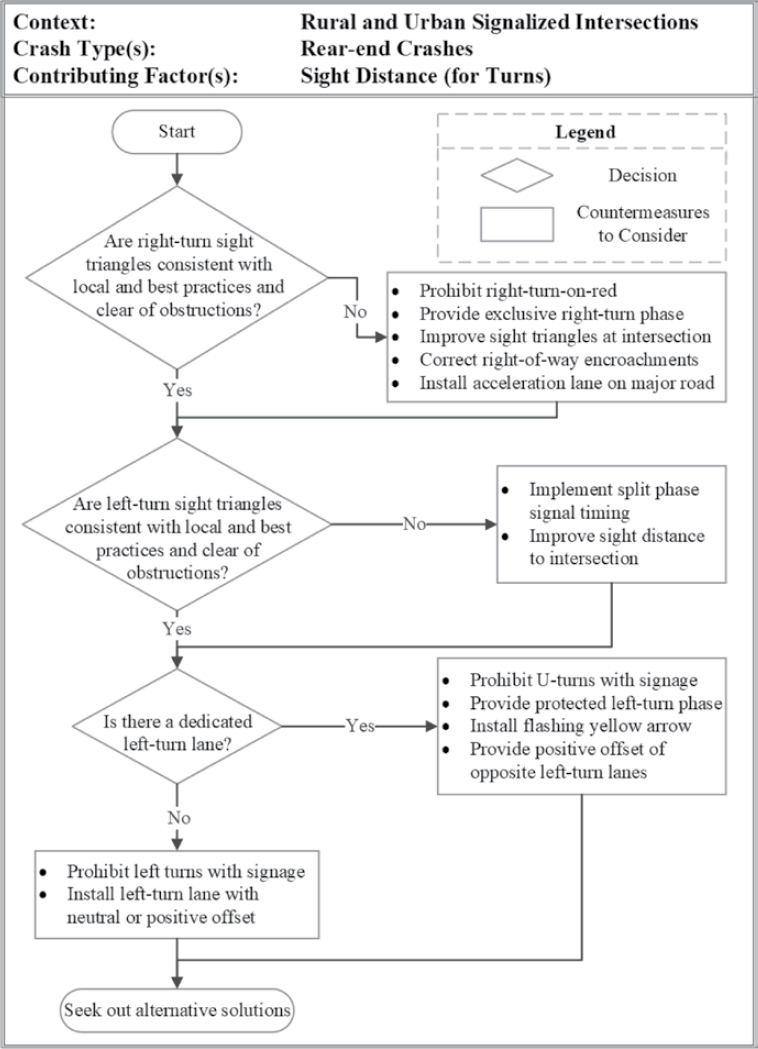
| Sight distance (for turns) | 89 | 203 | |
| Driver gap acceptance | 84 | 195 | |
| Guidance / road messages | 90 | 204 | |
| Driveways / accesses | 86 | 198 | |
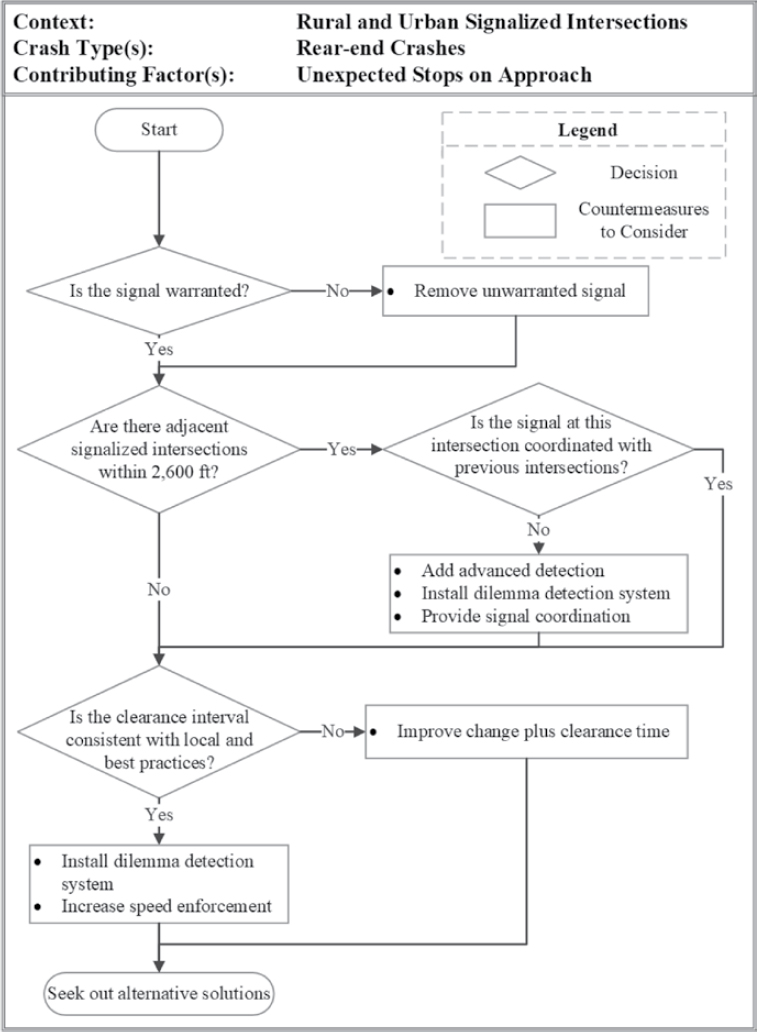
| Unexpected stops on approach | 91 | 205 | |
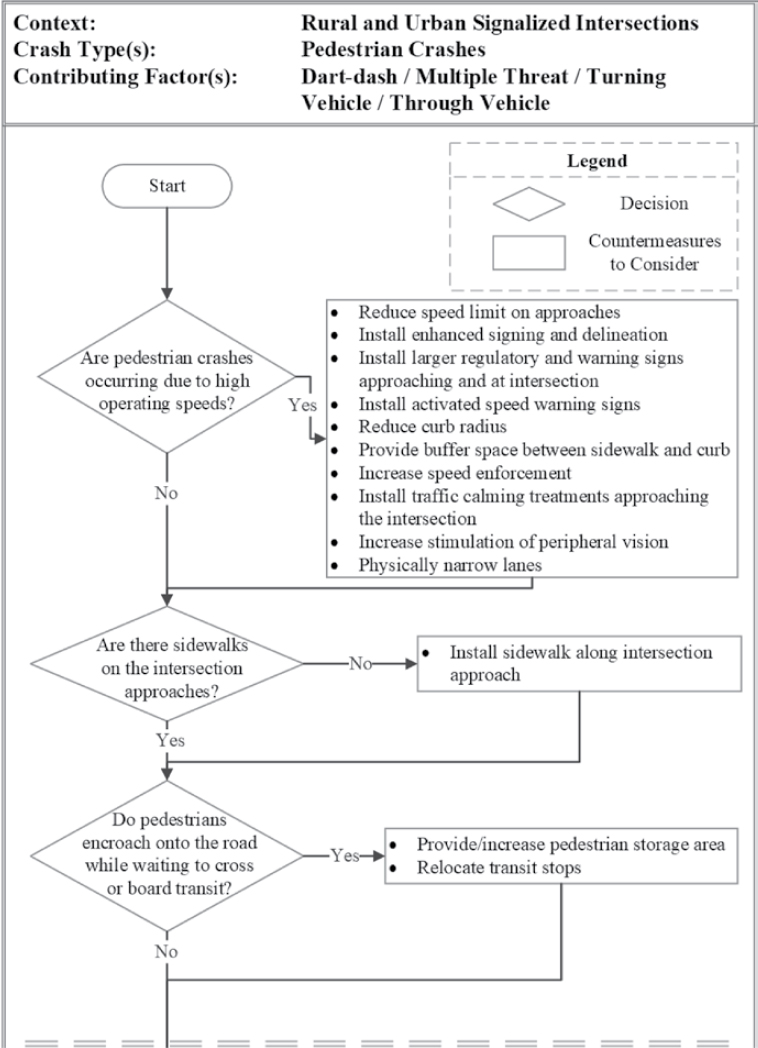
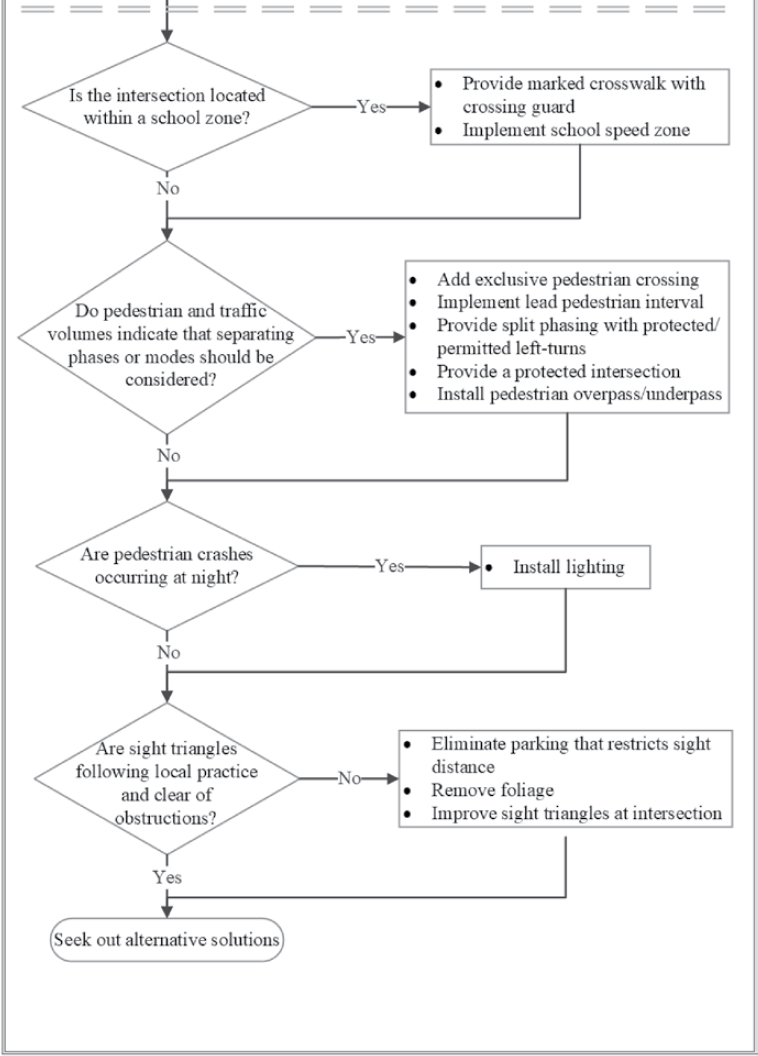
| Pedestrian crashes | Dash-dart / multiple threat / turning vehicle / through vehicle | 92 | 206 |
| Bicycle crashes | Motorist failed to yield / bicyclist failed to yield / turning vehicle | 93 | 209 |
| Rural and Urban Unsignalized Intersections | |||
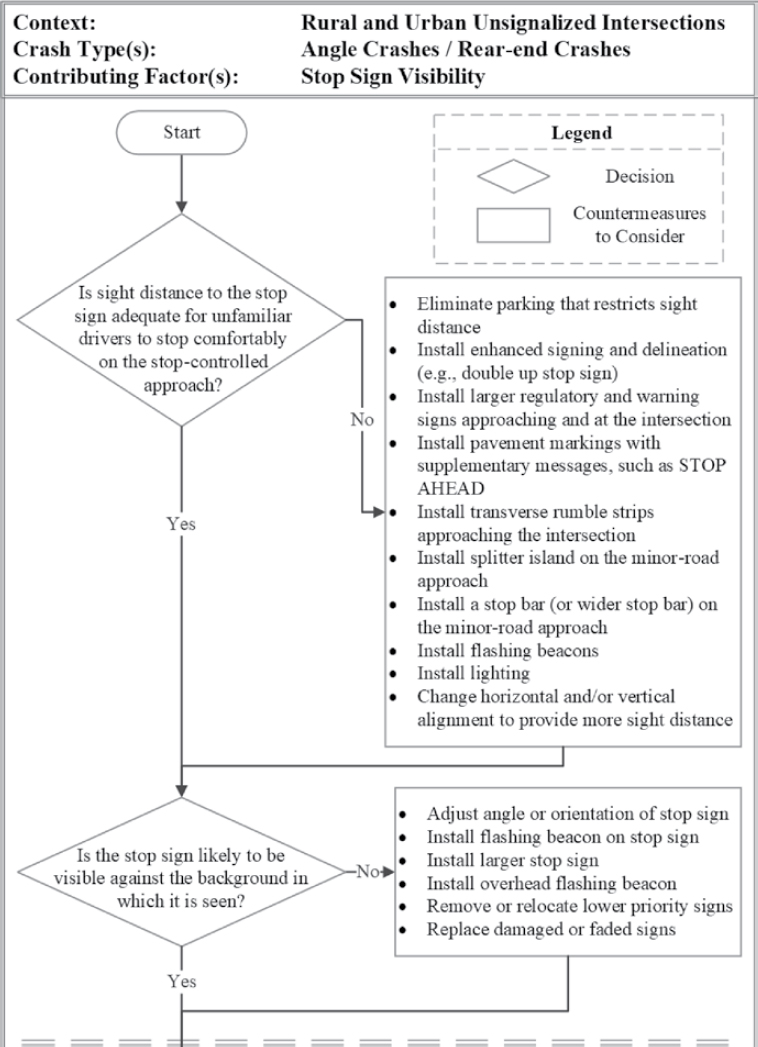
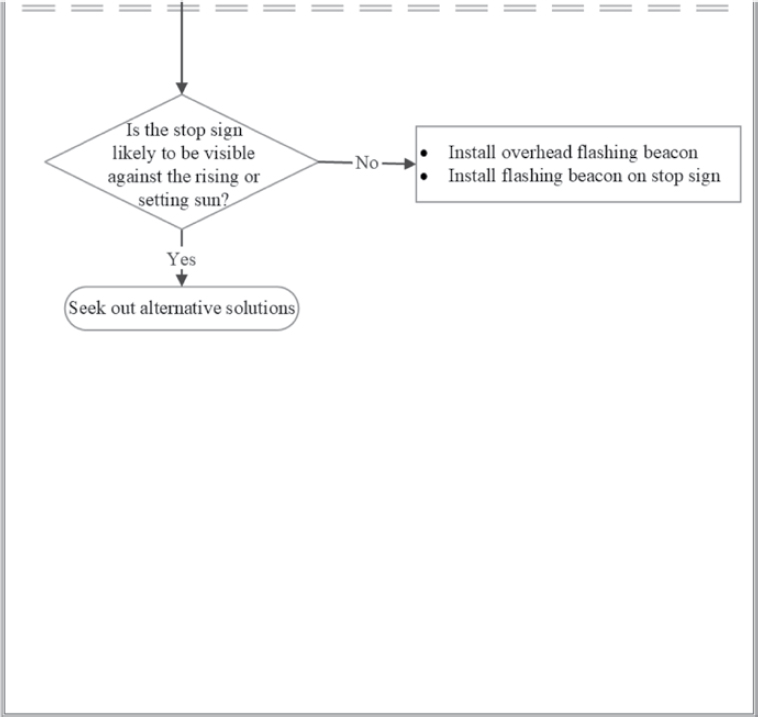
| Angle crashes / rear-end crashes | Stop sign visibility | 94 | 211 |
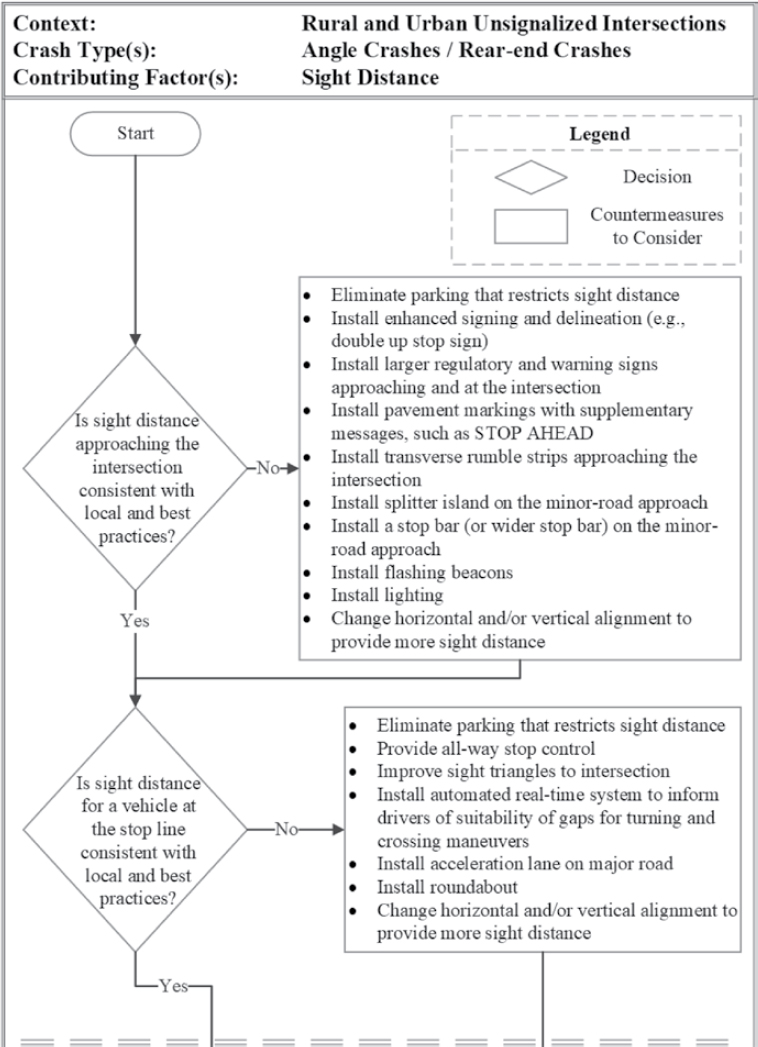
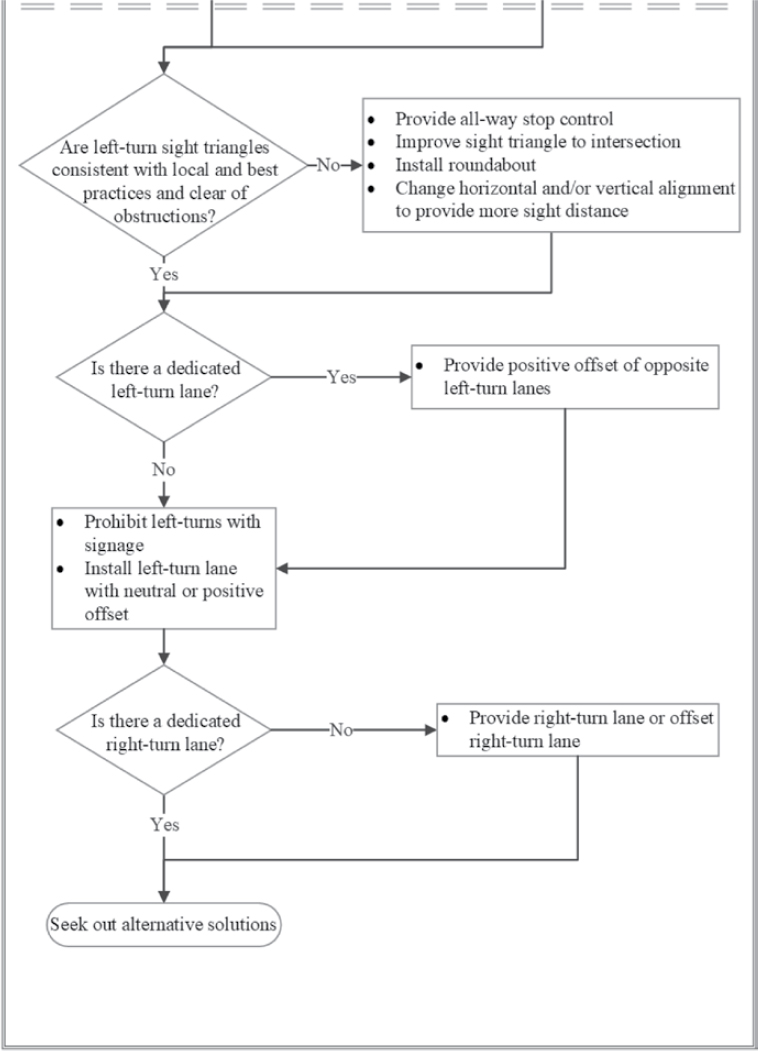
| Sight distance | 95 | 213 | |
| Speed | 96 | 215 | |
| Pavement friction | 97 | 216 | |
| Driver gap acceptance | 98 | 218 | |
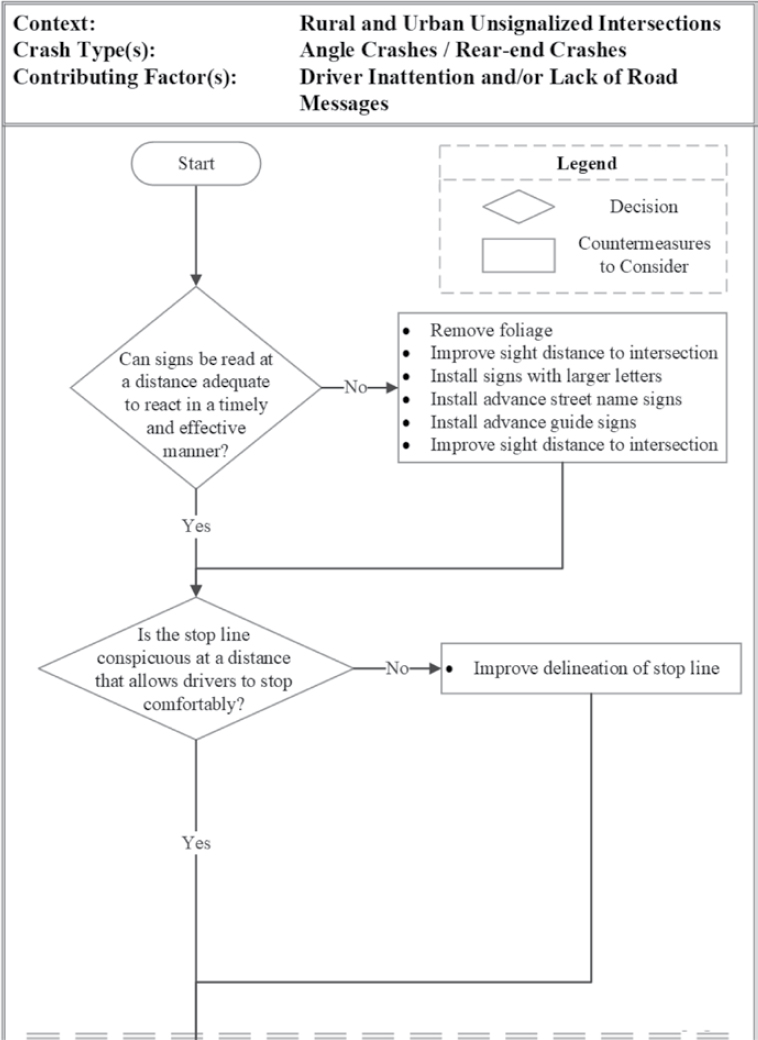
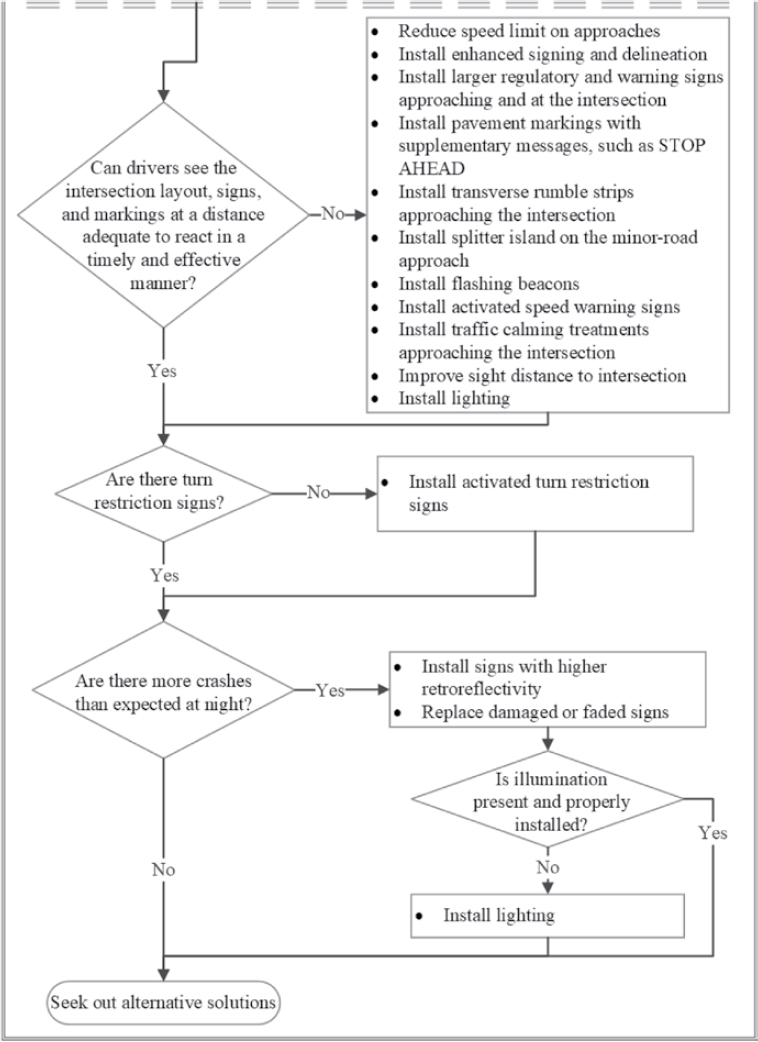
| Driver inattention and/or lack of road messages | 99 | 220 | |
| Driveways / accesses | 100 | 222 | |
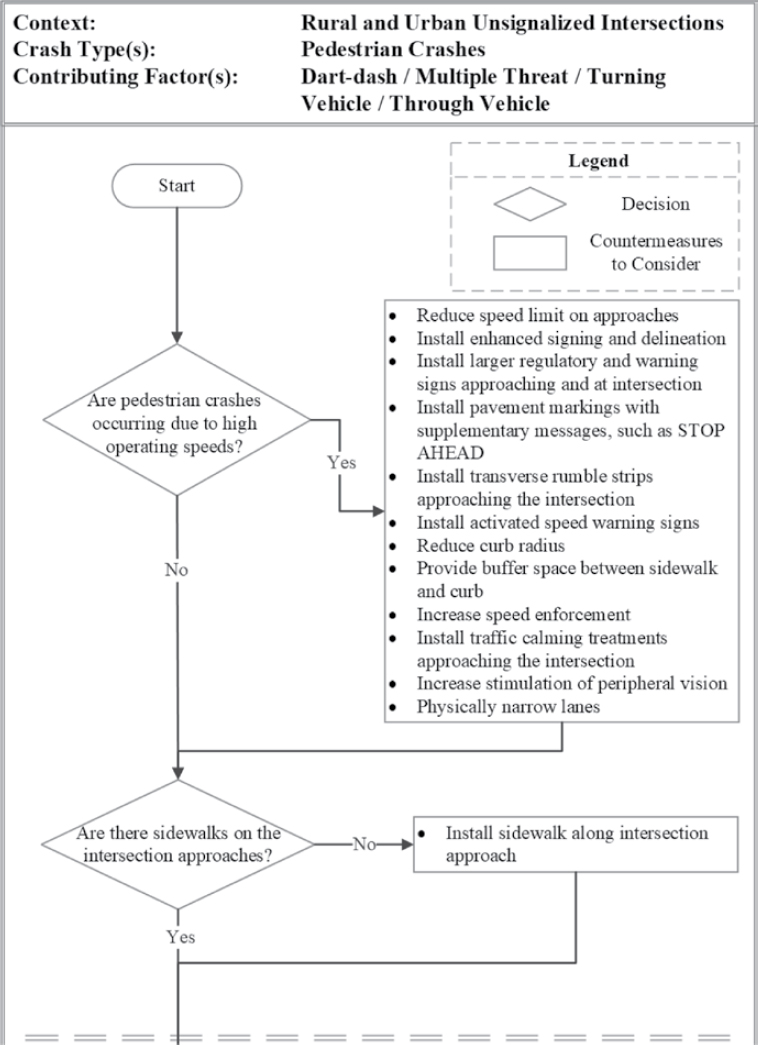
| Pedestrian crashes | Dash-dart / multiple threat / turning vehicle / through vehicle | 101 | 224 |
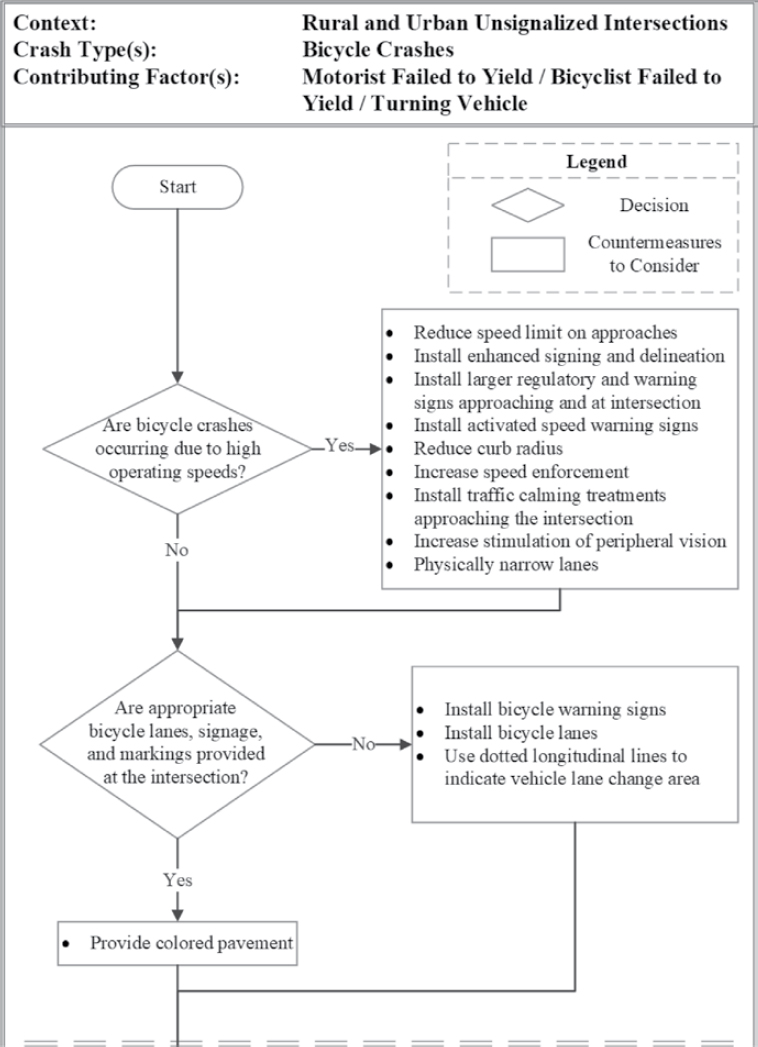
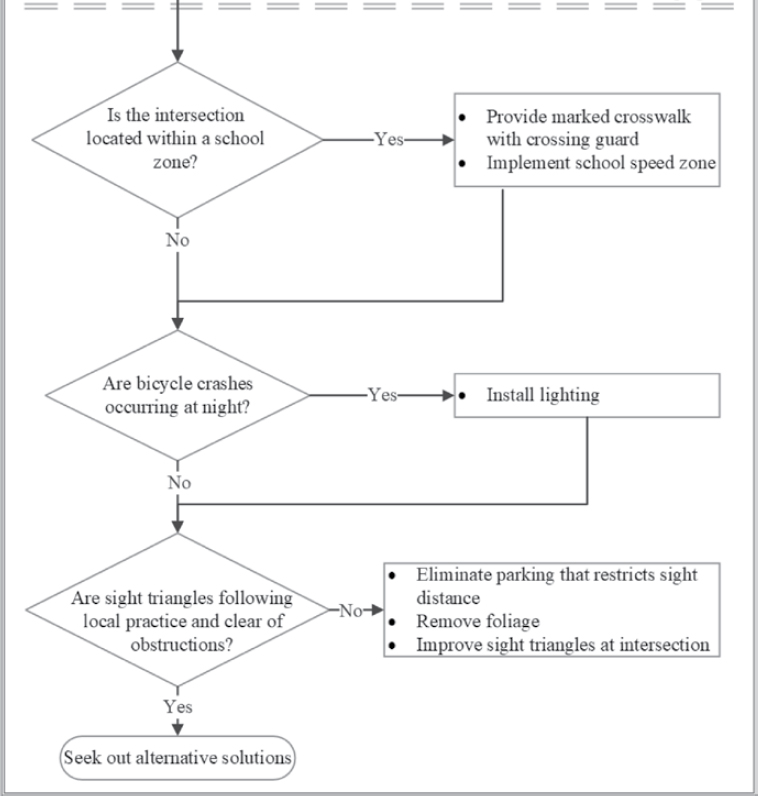
| Bicycle crashes | Motorist failed to yield / bicyclist failed to yield / turning vehicle | 102 | 226 |
Table 17. Suggested countermeasures for uncontrolled crossing locations (Source: Blackburn et al., 2018).
mobility between all road users. The user may want to give a countermeasure greater consideration for implementation if (1) the countermeasure was identified for implementation more than once in response to different diagnostic questions or (2) when the same countermeasure was identified for potential implementation in response to different combinations of contexts, crash types, and contributing factors. Even in these situations, the economic appraisal and project prioritization process, following countermeasure selection, will provide additional details to inform decisions regarding prioritization for implementation based on economic performance measures.
Several of the decision trees have one or two questions related to speed. However, in most of the diagnostic scenarios, reducing speeds either along the roadway segment or the approach to the intersection may likely reduce crash frequencies and severities. Thus, as a general rule of thumb, users should consider various speed management techniques, either through the implementation of traffic control devices, changes to the roadway geometrics, and installation of traffic calming treatments and gateway treatments to reduce the frequency and severity of the target crashes. In general, if you cannot reduce speeds, you should separate road users in space. Implementation of speed management techniques to reduce operating speeds is consistent with the Safe System Approach to reduce system kinetic energy.
Finally, countermeasure selection should include trade-offs between key variables, including safety considerations for all road users, redundancy in the system, countermeasure efficacy, specific safety benefits, unanticipated outcomes, and feasibility (e.g., time and cost). In particular, users should also identify trade-offs in safety and mobility between motorists, pedestrians, and bicyclists that may arise from potential countermeasures, including unintended consequences to other road users. For example, potential countermeasures may be identified to reduce the crash frequency of certain types of multiple-vehicle crashes (e.g., rear-end or angle); but before selecting a countermeasure for further consideration in the economic appraisal and project prioritization process, the user should also consider potential trade-offs for pedestrians or bicyclists. A countermeasure expected to reduce rear-end or angle crashes at a site may also be expected to increase the exposure of pedestrians and bicyclists to motor vehicle traffic and, in turn, may increase the frequency of pedestrian and bicycle crashes. As users are identifying countermeasures for further consideration in the economic appraisal and project prioritization process and their potential applicability at an individual site or sites, users are to make informed decisions considering the trade-offs in safety and mobility between motorists, pedestrians, and bicyclists that may arise from potential countermeasures.
10.3 Rural Two-lane Segments
Figure 22 to Figure 33 present the decision trees for rural two-lane segments.


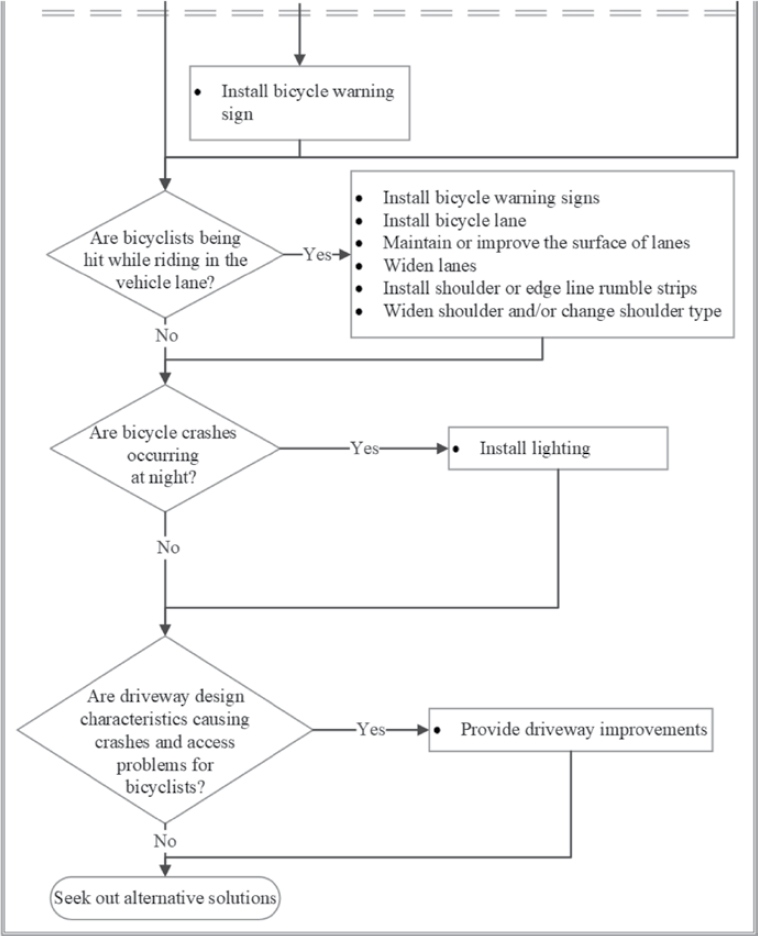
10.4 Rural Multilane Undivided Segments
Figures 34 to 44 present the decision trees for rural multilane undivided segments.


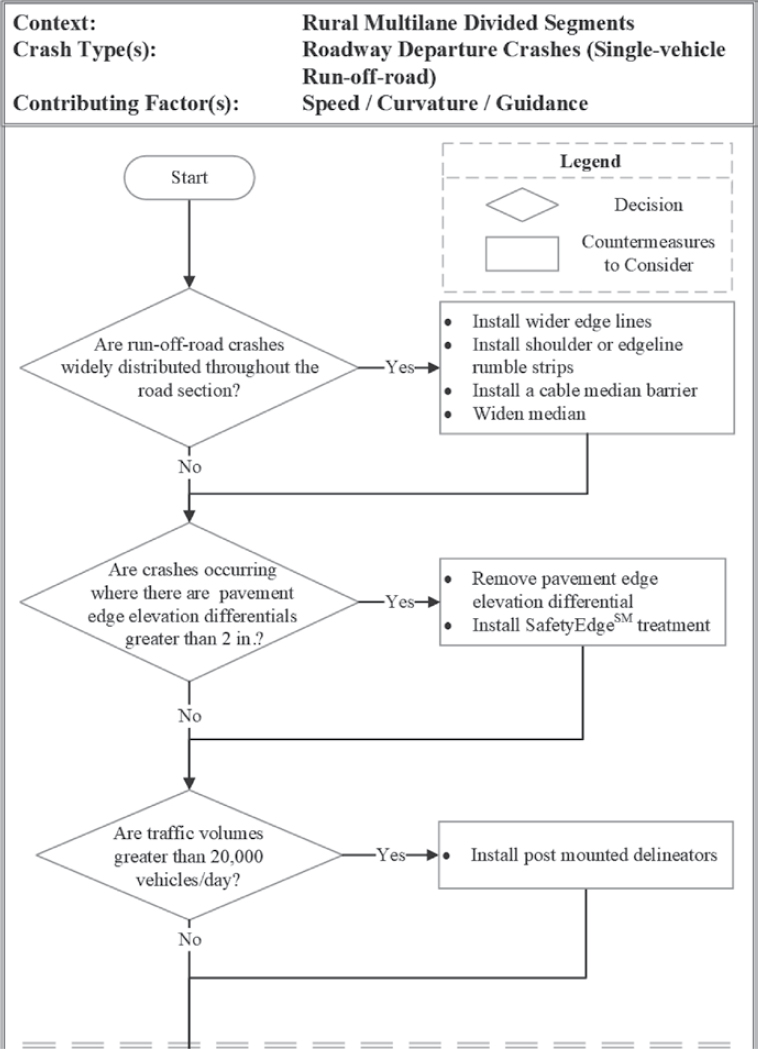
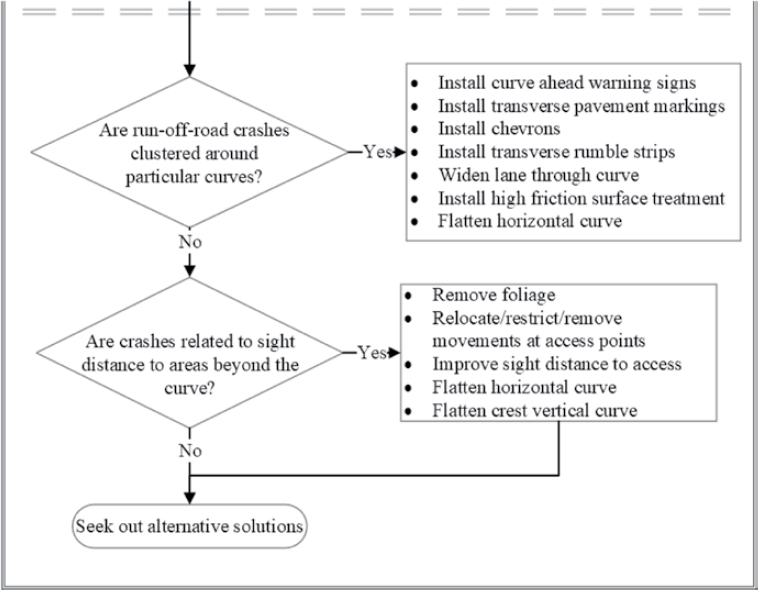
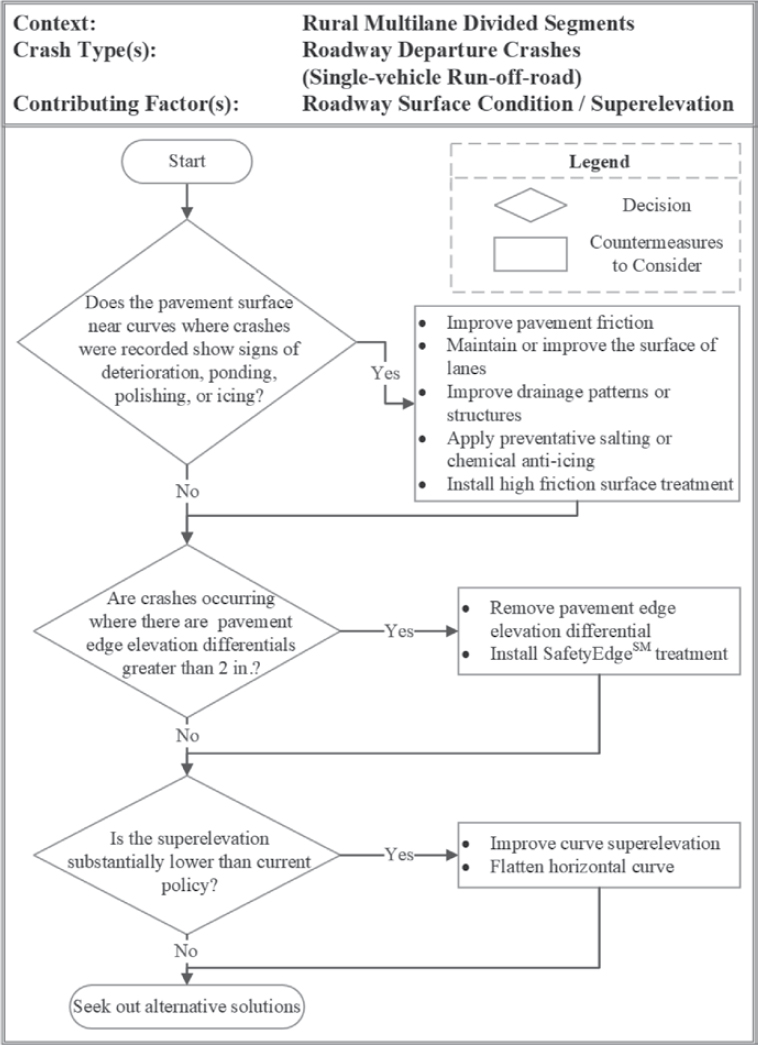
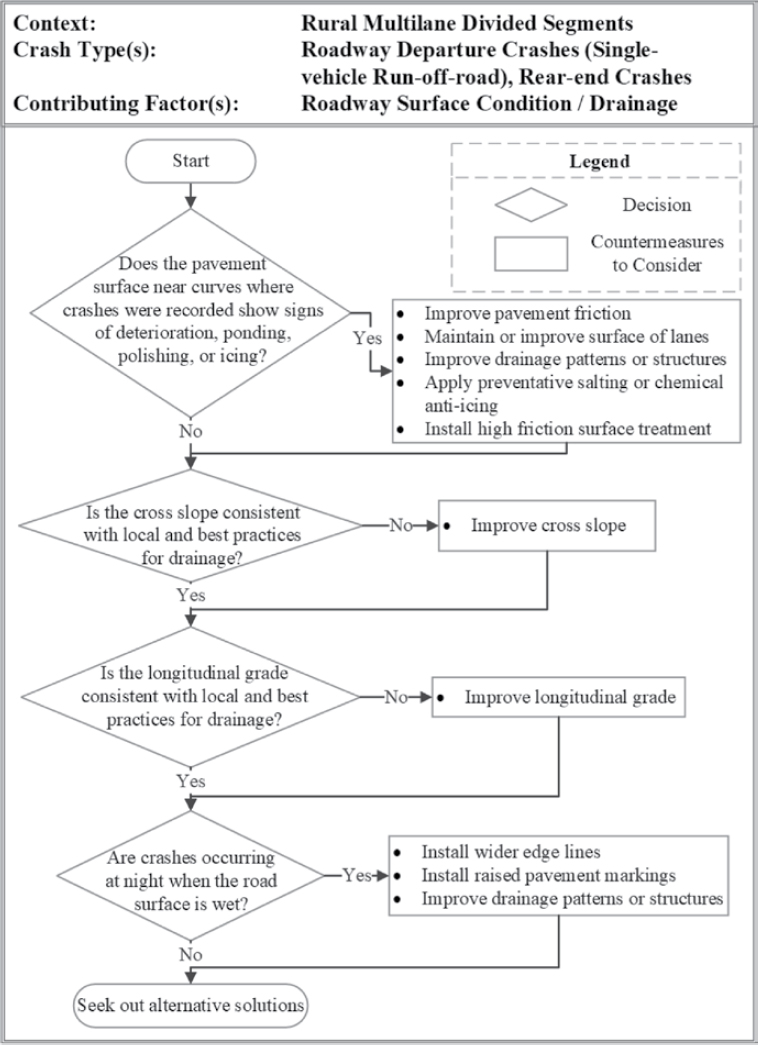
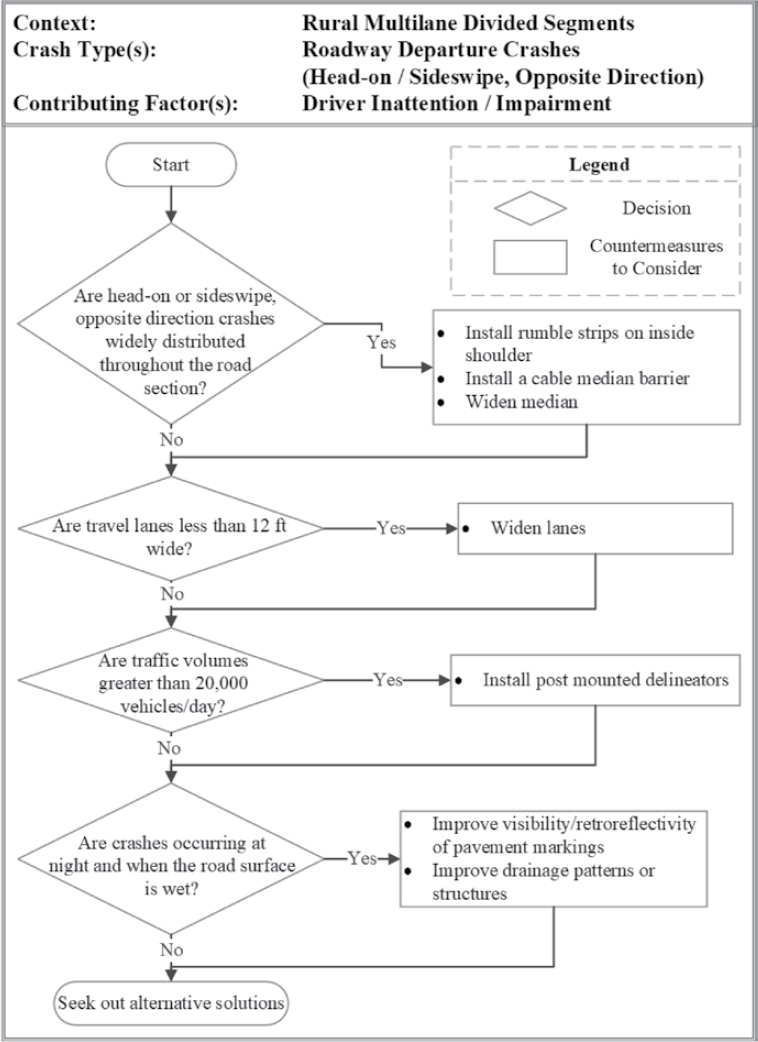
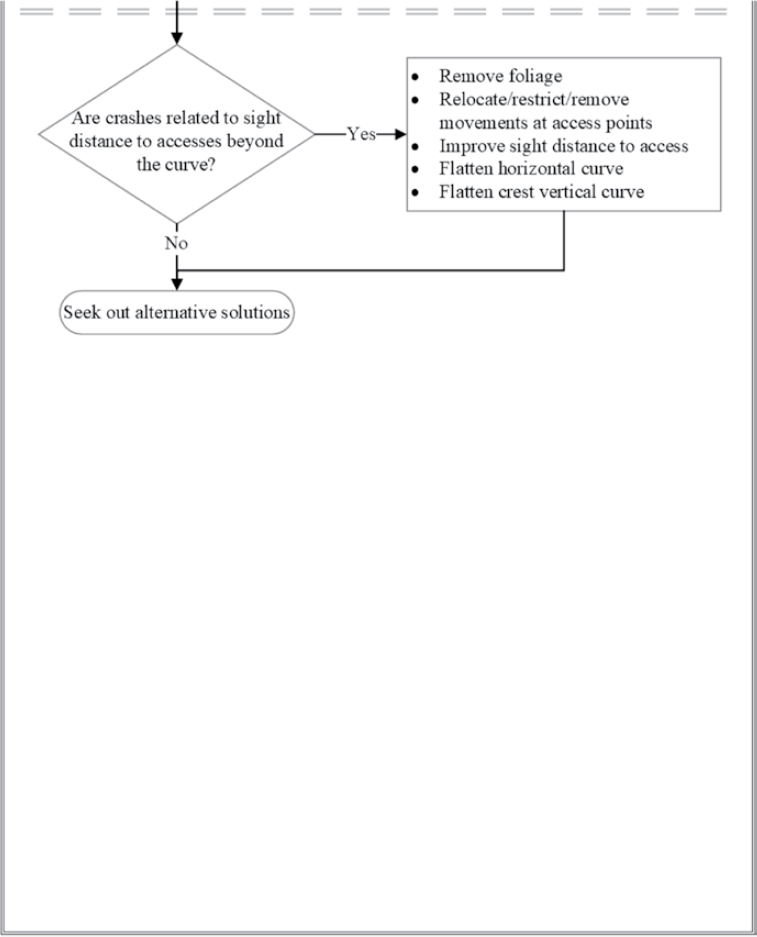
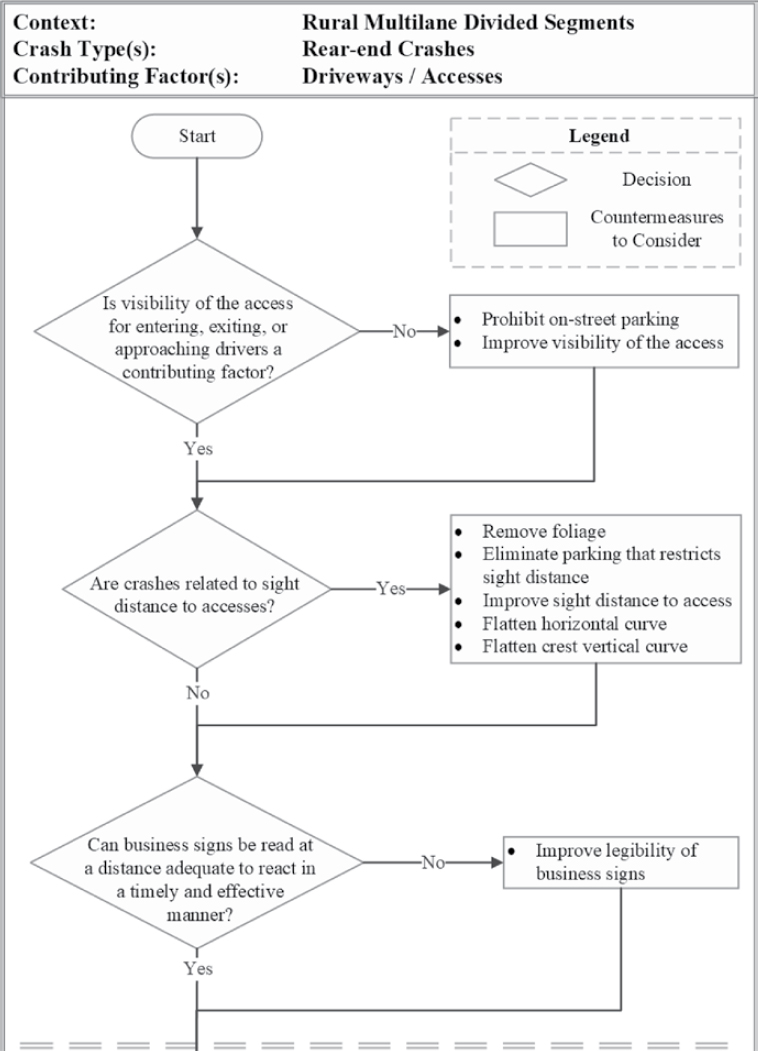
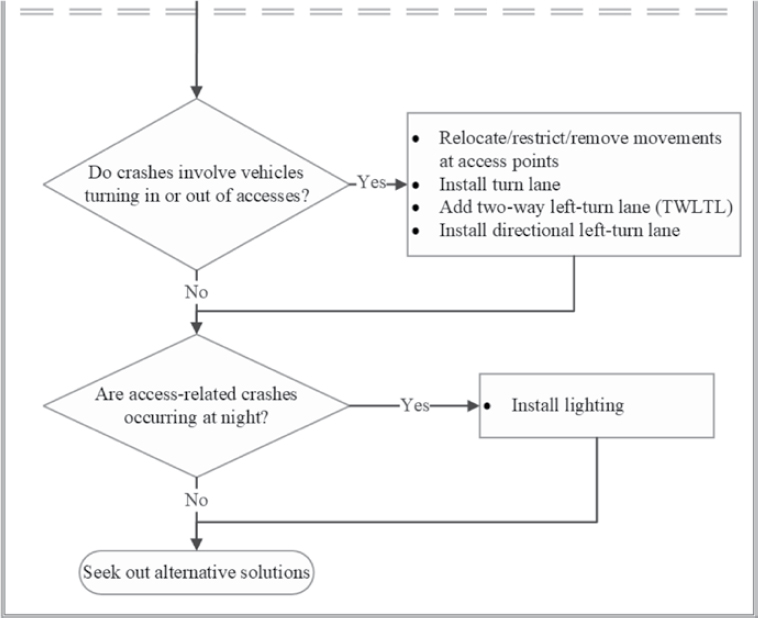
10.5 Rural Multilane Divided Segments
Figures 45 to 55 present the decision trees for rural multilane divided segments.


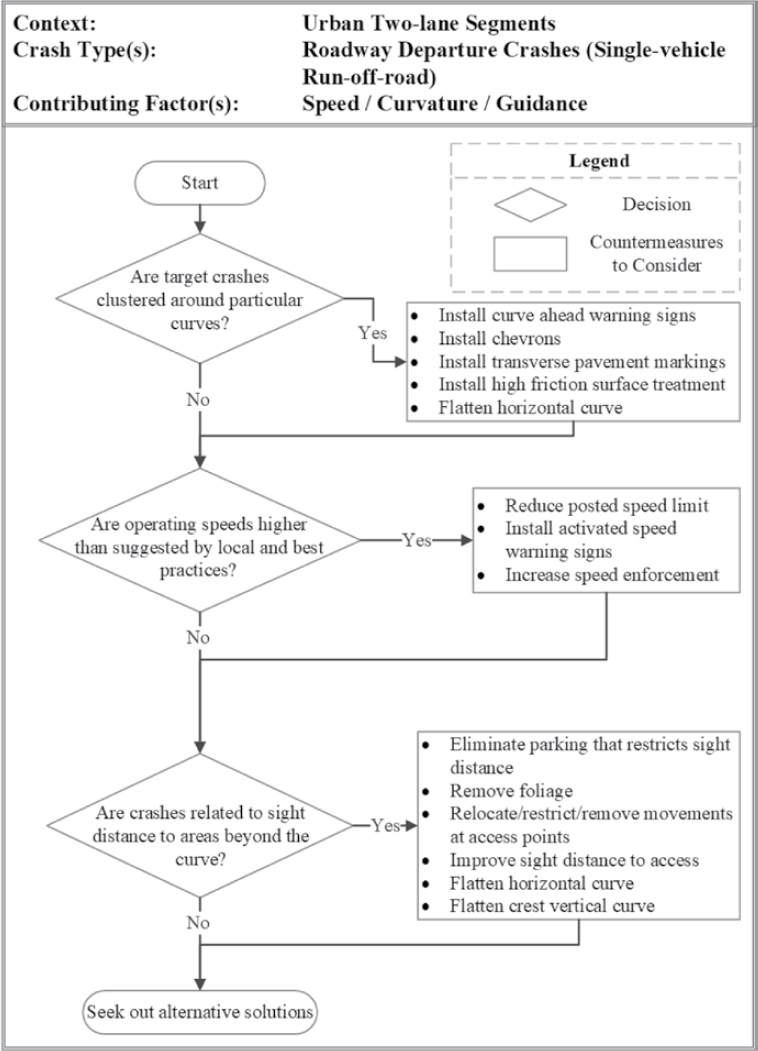
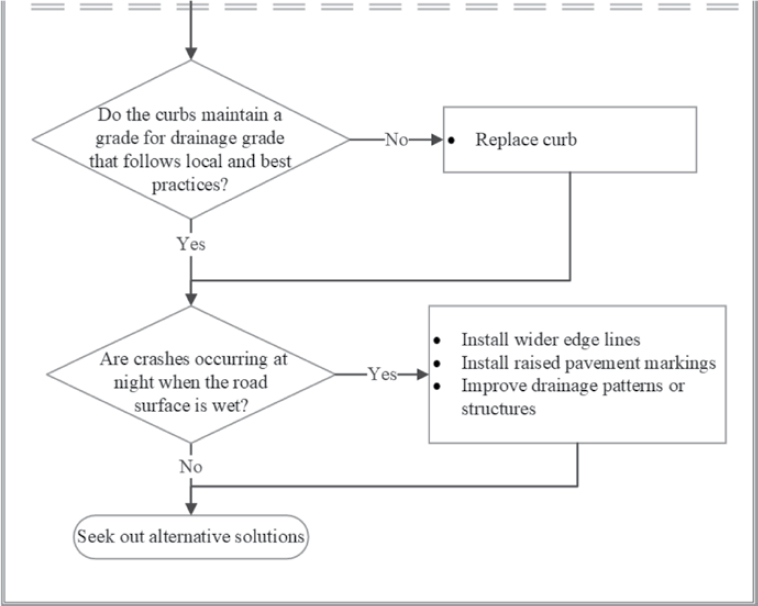
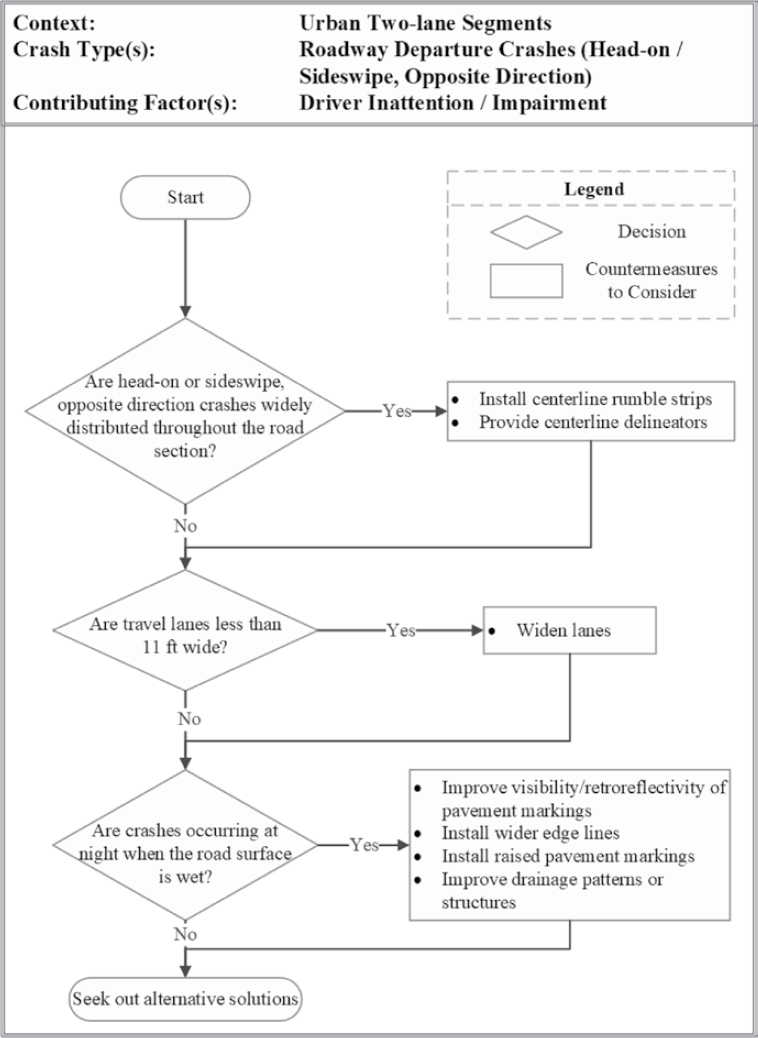
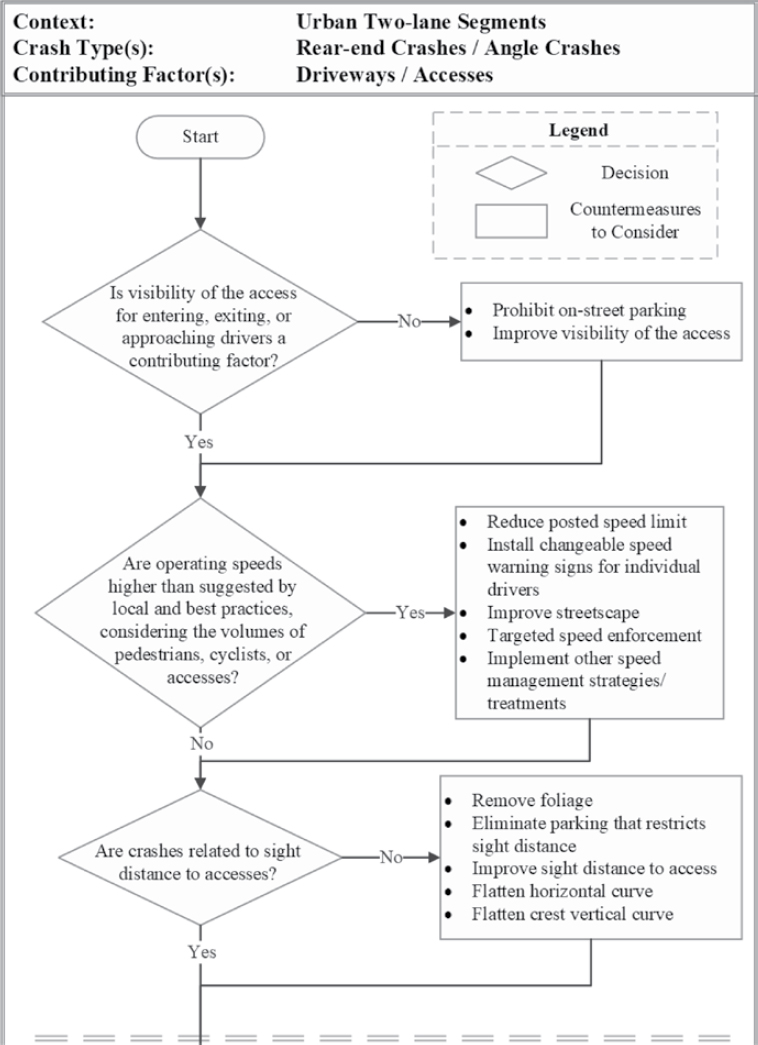
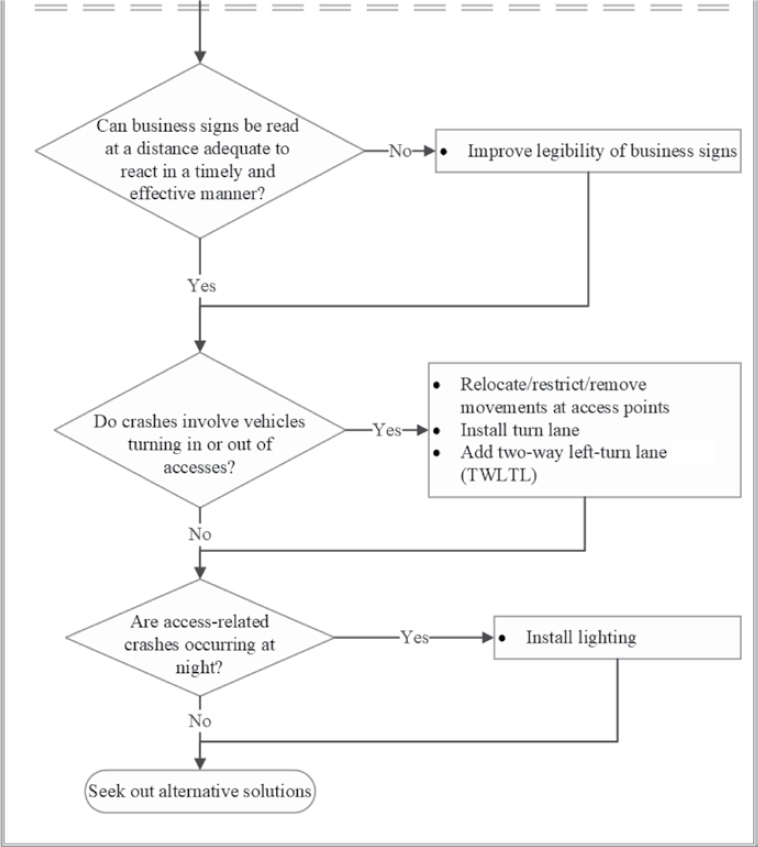
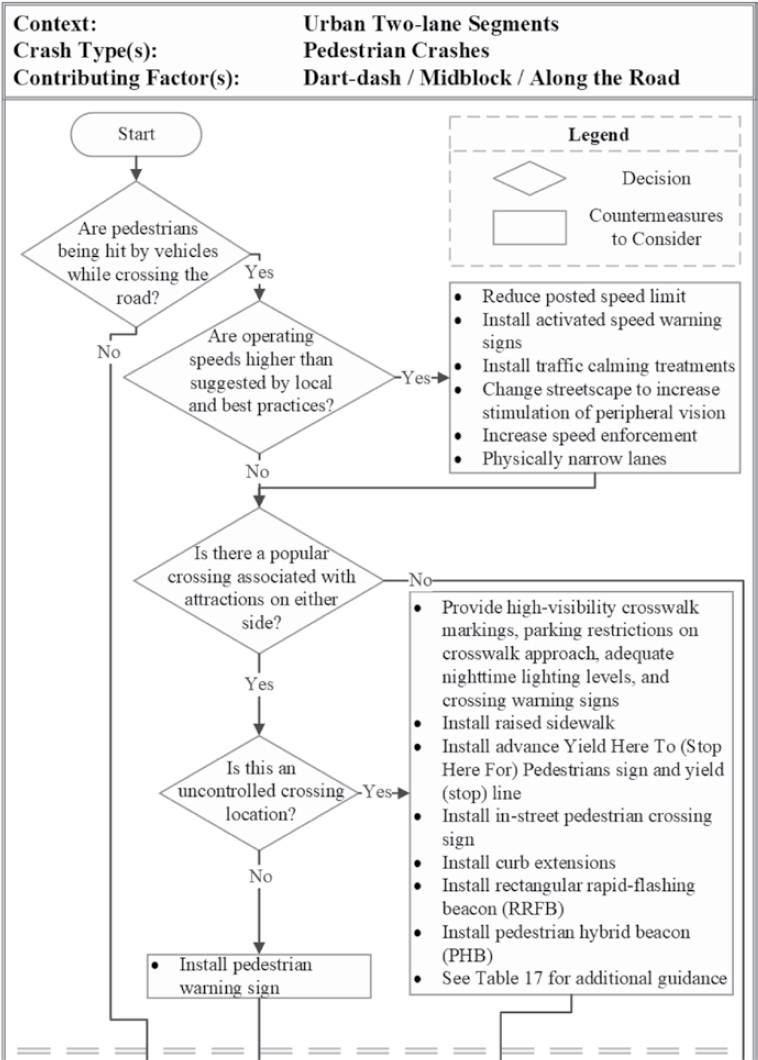
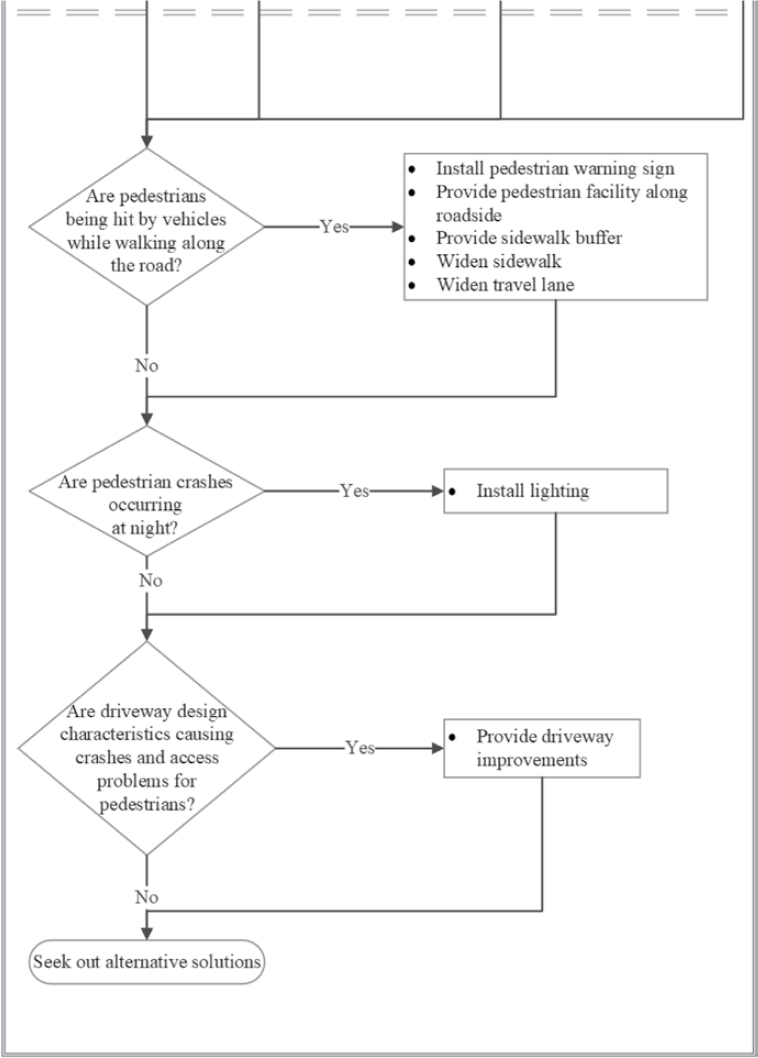
10.6 Urban Two-lane Segments
Figures 56 to 63 present the decision trees for urban two-lane segments.


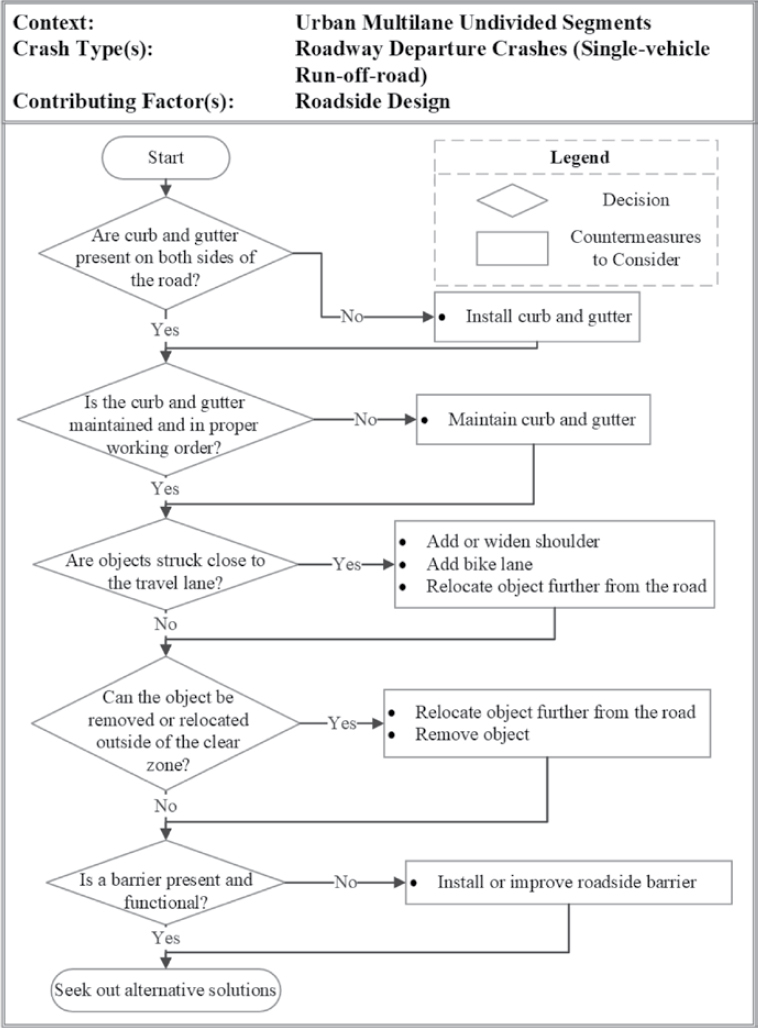
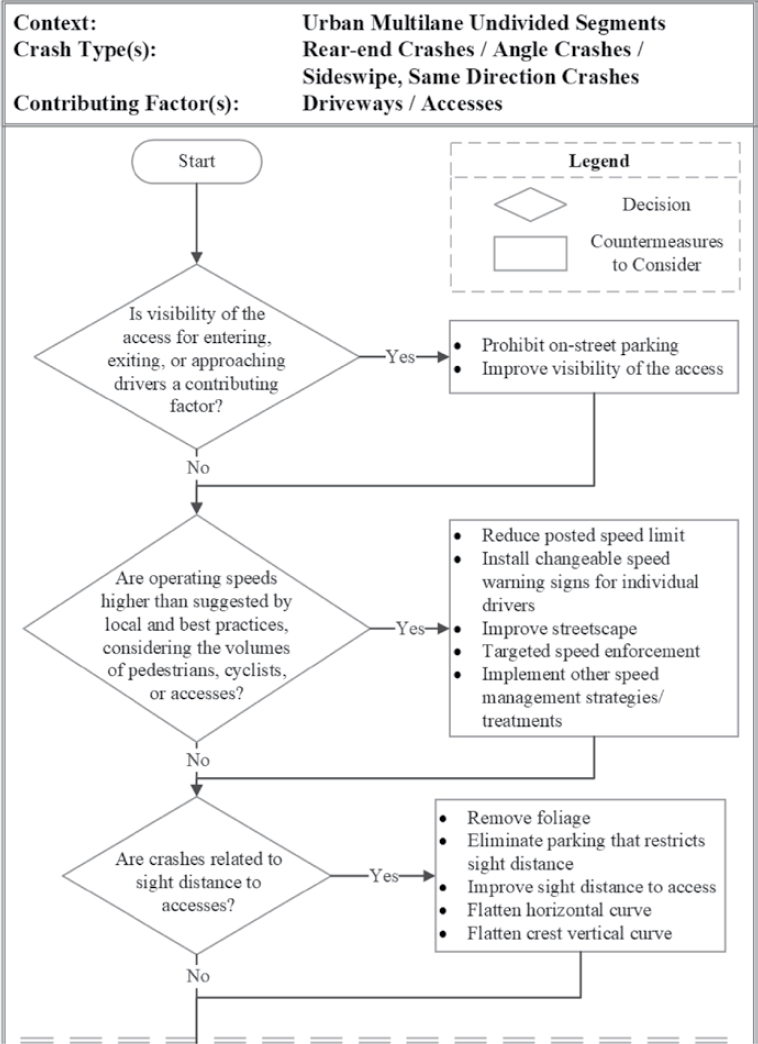
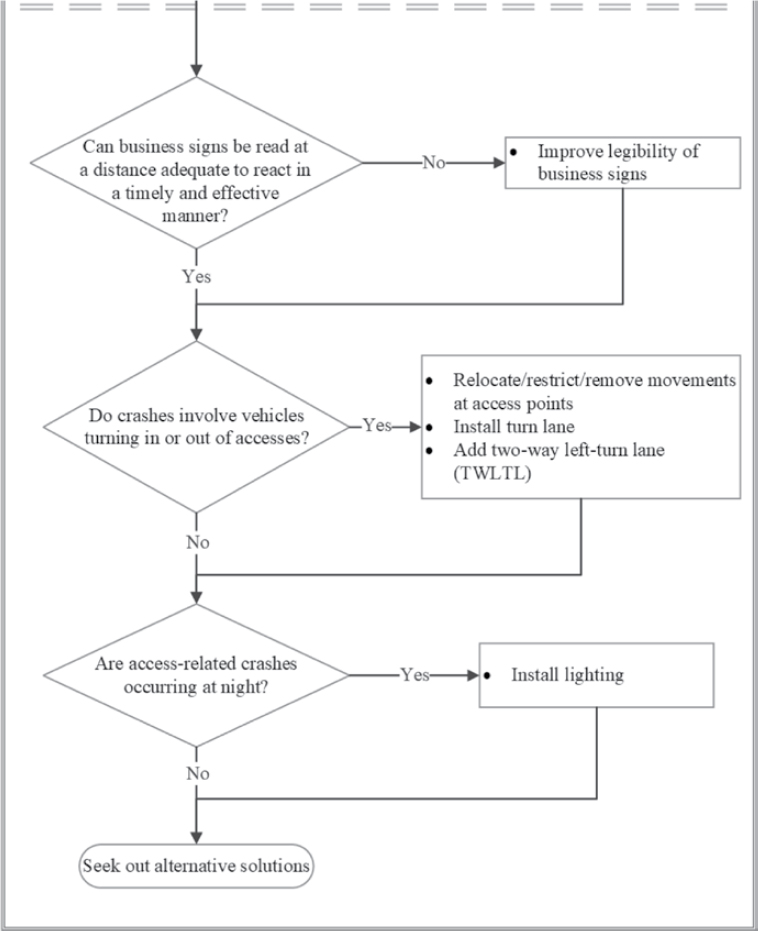
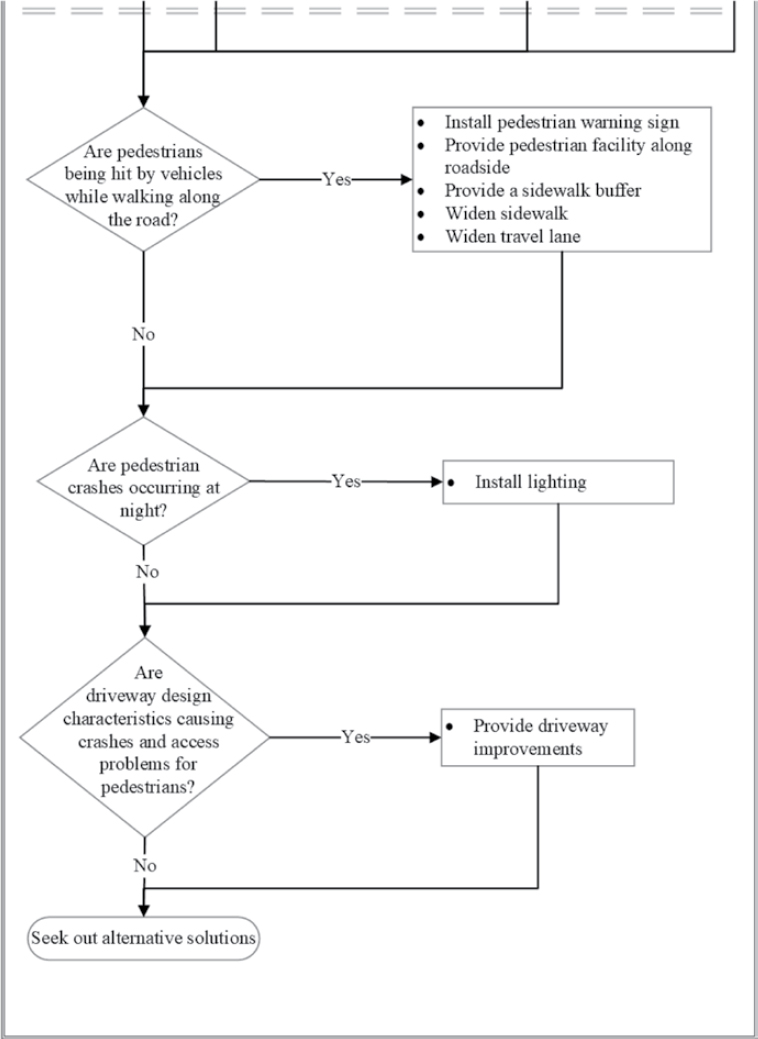
10.7 Urban Multilane Undivided Segments
Figures 64 to 72 present the decision trees for urban multilane undivided segments.


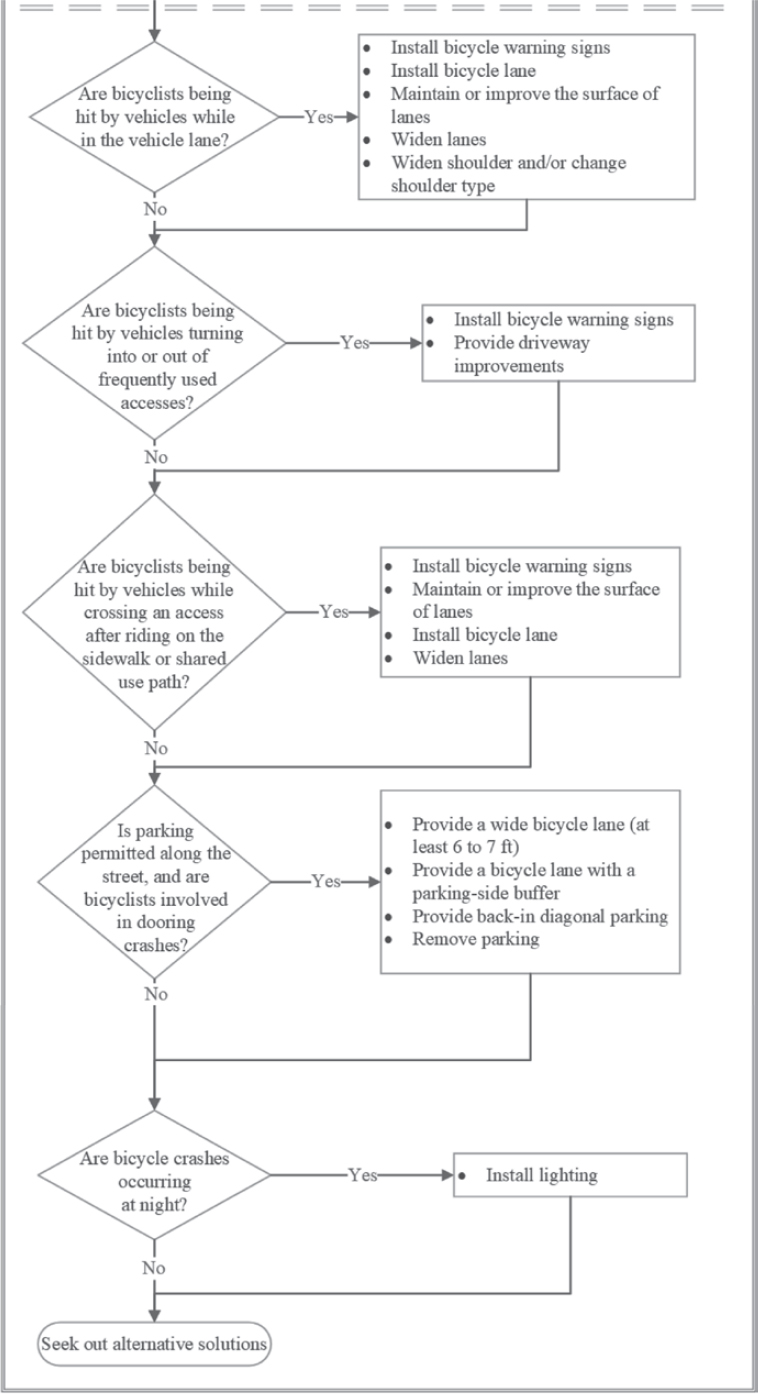
10.8 Urban Multilane Divided Segments
Figures 73 to 77 present the decision trees for urban multilane divided segments.


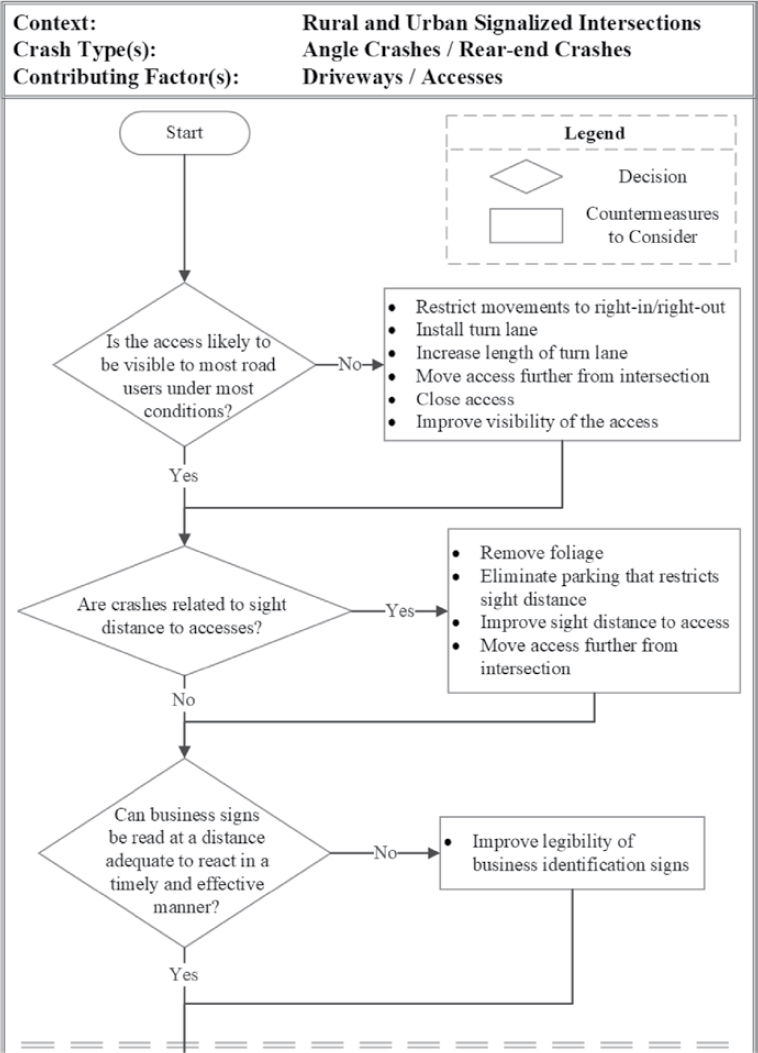
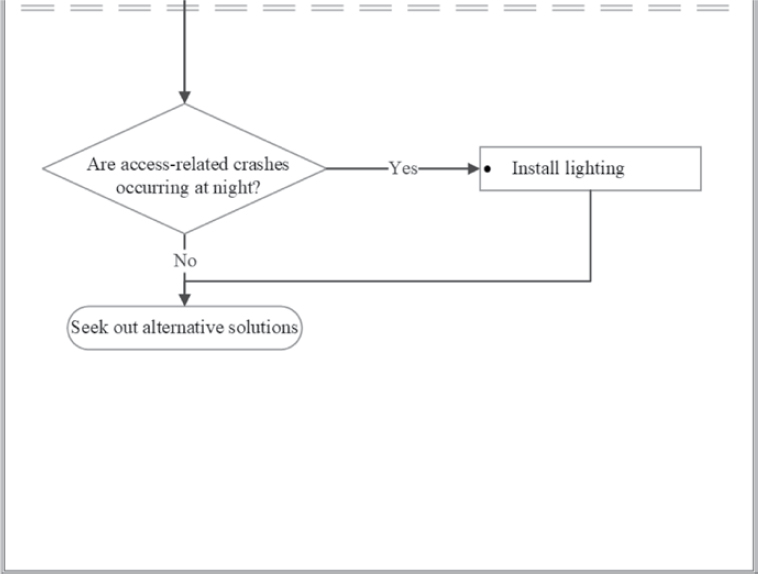
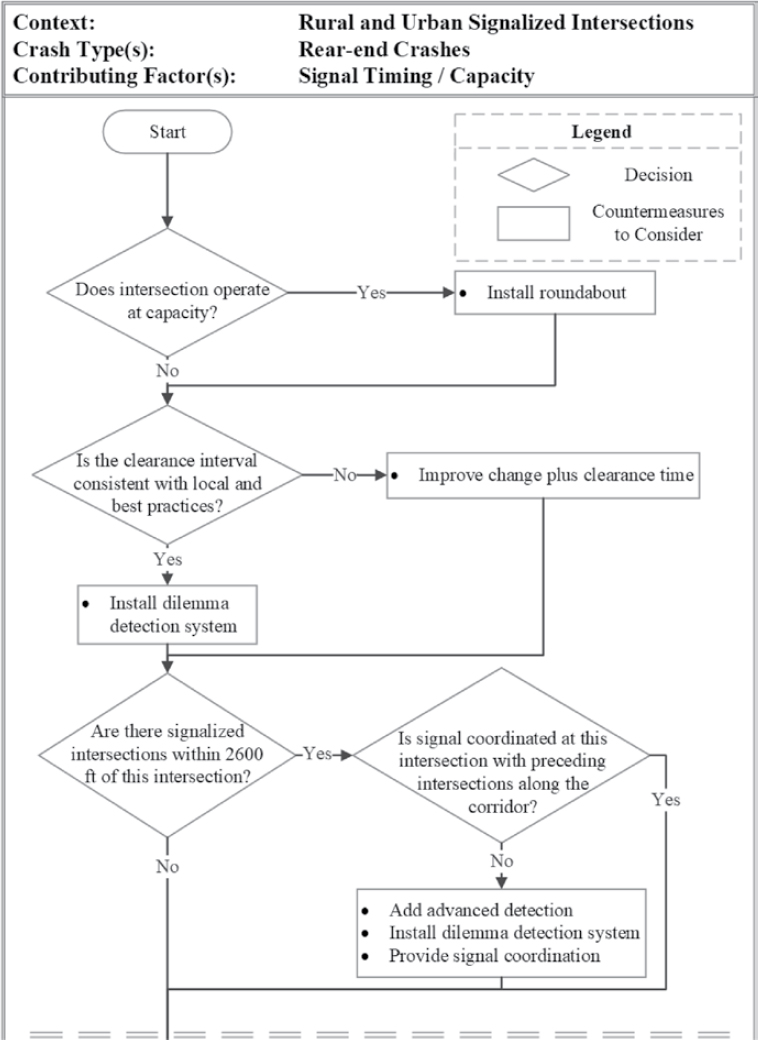
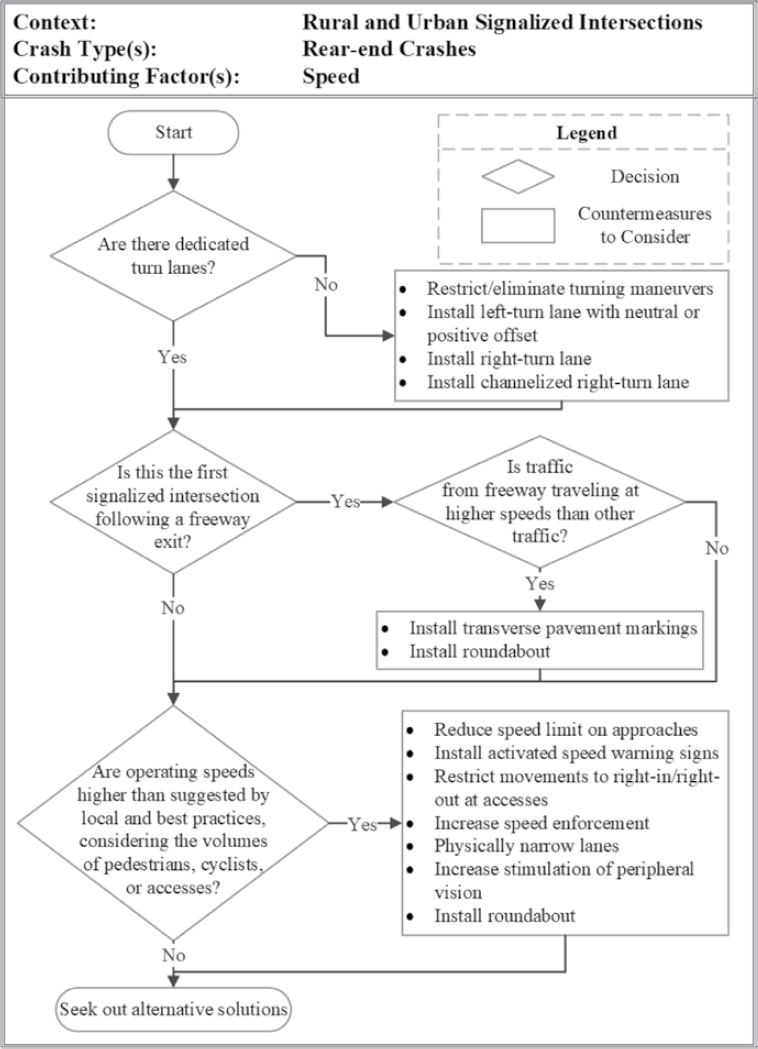
10.9 Rural and Urban Signalized Intersections
Figures 78 to 93 present the decision trees for rural and urban signalized intersections.


10.10 Rural and Urban Unsignalized Intersections
Figures 94 to 102 present the decision trees for rural and urban unsignalized intersections.