Diagnostic Assessment and Countermeasure Selection: A Toolbox for Traffic Safety Practitioners (2024)
Chapter: 9 Linking Contributing Factors to Countermeasures

CHAPTER 9
Linking Contributing Factors to Countermeasures
9.1 Objectives
The objectives of this tool are to
- Describe the importance of linking countermeasures to the underlying contributing factors of relevant crashes,
- Provide a process for identifying, prioritizing, and evaluating countermeasures that are linked to contributing factors, and
- Provide examples of key crash types, representative countermeasures for these crash types, and descriptions of how these countermeasures aid road users.
9.2 Background
Roadways are communication devices, and they are at all times communicating a host of messages to the road user. Sometimes these messages are helpful and intended by the roadway designer, and sometimes not. Countermeasures can improve how the roadway designer communicates with the road user and can decrease the crash frequency or severity at a particular site. As noted in previous chapters of this report, many crashes happen when the demands of the roadway environment exceed the capabilities of the roadway user. In this regard, it is important to recognize that roadway countermeasures operate within this demand versus capabilities framework. Specifically, effective countermeasures decrease the demands placed on the road user and/or augment the road user’s capabilities in some fashion. Accordingly, countermeasures are selected in a manner that links their features and benefits to the underlying contributing factors and human factors issues observed within the crash data or the facility itself. Chapter 4 distinguishes between human factors issues and aberrant driver behavior issues. Many countermeasures with proven effectiveness can be useful for both kinds of issues. For example, countermeasures that reduce vehicle speeds can address both deliberate speeding as well as giving non-speeding drivers more time to respond to unexpected situations and/or conditions. Similarly, countermeasures that generally improve the visibility of pedestrians may offer particular benefits to distracted drivers by increasing pedestrian conspicuity.
9.3 Key Concepts
The purpose of this discussion is not to recommend specific countermeasures, but to briefly present a process for identifying and selecting countermeasures and to show how frequently recommended countermeasures impact road users’ perception and performance. Chapter 8: Countermeasure Selection of the HSM (AASHTO, 2010), discusses countermeasure identification and selection in the context of the larger roadway safety management process and—combined with the HSM/HFG Primer (Campbell et al., 2018)—should be considered a key source for this process.
Countermeasure identification, prioritization, and selection can consider user behaviors or information needs that reflect functional considerations (i.e., position and type of service being provided by roadways) as well as context considerations (i.e., how the roadway fits into and serves the community and multimodal needs and issues).
9.3.1 Overview and General Process
Discussion regarding the countermeasure identification and selection process picks up where Chapter 3 left off, with a partially completed Modified Haddon Matrix, developed by John Milton and Ida van Schalkwyk of the Washington State Department of Transportation and used with their kind permission. As with Chapter 3, the discussion is adapted from the HSM/HFG Primer (Campbell et al., 2018) that was developed to provide the practitioner with information from both the HSM and the HFG to aid in assessing the contributing factors to crashes and in selecting countermeasures.
Figure 19 illustrates this part of the process and is primarily intended to emphasize the importance of linking countermeasure identification and selection to specific human factors issues (as well as driver behavior issues) identified during the diagnostics process.
With a populated Modified Haddon Matrix, there is a process that could be used to identify and select appropriate countermeasures. While this process focuses on the decision trees in Chapter 10 of this toolbox and the HSM and the HFG as key sources for safety countermeasures, there are many additional sources that can and should be consulted when looking for countermeasures. These include sources published by the U.S. DOT, such as behavioral countermeasures found in NHTSA’s Countermeasures that Work publications (Venkatraman et al., 2021):
- Consult Chapter 10
- Chapter 10 provides a series of decision trees to help designers and traffic engineers select countermeasures that address target crash and facility types. Practitioners can select from a series of decision trees that lead the analyst through diagnostic questions to help identify countermeasures that could potentially address crash-contributing factors associated with the crash pattern of interest.
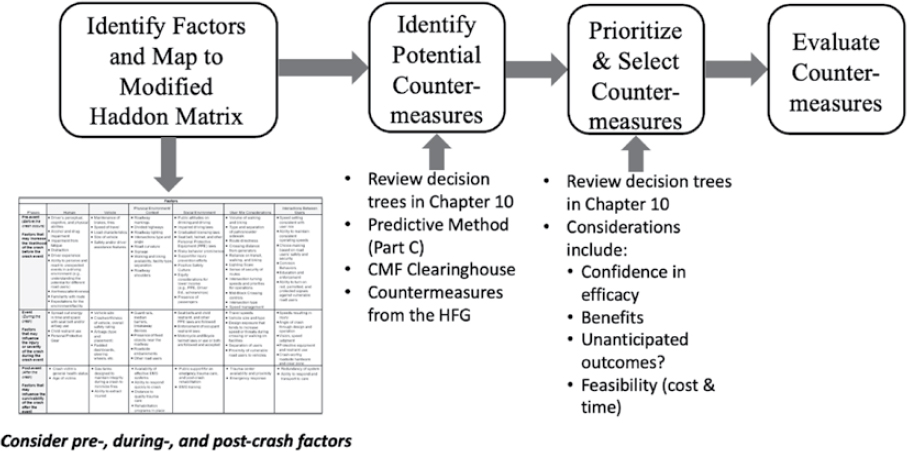
- Identify Potential Countermeasures from the Highway Safety Manual
- Using the Predictive Method (Part C of HSM; AASHTO, 2010)
- The predictive method employs safety performance functions (SPFs) to estimate the predicted crash frequencies for a network, segment, or particular site for specific base conditions. The HSM breaks the predictive method into an 18-step process, as summarized in a flowchart in HSM Figure C-2.
- The following steps highlight the key methods in comparing treatments through the predictive method:
- Predictive method Step 9–For the selected site, determine and apply the appropriate SPF for the site’s facility type and traffic control features.
- Predictive method Step 10–Apply appropriate Part C Crash Modification Factors (CMFs) to the results of the SPF to adjust the predicted average crash frequency to site-specific geometric design and traffic control features.
- Predictive method Step 11–Apply calibration factors to the results of Step 10 as appropriate for the jurisdiction and time period of the analysis.
- Predictive method Step 17–Determine if there is an alternative design, treatment, or forecast annual average daily traffic to be evaluated, and conduct alternative analysis as needed.
- Predictive method Step 18–Evaluate and compare results.
- To aid in the predictive method process, spreadsheet-based tools and additional guidance for the HSM are available for use with rural two-lane, two-way roads, rural multilane highways, suburban arterials, and urban arterials (AASHTO, 2010). These tools guide users through the application of SPFs, CMFs, and calibration factors for individual sites.
- Using the Predictive Method (Part C of HSM; AASHTO, 2010)
- Identify Potential Countermeasures from the HFG
- Create a list of HFG contents (i.e., solutions, countermeasures, and design options; Campbell et al., 2012) corresponding to design characteristics or crash reduction opportunities within the road system. From the results of the Modified Haddon Matrix, consider especially pre-crash factors that reflect interactions between the road user and the infrastructure, and identify
- Relevant road user needs, capabilities, or limitations;
- Relevant road user perception or performance issues;
- Specific HFG recommendations, countermeasures, or design options; and
- Relevant data sources or research studies that could support specific design changes or enhancements.
- This review of the HFG should yield a succinct summary of key road user issues, specific recommendations, countermeasures, or design options from the HFG, and any related information that will support a robust safety solution.
- Create a list of HFG contents (i.e., solutions, countermeasures, and design options; Campbell et al., 2012) corresponding to design characteristics or crash reduction opportunities within the road system. From the results of the Modified Haddon Matrix, consider especially pre-crash factors that reflect interactions between the road user and the infrastructure, and identify
- Prioritize and Select Countermeasures
- Develop a prioritized list of potential countermeasures to address the contributing factors identified through the diagnostic process. As noted throughout this toolbox, key resources could include Proven Safety Countermeasures (FHWA, n.d.d), the CMF Clearinghouse (FHWA, n.d.b), the HSM (AASHTO, 2010) and the HFG (Campbell et al., 2012). However, to get the most value out of these resources, the options and countermeasures provided by each document must be collated, compared, and considered as part of the prioritization process. See Chapter 10 for countermeasure options and trade-offs for a range of facilities and crash types.
- The reviews will likely yield several countermeasure options and several general issues to consider. When selecting countermeasures, it is important to understand the road, crash types, volume restraints, and other factors under which the CMF was developed. In some cases, looking through such factors alone may eliminate CMFs from the selection. In most cases, there will still be multiple CMFs that appear to satisfy the site conditions and project requirements.
- To achieve a vetted and reliable project priority list, the following characteristics are considered for each of the previously identified potential countermeasures.
- Degree of confidence—Many potential countermeasures have multiple associated crash reductions. The selection of a particular CMF or calibration factor may play an important part in determining the overall crash reduction potential of the treatment. In particular, it is important to consider the quality and applicability of individual research studies supporting CMFs. It is strongly recommended that each treatment be evaluated for a degree of confidence based on the assumptions and engineering judgment used in the analysis.
- Benefits—What are the benefits of the solution? Is the potential crash reduction ample enough to justify the project or project changes?
- Change—Will there be a change in traffic, pedestrian, or bicycle volume at the site, which could lead to additional crashes in that mode because of increased exposure (e.g., will pedestrian traffic increase because of more reliable crossing signals, or are there no expected changes at all).
- Conflicts—Does the project create any built, operational, or road user problems with the existing area (e.g., will driveways’ entries/exits become additional elements that could conflict with residents/businesses/bikes/pedestrians/less-mobile individuals using the road)?
- Feasibility—Is the potential solution cost and time appropriate and does it provide benefits for the expenditure? This does not necessarily include a full cost-benefit analysis of each potential solution.
- There is no defined process for synthesizing the results from both the HSM, the HFG, and other sources of countermeasures into a set of perfect countermeasures. Prioritizing the identified countermeasures requires comparing the potential countermeasures offered by each source to the details of the crash sites/situation at hand. Specific questions might include the following:
- What is the alignment between the engineering countermeasures(s), the crash patterns, contributing factors identified in the diagnosis, and the human factors assessment?
- Do the identified countermeasures/solutions seem reasonable given the crash data?
- Do they seem appropriate for the site and the general driving conditions?
- Will the countermeasures affect other modes of transportation negatively (transit, bicyclists, pedestrians, motorcyclists, and so forth); specifically, what are the tradeoffs for these user groups?
- How do the tools and guidance from each source (the HSM and the HFG) relate to or complement one another?
- Is there consistency across the information provided by the HSM and the HFG? Well-supported guidance from both sources can provide a strong argument for solutions.
- Is more than a single countermeasure appropriate for the situation?
- How well would multiple countermeasures address the identified factors that seem to be contributing to crashes?
- Given the overall situation, what guidance from all sources seems the most feasible from a safety, implementation, and cost perspective?
- What is the alignment between the engineering countermeasures(s), the crash patterns, contributing factors identified in the diagnosis, and the human factors assessment?
- To achieve a vetted and reliable project priority list, the following characteristics are considered for each of the previously identified potential countermeasures.
- Evaluate Countermeasures
- The purpose of a safety effectiveness evaluation is to determine the actual impacts of a project after it has been completed at a site. It might also be useful to evaluate a countermeasure at a single site before multi-site implementation and to help provide data for future decisions. Countermeasure evaluation typically includes a statistical comparison of crashes for a period before and after the project is completed. Often, the effectiveness evaluation must be conducted several years after the project is completed to allow for possible impacts to occur and for sufficient data to be obtained. Conducting an effectiveness evaluation will help guide future projects and improve project prioritization. Conducting
- evaluations (the fifth “E” of safety) to aid the selection and design of countermeasures is critical to improving safety performance.
- While an evaluation of effectiveness is strongly recommended, the process to do so is a field of its own, and practitioners should consult additional research for guidance; potential resources include the following:
- The Crash Modification Factor Clearinghouse recommendations for developing CMFs (FHWA, n.d.b)
- Observational Before-After Studies in Road Safety (Hauer, 1997)
- The FHWA Highway Safety Improvement Program Manual, which has an entire section on how to go about such studies (FHWA, 2010)
- The FHWA’s evaluation guide, Highway Safety Improvement Program (HSIP) Evaluation Guide (Gross, 2017), which includes methods, data requirements and other aids associated with different types of evaluations
Also, Pullen-Seufert and Hall (2008) provide a seven-step process for evaluating highway safety programs and countermeasures, as follows (additional discussion for each of these steps is provided in Chapter 1):
- Identify the problem.
- Develop reasonable objectives.
- Develop a plan for measuring results.
- Gather baseline data.
- Implement your program.
- Gather data and analyze results.
- Report results.
The following subsections provide countermeasure information for four types of crashes that account for a significant number of overall crashes in the United States: road departure, pedestrian, work zone, and intersection crashes. Roadway departure, intersection, and pedestrian crashes in particular are a consistent focus of the FHWA’s HSIP. For each of the crash types, the following subsections include a brief review of the crash data, a summary of known contributory factors to crashes, and a list of typical countermeasures and how these countermeasures help road users, that is, how they decrease the demands placed on the road user and/or augment the road user’s capabilities.
9.3.2 Road Departure Crashes
Motor vehicle crashes in which a vehicle departs its lane of travel, leaves the roadway, and strikes other objects or overturns account for approximately 64% of all single-vehicle crashes (Liu and Ye, 2011) and around 70% of all fatal single-vehicle crashes (Liu and Subramanian, 2009) in the United States. In-depth analyses of real-world crash and near-crash data have identified critical reasons—which describe the immediate reason for the vehicle running off the road but do not necessarily convey the cause or assignment of fault—and contributing factors to such crashes. The crashes can occur on straight, rural roads and can be influenced by a variety of driver-related factors, including overcompensation and imprecise directional control of the vehicle, falling asleep, inattention, and distraction (Pomerleau et al., 1999; McLaughlin et al., 2009).
9.3.2.1 Contributing Factors to Road Departure Crashes
Despite the range of possible contributing factors to run-off-road crashes, existing research has consistently identified inattention and/or fatigue/drowsiness as primary contributory factors for these events. For example, analysis of NHTSA’s Fatality Analysis Reporting System (FARS) data from the 1990s and early 2000s identified several vehicle, environmental, and driver-related
contributors, but driver fatigue was prominent as the most frequently involved factor (NHTSA, n.d.c). A sleepy driver was found to be more likely (more than three times the odds) to be involved in a road departure crash than an alert driver (Liu and Subramanian, 2009). More in-depth examination of run-off-road crashes has reported similar findings. In an analysis of run-off-road crashes from the NMVCCS database, Liu and Ye (2011) reported that, of all the contributing factors identified, inattention and fatigue were the most influential, increasing crash potential by odds of 3.7 and 3.5, respectively. However, these driver responses were not the only contributing factors identified; others included overcompensation (13.6% of run-off-road crashes), imprecise directional control (12%), and driving too fast for a curve (10.5%).
9.3.2.2 Typical Countermeasures and How They Aid Road Users
A variety of countermeasures have been developed to help drivers maintain their lane positions and avoid and/or mitigate exceeding the lane boundaries. Table 11 highlights some of these countermeasures and explains how they help road users by reducing the demands of the lane maintenance task and/or augmenting drivers’ capabilities.
9.3.3 Pedestrian Crashes
In 2021, there were 7,388 pedestrians killed in traffic crashes; this reflects a 12.5% increase from 6,565 pedestrian fatalities in 2020 (NCSA, 2023a). In 2021, pedestrians accounted for
Table 11. Example countermeasures for road departure crashes and how they aid road users (adapted from Campbell et al., 2012).
| Countermeasure | How the Countermeasure Helps Road Users |
|---|---|
| Rumble strips (e.g., shoulder, edge-line, or center rumble strips) | Provides both a tactile and an auditory message to the driver about an ongoing road departure condition. They address situations where (1) visibility may be low, (2) drivers may be distracted (e.g., texting), or (3) drivers may be attending to some other task (e.g., sign recognition or general roadway checks), and neglecting lane keeping. Rumble strips are effective since they do not require the driver to be alert and attentive—they can help re-divert an inattentive or sleeping driver’s attention back to the driving task and the roadway. |
| Improved speed management | Provides drivers with more time to make heading corrections and maintain lane position before a lane exceedance turns into a crash. |
| Markings (e.g., wider longitudinal pavement markings) | Improves the conspicuity/visibility of lane edges and provides drivers with a longer preview time to help them see and respond to lane markings at a greater distance. Especially useful under reduced visibility conditions (e.g., inclement weather, nighttime) or on curves. |
| Increased lane width (consider context, e.g., rural versus urban) | Allows drivers to maintain lane position with less frequent steering corrections, which correspond to lower levels of driver workload (note that this could encourage higher speeds). |
| Post-mounted delineators | Improves the conspicuity/visibility of lane edges and provides drivers with a longer preview time to help them see and respond to lane markings and changes in alignment at a greater distance. |
| Widened shoulders and/or widened “buffer” medians between opposing lanes | Provides drivers more time to correct a lane exceedance before it results in a crash. |
| TSM&O road weather management strategies (e.g., improved snow preparation) to mitigate weather events (FHWA, 2024) | Improves the conspicuity/visibility of markings and provides drivers with a longer preview time to help them see and respond to them at a greater distance. Especially useful under reduced visibility conditions (e.g., inclement weather, nighttime) or on curves. |
| Improved roadside hardware and barrier/attenuation systems (e.g., median barriers, cable barriers) | Provides an additional visual cue to delineate the traveled roadway versus the shoulder versus the roadside and can reduce the severity of road departure crashes when they occur. |
17% of United States fatalities, up from 14% in 2012 (NCSA, 2023a). In a study examining the efficacy of CMFs for uncontrolled pedestrian crossing treatments, Zegeer et al. (2017) note that there continue to be both (1) safety issues for pedestrians who attempt to cross streets, particularly on high-speed, high-volume, multi-lane roads and (2) a need to better understand the safety effects of some of the more promising treatments on pedestrian crashes.
9.3.3.1 Contributing Factors to Pedestrian Crashes
Driver behavior issues are a key contributor to pedestrian crashes; alcohol was involved in 49% of pedestrian fatalities in 2021 (for the driver and/or the pedestrian) (NCSA, 2023a), and 16% of the fatal 2020 pedestrian crashes involved a driver with a blood alcohol content (BAC) of .08 or higher. Other characteristics of fatal pedestrian crashes are more closely aligned with human factors issues: 84% occurred in urban areas, 75% occurred outside of intersections, and 77% occurred in the dark. While visibility issues seem obvious from the percentage of pedestrian fatalities occurring in the dark, the fatalities occurring in “outside intersections” locations suggest impacts of expectations—drivers are more likely to anticipate pedestrians near intersections.
9.3.3.2 Typical Countermeasures and How They Aid Road Users
Especially in recent years, several technology development efforts and safety evaluations have been conducted to help address crashes and fatalities involving pedestrians. Table 12 highlights
Table 12. Example countermeasures for pedestrian crashes and how they help road users.
| Countermeasure | How the Countermeasure Helps Road Users |
|---|---|
| Advance stop and yield lines | Provides improved visibility of pedestrians for drivers and more time to perceive and react to an unexpected pedestrian incursion by increasing the distance from pedestrians at which drivers are required to stop. |
| Curb extension/bulb-out | Provides improved visibility and sight distance for pedestrians and vehicles and reduces vehicle speeds, giving drivers more time to react to an unexpected pedestrian incursion. Also, reduces pedestrian exposure by reducing pedestrian crossing times and distances. |
| Raised median and pedestrian crossing island | Reduces vehicle speeds, providing more time for drivers to perceive and react to an unexpected pedestrian incursion. |
| Reduce corner radius/crossing distance | Provides improved visibility/sight lines for drivers and reduces turning speeds. Also, reduces pedestrian exposure by reducing pedestrian crossing times and distances. |
| Pedestrian hybrid beacon or a rectangular rapid flashing beacon | Alerts drivers to the presence of pedestrians in a crosswalk, providing drivers with advance warning and more time to react to the situation. |
| Right turn on red restrictions | Reduces pedestrian exposure to turning traffic, where line of sight may be blocked or where drivers’ attention is divided. |
| Grade-separated crossings (should only be used when the topography makes them convenient for pedestrians or when the roadway to be crossed is truly inaccessible to pedestrians) | Can eliminate pedestrian exposure to vehicle traffic. |
| Upgrading traffic signal to include leading pedestrian intervals or protected pedestrian phases | Reduces opportunities for conflicts as pedestrians cross. |
| Adaptive traffic signal control strategies to address variable demands because of special events, commercial activities or holiday volumes | Traffic signal cycles that can help pedestrians by providing more efficient and effective crossing times. |
some of these countermeasures (adapted from Brown et al., 2021) and explains how they help road users by, for example, reducing speeds (thus giving drivers more time to perceive and react to pedestrians) and/or increasing pedestrian visibility and conspicuity.
9.3.4 Bicycle Crashes
Americans are increasingly bicycling to commute, for exercise, or just for fun (NHTSA, n.d.a), and bicyclists are particularly vulnerable to crashes and injuries because they can be less noticeable because of size and a lack of protective structures relative to motor vehicles. In 2021, there were 966 bicyclists (defined as bicyclists and other cyclists on the road, including riders of two-wheel, nonmotorized vehicles, tricycles, and unicycles powered only via pedals) killed in traffic crashes, 95% of which were in single-vehicle crashes (NCSA, 2023b). In addition, there were 41,615 bicyclist injuries in 2021, a 7% increase from 38,886 injuries in 2020 (NCSA, 2023b). Furthermore, bicyclists who were killed in single-vehicle crashes were most likely to be struck by the front of passenger cars and light trucks (NCSA, 2023b).
9.3.4.1 Contributing Factors to Bicycle Crashes
Driver behavior issues are a key contributor to bicycle crashes. Failing to yield the right of way is the highest factor in fatal bike crashes, followed by bicyclists not being visible (NHTSA, n.d.a). In addition, alcohol was involved in 36% of bicyclist fatalities in 2021 (for the driver and/or the bicyclist) and 16% of the fatal 2021 bicyclist crashes involved a driver with a BAC of .08 or higher (NCSA, 2023b). Other characteristics of fatal bicyclist crashes include 85% occurring in urban areas, 29% occurring at intersections, 62% occurring outside of intersections, and 52% occurring in the dark (NCSA, 2023b).
9.3.4.2 Typical Countermeasures and How They Aid Road Users
To help alleviate bicyclist fatalities and injuries, several roadway design improvements can be implemented to benefit all road users. Table 13 highlights some countermeasures that can help minimize conflicts between bicyclists and motor vehicles and improve bicyclist visibility and conspicuity (Brown et al., 2021; National Association of City Transportation Officials [NACTO], 2013; NACTO, 2014; Sando, 2014; Torbic et al., 2014).
9.3.5 Work Zone Crashes
Work zones can impose unique attentional and response demands on road users, including changes in speed limits, awareness of workers in the travel lanes, changing lanes in response
Table 13. Example countermeasures for bicycle crashes and how they help road users.
| Countermeasure | How the Countermeasure Helps Road Users |
|---|---|
| Conventional bicycle lanes | Help support driver expectations for potential bicyclists and where they may be located, and provides improved visibility of bicyclists. |
| Buffered/separated bicycle lanes | Help support driver expectations for potential bicyclists and where they may be located. |
| Lane markings/shared lane markings | Help support driver expectations for potential bicyclists and where they may be located, and provides improved visibility of bicyclists. |
| Two-stage turn queue boxes at intersections | Help support driver expectations for potential bicyclists and where they may be located, provides improved visibility and sight distance of bicyclists, and helps reduce opportunities for conflicts as bicyclists cross the intersection. |
| Leading bicycle intervals at intersections | Place bicyclists ahead of other vehicles, making them the only travelers in the intersection during the interval. Helps reduce opportunities for conflicts as bicyclists cross the intersection. Provides greater visibility for bicyclists and provides more time for drivers to perceive and react to unexpected bicycle movements. |
to lane closures, and making detours around work zone activities. These unique demands have been well-recognized and studied for decades. For example, drivers are generally aware of the conditions associated with work zones and that the presence of traffic control devices (e.g., work-zone-related signs and barrels) provide cues that can help drivers (Kane et al., 1999). The presence of traffic control devices can change driver compliance and responses. A field study measured driver speed selection on highway on-ramps with and without construction-related road signage and found that drivers exhibited reduced speeds when driving in areas with construction-related signage compared to areas without such signage (Tsyganov et al., 2002).
9.3.5.1 Contributing Factors to Work-Zone Crashes
Despite the availability and application of traffic control devices provided by the MUTCD and other sources, many crashes still occur in work zones, and work zone safety is an ongoing issue for researchers, safety practitioners, and policymakers (ARTBA, 2024). While the most frequent crash types in work zones are rear-ended crashes (Garber and Zhao, 2002), fixed-object crashes also occur frequently (Campbell et al., 2012). An analysis of crashes in Kansas highway construction zones showed that fatal work zone crashes in the study region were primarily caused by inattention (53% of fatal crashes), speeding (25%), and disregarding traffic control (21%) (Li and Bai, 2008).
9.3.5.2 Typical Countermeasures and How They Aid Road Users
Since rear-end collisions are the predominant type of work zone crash, engineers and other practitioners have focused on providing warnings in advance of work zones to support driver expectations for reduced speeds and increased vigilance, as well as measures for improving speed control and setting appropriate work zone speed limits. The general purpose of work zone design elements is to provide warning, delineation, and channelization information to help road users in advance of and through a work zone. Table 14 highlights some of these countermeasures and explains how they help road users by, for example, providing advance information to enhance expectations and reduce speeds (thus giving drivers more time to perceive and react to conditions).
Table 14. Example countermeasures for work zone crashes and how they help road users (adapted from: Antonucci et al., 2005; Campbell et al., 2012).
| Countermeasure | How the Countermeasure Helps Road Users |
|---|---|
| Portable changeable message signs | Provide advance warning of an upcoming work zone and/or revisions to normal speeds or vehicle routes; help support driver expectations for upcoming deviations from normal driving conditions |
| Arrow boards | Provide additional warning and directional information to inform drivers of upcoming lane closures; help support driver expectations for upcoming deviations from normal driving conditions |
| Speed warning systems | Communicate speeds downstream on variable message signs to inform drivers that they may soon need to slow down or stop; enhance expectations about speed changes and give drivers more time to react to conditions downstream |
| Changes to lane widths and number of available lanes | Support lower speeds (mean vehicle speed reductions are correlated with the number of open lanes and lane widths) |
| 511 services | Support expectations and trip planning activities by providing information about closures, delays, and suggested detour routes |
| Variable speed limit systems | Adjust work zone speeds based on time-of-day, weather, traffic volumes or other variables—can match speeds to conditions in work zones and improve available response times for all road users |
9.3.6 Intersection Crashes
Motor vehicle crashes at intersections are common since vehicle paths naturally conflict at intersections as roads cross one another or as individual vehicles turn left or right against or into oncoming vehicles. Bikes and pedestrians also use intersections and are especially vulnerable at locations where their paths intersect with one another and with larger, faster-moving vehicles. According to 2008 data obtained through the FARS and the National Automotive Sampling System-General Estimates System (NASS-GES), approximately 40% of the estimated 5,811,000 crashes that occurred in the United States occurred at intersections or were intersection-related crashes (NHTSA, 2008b).
9.3.6.1 Contributory Factors to Intersection Crashes
The NHTSA examined the contributing factors associated with intersection-related crashes as part of the NMVCCS. NMVCCS data were collected from January 2005 to December 2007 and include on-scene information on the conditions and associated factors leading up to a crash (Choi, 2010). Thirty-six percent (787,236) of the total (2,188,969) NMVCCS crashes were intersection-related, and about 96% of the intersection-related crashes had critical reasons attributed to drivers (Choi, 2010). Of those crashes where the critical reason was attributed to the driver, 55% were associated with recognition errors such as inadequate surveillance, internal distractions, or inattention; 29% were attributed to decision errors such as false assumption of other’s actions or misjudgment of gap or other’s speed (Choi, 2010).
9.3.6.2 Typical Countermeasures and How They Help
For both signalized and unsignalized intersections, the predominant crash types are angle, rear-end, pedestrian, and bicyclist crashes. Accordingly, practitioners have focused on countermeasures that improve visibility, provide road users with more time to make decisions and react, and support complex crossing movements that can intersect with other road users’ movements. Table 15 highlights some of these countermeasures and explains how they help road users.
Table 15. Example countermeasures for intersection crashes and how they help road users (adapted from: Antonucci et al., 2005; Campbell et al., 2012).
| Countermeasure | How the Countermeasure Helps Road Users |
|---|---|
| Adding a “Signal Ahead” warning sign | Provides advance warning of an upcoming sign, especially in situations where sight distance to a signal head may not be adequate for unfamiliar drivers who do not expect the traffic signal to stop comfortably on a red light |
| Adding traffic signal backplates or increasing signal head size | Improves conspicuity and visibility of the traffic signals |
| Adding a protected left-turn phase to the traffic signal | Reduces surveillance requirements and workload on turning drivers by reducing the need to assess gaps (i.e., to assess speed and distance of oncoming vehicles) when turning |
| Eliminating parking ahead of an intersection | Improves driver sight distance and visibility of pedestrians and bicyclists as drivers approach an unsignalized intersection |
| Installing turn lanes, increasing the length of an existing left-turn lane, or restricting movements to right-in/right-out at unsignalized intersections | Where crashes seem to be associated with driveways or other access points, these can reduce rear-end crashes associated with unexpected left turns and provide drivers with more time to prepare for the turn. Movement restrictions reduce workload and associated surveillance requirements for turning drivers and for adjacent vehicles |
| Adding safe turning lanes in the form of roundabouts | Can reduce conflict points and workload at an intersection and reduce or mitigate crashes |
Key Concepts
- Effective countermeasures decrease the demands placed on the road user and/or augment the road user’s capabilities in some fashion.
- Countermeasures should be selected in a manner that links their features and benefits to the underlying contributing crash factors and human factors issues/aberrant driver behavior issues observed within the crash data or the facility itself.
- Final countermeasure selection should include tradeoffs between key variables, including countermeasure efficacy, specific safety benefits, unanticipated outcomes, and feasibility (e.g., time and cost).


