Reliability and Quality of Service Evaluation Methods for Rural Highways: A Guide (2024)
Chapter: 7 Two-Lane Highway Segment Analysis Methodology

CHAPTER 7
Two-Lane Highway Segment Analysis Methodology
The core two-lane highway analysis methodology is contained in HCM7 Chapter 15, Two-Lane Highways. The motorized vehicle analysis methodology process is given in HCM7 Exhibit 15-9 (p. 15-16). The specific equation and exhibit numbers used in the methodology, in the general order in which they are applied, are as follows.
7.1 Equations and Exhibits
The variable definitions for these equations are shown in Section 7.2 Nomenclature.
Step 1: Identify Facility Study Boundaries and Corresponding Segmentation
- Exhibit 15-10: Minimum and maximum segment lengths for use in computing segment speeds and percent followers.
Vertical Class Passing Constrained: Minimum - Maximum (mi) Passing Zone: Minimum - Maximum (mi) Passing Lane: Minimum - Maximum (mi) 1 0.25 - 3.0 0.25 - 2.0 0.5 - 3.0 2 0.25 - 3.0 0.25 - 2.0 0.5 - 3.0 3 0.25 - 1.1 0.25 - 1.1 0.5 - 1.1 4 0.5 - 3.0 0.5 - 2.0 0.5 - 3.0 5 0.5 - 3.0 0.5 - 2.0 0.5 - 3.0
Step 2: Determine Demand Flow Rates, Capacity, and d/c Ratio
- Equation 15-1: Analysis flow rate estimation; uses results from Equation 4-2.
(HCM7 Eq. 15-1) - Equation 4-2: Peak hour factor (PHF); in HCM7 Chapter 4, Traffic Operations and Capacity Concepts.
(HCM7 Eq. 4-2)
Step 3: Determine Vertical Alignment Classification
- Exhibit 15-11: Classifications for vertical alignment.
Segment Length (mi) Segment Grade (%) ≤ 1 >1 ≤ 2 >2 ≤ 3 >3 ≤ 4 >4 ≤ 5 >5 ≤ 6 >6 ≤ 7 >7 ≤ 8 >8 ≤ 9 >9 ≤ 0.1 1 (1) 1 (1) 1 (1) 1 (1) 1 (1) 1 (1) 1 (1) 2 (1) 2 (2) 2 (2) >0.1 ≤ 0.2 1 (1) 1 (1) 1 (1) 1 (1) 2 (1) 2 (2) 2 (2) 3 (2) 3 (3) 3 (3) >0.2 ≤ 0.3 1 (1) 1 (1) 1 (1) 2 (1) 2 (2) 3 (2) 3 (3) 4 (3) 4 (4) 5 (5) >0.3 ≤ 0.4 1 (1) 1 (1) 2 (1) 2 (2) 3 (2) 3 (3) 4 (4) 5 (4) 5 (5) 5 (5) >0.4 ≤ 0.5 1 (1) 1 (1) 2 (1) 2 (2) 3 (3) 4 (3) 5 (4) 5 (5) 5 (5) 5 (5) >0.5 ≤ 0.6 1 (1) 1 (1) 2 (1) 3 (2) 3 (3) 4 (4) 5 (5) 5 (5) 5 (5) 5 (5) >0.6 ≤ 0.7 1 (1) 1 (1) 2 (1) 3 (2) 4 (3) 4 (4) 5 (5) 5 (5) 5 (5) 5 (5) >0.7 ≤ 0.8 1 (1) 1 (1) 2 (1) 3 (3) 4 (4) 5 (4) 5 (5) 5 (5) 5 (5) 5 (5) >0.8 ≤ 0.9 1 (1) 1 (1) 2 (1) 3 (3) 4 (4) 5 (5) 5 (5) 5 (5) 5 (5) 5 (5) >0.9 ≤ 1.0 1 (1) 1 (1) 2 (2) 3 (3) 4 (4) 5 (5) 5 (5) 5 (5) 5 (5) 5 (5) >1.0 ≤ 1.1 1 (1) 1 (1) 2 (2) 3 (3) 4 (4) 5 (5) 5 (5) 5 (5) 5 (5) 5 (5) >1.1 1 (1) 1 (1) 2 (2) 4 (4) 4 (4) 5 (5) 5 (5) 5 (5) 5 (5) 5 (5)
Step 4: Determine the FFS
- Equation 15-3: FFS estimation; uses results from Equations 15-2, 15-4, 15-5, and 15-6 and Exhibit 15-12.
FFS = BFFS − a(HV%) − fls − fA (HCM7 Eq. 15-3)
- Equation 15-2: BFFS estimation.
BFFS = 1.14 × Sp (HCM7 Eq. 15-2)
- Equation 15-4: Coefficient estimation for heavy vehicle percentage (HV%) parameter in Equation 15-3.
(HCM7 Eq. 15-4)
- Exhibit 15-12: Coefficient values for Equation 15-4.
Vertical Class a0 a1 a2 a3 a4 a5 1 0.00000 0.00000 0.00000 0.00000 0.00000 0.00000 2 −0.45036 0.00814 0.01543 0.01358 0.00000 0.00000 3 −0.29591 0.00743 0.00000 0.01246 0.00000 0.00000 4 −0.40902 0.00975 0.00767 −0.18363 0.00423 0.00000 5 −0.38360 0.01074 0.01945 −0.69848 0.01069 0.12700
- Equation 15-5: Adjustment for lane and shoulder width.
fLS = 0.6 × (12 − LW) + 0.7 × (6 − SW) (HCM7 Eq. 15-5)
- Equation 15-6: Adjustment for access points.
(HCM7 Eq. 15-6)
Step 5: Estimate the Average Speed
- Equation 15-7: Average speed estimation; uses results from Equations 15-8 to 15-16 and Exhibits 15-13 to 15-22.
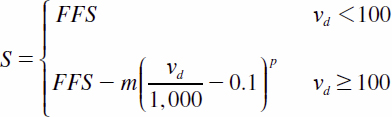 (HCM7 Eq. 15-7)
 - Equation 15-8: Slope coefficient (m) for Equation 15-7.
(HCM7 Eq. 15-8) - Exhibit 15-13: Coefficient values for Equation 15-8 for passing zone and passing constrained segments.
Vertical Class b0 b1 b2 b3 b4 b5 1 0.0558 0.0542 0.3278 0.1029 0 0 2 5.728 -0.0809 0.7404 Equation 15-9 Equation 15-10 3.1155 3 9.3079 -0.1706 1.1292 Equation 15-9 Equation 15-10 3.1155 4 9.0115 -0.1994 1.8252 Equation 15-9 Equation 15-10 3.2685 5 23.9144 -0.6925 1.9473 Equation 15-9 Equation 15-10 3.5115
- Exhibit 15-14: Coefficient values for Equation 15-8 for passing lane segments.
Vertical Class b0 b1 b2 b3 b4 b5 1 -1.1379 0.0941 0 Equation 15-9 Equation 15-10 0 2 -2.0688 0.1053 0 Equation 15-9 Equation 15-10 0 3 -0.5074 0.0935 0 0 Equation 15-10 0 4 8.0354 -0.0860 0 Equation 15-9 Equation 15-10 4.19 5 7.2991 -0.3535 0 Equation 15-9 Equation 15-10 4.87 - Equation 15-9: Segment length coefficient (b3) for Equation 15-8.
(HCM7 Eq. 15-9) - Exhibit 15-15: Coefficient values for Equation 15-9 for passing zone and passing constrained segments.
Vertical Class c0 c1 c2 c3 1 0.1029 0 0 0 2 -13.8036 0 0.2446 0 3 -11.9703 0 0.2542 0 4 -12.5113 0 0.2656 0 5 -14.8961 0 0.437 0 - Exhibit 15-16: Coefficient values for Equation 15-9 for passing lane segments.
Vertical Class c0 c1 c2 c3 1 0 0.2667 0 0 2 0 0.4479 0 0 3 0 0 0 0 4 -27.1244 11.5196 0.4681 -0.1873 5 -45.3391 17.3749 1.0587 -0.3729 - Equation 15-10: Heavy vehicle percentage coefficient (b4) for Equation 15-8.
(HCM7 Eq. 15-10) - Exhibit 15-17: Coefficient values for Equation 15-10 for passing zone and passing constrained segments.
Vertical Class d0 d1 d2 d3 1 0 0 0 0 2 -1.7765 0 0.0392 0 3 -3.5550 0 0.0826 0 4 -5.7775 0 0.1373 0 5 -18.2910 2.3875 0.4494 -0.0520
- Exhibit 15-18: Coefficient values for Equation 15-10 for passing lane segments.
Vertical Class d0 d1 d2 d3 1 0 0.1252 0 0 2 0 0.1631 0 0 3 0 -0.2201 0 0.0072 4 0 -0.7506 0 0.0193 5 3.8457 -0.9112 0 0.017 - Equation 15-11: Power coefficient (p) for Equation 15-7.
(HCM7 Eq. 15-11) - Exhibit 15-19: Coefficient values for Equation 15-11 for passing zone and passing constrained segments.
Vertical Class f0 f1 f2 f3 f4 f5 f6 f7 f8 1 0.67576 0 0 0.1206 -0.35919 0 0 0 0 2 0.34524 0.00591 0.02031 0.14911 -0.43784 -0.00296 0.02956 0 0.41622 3 0.17291 0.00917 0.05698 0.27734 -0.61893 -0.00918 0.09184 0 0.41622 4 0.67689 0.00534 -0.13037 0.25699 -0.68465 -0.00709 0.07087 0 0.3395 5 1.13262 0 -0.26367 0.18811 -0.64304 -0.00867 0.08675 0 0.3059 - Exhibit 15-20: Coefficient values for Equation 15-11 for passing lane segments.
Vertical Class f0 f1 f2 f3 f4 f5 f6 f7 f8 1 0.91793 -0.00557 0.36862 0 0 0.00611 0 -0.00419 0 2 0.65105 0 0.34931 0 0 0.00722 0 -0.00391 0 3 0.40117 0 0.68633 0 0 0.0235 0 -0.02088 0 4 1.13282 -0.00798 0.35425 0 0 0.01521 0 -0.00987 0 5 1.12077 -0.00550 0.25431 0 0 0.01269 0 -0.01053 0
The remainder of the calculations in Step 5 apply only if the segment contains horizontal curvature. Exhibit 15-21 provides a flowchart of the calculation procedure to adjust segment average speed for horizontal curvature. Instead of presenting the flowchart here, the steps to the flowchart are described in the text as follows.
For all horizontal curves within the segment:
- Determine the alignment classification using Exhibit 15-22.
- Exhibit 15-22: Horizontal alignment classifications.
Radius (ft) Superelevation (%) <1 ≥1
<2≥2
<3≥3
<4≥4
<5≥5
<6≥6
<7≥7
<8≥8
<9≥9
<10≥10 <300 5 5 5 5 5 5 5 5 5 5 5 300–449 4 4 4 4 4 4 4 4 4 4 4 450–599 4 3 3 3 3 3 3 3 3 3 3 600–749 3 3 3 3 3 3 2 2 2 2 2 750–899 2 2 2 2 2 2 2 2 2 2 2 900–1,049 2 2 2 2 2 2 2 2 1 1 1 1,050–1,199 2 2 2 2 1 1 1 1 1 1 1 1,200–1,349 2 2 1 1 1 1 1 1 1 1 1 1,350–1,499 1 1 1 1 1 1 1 1 1 1 — 1,500–1,649 1 1 1 1 1 1 1 1 — — — 1,650–1,799 1 1 1 1 1 1 — — — — — 1,800–1,949 1 1 1 1 1 — — — — — — 1,950–2,099 1 1 1 1 — — — — — — — 2,100–2,249 1 1 1 — — — — — — — — 2,250–2,399 1 1 — — — — — — — — — 2,400–2,549 1 — — — — — — — — — — ≥2,550 — — — — — — — — — — — - Calculate the horizontal curve BFFS using Equation 15-14; uses result from Exhibit 15-22.
BFFSHCi = min(BFFST, 44.32 + 0.3728 × BFFST − 6.868 × HorizClassi) (HCM7 Eq. 15-14)
- Calculate the horizontal curve FFS using Equation 15-13; uses result from Equation 15-14.
FFSHCi = BFFSHCi − 0.0255 × HV% (HCM7 Eq. 15-13)
- Calculate the m coefficient for Equation 15-12, using Equation 15-15.
(HCM7 Eq. 15-15) - Calculate the average speed on horizontal curve subsegment using Equation 15-12; uses results from Equations 15-13 and 15-15.
| (HCM7 Eq. 15-12) |
| (HCM7 Eq. 15-16) |
Step 6: Estimate the Percent Followers
- Equation 15-17: Percent followers estimation; uses results from Equations 15-22 and 15-23.
(HCM7 Eq. 15-17) - Equation 15-18: Percent followers at capacity flow rate for passing zone and passing constrained segments; uses results from Exhibit 15-24.
(HCM7 Eq. 15-18) - Exhibit 15-24: Coefficient values for Equation 15-18.
Vertical Class b0 b1 b2 b3 b4 b5 b6 b7 1 37.6808 3.05089 -7.90866 -0.94321 13.64266 -0.00050 -0.05500 7.13758 2 58.21104 5.73387 -13.66293 -0.66126 9.08575 -0.00950 -0.03602 7.14619 3 113.20439 10.01778 -18.90000 0.46542 -6.75338 -0.03000 -0.05800 10.03239 4 58.29978 -0.53611 7.35076 -0.27046 4.4985 -0.01100 -0.02968 8.89680 5 3.32968 -0.84377 7.08952 -1.32089 19.98477 -0.01250 -0.02960 9.99453 - Equation 15-19: Percent followers at capacity flow rate for passing lane segments; uses results from Exhibit 15-25.
(HCM7 Eq. 15-19) - Exhibit 15-25: Coefficient values for Equation 15-19.
Vertical Class b0 b1 b2 b3 b4 b5 b6 b7 1 61.73075 6.73922 –23.68853 –0.84126 11.44533 –1.05124 1.5039 0.00491 2 12.30096 9.57465 – 30.79427 –1.79448 25.76436 –0.66350 1.26039 –0.00323 3 206.07369 –4.29885 0 1.96483 – 30.32556 –0.75812 1.06453 –0.00839 4 263.13428 5.38749 – 19.04859 2.73018 – 42.76919 –1.31277 –0.32242 0.01412 5 126.95629 5.95754 – 19.22229 0.43238 –7.35636 –1.03017 –2.66026 0.01389
- Equation 15-20: Percent followers at 25% of capacity flow rate for passing zone and passing constrained segments; uses results from Exhibit 15-26.
(HCM7 Eq. 15-20) - Exhibit 15-26: Coefficient values for Equation 15-20.
Vertical Class c0 c1 c2 c3 c4 c5 c6 c7 1 18.01780 10.00000 -21.60000 -0.97853 12.05214 -0.00750 -0.06700 11.60405 2 47.83887 12.80000 -28.20000 -0.61758 5.8 -0.04550 -0.03344 11.35573 3 125.40000 19.50000 -34.90000 0.90672 -16.10000 -0.11000 -0.06200 14.71136 4 103.13534 14.68459 -23.72704 0.664436 -11.95763 -0.10000 0.00172 14.70067 5 89 19.02642 -34.54240 0.29792 -6.62528 -0.16000 0.00480 17.56611
- Equation 15-21: Percent followers at 25% of capacity flow rate for passing lane segments; uses results from Exhibit 15-27.
(HCM7 Eq. 15-21) - Exhibit 15-27: Coefficient values for Equation 15-21.
Vertical Class c0 c1 c2 c3 c4 c5 c6 c7 1 80.37105 14.44997 – 46.41831 –0.23367 0.84914 –0.56747 0.89427 0.00119 2 18.37886 14.71856 - 47.78892 –1.43373 18.3204 –0.13226 0.77217 –0.00778 3 239.9893 15.90683 – 46.87525 2.73582 – 42.88130 –0.53746 0.76271 –0.00428 4 223.68435 10.26908 – 35.60830 2.31877 – 38.30034 –0.60275 –0.67758 0.00117 5 137.37633 11.00106 – 38.89043 0.78501 – 14.88672 –0.72576 –2.49546 0.00872 - Equation 15-22: Slope coefficient (m) for Equation 15-17; uses results from Exhibit 15-28.
(HCM7 Eq. 15-22) - Exhibit 15-28: Coefficient values for Equation 15-22.
Segment Type d1 d2 Passing Zone and Passing Constrained –0.29764 –0.71917 Passing Lane –0.15808 –0.83732
- Equation 15-23: Power coefficient (p) for Equation 15-17; uses results from Exhibit 15-29.
(HCM7 Eq. 15-23) - Exhibit 15-29: Coefficient values for Equation 15-23.
Segment Type e0 e1 e2 e3 e4 Passing Zone and Passing Constrained 0.81165 0.3792 –0.49524 –2.11289 2.41146 Passing Lane –1.63246 1.6496 –4.45823 –4.89119 10.33057
Step 7: Calculate Additional Performance Measure Values for a Passing Lane Segment
- Equation 15-24: Estimate number of heavy vehicles entering the passing lane segment.
(HCM7 Eq. 15-24) - Equation 15-25: Estimate proportion of the demand flow in the faster lane (i.e., the lane used by passing vehicles); uses result from Equation 15-24.
PropFlowRateFL = 0.92183 − 0.05022 × ln(vd) − 0.00030 × NumHV (HCM7 Eq. 15-25)
- Equation 15-26: Estimate demand flow rate in the faster lane; uses result from Equation 15-25.
FlowRateFL = vd × PropFlowRateFL (HCM7 Eq. 15-26)
- Equation 15-27: Estimate demand flow rate in the slower lane (i.e., the lane used by non-passing vehicles); uses result from Equation 15-25.
FlowRateSL = vd × (1 − PropFlowRateFL) (HCM7 Eq. 15-27)
- Equation 15-28: Estimate percentage of heavy vehicles in the faster lane.
HV%FL = HV% × HVPropMultiplierFL (HCM7 Eq. 15-28)
- Equation 15-29: Estimate number of heavy vehicles in the slower lane; uses result from Equation 15-28.
(HCM7 Eq. 15-29) - Equation 15-30: Estimate percentage of heavy vehicles in the slower lane; uses result from Equation 15-29.
(HCM7 Eq. 15-30) - Equation 15-31: Estimate average speed lane differential adjustment.
(HCM7 Eq. 15-31) - Equation 15-32: Estimate average speed in the faster lane at the midpoint of the passing lane segment; uses result from Equation 15-31.
(HCM7 Eq. 15-32) - Equation 15-33: Estimate average speed in the slower lane at the midpoint of the passing lane segment; uses result from Equation 15-31.
(HCM7 Eq. 15-33)
Step 8: Calculate Follower Density
- Equation 15-34: Follower density estimation for passing lane segment midpoint.
(HCM7 Eq. 15-34) - Equation 15-35: Follower density estimation for passing zone and passing constrained segments.
(HCM7 Eq. 15-35)
Step 9: Determine Potential Adjustment to Follower Density
- Equation 15-36: Estimate percentage improvement to percent followers on a segment downstream of a passing lane segment.
(HCM7 Eq. 15-36)
- Equation 15-37: Estimate percentage improvement to the average speed on a segment downstream of a passing lane segment.
(HCM7 Eq. 15-37) - Equation 15-38: Adjusted follower density on a segment downstream of a passing lane segment; uses results from Equations 15-36 and 15-37.
(HCM7 Eq. 15-38)
Step 10: Determine LOS
- Exhibit 15-6: Motorized vehicle LOS criteria for two-lane highways.
Follower Density (followers/mi/ln)
LOS Posted Speed Limit
≥ 50 mi/hPosted Speed Limit
< 50 mi/hA ≤ 2.0 ≤ 2.5 B > 2.0–4.0 > 2.5–5.0 C > 4.0–8.0 > 5.0–10.0 D > 8.0–12.0 > 10.0–15.0 E > 12.0 > 15.0
Step 11: Facility Analysis
This step is not included in the rural highway facility analysis.
7.2 Nomenclature
| a0 − a5 = | coefficient values from Exhibit 15-12. |
| APD = | access-point density (access points/mi). |
| b0 − b5 = | coefficients for speed–flow slope model, from Exhibit 15-13 for passing zone and passing constrained segments, and from Exhibit 15-14 for passing lane segments. |
| b0 − b7 = | coefficient values for Equation 15-18, from Exhibit 15-24. |
| b0 − b7 = | coefficient values for Equation 15-19, from Exhibit 15-25. |
| b3 = | segment length coefficient for speed–flow slope model (decimal). |
| b4 = | heavy vehicle percentage coefficient for speed–flow slope model (decimal). |
| BFFS = | base free-flow speed (mi/h). |
| BFFSHCi = | base free-flow speed on horizontal curve subsegment i in the analysis direction (mi/h), from Equation 15-14. |
| BFFST = | base free-flow speed on preceding tangent subsegment in the analysis direction (mi/h). |
| c0 − c3 = | coefficients for the b3 segment length coefficient model, from Exhibit 15-15 for passing zone and passing constrained segments, and from Exhibit 15-16 for passing lane segments. |
| c0 − c7 = | coefficient values for Equation 15-20, from Exhibit 15-26. |
| c0 − c7 = | coefficient values for Equation 15-21, from Exhibit 15-27. |
| d0 − d3 = | coefficients for the b4 heavy vehicle percentage coefficient model, from Exhibit 15-17 for passing zone and passing constrained segments, and from Exhibit 15-18 for passing lane segments. |
| d1 − d2 = | coefficient values for Equation 15-22, from Exhibit 15-28 |
| DownstreamDistance = | distance downstream from the start of the passing lane segment (mi). |
| e0 − e4 = | coefficient values for Equation 15-23, from Exhibit 15-29. |
| f0 − f8 = | coefficients for the power coefficient model, from Exhibit 15-19 for passing zone and passing constrained segments, and from Exhibit 15-20 for passing lane segments. |
| fA = | adjustment for access point density, from Equation 15-6 (mi/h). |
| fLS = | adjustment for lane and shoulder width (mi/h), from Equation 15-5. |
| FDadj = | adjusted follower density on a segment downstream of a passing lane segment (followers/mi). |
| FDF = | average follower density for the facility in the analysis direction (followers/mi). |
| FDi = | follower density, or adjusted follower density, for segment i in the analysis direction (followers/mi). |
| FFS = | free-flow speed in the analysis direction (mi/h). |
| FFSHCi = | free-flow speed on horizontal curve subsegment i in the analysis direction (mi/h), from Equation 15-13. |
| FlowRate = | demand flow rate (veh/h). |
| FlowRateFL = | demand flow rate in the faster lane (veh/h). |
| FlowRateSL = | demand flow rate in the slower lane (i.e., the lane used by non-passing vehicles) (veh/h). |
| HorizClassi = | horizontal classification for subsegment i. |
| HV% = | percentage of heavy vehicles in the analysis direction (%). |
| HV%FL = | percentage of heavy vehicles in the faster lane (%). |
| HV%SL = | percentage of heavy vehicles in the faster lane (%). |
| HVPropMultiplierFL = | 0.4. |
| %ImprovePF = | % improvement to percent followers on a segment downstream of a passing lane segment. |
| %ImproveS = | % improvement to the average speed on a segment downstream of a passing lane segment. |
| L = | segment length (mi), subject to minima and maxima given in Step 1. |
| Li = | actual segment length for segment i (mi). |
| LW = | lane width (ft), constrained to minimum and maximum values of 9 ft and 12 ft, respectively. |
| m = | slope coefficient (decimal). |
| NumHV = | number of heavy vehicles entering the passing lane segment (veh). |
| NumHVSL = | number of heavy vehicles in the slower lane (veh). |
| p = | power coefficient (decimal). |
| PassLaneLength = | length of passing lane segment (mi). |
| PF = | percent followers in the analysis direction (%). |
| PFcap = | percent followers at capacity flow rate in the analysis direction (%). |
| PFPLmid_FL = | percent followers in the faster lane at the midpoint of the passing lane segment (%). |
| PFPLmid_SL = | percent followers in the slower lane at the midpoint of the passing lane segment (%). |
| PF25cap = | percent followers of 25% of the capacity flow rate in the analysis direction (%). |
| PHF = | peak hour factor (decimal). |
| PropFlowRateFL = | proportion of the demand flow in the faster lane (i.e., the lane used by passing vehicles) (decimal). |
| S = | average speed in the analysis direction (mi/h), with consideration of horizontal curvature. |
| SHCi = | average speed on horizontal curve subsegment i in the analysis direction (mi/h). |
| Sinit_FL = | initial average speed in the faster lane (mi/h). |
| Sinit_SL = | initial average speed in the slower lane (mi/h). |
| Spl = | posted speed limit (mi/h). |
| SPLmid-FL = | average speed in the faster lane at the midpoint of the passing lane segment (mi/h). |
| SPLmid-SL = | average speed in the slower lane at the midpoint of the passing lane segment (mi/h). |
| SubsegLengthi = | length of subsegment (horizontal curve or tangent) i (mi/h). |
| SubsegSpeedi = | speed of subsegment (horizontal curve or tangent) i (mi/h). |
| SW = | shoulder width (ft), constrained to minimum and maximum values of 0 ft and 6 ft, respectively. |
| V15 = | volume during the peak 15 min of the analysis hour (veh/15 min). |
| vd = | flow rate in the analysis direction (veh/h). |
| vo = | demand flow rate in opposing direction (veh/h); vo = 1,500 in passing constrained segments and vo = 0 in passing lane segments. |


