Reliability and Quality of Service Evaluation Methods for Rural Highways: A Guide (2024)
Chapter: 19 Case Study: Montana US-287

CHAPTER 19
Case Study: Montana US-287
19.1 Route Description
This route extends from 1.0 mile south of the small rural town of Townsend to the center of East Helena, Montana. US-287 serves as an important connection between Helena and I-90. This section of US-287 is approximately 30 miles in length.
The highest posted speed limit is 70 mi/h for the rural parts of the corridor (majority distance by length) and the lowest posted speed limit is 25 mi/h in the town of Townsend. The route is shown in Figure 19.1.
19.2 LOS
Segmentation
This route mainly consists of two-lane highway segments—passing constrained, passing zones, and two stretches of passing lanes. Unlike the other case study routes, this route contains an AWSC intersection, in the town of Townsend.
The facility segmentation, in the northbound direction, for this route was performed based on the change in cross section, change in passing restrictions, and change in the posted speed limit. This resulted in a total of 38 segments, including two passing lane segments, seven segments (with different speed limits) through the town of Townsend, two signal-controlled intersections, two multilane highway segments, and one AWSC intersection in Townsend. The remaining segments are two-lane highways (with passing or no-passing restrictions).
The final segmentation is shown in Table 19.1. The total length is 30.934 mi.
Townsend is a small rural town on US Highway 287, about 32 miles southeast of Helena. The total population of Townsend is 2,080 people (according to 2020 census data). The stretch of road through the town of Townsend comprises eight segments as indicated in Table 19.2 (starting at the southeast end of the town).
The stretch of road through the town of Townsend is approximately 1.9 miles in length, as shown in Figure 19.2.
The speed limits are 45, 35, and 25 mi/h entering the town and in the reverse order exiting the town. The roadway characteristics through the town are as follows:
- One lane in the analysis direction.
- Two-way left-turn lane in the center.
- AWSC intersection.
- No curb or gutter at the beginning of town, and then curb on both sides (starts at E-street).
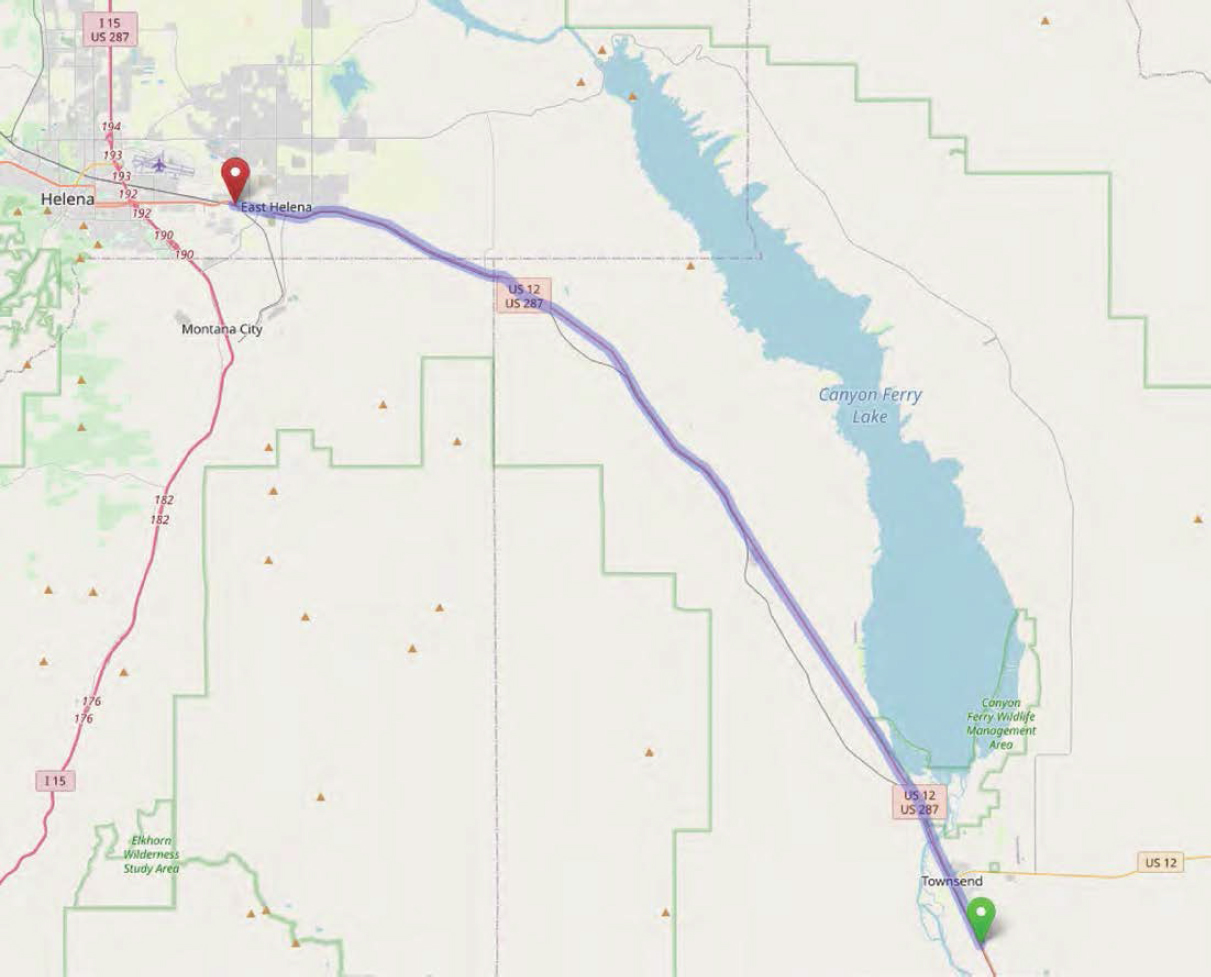
Figure 19.1. Montana US-287 study route boundaries.
Table 19.1. Final segmentation for Montana US-287 study route.
| Segment ID | Hwy Segment Type | Two-Lane Segment Type | # Directional Lanes | Length (ft) | Grade (%) | Vertical Align Class | # Horizontal Curves | Posted Speed (mi/h) |
|---|---|---|---|---|---|---|---|---|
| 1 | Two-Lane Highway | PassingConstrained | 1 | 1,515 | <2 | 1 | R>3,000 ft | 70 |
| 2 | Two-Lane Highway | PassingZone | 1 | 2,670 | <2 | 1 | R>3,000 ft | 55 |
| 3 | Two-Lane Highway | PassingConstrained | 1 | 530 | <2 | 1 | R>3,000 ft | 55 |
| 4 | Two-Lane Highway | PassingConstrained | 1 | 530 | <2 | 1 | R>3,000 ft | 45 |
| 5 | Two-Lane Highway | PassingConstrained | 1 | 2,650 | <2 | 1 | R>3,000 ft | 45 |
| 6 | Two-Lane Highway | PassingConstrained | 1 | 1,580 | <2 | 1 | R>3,000 ft | 35 |
| 7 | Two-Lane Highway | PassingConstrained | 1 | 530 | <2 | 1 | R>3,000 ft | 25 |
| 8 | AWSC | NA | 1 | 85 | <2 | 1 | R>3,000 ft | 25 |
| 9 | Two-Lane Highway | PassingConstrained | 1 | 965 | <2 | 1 | R>3,000 ft | 25 |
| 10 | Two-Lane Highway | PassingConstrained | 1 | 1,580 | <2 | 1 | R>3,000 ft | 35 |
| 11 | Two-Lane Highway | PassingConstrained | 1 | 2,100 | <2 | 1 | R>3,000 ft | 45 |
| 12 | Two-Lane Highway | PassingConstrained | 1 | 3,170 | <2 | 1 | R>3,000 ft | 55 |
| 13 | Two-Lane Highway | PassingZone | 1 | 5,500 | <2 | 1 | R>3,000 ft | 70 |
| 14 | Two-Lane Highway | PassingConstrained | 1 | 3,700 | <2 | 1 | R>3,000 ft | 70 |
| 15 | Two-Lane Highway | PassingZone | 1 | 9,500 | <2 | 1 | R>3,000 ft | 70 |
| 16 | Two-Lane Highway | PassingConstrained | 1 | 4,225 | <2 | 1 | R>3,000 ft | 70 |
| 17 | Two-Lane Highway | PassingZone | 1 | 5,280 | <2 | 1 | R>3,000 ft | 70 |
| 18 | Two-Lane Highway | PassingLane | 2 | 12,670 | <2 | 1 | R>3,000 ft | 70 |
| 19 | Two-Lane Highway | PassingConstrained | 1 | 1,056 | <2 | 1 | R>3,000 ft | 70 |
| 20 | Two-Lane Highway | PassingZone | 1 | 13,730 | <2 | 1 | R>3,000 ft | 70 |
| 21 | Two-Lane Highway | PassingConstrained | 1 | 4,225 | <2 | 1 | R>3,000 ft | 70 |
| 22 | Two-Lane Highway | PassingZone | 1 | 4,225 | <2 | 1 | R>3,000 ft | 55 |
| 23 | Two-Lane Highway | PassingConstrained | 1 | 3,170 | <2 | 1 | R>3,000 ft | 70 |
| 24 | Two-Lane Highway | PassingZone | 1 | 13,728 | <2 | 1 | R>3,000 ft | 70 |
| 25 | Two-Lane Highway | PassingConstrained | 1 | 4,750 | <2 | 1 | R>3,000 ft | 70 |
| 26 | Two-Lane Highway | PassingLane | 2 | 7,400 | <2 | 1 | R>3,000 ft | 55 |
| 27 | Two-Lane Highway | PassingConstrained | 1 | 3,700 | <2 | 1 | R>3,000 ft | 70 |
| 28 | Two-Lane Highway | PassingZone | 1 | 4,750 | <2 | 1 | R>3,000 ft | 70 |
| 29 | Two-Lane Highway | PassingConstrained | 1 | 1,590 | <2 | 1 | R>3,000 ft | 70 |
| 30 | Two-Lane Highway | PassingZone | 1 | 2,100 | <2 | 1 | R>3,000 ft | 55 |
| 31 | Two-Lane Highway | PassingConstrained | 1 | 3,170 | <2 | 1 | R>3,000 ft | 70 |
| 32 | Two-Lane Highway | PassingZone | 1 | 19,536 | <2 | 1 | R>3,000 ft | 70 |
| 33 | Two-Lane Highway | PassingConstrained | 1 | 4,752 | <2 | 1 | R>3,000 ft | 40 |
| 34 | Two-Lane Highway | PassingConstrained | 1 | 5,800 | <2 | 1 | R>3,000 ft | 55 |
| 35 | Signalized Intersection | NA | 2 | 120 | <2 | 1 | R>3,000 ft | 45 |
| 36 | Multilane Highway | NA | 2 | 3,580 | <2 | 1 | R>3,000 ft | 45 |
| 37 | Signalized Intersection | NA | 2 | 120 | <2 | 1 | R>3,000 ft | 45 |
| 38 | Multilane Highway | NA | 2 | 3,050 | <2 | 1 | R>3,000 ft | 55 |
Table 19.2. Segments through Townsend, Montana (US-287).
| Segment ID | Hwy Segment Type | Two-Lane Segment Type | # Directional Lanes | Length (ft) | Grade (%) | Vertical Align Class | Posted Speed (mi/h) |
|---|---|---|---|---|---|---|---|
| 1 | Two-Lane Highway | PassingConstrained | 1 | 530 | 0 | 1 | 45 |
| 2 | Two-Lane Highway | PassingConstrained | 1 | 2,650 | 0 | 1 | 45 |
| 3 | Two-Lane Highway | PassingConstrained | 1 | 1,580 | 0 | 1 | 35 |
| 4 | Two-Lane Highway | PassingConstrained | 1 | 530 | 0 | 1 | 25 |
| 5 | AWSC | NA | 1 | 85 | 0 | 1 | 25 |
| 6 | Two-Lane Highway | PassingConstrained | 1 | 965 | 0 | 1 | 25 |
| 7 | Two-Lane Highway | PassingConstrained | 1 | 1,580 | 0 | 1 | 35 |
| 8 | Two-Lane Highway | PassingConstrained | 1 | 2,100 | 0 | 1 | 45 |
- Sidewalk on the east side of the roadway only.
- Numerous driveways and access roads within the town limits.
- 25 mi/h zone in Townsend is about 0.32 miles (1,700 ft) long.
For the AWSC intersection (Segment 8), the upstream and downstream influence areas are initially calculated per Equation (2.5) and Equation (2.6), respectively. However, because of the low posted speed limit in this location, the practical braking and acceleration distance equations govern Equation (2.7) and Equation (2.8). For the signal-controlled intersections (Segments 35 and 37), the upstream influence area is calculated per Equation (2.1) and the downstream influence area per Equation (2.2).
The resulting influence area values are as follows:
- Segment 8, upstream influence area = 151 ft (0.0286 mi), downstream influence area = 125 ft (0.0237 mi).
- Segment 35, upstream influence area = 1,220 ft (0.2309 mi), downstream influence area = 1906 ft (0.2077 mi).
- Segment 37, upstream influence area = 643 ft (0.1218 mi), downstream influence area = 1,114 ft (0.2110 mi).
Traffic Data
Traffic data were obtained from the Montana DOT (MDOT) Traffic Data Portal. Traffic sensor coverage of the area is shown in Figure 19.3.
Detector data from the study route are summarized in Table 19.3.
The assignment of volumes to segments is given in Table 19.4.
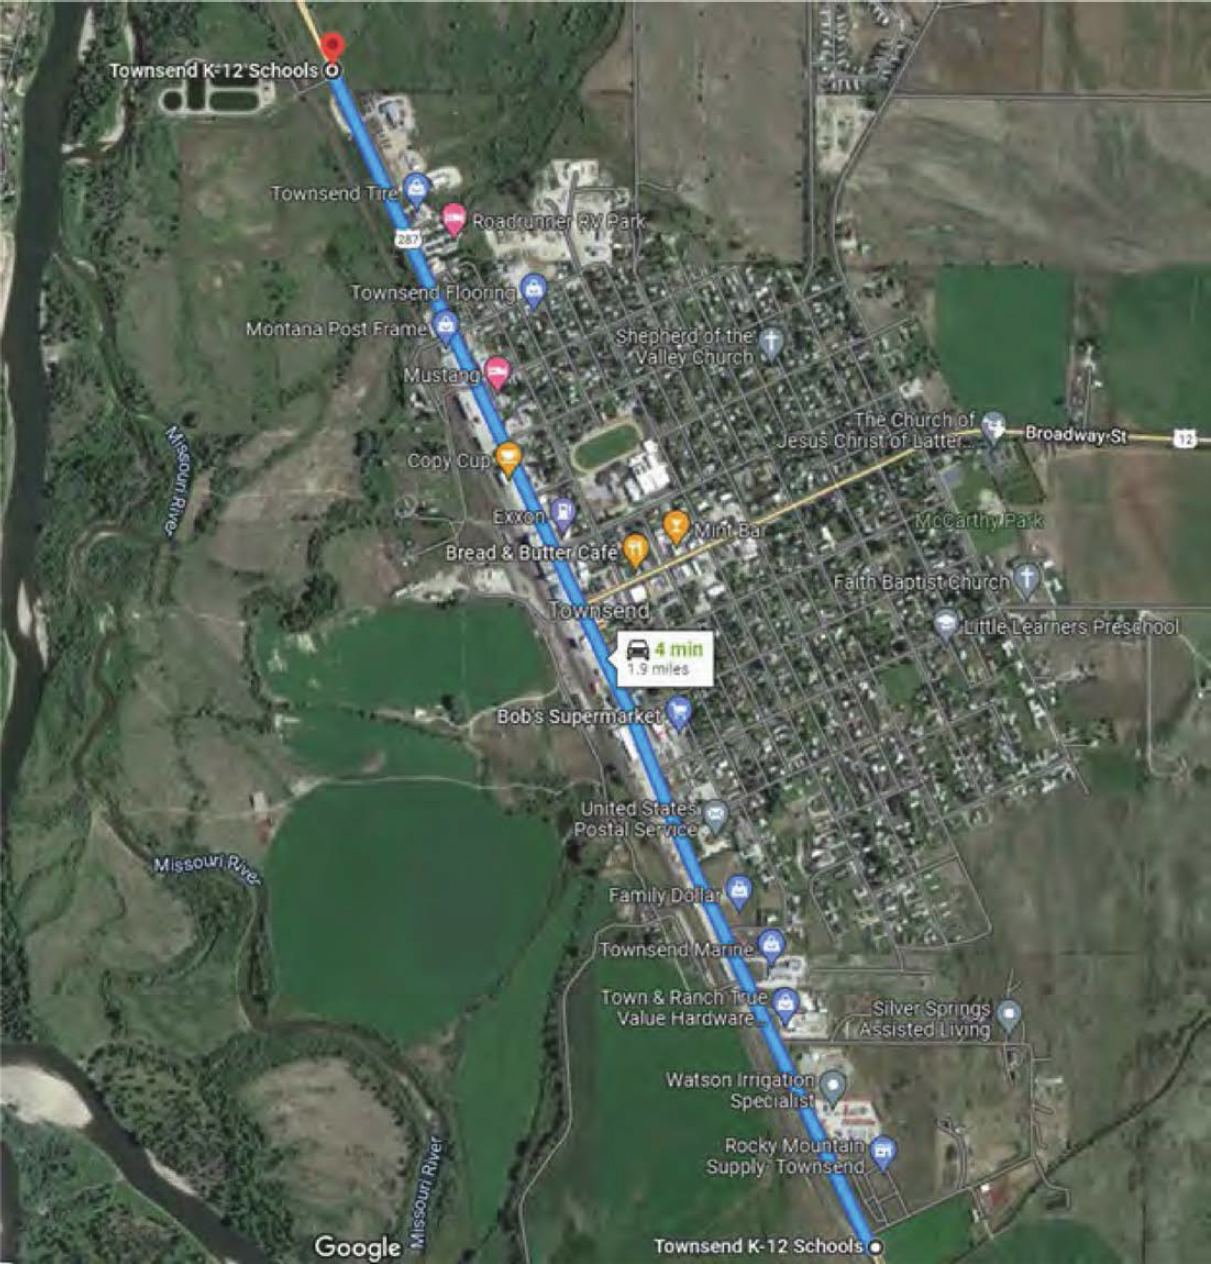
Figure 19.2. US-287 stretch through Townsend.
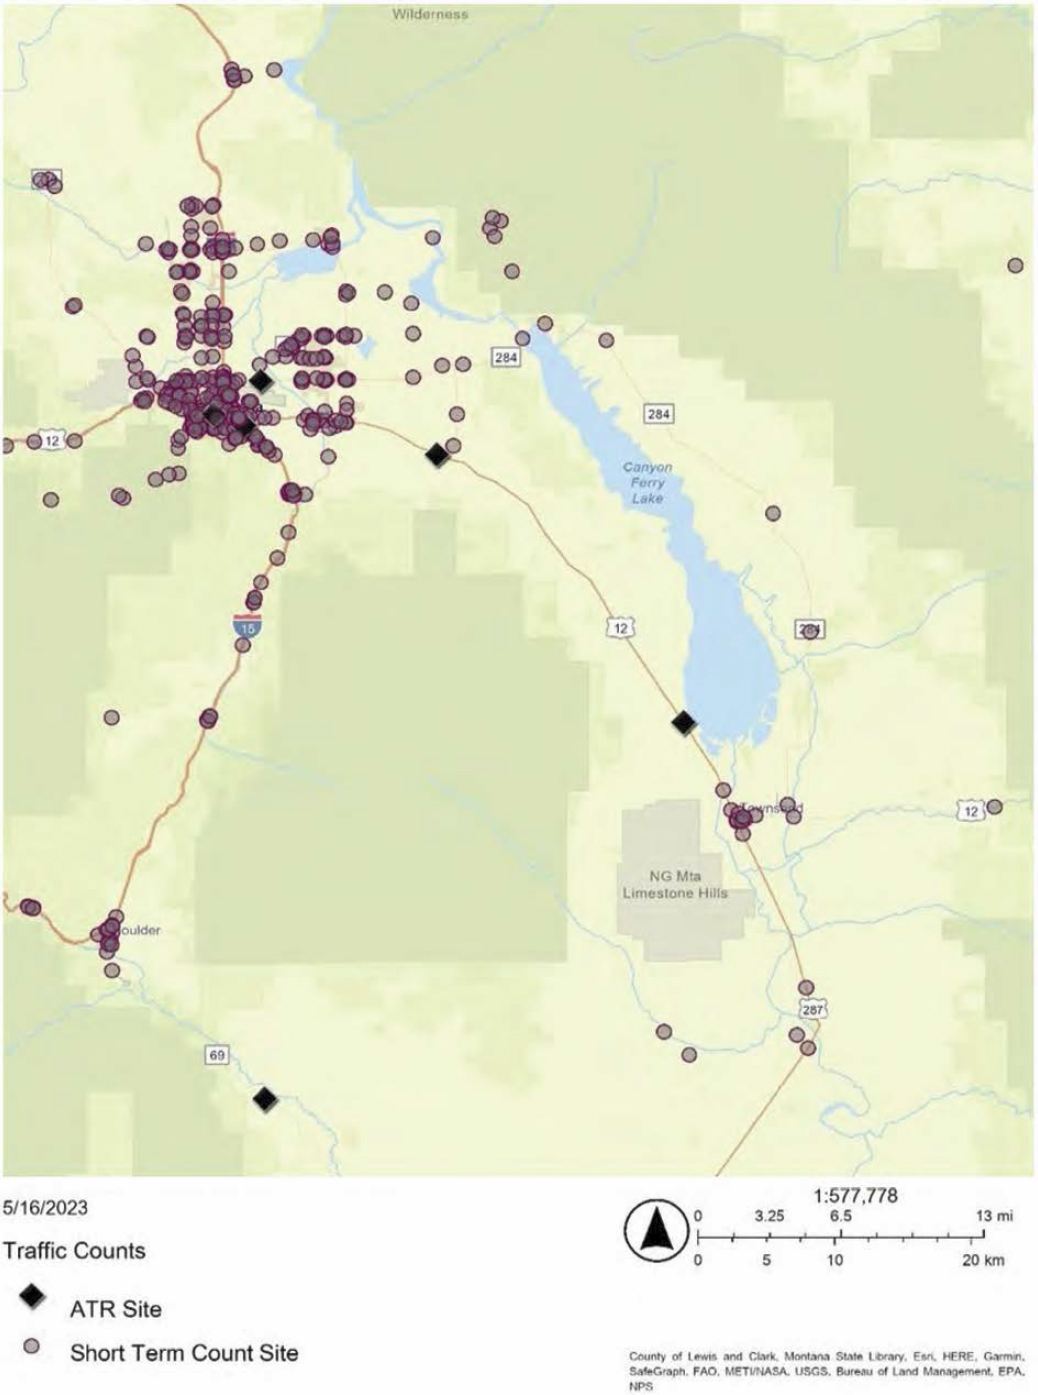
Table 19.3. US-287 Townsend route traffic data.
| Sensor No. | Sensor ID | AADT (veh/day) | K (%) | D (%) | Truck (%) | Directional Demand (veh/h) | Opposing Demand (veh/h) |
|---|---|---|---|---|---|---|---|
| 1 | 04-1-011 | 4,381 | 11 | 60 | 10 | 289 | 193 |
| 2 | 04-1-010 | 6,863 | 12 | 60 | 6 | 494 | 329 |
| 3 | 04-1-009 | 7,531 | 11 | 60 | 6 | 497 | 331 |
| 4 | 04-1-008 | 7,169 | 11 | 60 | 6 | 473 | 315 |
| 5 | 04-1-002 | 6,431 | 11 | 60 | 7 | 424 | 283 |
| 6 | W-101 | 6,537 | 12 | 54 | 7 | 471 | 314 |
| 7 | A-002 | 7,055 | 11 | 54 | 6 | 419 | 357 |
| 8 | 25-7B-002 | 11,445 | 9 | 60 | 4 | 618 | 412 |
| 9 | 25-7B-024 | 14,013 | 10 | 63 | 8 | 883 | 518 |
| 10 | 25-7B-019 | 17,196 | 10 | 63 | 7 | 1,083 | 636 |
Table 19.4. Volume assignment to segment number(s) as measured from a given traffic data sensor number.
| Sensor No. | Corresponding Segment(s) for Volume |
|---|---|
| 1 | 1–2 |
| 2 | 3–7 |
| 3 | 8–10 |
| 4 | 11–12 |
| 5 | 13–16 |
| 6 | 17–30 |
| 7 | 31–33 |
| 8 | 34–35 |
| 9 | 36–37 |
| 10 | 38 |
Results
The segment LOS results are shown in Tables 19.5 and 19.6.
The facility LOS results are shown in Table 19.7.
Discussion
The overall facility LOS, based on a LOS score of 1.58, is B. This is indicative of very good operations of the overall facility. This conclusion is further corroborated by an average facility speed of 65.8 mi/h and an average FFS delay of 7.8%. Further, LOS at the segment level indicates that all segments operate at LOS C or better except for three segments in the rural town of Townsend
Table 19.5. US-287 segment LOS analysis results, Part 1.
| Segment ID | Hwy Segment Type | Two-Lane Segment Type | # Directional Lanes | Length (mi) | Effective Length Upstream (mi) | Effective Length Downstream (mi) | Adj. Length (mi) | Posted Speed (mi/h) | Directional Volume (veh/h) | Opposing Volume (veh/h) | PHF | Directional Truck % | Analysis Flow Rate (veh/h/ln) | Analysis Flow Rate (pc/h/ln) | Vertical Align Class | Free-Flow Speed (mi/h) | Free-Flow Travel Time (s) | Avg Speed (mi/h) | Avg Travel Time (s) |
|---|---|---|---|---|---|---|---|---|---|---|---|---|---|---|---|---|---|---|---|
| 1 | TwoLaneHwy | PassingConstrained | 1 | 0.2869 | — | — | 0.2869 | 70 | 289 | 193 | 0.95 | 6.00 | 304.2 | — | 1 | 79.60 | 12.98 | 77.11 | 13.39 |
| 2 | TwoLaneHwy | PassingZone | 1 | 0.5057 | — | — | 0.5057 | 55 | 289 | 193 | 0.95 | 6.00 | 304.2 | — | 1 | 62.50 | 29.13 | 60.94 | 29.87 |
| 3 | TwoLaneHwy | PassingConstrained | 1 | 0.1004 | — | — | 0.1004 | 55 | 494 | 329 | 0.95 | 3.60 | 520.0 | — | 1 | 62.58 | 5.78 | 59.86 | 6.04 |
| 4 | TwoLaneHwy | PassingConstrained | 1 | 0.1004 | — | — | 0.1004 | 45 | 494 | 329 | 0.95 | 3.40 | 520.0 | — | 1 | 51.19 | 7.06 | 48.90 | 7.39 |
| 5 | TwoLaneHwy | PassingConstrained | 1 | 0.5019 | — | — | 0.5019 | 45 | 494 | 329 | 0.95 | 3.60 | 520.0 | — | 1 | 51.18 | 35.3 | 48.88 | 36.97 |
| 6 | TwoLaneHwy | PassingConstrained | 1 | 0.2992 | — | — | 0.2992 | 35 | 494 | 329 | 0.95 | 3.60 | 520.0 | — | 1 | 39.78 | 27.08 | 37.92 | 28.40 |
| 7 | TwoLaneHwy | PassingConstrained | 1 | 0.1004 | — | — | 0.0718 | 25 | 494 | 329 | 0.95 | 5.00 | 520.0 | — | 1 | 28.33 | 9.12 | 26.91 | 9.61 |
| 8 | AWSCIntersection | — | 1 | 0.0161 | 0.0286 | 0.0237 | 0.0523 | 25 | 497 | — | 0.95 | 3.00 | 523.2 | — | — | 27.50 | 6.84 | 5.72 | 32.92 |
| 9 | TwoLaneHwy | PassingConstrained | 1 | 0.1828 | — | — | 0.1752 | 25 | 497 | 331 | 0.95 | 6.00 | 523.2 | — | 1 | 28.30 | 22.29 | 26.87 | 23.47 |
| 10 | TwoLaneHwy | PassingConstrained | 1 | 0.2992 | — | — | 0.2992 | 35 | 497 | 331 | 0.95 | 6.00 | 523.2 | — | 1 | 39.70 | 27.13 | 37.84 | 28.47 |
| 11 | TwoLaneHwy | PassingConstrained | 1 | 0.3977 | — | — | 0.3977 | 45 | 473 | 315 | 0.95 | 6.00 | 497.9 | — | 1 | 51.10 | 28.02 | 48.86 | 29.30 |
| 12 | TwoLaneHwy | PassingConstrained | 1 | 0.6004 | — | — | 0.6004 | 55 | 473 | 315 | 0.95 | 6.00 | 497.9 | — | 1 | 62.50 | 34.58 | 59.83 | 36.13 |
| 13 | TwoLaneHwy | PassingZone | 1 | 1.0417 | — | — | 1.0417 | 70 | 424 | 283 | 0.95 | 4.20 | 446.3 | — | 1 | 79.66 | 47.08 | 76.97 | 48.72 |
| 14 | TwoLaneHwy | PassingConstrained | 1 | 0.701 | — | — | 0.701 | 70 | 424 | 283 | 0.95 | 4.20 | 446.3 | — | 1 | 79.66 | 31.68 | 76.54 | 32.97 |
| 15 | TwoLaneHwy | PassingZone | 1 | 1.799 | — | — | 1.799 | 70 | 424 | 283 | 0.95 | 4.20 | 446.3 | — | 1 | 79.66 | 81.3 | 76.95 | 84.17 |
| 16 | TwoLaneHwy | PassingConstrained | 1 | 0.8 | — | — | 0.8 | 70 | 424 | 361 | 0.95 | 4.20 | 446.3 | — | 1 | 79.66 | 36.15 | 76.53 | 37.63 |
| 17 | TwoLaneHwy | PassingZone | 1 | 1 | — | — | 1 | 70 | 471 | 314 | 0.95 | 4.20 | 495.8 | — | 1 | 79.66 | 45.19 | 76.75 | 46.91 |
| 18 | TwoLaneHwy | PassingLane | 2 | 2.4 | — | — | 2.4 | 70 | 471 | 314 | 0.95 | 4.20 | 495.8 | — | 1 | 79.66 | 108.46 | 79.36 | 108.87 |
| 18 | — | — | Faster Lane | — | — | — | — | — | — | — | — | 1.68 | 299.4 | — | — | 79.70 | — | 80.53 | 107.30 |
| 18 | — | — | Slower Lane | — | — | — | — | — | — | — | — | 8.00 | 196.4 | — | — | 79.50 | — | 77.58 | 111.37 |
| 19 | TwoLaneHwy | PassingConstrained | 1 | 0.2 | — | — | 0.2 | 70 | 471 | 314 | 0.95 | 4.20 | 495.8 | — | 1 | 79.66 | 9.04 | 76.38 | 9.43 |
| 20 | TwoLaneHwy | PassingZone | 1 | 2.6 | — | — | 2.6 | 70 | 471 | 314 | 0.95 | 4.20 | 495.8 | — | 1 | 79.66 | 117.5 | 76.72 | 122.00 |
| 21 | TwoLaneHwy | PassingConstrained | 1 | 0.8 | — | — | 0.8 | 70 | 471 | 314 | 0.95 | 4.20 | 495.8 | — | 1 | 79.66 | 36.15 | 76.35 | 37.72 |
| 22 | TwoLaneHwy | PassingZone | 1 | 0.8 | — | — | 0.8 | 55 | 471 | 314 | 0.95 | 4.20 | 495.8 | — | 1 | 62.56 | 46.04 | 60.23 | 47.81 |
| 23 | TwoLaneHwy | PassingConstrained | 1 | 0.6 | — | — | 0.6 | 70 | 471 | 314 | 0.95 | 4.20 | 495.8 | — | 1 | 79.66 | 27.12 | 76.36 | 28.29 |
| 24 | TwoLaneHwy | PassingZone | 1 | 2.6 | — | — | 2.6 | 70 | 471 | 314 | 0.95 | 4.20 | 495.8 | — | 1 | 79.66 | 117.5 | 76.72 | 122.00 |
| 25 | TwoLaneHwy | PassingConstrained | 1 | 0.9 | — | — | 0.9 | 70 | 471 | 314 | 0.95 | 4.20 | 495.8 | — | 1 | 79.66 | 40.67 | 76.35 | 42.44 |
| 26 | TwoLaneHwy | PassingLane | 2 | 1.402 | — | — | 1.402 | 55 | 471 | 314 | 0.95 | 4.20 | 495.8 | — | 1 | 62.56 | 80.68 | 62.14 | 81.22 |
| 26 | — | — | Faster Lane | — | — | — | — | — | — | — | — | 1.68 | 299.4 | — | — | 62.60 | — | 63.31 | 79.72 |
| 26 | — | — | Slower Lane | — | — | — | — | — | — | — | — | 8.00 | 196.4 | — | — | 62.40 | — | 60.36 | 83.62 |
| 27 | TwoLaneHwy | PassingConstrained | 1 | 0.701 | — | — | 0.701 | 70 | 471 | 314 | 0.95 | 4.20 | 495.8 | — | 1 | 79.66 | 31.68 | 76.36 | 33.05 |
| 28 | TwoLaneHwy | PassingZone | 1 | 0.9 | — | — | 0.9 | 70 | 471 | 314 | 0.95 | 4.20 | 495.8 | — | 1 | 79.66 | 40.67 | 76.75 | 42.21 |
| 29 | TwoLaneHwy | PassingConstrained | 1 | 0.301 | — | — | 0.301 | 70 | 471 | 314 | 0.95 | 4.20 | 495.8 | — | 1 | 79.66 | 13.6 | 76.38 | 14.19 |
| 30 | TwoLaneHwy | PassingZone | 1 | 0.398 | — | — | 0.398 | 55 | 471 | 314 | 0.95 | 4.20 | 495.8 | — | 1 | 62.56 | 22.9 | 60.25 | 23.78 |
| 31 | TwoLaneHwy | PassingConstrained | 1 | 0.6 | — | — | 0.6 | 70 | 419 | 357 | 0.95 | 3.60 | 441.1 | — | 1 | 79.68 | 27.11 | 76.58 | 28.21 |
| 32 | TwoLaneHwy | PassingZone | 1 | 3.7 | — | — | 3.7 | 70 | 466 | 357 | 0.95 | 3.60 | 490.5 | — | 1 | 79.68 | 167.17 | 76.73 | 173.59 |
| 33 | TwoLaneHwy | PassingConstrained | 1 | 0.9 | — | — | 0.9 | 70 | 466 | 310 | 0.95 | 3.60 | 490.5 | — | 1 | 79.68 | 40.66 | 76.39 | 42.42 |
| 34 | TwoLaneHwy | PassingConstrained | 1 | 1.098 | — | — | 0.8671 | 55 | 618 | 412 | 0.95 | 2.40 | 650.5 | — | 1 | 62.62 | 49.85 | 59.54 | 52.43 |
| 35 | SigIntersection | — | 2 | 0.0227 | 0.2309 | 0.2077 | 0.4386 | 45 | 711 | — | 1 | 2.40 | 680.0 | — | — | 49.50 | 31.9 | 29.79 | 52.99 |
| 36 | MultilaneHwy | — | 2 | 0.678 | — | — | 0.3712 | 45 | 841 | — | 0.95 | 2.00 | 885.3 | 463.9 | — | 52.50 | 25.46 | 52.50 | 25.46 |
| 37 | SigIntersection | — | 2 | 0.0227 | 0.1218 | 0.211 | 0.3328 | 45 | 883 | — | 1 | 4.80 | 783.0 | — | — | 49.50 | 24.2 | 25.69 | 46.62 |
| 38 | MultilaneHwy | — | 2 | 0.5777 | — | — | 0.3894 | 55 | 1080 | — | 0.95 | 2.00 | 1136.8 | 592.3 | — | 52.50 | 26.7 | 52.50 | 26.70 |
that were found to operate at LOS D. These three segments have a posted speed limit of 25 mi/h. Notably, the maximum d/c of 0.781 occurs at the AWSC intersection located within Townsend. The signal-controlled intersections in East Helena operate at LOS C, whereas the segments of multilane highway have densities of 8.8 veh/mi/ln and 11.3 veh/mi/ln with LOS A and B, respectively. The LOS Constancy of the facility is 0.479. This relatively low value suggests minimal variability or fluctuations in the LOS from one segment to another along the facility.
Table 19.6. US-287 segment LOS analysis results, Part 2.
| Segment ID | % Followers | Density (pc/mi/ln) | Density (veh/mi/ln) | Follower Density (veh/mi/ln) | Adj. Follower Density (veh/mi/ln) | Avg. Threshold Delay (s/veh) | Avg. Threshold Delay (%) | Avg. Free-Flow Speed Delay (s/veh) | Avg. Free-Flow Speed Delay (%) | LOS | LOS Value | Demand/Capacity | Available Capacity (veh/h) | Momentum (vol x speed) | Vehicle Miles Traveled | Vehicle Hours Traveled | Vehicle Hours of Delay |
|---|---|---|---|---|---|---|---|---|---|---|---|---|---|---|---|---|---|
| 1 | 36.9 | — | 3.9 | 1.5 | 1.5 | 0 | 0 | 0.4 | 3.2 | A | 0.73 | 0.179 | 1,396 | 23,458.2 | 87.30 | 1.130 | 0.035 |
| 2 | 37.6 | — | 5 | 1.9 | 1.9 | 0 | 0 | 0.7 | 2.6 | A | 0.94 | 0.179 | 1,396 | 18,539.6 | 153.80 | 2.520 | 0.063 |
| 3 | 57 | — | 8.7 | 5 | 5 | 0 | 0 | 0.3 | 4.5 | C | 2.24 | 0.306 | 1,180 | 31,128.8 | 52.20 | 0.870 | 0.038 |
| 4 | 60.1 | — | 10.6 | 6.4 | 6.4 | 0 | 0 | 0.3 | 4.7 | C | 2.28 | 0.306 | 1,180 | 25,428 | 52.20 | 1.070 | 0.048 |
| 5 | 58.2 | — | 10.6 | 6.2 | 6.2 | 0 | 0 | 1.7 | 4.7 | C | 2.24 | 0.306 | 1,180 | 25,416.8 | 261.00 | 5.340 | 0.240 |
| 6 | 61.5 | — | 13.7 | 8.4 | 8.4 | 0 | 0 | 1.3 | 4.9 | C | 2.69 | 0.306 | 1,180 | 19,718.7 | 155.60 | 4.100 | 0.192 |
| 7 | 62.1 | — | 19.3 | 12 | 12 | 0 | 0 | 0.5 | 5.3 | D | 3.4 | 0.306 | 1,180 | 13,992.9 | 37.30 | 1.390 | 0.070 |
| 8 | — | — | — | — | — | 25.4 | 371.1 | 26.1 | 381.1 | D | 3.11 | 0.781 | 147 | 2,990.5 | 27.30 | 4.780 | 3.790 |
| 9 | 62.2 | — | 19.5 | 12.1 | 12.1 | 0 | 0 | 1.2 | 5.3 | D | 3.42 | 0.308 | 1,177 | 14,058.9 | 91.70 | 3.410 | 0.172 |
| 10 | 61.6 | — | 13.8 | 8.5 | 8.5 | 0 | 0 | 1.3 | 4.9 | C | 2.7 | 0.308 | 1,177 | 19,795.3 | 156.50 | 4.140 | 0.194 |
| 11 | 57.7 | — | 10.2 | 5.9 | 5.9 | 0 | 0 | 1.3 | 4.6 | C | 2.18 | 0.293 | 1,202 | 24,326.2 | 198.00 | 4.050 | 0.178 |
| 12 | 53.5 | — | 8.3 | 4.5 | 4.5 | 0 | 0 | 1.5 | 4.5 | C | 2.11 | 0.293 | 1,202 | 29,787.6 | 298.90 | 5.000 | 0.214 |
| 13 | 42.1 | — | 5.8 | 2.4 | 2.4 | 0 | 0 | 1.6 | 3.5 | B | 1.22 | 0.263 | 1,254 | 34,351.1 | 464.90 | 6.040 | 0.204 |
| 14 | 44 | — | 5.8 | 2.6 | 2.6 | 0 | 0 | 1.3 | 4.1 | B | 1.28 | 0.263 | 1,254 | 34,159.6 | 312.90 | 4.090 | 0.160 |
| 15 | 42.7 | — | 5.8 | 2.5 | 2.5 | 0 | 0 | 2.9 | 3.5 | B | 1.24 | 0.263 | 1,254 | 34,342.5 | 802.90 | 10.430 | 0.355 |
| 16 | 43.7 | — | 5.8 | 2.6 | 2.6 | 0 | 0 | 1.5 | 4.1 | B | 1.28 | 0.263 | 1,254 | 34,157.9 | 357.10 | 4.670 | 0.183 |
| 17 | 45.2 | — | 6.5 | 2.9 | 2.9 | 0 | 0 | 1.7 | 3.8 | B | 1.46 | 0.292 | 1,204 | 38,051.5 | 495.80 | 6.460 | 0.236 |
| 18 | 23.3 | — | 6.2 | 0.7 | 0.7 | 0 | 0 | 0.4 | 0.4 | A | 0.36 | 0.165 | 1,004 | 39,345.7 | 1,189.90 | 15.000 | 0.057 |
| 18 | 26.9 | — | 3.7 | 1 | — | — | — | — | — | — | — | — | — | — | 718.59 | 8.924 | -0.087 |
| 18 | 17.9 | — | 2.5 | 0.5 | — | — | — | — | — | — | — | — | — | — | 471.31 | 6.075 | 0.149 |
| 19 | 49.5 | — | 6.5 | 3.2 | 2.6 | 0 | 0 | 0.4 | 4.3 | B | 1.29 | 0.292 | 1,204 | 37,868.3 | 99.20 | 1.300 | 0.053 |
| 20 | 46.1 | — | 6.5 | 3 | 2.6 | 0 | 0 | 4.5 | 3.8 | B | 1.31 | 0.292 | 1,204 | 38,038.3 | 1289.10 | 16.800 | 0.620 |
| 21 | 46.6 | — | 6.5 | 3 | 2.7 | 0 | 0 | 1.6 | 4.3 | B | 1.35 | 0.292 | 1,204 | 37,854.6 | 396.60 | 5.190 | 0.216 |
| 22 | 50.3 | — | 8.2 | 4.1 | 3.7 | 0 | 0 | 1.8 | 3.9 | B | 1.87 | 0.292 | 1,204 | 29,863.6 | 396.60 | 6.580 | 0.245 |
| 23 | 47.2 | — | 6.5 | 3.1 | 2.8 | 0 | 0 | 1.2 | 4.3 | B | 1.39 | 0.292 | 1,204 | 37,858.7 | 297.50 | 3.900 | 0.161 |
| 24 | 46.1 | — | 6.5 | 3 | 2.8 | 0 | 0 | 4.5 | 3.8 | B | 1.39 | 0.292 | 1,204 | 38,038.3 | 1289.10 | 16.800 | 0.620 |
| 25 | 46.4 | — | 6.5 | 3 | 2.8 | 0 | 0 | 1.8 | 4.3 | B | 1.42 | 0.292 | 1,204 | 37,852.7 | 446.20 | 5.840 | 0.243 |
| 26 | 28.4 | — | 8 | 1.1 | 1.1 | 0 | 0 | 0.5 | 0.7 | A | 0.56 | 0.165 | 1,004 | 30,810.7 | 695.10 | 11.190 | 0.074 |
| 26 | 32.5 | — | 4.7 | 1.5 | — | — | — | — | — | — | — | — | — | — | 419.78 | 6.630 | -0.071 |
| 26 | 22.2 | — | 3.3 | 0.7 | — | — | — | — | — | — | — | — | — | — | 275.32 | 4.561 | 0.151 |
| 27 | 46.8 | — | 6.5 | 3 | 2.4 | 0 | 0 | 1.4 | 4.3 | B | 1.22 | 0.292 | 1,204 | 37,856.6 | 347.50 | 4.550 | 0.189 |
| 28 | 45.3 | — | 6.5 | 2.9 | 2.5 | 0 | 0 | 1.5 | 3.8 | B | 1.23 | 0.292 | 1,204 | 38,053.1 | 446.20 | 5.810 | 0.212 |
| 29 | 49 | — | 6.5 | 3.2 | 2.7 | 0 | 0 | 0.6 | 4.3 | B | 1.35 | 0.292 | 1,204 | 37,866.6 | 149.20 | 1.950 | 0.081 |
| 30 | 51.9 | — | 8.2 | 4.3 | 3.7 | 0 | 0 | 0.9 | 3.8 | B | 1.85 | 0.292 | 1,204 | 29,871.9 | 197.30 | 3.280 | 0.121 |
| 31 | 44 | — | 5.8 | 2.5 | 2.2 | 0 | 0 | 1.1 | 4 | B | 1.11 | 0.259 | 1,259 | 33,775.4 | 264.60 | 3.460 | 0.134 |
| 32 | 46 | — | 6.4 | 2.9 | 2.7 | 0 | 0 | 6.4 | 3.8 | B | 1.37 | 0.289 | 1,209 | 37,638.4 | 1,814.90 | 23.650 | 0.876 |
| 33 | 46.1 | — | 6.4 | 3 | 2.8 | 0 | 0 | 1.8 | 4.3 | B | 1.4 | 0.289 | 1,209 | 37,468.9 | 441.50 | 5.780 | 0.239 |
| 34 | 60.2 | — | 10.9 | 6.6 | 6.6 | 0 | 0 | 2.6 | 5.2 | C | 2.64 | 0.383 | 1,049 | 38,733.2 | 564.10 | 9.470 | 0.466 |
| 35 | — | — | — | — | — | 17.9 | 51 | 21.1 | 66.1 | C | 2.07 | 0.46 | 784 | 20,260.4 | 298.20 | 10.010 | 3.985 |
| 36 | — | 8.8 | — | — | — | 0 | 0 | 0 | 0 | A | 0.8 | 0.226 | 3,027 | 46,476.3 | 328.60 | 6.260 | 0.000 |
| 37 | — | — | — | — | — | 20 | 75.1 | 22.4 | 92.7 | C | 2.16 | 0.55 | 639 | 20,118.5 | 260.60 | 10.140 | 4.877 |
| 38 | — | 11.3 | — | — | — | 1.2 | 4.8 | 0 | 0 | B | 1.04 | 0.289 | 2,798 | 59,684.2 | 442.70 | 8.430 | 0.000 |
Table 19.7. US-287 facility analysis results.
| Performance Measure | Value |
|---|---|
| Free-Flow Travel Time (s) | 1,571.8 |
| Avg. Travel Time (s) | 1,693.79 |
| Avg. Speed (mi/h) | 65.75 |
| Vehicle Miles Traveled (veh-mi) | 15,660.32 |
| Vehicle Hours Traveled (veh-h) | 244.907 |
| Delay (veh-h) | 19.839 |
| Avg. Free-Flow Speed Delay (s/veh) | 122.02 |
| Avg. Free-Flow Speed Delay (%) | 7.8 |
| Avg. Threshold Delay (s/veh) | 64.52 |
| Avg. Threshold Delay (%) | 4.1 |
| LOS Score (Weighted Travel Time) | 1.493 |
| LOS Constancy | 0.479 |
| LOS Adjustment Factor | 1.056 |
| LOS Score (Weighted Travel Time and Adjusted) | 1.577 |
| Maximum d/c | 0.781 |


