Reliability and Quality of Service Evaluation Methods for Rural Highways: A Guide (2024)
Chapter: 17 Case Study: Tennessee SR-109

CHAPTER 17
Case Study: Tennessee SR-109
17.1 Route Description
SR-109 is a rural highway approximately 30 miles east of Nashville, Tennessee. It runs primarily north-south between I-65 (at the north, 36.63005995380142, -86.57224654711138) and I-840 (at the south, 36.13174756486397, -86.40076816231978). The route is shown in Figure 17.1. It is approximately 40 miles in length. More background information about this route can be found in a report that documents an access management study for this corridor (Gresham Smith and Partners 2016).
17.2 LOS
The LOS analysis focuses on the section of SR-109 between I-65 and the southern end of the city of Gallatin. This section is approximately 22 miles in length. The selected route is mostly contained within Sumner country. The northern terminus of the selected route, where it intersects with I-65, is just across the border of Robertson county. The southern portion of SR-109, not included in this analysis, is contained within Wilson county. The route is shown in Figure 17.2.
Segmentation
This route consists of sections of multilane highway, two-lane highway (with passing constrained and passing zone segments), several isolated signalized intersections, an arterial section through the small town of Portland, and several interchange ramp connections.
The general geometric configuration of the roadway through this section of SR-109 is as follows (from south to north):
- Multilane highway in rural developed area (city of Gallatin), S Water Ave to Scotty Parker Rd/Old Hwy 109 N, approximately 5.93 mi.
- Multilane highway in rural undeveloped area, intersection with SR-52, approximately 11.38 mi.
- Arterial through the city of Portland, SR-52 to Morningside Dr, approximately 1.02 mi.
- Two-lane highway in rural undeveloped area, Morningside Dr to Magnolia Springs Rd, approximately 2.84 mi.
- Multilane highway in rural undeveloped area, Magnolia Springs Rd to I-65 on-ramp, approximately 1.04 mi.
Figures 17.3 through 17.12 illustrate the variety of geometric configurations found along this route. Note that these photos are from a vehicle traveling in the southbound direction of the route.
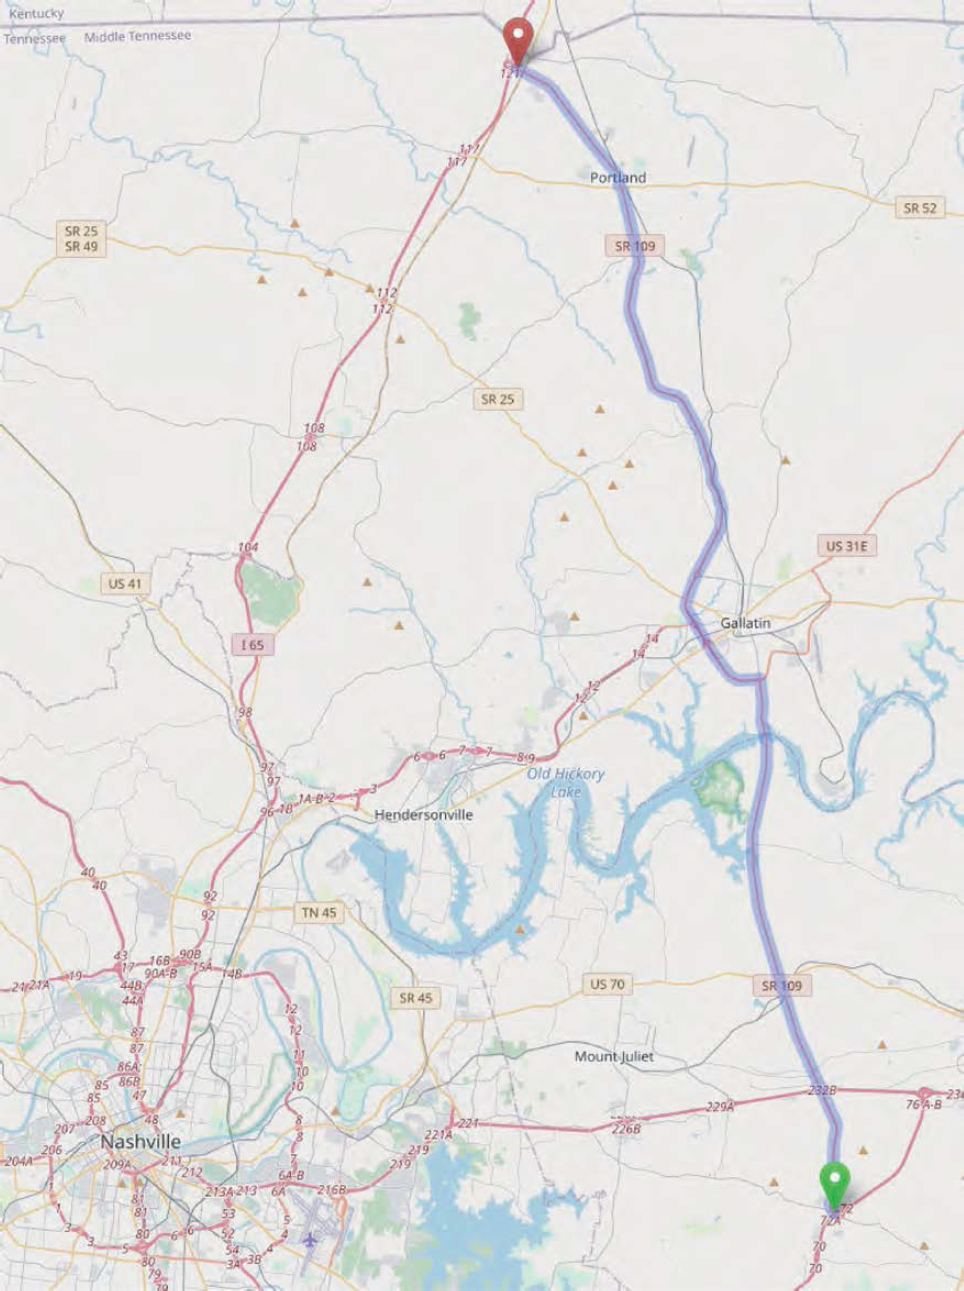
Figure 17.1. Tennessee SR-109 study route boundaries.
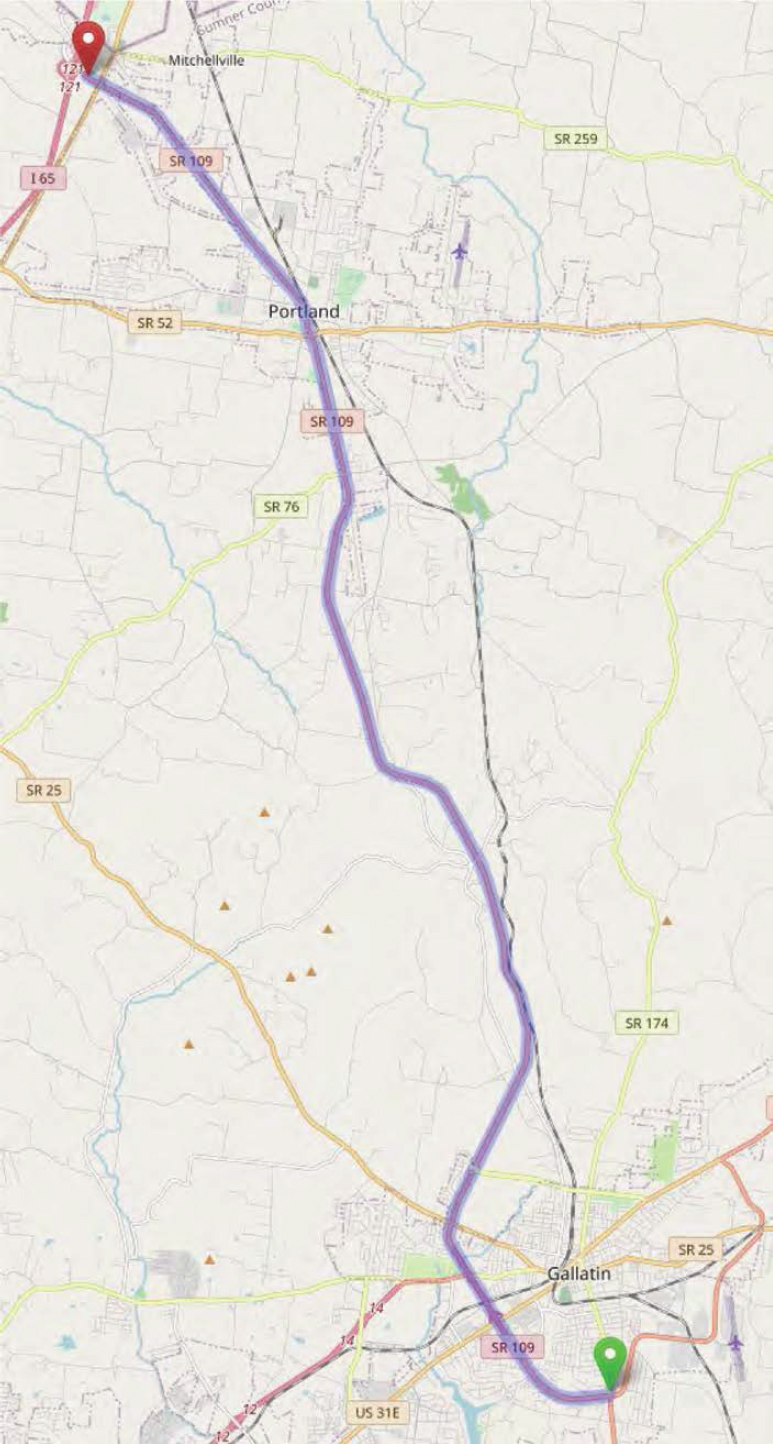
Figure 17.2. Tennessee SR-109 LOS study route boundaries.
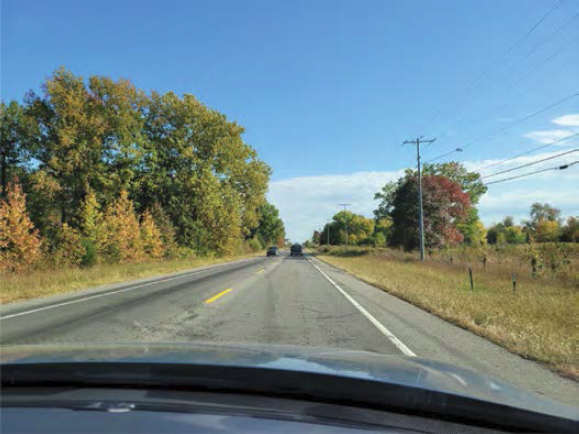
Figure 17.3. Tennessee SR-109, two-lane highway cross section, north of Kirby Dr.
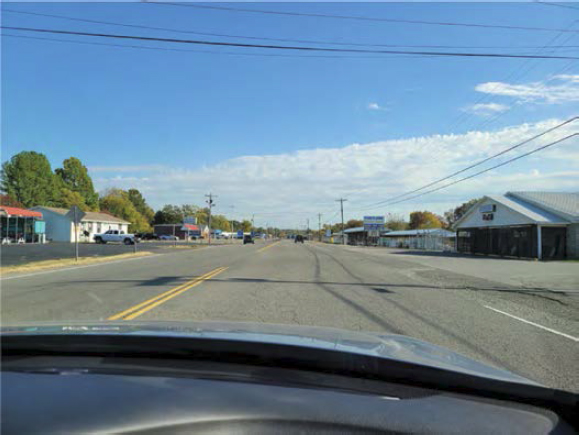
Figure 17.4. Tennessee SR-109, transition from two-lane to multilane highway, at Morningside Dr.
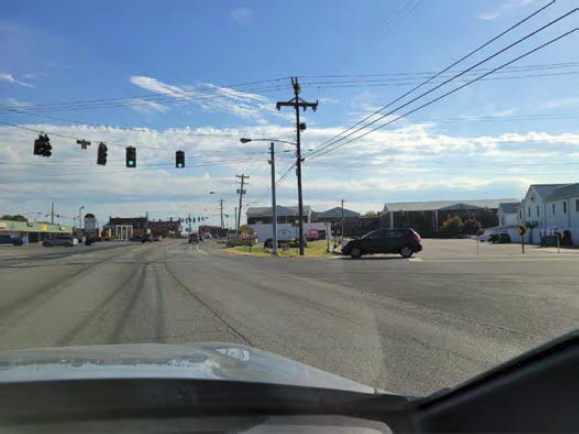
Figure 17.5. Tennessee SR-109, signalized intersection within the city of Portland, at College St, no left-turn bays.
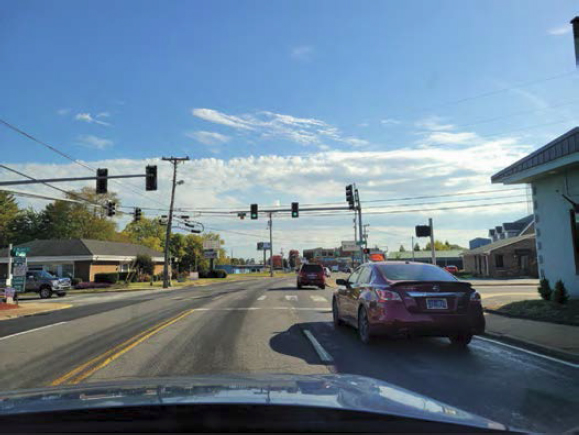
Figure 17.6. Tennessee SR-109, signalized intersection within the city of Portland, at Market St, no left-turn bays.
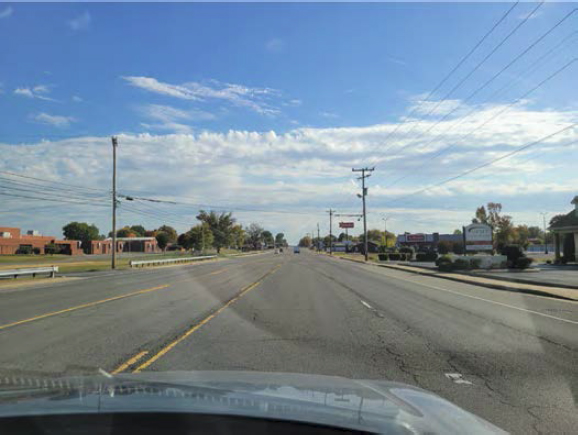
Figure 17.7. Tennessee SR-109, multilane highway with TWLTL, curb and gutter, city of Portland, south of Village Dr.
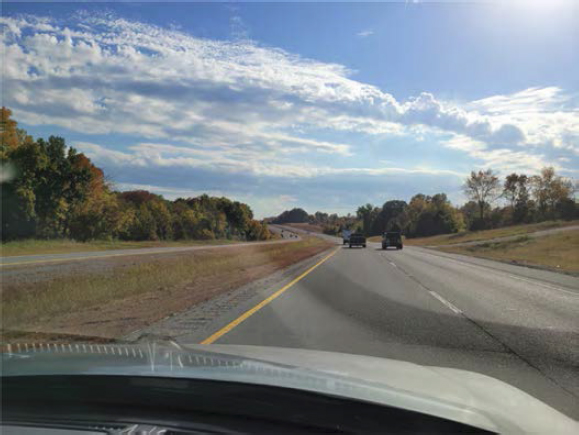
Figure 17.8. Tennessee SR-109, multilane highway with grass median, no curb or gutter, city of Portland, south of Academy Rd.
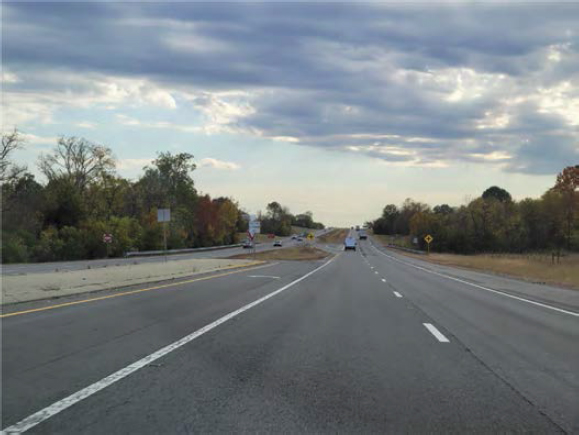
Figure 17.9. Tennessee SR-109, multilane highway with left-turn and U-turn treatments, south of Scotty Parker Rd/Old Hwy 109 N.
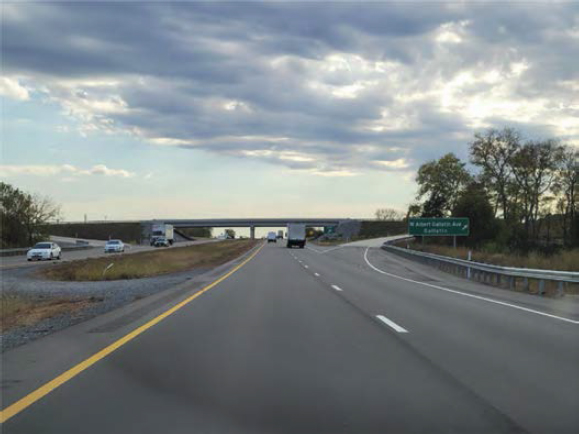
Figure 17.10. Tennessee SR-109, exit ramp at diamond interchange, W Albert Gallatin Ave.
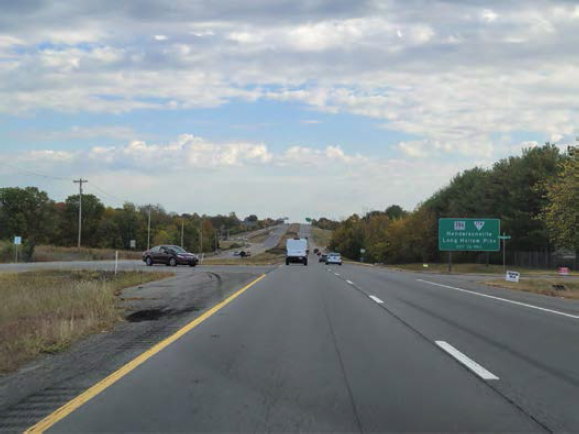
Figure 17.11. Tennessee SR-109, multilane highway with left-turn treatment, at Wedgewood Dr.
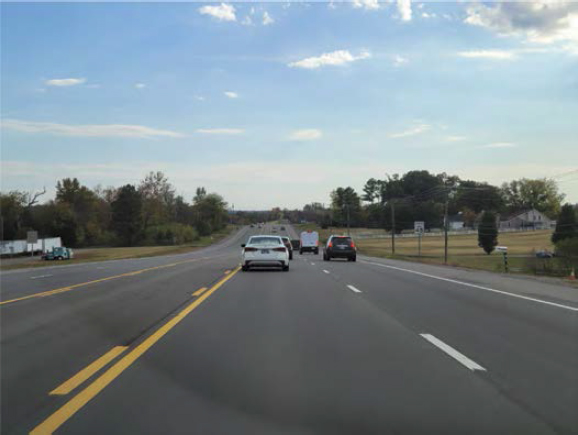
Figure 17.12. Tennessee SR-109, multilane highway with TWLTL, no curb and gutter, north of Academy Rd.
The final segmentation is shown in Table 17.1. The total length is 22.386 mi.
The vertical alignment generally ranges from level to rolling terrain. The changes in terrain along the route are shown in Table 17.2.
The screen captures of the graphical representation of the segmentation from Google Earth, as was done for the Oregon US-20 case study, are not included here. Instead, the reader is referred to the KML file available on the National Academies Press website (nap.nationalacademies.org) by searching for NCHRP Research Report 1102: Reliability and Quality of Service Evaluation Methods for Rural Highways: A Guide.
Table 17.1. Final segmentation for Tennessee SR-109 study route.
| Segment ID | From/To | Hwy Segment Type | Two-Lane Segment Type | # Directional Lanes | Length (ft) | Length (mi) | Terrain | Vertical Align Class | Posted Speed (mi/h) |
|---|---|---|---|---|---|---|---|---|---|
| 1 | Start Point - Clear Lake Meadows Dr. | MultilaneHwy | — | 2 | 1,853 | 0.3509 | Level | NA | 55 |
| 2 | Clear Lake Meadows Dr. - Ryan Ave. | MultilaneHwy | — | 2 | 4,444 | 0.8417 | Level | NA | 55 |
| 3 | Ryan Ave - Hancock St | MultilaneHwy | — | 2 | 1,517 | 0.2873 | Rolling | NA | 55 |
| 4 | Hancock St. | SigIntersection | — | 2 | 800 | 0.1515 | NA | NA | 55 |
| 5 | Hancock St. - Nashville Turnpike Off Ramp | MultilaneHwy | — | 2 | 2,440 | 0.4621 | Rolling | NA | 55 |
| 6 | Nashville Turnpike Off Ramp - Nashville Turnpike On | MultilaneHwy | — | 2 | 897 | 0.1699 | Rolling | NA | 55 |
| Ramp | |||||||||
| 7 | Nashville Turnpike On Ramp - Long Hollow Pike Off | MultilaneHwy | — | 2 | 1,430 | 0.2708 | Rolling | NA | 55 |
| Ramp | |||||||||
| 8 | Hollow Point Pike Off Ramp - Hollow Point Pike On | MultilaneHwy | — | 2 | 2,196 | 0.4159 | Rolling | NA | 55 |
| Ramp | |||||||||
| 9 | Hollow Point Pike On Ramp - Red River Road | MultilaneHwy | — | 2 | 3,303 | 0.6256 | Level | NA | 55 |
| 10 | Red River Rd. | SigIntersection | — | 2 | 300 | 0.0568 | NA | NA | 55 |
| 11 | Red River Rd. - Albert Gallatin Ave Off Ramp | MultilaneHwy | — | 2 | 3,369 | 0.6381 | Level | NA | 55 |
| 12 | Albert Gallatin Ave Off Ramp - Albert Gallatin Ave On Ramp | MultilaneHwy | — | 2 | 1,595 | 0.3021 | Rolling | NA | 55 |
| 13 | Albert Gallatin Ave On Ramp - Old Douglas Rd. | MultilaneHwy | — | 2 | 5,377 | 1.0184 | Rolling | NA | 55 |
| 14 | Old Douglas Rd - Old Hwy 109 N (Before) | MultilaneHwy | — | 2 | 1,340 | 0.2538 | Rolling | NA | 55 |
| 15 | Old Hwy 109 N (End) - S Tunnel Rd | MultilaneHwy | — | 2 | 16,760 | 3.1742 | Rolling | NA | 55 |
| 16 | S Tunnel Rd - Scotty Parker Rd | MultilaneHwy | — | 2 | 8,175 | 1.5483 | Rolling | NA | 55 |
| 17 | Scotty Parker Rd - Old Tennessee 109 | MultilaneHwy | — | 2 | 847 | 0.1604 | Rolling | NA | 55 |
| 18 | Old Tennessee Rd - Hollis Chapel Rd | MultilaneHwy | — | 2 | 1,182 | 0.2239 | Rolling | NA | 55 |
| 19 | Hollis Chapel Rd - Roberts Rd | MultilaneHwy | — | 2 | 2,130 | 0.4034 | Level | NA | 55 |
| 20 | Roberts Rd - Boiling Springs Rd | MultilaneHwy | — | 2 | 8,130 | 1.5398 | Level | NA | 55 |
| 21 | Boiling Springs Rd - N Centerpoint Rd | MultilaneHwy | — | 2 | 3,505 | 0.6638 | Rolling | NA | 55 |
| 22 | N Centerpoint Rd - PSL Decrease (55 to 45) | MultilaneHwy | — | 2 | 5,545 | 1.0502 | Rolling | NA | 55 |
| 23 | PSL Drop (55 to 45) - SR-76 | MultilaneHwy | — | 2 | 2,880 | 0.5455 | Rolling | NA | 45 |
| 24 | SR-76/Fountainhead Rd | SigIntersection | — | 2 | 300 | 0.0568 | NA | NA | 45 |
| 25 | SR-76 - Longview Dr. | MultilaneHwy | — | 2 | 4,040 | 0.7652 | Level | NA | 45 |
| 26 | Longview Dr. | SigIntersection | — | 2 | 1,400 | 0.2652 | NA | NA | 45 |
| 27 | Longview Dr - SR-52 | MultilaneHwy | — | 2 | 5,715 | 1.0824 | Level | NA | 45 |
| 28 | SR-52 | SigIntersection | — | 2 | 225 | 0.0426 | NA | NA | 45 |
| 29 | SR-52 - Morningside Dr | Arterial | — | 2 | 5,405 | 1.0237 | NA | NA | 30 |
| 30 | Morningside Dr - Oakhill Dr | TwoLaneHwy | Passing Constrained | 1 | 3,633 | 0.6881 | NA | 1 | 45 |
| 31 | Oakhill Dr - National Barn Company Driveway | TwoLaneHwy | PassingZone | 1 | 2,290 | 0.4337 | NA | 1 | 45 |
| 32 | Kirby Dr | SigIntersection | — | 1 | 1,515 | 0.2869 | NA | NA | 45 |
| 33 | TwoLaneHwy | PassingZone | 1 | 1,664 | 0.3152 | NA | 1 | 45 | |
| 34 | TwoLaneHwy | Passing Constrained | 1 | 1,170 | 0.2216 | NA | 1 | 45 | |
| 35 | Kenwood Dr | TwoLaneHwy | PassingZone | 1 | 1,264 | 0.2394 | NA | 1 | 45 |
| 36 | Kenwood Dr - Woods Dr | TwoLaneHwy | Passing Constrained | 1 | 970 | 0.1837 | NA | 1 | 45 |
| 37 | Woods Dr - PSL Decrease (45 to 40) | TwoLaneHwy | PassingZone | 1 | 1,497 | 0.2835 | NA | 1 | 45 |
| 38 | Magnolia Springs Rd | TwoLaneHwy | Passing Constrained | 1 | 1,590 | 0.3011 | NA | 1 | 40 |
| 39 | Magnolia Springs Rd - Hwy 31 W | MultilaneHwy | — | 2 | 3,452 | 0.6538 | Level | NA | 40 |
| 40 | Hwy 31 W | SigIntersection | — | 2 | 425 | 0.0805 | NA | NA | 40 |
| 41 | Hwy 31 W - I-65 (End Point) | MultilaneHwy | — | 2 | 1,628 | 0.3083 | Level | NA | 40 |
PSL = posted speed limit.
Table 17.2. Terrain changes for Tennessee SR-109 study route.
| Segment Range | Terrain | Approximate Starting Location |
|---|---|---|
| 1-2 | Level | Start of route |
| 3-8 | Rolling | Ryan Rd |
| 9-11 | Level | Long Hollow Pike on-ramp |
| 12-18 | Rolling | Albert Gallatin Ave |
| 19-20 | Level | Hollis Chapel Rd End |
| 21-23 | Rolling | Boiling Spring Rd |
| 24-41 | Level | SR-76 intersection |
Discussion
Although there are not many changes to the number of lanes along this route, there are a relatively high number of segments because of changes in posted speed limit, terrain, signalized intersections, locations where significant changes in traffic volume occur (such as interchanges), and several changes in passing restrictions along the two-lane highway portion of the route.
Segments 17 and 18 are relatively short, 847 ft and 1,182 ft, respectively. This is to accommodate changes in demand volumes. The intersections separating these segments provide separate left-turn bays.
The intersection at Kirby Dr (36°36’13.10”N, 86°32’13.06”W) is within a stretch of a two-lane highway. Starting 645 ft upstream of the stop bar, the centerline striping changes from dashed yellow to solid yellow. Likewise, the solid yellow striping continues for 755 ft downstream of the intersection area before changing to dashed yellow. These three distances, 645 ft (upstream approach), 115 ft (intersection area), and 755 ft (downstream approach), are combined to represent the signalized intersection segment. If the directly adjacent upstream and downstream distances corresponding to the dashed yellow striping were coded as separate passing constrained segments, these segments would be assigned a negative adjusted length because the calculated upstream and downstream influence area distances would exceed these passing constrained distances.
A posted speed limit (PSL) reduction (45 to 40 mi/h) occurs in Segment 38. Normally, a new segment would be started at the point of a PSL change; however, the passing zone from this point only continues for approximately 310 ft before changing to a passing constrained zone. Thus, this additional 310 ft of passing zone is included as part of Segment 38. From a practical perspective, drivers would treat this continuation of the passing zone beyond the PSL as part of the same stretch of passing zone upstream of the PSL change.
The arterial segment (29) ends at Morningside Dr, where two directional travel lanes transition to a single lane. At this point, a two-lane highway passing constrained segment begins. However, the arterial posted speed limit of 30 mi/h continues for approximately 590 ft after the end of the arterial segment before changing to 45 mi/h. Because this is a relatively short distance, this short stretch of passing constrained roadway at 30 mi/h is part of Segment 30, for which the remaining approximately 3,040 ft of passing constrained roadway is signed for a speed limit of 45 mi/h.
Segmentation Through the Town of Portland, Tennessee
The arterial segment through the town of Portland consists of the following subsegments (see Table 17.3):
Table 17.3. Subsegments of the arterial segment through the town of Portland.
| # | Cross Street Boundaries | # Directional Lanes | Length (ft) | Cross Street Width | Posted Speed (mi/h) |
|---|---|---|---|---|---|
| 1 | SR-52 - Market St | 2 | 1,065 | 75 | 30 |
| 2 | Market St - McGlothin St | 2 | 600 | 105 | 30 |
| 3 | McGlothin St - College St | 2 | 315 | 130 | 30 |
| 4 | College St - Morningside Dr | 2 | 3,055 | 60 | 30 |
Traffic Data
Traffic data were obtained from the Tennessee DOT Transportation Data Management System.
There are nine sensor locations along highway limits for the LOS analysis, as summarized in Table 17.4. Note that detectors are listed in order of northernmost to southernmost location along the route.
Table 17.5 summarizes the most recently available values for AADT, percentage of traffic volume occurring in the peak hour of the day (K), and percentage of traffic volume traveling in the peak direction of the peak hour (D). The values shown in this table are for the most recent years for which actual field measurements were taken, not values estimated from growth projections.
The PM peak hour volumes generally occurred between the hours of 4:00 and 6:00 PM, with the highest hour typically being 5:00 to 6:00 PM. Again, the values shown are generally based on the most recent field measurements. If multiple measurements were taken during a given year, common dates across detectors were selected if possible. For example, if one sensor had counts taken during May and September of a given year and another sensor had counts taken during just May of the same year, the counts for May would be selected for both sensors. Furthermore, if multiple days of data were available in the same month of the same year, the same day of the week would be chosen across the sensors if possible.
The PHF values range from approximately 0.87 to 0.96. A single PHF value is used because specific traffic peaking times will likely vary over a route of this length as well as not to over-complicate the process of conserving vehicles throughout the full length of the route when setting traffic demand values. For this analysis, an approximate mid-range value of 0.91 is used. Consequently, this value effectively increases the demand flow rate for analysis purposes by 10%. The original PM peak hour volumes and corresponding values as adjusted by the PHF (rounded to the nearest 50 vehicles) are shown in Table 17.6. The PHF values are then set to a value of 1.0 in the input data settings.
With a total of nine sensor locations spatially distributed across 22 miles of highway, determining locations to affect volume changes along the route is a very approximate process. To inform this process, satellite photography of the route and its surrounding area was reviewed. More major intersecting roadways—indicated by number of lanes, turning movement accommodation from the major roadway, and/or density of land use accessed by intersecting road within immediate area—were typically chosen as the locations to implement the volume changes.
For two-lane highway segments, the opposing direction volume is needed. Based on Detector 83000133 (in Segment 34), the one sensor within the two-lane highway portion of the route,
Table 17.4. SR-109 sensor locations.
| Location ID | Location Description | Approx. Location | Sensor Type |
|---|---|---|---|
| 83000133 | SR109 North Portland | 36.60000902671167, -86.53358761270735 | Axle/Tube |
| 83000189 | SR109 Portland | 36.579966780040124, -86.51573967563627 | Axle/Tube |
| 83000018 | SR109 Portland | 36.564557580338835, -86.51077679030027 | ATR Class |
| 83000268 | SR109 SR-109 | 36.52242136573732, -86.5098920651874 | Axle/Tube |
| 83000267 | SR109 SR-109 | 36.47830136284571, -86.4773957598811 | Axle/Tube |
| 83000197 | SR109 Gallatin | 36.412250456982775, -86.47193224334912 | Axle/Tube |
| 83000196 | SR109 Gallatin | 36.393181597974774, -86.47892312861133 | Axle/Tube |
| 83000195 | SR109 Gallatin | 36.38150742324095, -86.47010146756689 | Axle/Tube |
| 83000194 | SR109 Gallatin | 36.36778239584337, -86.45912407493229 | Axle/Tube |
Table 17.5. SR-109 sensor data—K, D, AADT.
| Location ID | Year | K (%) | D (%) | AADT (veh/day) |
|---|---|---|---|---|
| 83000133 | 2022 | 8 | 65 | 15,415 |
| 83000189 | 2022 | 8 | 54 | 19,423 |
| 83000018 | 2022 | 9 | 50 | 15,956 |
| 83000268 | 2020 | 10 | 57 | 10,990 |
| 83000267 | 2021 | 9 | 57 | 14,719 |
| 83000197 | 2022 | 9 | 58 | 19,048 |
| 83000196 | 2022 | 9 | 57 | 25,048 |
| 83000195 | 2022 | 9 | 58 | 34,979 |
| 83000194 | 2021 | 8 | 63 | 25,734 |
Table 17.6. SR-109 sensor data—northbound PM peak hourly volumes.
| Location ID | Count Date | Hourly Volume (veh/h) |
Adjusted Hourly Volume (veh/h) |
|---|---|---|---|
| 83000133 | Mon 5/23/2022 | 652* | 700 |
| 83000189 | Wed 6/8/2022 | 826 | 950 |
| 83000018 | Thu 6/9/2022 | 779 | 850 |
| 83000268 | Thu 5/14/2020 | 677 | 750 |
| 83000267 | Thu 5/6/2021 | 906 | 1,000 |
| 83000197 | Wed 5/4/2022 | 1,142 | 1,250 |
| 83000196 | Wed 5/4/2022 | 1,429 | 1,550 |
| 83000195 | Wed 5/4/2022 | 1,887 | 2,050 |
| 83000194 | Wed 5/19/2021 | 909 | 1,000 |
*Data not available, so value imputed based on AADT relationship to adjacent detector.
route, the D factor value of 65% was used to set the opposing direction volume for the PM peak hour; that is, opposing direction volume = peak direction volume/0.65 − peak direction volume (rounded to the nearest 50 vehicles).
The assignment of volumes (rounded to nearest 50 vehicles) to segments, and locations where volume changes are implemented are as follows:
- Sensor 83000194 is located within Segment 2. Its volume of 1,000 veh/h is applied to Segments 1–5.
- Sensor 83000195 is located within Segment 7. There is a net volume increase of 1,050 veh/h at this sensor. This net volume change of +1,000 is implemented by assigning an exit volume of −250 at the Nashville Pike interchange (start of Segment 6) and an entrance volume of +1,300 at the Nashville Pike interchange (start of Segment 7).
- Volume in Segment 6 is 750 veh/h.
- Volume in Segment 7 is 2,050 veh/h.
- Sensor 83000196 is located within Segment 9. There is a net volume decrease of 500 veh/h at this sensor. This net volume change of −500 is implemented by assigning an exit volume of −900 at the Long Hollow Pike interchange (start of Segment 8) and an entrance volume of +400 at the Long Hollow Pike interchange (start of Segment 9).
- Volume in Segment 8 is 1,150 veh/h.
- Volume in Segment 9 is 1,550 veh/h.
- Sensor 83000197 is located within Segment 13. There is a net volume decrease of 300 veh/h at this sensor. This net volume change of −300 is implemented by assuming a net volume change of −100 veh/h at the intersection with Red River Rd (Segment 10), assigning an exit volume of −300 at the Albert Gallatin Ave interchange (start of Segment 12) and an entrance volume of +100 at the Albert Gallatin Ave interchange (start of Segment 13).
- Volume in Segment 10 is 1,450 veh/h.
- Volume in Segment 11 is 1,450 veh/h.
- Volume in Segment 12 is 1,150 veh/h.
- Volume in Segment 13 is 1,250 veh/h.
- Sensor 83000267 is located within Segment 16. There is a net volume decrease of 250 veh/h at this sensor. This net volume change of −250 is implemented by assuming a net volume change of −150 veh/h at the intersection with Old Hwy 109 N/Scotty Parker Rd (start of Segment 15) and a net volume change of −100 veh/h at the intersection with S Tunnel Rd (start of Segment 16).
- Volume in Segment 14 is 1,250 veh/h.
- Volume in Segment 15 is 1,100 veh/h.
- Volume in Segment 16 is 1,000 veh/h.
- Sensor 83000268 is located within Segment 21. There is a net volume decrease of 250 veh/h at this sensor. This net volume change of −250 is implemented by assuming a net volume change of −150 veh/h at the intersection with Roberts Rd (start of Segment 20) and a net volume change of −100 veh/h at the intersection with Boiling Springs Rd (start of Segment 21).
- Volume in Segment 17 is 1,000 veh/h.
- Volume in Segment 18 is 1,000 veh/h.
- Volume in Segment 19 is 850 veh/h.
- Volume in Segment 20 is 850 veh/h.
- Volume in Segment 21 is 750 veh/h.
- Sensor 83000018 is located within Segment 27. There is a net volume increase of 100 veh/h at this sensor. This net volume change of +100 is implemented by assuming a net volume change of +100 veh/h at the intersection with SR-76 intersection (Segment 24).
- Volume in Segment 22 is 750 veh/h.
- Volume in Segment 23 is 750 veh/h.
- Volume in Segment 24 is 750 veh/h.
- Volume in Segment 25 is 850 veh/h.
- Volume in Segment 26 is 850 veh/h.
- Volume in Segment 27 is 850 veh/h.
- Sensor 83000189 is located within Segment 29. There is a net volume increase of 100 veh/h at this sensor. This net volume change of +100 is implemented by assuming a net volume change of +100 veh/h at the intersection with SR-52 intersection (Segment 28).
- Volume in Segment 28 is 850 veh/h.
- Volume in Segment 29 is 950 veh/h.
- Sensor 83000133 is located within Segment 31. There is a net volume decrease of 250 veh/h at this sensor. This net volume change of −250 is implemented by assuming a net volume change of −250 veh/h at the intersection with Freedom Dr (within arterial segment, Segment 29).
- Volume in Segment 30 is 700 veh/h. Opposing direction volume is 400 veh/h.
- Volume in Segment 31 is 700 veh/h. Opposing direction volume is 400 veh/h.
- Volume in Segments 32–41 is 700 veh/h. For Segments 33–38, opposing direction volume is 400 veh/h.
Vehicle classification data are available from five sensor locations (83000133, 83000018, 83000267, 83000196, 83000195). The truck percentages for the hour of 5:00 to 6:00 PM for the northbound direction, rounded to the nearest integer value, and the segments to which they are applied are given in Table 17.7.
Note that for all but the multilane highway segment type, only the total truck percentage is used in the corresponding segment analysis methodology calculations. For multilane highways, the separate percentages for small and large trucks are used when performing an analysis for a segment with a specific grade (i.e., explicit consideration of grade percentage and length of grade). For a segment using the “general terrain” classification (i.e., level, rolling), just the total truck percentage is used.
The Albert Gallatin Ave interchange may not have been open at the time of these volume counts. Satellite photo shows construction vehicles on the connecting road. This interchange probably changed turning volumes at Red River Rd (to the south) and Old Hwy 109 N/Scotty Parker Rd (to the north).
Additional Data Inputs for Intersections
Signalized Intersections. The following is assumed about turning movement volumes from SR-109 onto cross streets:
- 10% total (5% left, 5% right) at intersections with minor roads.
- 20% total (10% left, 10% right) at intersections with major roads.
- If the intersection is not at a location where a net volume difference is implemented (according to this information), then it is assumed that a volume equal to the volume turning from the major roadway enters the major roadway from the cross street.
Table 17.7. SR-109 sensor data—PM peak hour truck percentages.
| Location ID | Date | Small Truck % | Large Truck % | Total Truck % | Applicable Segment(s) |
|---|---|---|---|---|---|
| 83000195 | 4/22/2020 | 2 | 6 | 8 | 1-8 |
| 83000196 | 4/16/2020 | 1 | 3 | 4 | 9-14 |
| 83000267 | 6/9/2022 | 1 | 5 | 6 | 15-23 |
| 83000018 | 6/9/2022 | 1 | 13 | 14 | 24-28 |
| 83000133 | 5/20/2019 | 2 | 7 | 9 | 29-41 |
The route includes isolated signalized intersections at the following cross streets:
- Hancock St.
- Red River Rd.
- SR-76/Fountainhead Rd.
- Longview Rd.
- SR-52.
- Kirby Dr (essentially three-leg).
- Highway 31W.
All these intersections include two through lanes and a left-turn bay for the major street approaches. The major street approaches at the intersections with Hancock St, SR-52, and Highway 31W also include a right-turn bay.
The intersection with Kirby Dr. is, for practical purposes, a three-leg intersection. The eastbound leg just serves as access to a very small business; thus, the traffic volume into and out of this leg of the intersection is negligible for analysis purposes.
The route includes several intersections that are included within the arterial segment (29), which runs through the town of Portland. These intersections are located at the following cross streets:
- Market St.
- McGlothin St.
- College St (three-leg).
All these intersections include two through lanes for the major street approaches. However, none of them include left or right-turn bays.
Specific signal timing data were not available, so the following assumptions were made.
Isolated Intersections
- Cycle length: 90 s.
- Effective green/cycle length ratio: 0.44.
- Arrival type: three (random arrivals).
Arterial intersections (no turn bays)
- Cycle length: 60 s.
- Effective green/cycle length ratio: 0.48 (higher than for isolated intersections because of lack of exclusive left-turn phasing).
- Arrival type: four (favorable progression).
TWSC Intersections.
These locations are typically used as segment breakpoints to allow for a change in traffic volume. However, because it assumed that the major through movement does not incur delay due to any turning vehicles, no specific intersection analysis is required at these locations. For locations where intersection geometry upgrades are necessary because of delay due to turning movements, the reader is referred to some recommended studies given in the appendix.
AWSC Intersections.
No AWSC intersections are present along this route.
Roundabout Intersections.
No roundabout intersections are present along this route.
Results
For multilane highway segments, the BFFS was set per the HCM7 guidance; that is BFFS = posted speed limit (PSL) + 5, for posted speeds ≤ 45 mi/h and BFFS = PSL + 7 for posted speeds > 45 mi/h.
The segment LOS results are shown in Tables 17.8 and 17.9.
Table 17.10 provides the results for the individual subsegments within the arterial segment, again specific to the major street through movement.
The facility LOS results are shown in Table 17.11.
Discussion
The overall facility LOS, based on a score of 1.596, is B. FFS and average threshold delays, 15.5% and 12.3%, respectively, are relatively low. Several large, signalized intersections and the slow speed through the city of Portland are the primary contributors to an average speed of 46 mi/h along this route.
Density values for the multilane highway segments generally range from approximately 7 to 12 veh/mi/ln, with LOS values of A and B. Volume-to-capacity ratios range from approximately
Table 17.8. SR-109 segment LOS analysis results, Part 1.
| Segment ID | Hwy Segment Type | Two-Lane Segment Type | # Directional Lanes | Length (mi) | Effective Length Upstream (mi) | Effective Length Downstream (mi) | Adj. Length (mi) | Posted Speed (mi/h) | Directional Volume (veh/h) | Opposing volume (veh/h) | Peak Hour Factor | Directional Truck % | Analysis Flow Rate (veh/h/ln) | Analysis Flow Rate (pc/h/ln) | Vertical Align Class | Free-Flow Speed (mi/h) | Free-Flow Travel Time (s) | Avg Speed (mi/h) | Avg Travel Time (s) |
|---|---|---|---|---|---|---|---|---|---|---|---|---|---|---|---|---|---|---|---|
| 1 | Multilanehwy | — | 2 | 0.3509000 | — | — | 0.3509 | 55 | 1,000 | — | 1 | 8 | 1,000 | 540 | — | 58.2000 | 21.71 | 58.20 | 21.71 |
| 2 | Multilanehwy | — | 2 | 0.8417000 | — | — | 0.8417 | 55 | 1,000 | — | 1 | 8 | 1,000 | 540 | — | 57.5000 | 52.70 | 57.50 | 52.70 |
| 3 | Multilanehwy | — | 2 | 0.2873000 | — | — | 0.2155 | 55 | 1,000 | — | 1 | 8 | 1,000 | 580 | — | 57.5000 | 13.49 | 57.50 | 13.49 |
| 4 | Sigintersection | — | 2 | 0.1515152 | 0.1475 | 0.2724 | 0.4200 | 55 | 1,000 | — | 1 | 8 | 900 | — | — | 60.5000 | 24.99 | 32.84 | 46.04 |
| 5 | Multilanehwy | — | 2 | 0.4621000 | — | — | 0.2654 | 55 | 1,000 | — | 1 | 8 | 1,000 | 580 | — | 57.5000 | 16.62 | 57.50 | 16.62 |
| 6 | Multilanehwy | — | 2 | 0.1699000 | — | — | 0.1699 | 55 | 750 | — | 1 | 8 | 750 | 435 | — | 57.5000 | 10.64 | 57.50 | 10.64 |
| 7 | Multilanehwy | — | 2 | 0.2708000 | — | — | 0.2708 | 55 | 2,050 | — | 1 | 8 | 2,050 | 1189 | — | 57.5000 | 16.95 | 57.50 | 16.95 |
| 8 | Multilanehwy | — | 2 | 0.4159000 | — | — | 0.4159 | 55 | 1,150 | — | 1 | 8 | 1,150 | 667 | — | 57.5000 | 26.04 | 57.50 | 26.04 |
| 9 | Multilanehwy | — | 2 | 0.6256000 | — | — | 0.5065 | 55 | 1,550 | — | 1 | 4 | 1,550 | 806 | — | 57.5000 | 31.71 | 57.50 | 31.71 |
| 10 | Sigintersection | — | 2 | 0.0568182 | 0.1475 | 0.267 | 0.4145 | 55 | 1,450 | — | 1 | 4 | 1,378 | — | — | 60.5000 | 24.66 | 27.31 | 54.64 |
| 11 | Multilanehwy | — | 2 | 0.6381000 | — | — | 0.3996 | 55 | 1,450 | — | 1 | 4 | 1,450 | 754 | — | 57.5000 | 25.02 | 57.50 | 25.02 |
| 12 | Multilanehwy | — | 2 | 0.3021000 | — | — | 0.3021 | 55 | 1,150 | — | 1 | 4 | 1,150 | 621 | — | 57.5000 | 18.91 | 57.50 | 18.91 |
| 13 | Multilanehwy | — | 2 | 1.0184000 | — | — | 1.0184 | 55 | 1,250 | — | 1 | 4 | 1,250 | 675 | — | 57.5000 | 63.76 | 57.50 | 63.76 |
| 14 | Multilanehwy | — | 2 | 0.2538000 | — | — | 0.2538 | 55 | 1,250 | — | 1 | 4 | 1,250 | 675 | — | 57.5000 | 15.89 | 57.50 | 15.89 |
| 15 | Multilanehwy | — | 2 | 3.1742000 | — | — | 3.1742 | 55 | 1,100 | — | 1 | 6 | 1,100 | 616 | — | 57.5000 | 198.73 | 57.50 | 198.73 |
| 16 | Multilanehwy | — | 2 | 1.5483000 | — | — | 1.5483 | 55 | 1,000 | — | 1 | 6 | 1,000 | 560 | — | 57.5000 | 96.94 | 57.50 | 96.94 |
| 17 | Multilanehwy | — | 2 | 0.1604000 | — | — | 0.1604 | 55 | 1,000 | — | 1 | 6 | 1,000 | 560 | — | 57.5000 | 10.04 | 57.50 | 10.04 |
| 18 | Multilanehwy | — | 2 | 0.2239000 | — | — | 0.2239 | 55 | 1,000 | — | 1 | 6 | 1,000 | 560 | — | 57.5000 | 14.02 | 57.50 | 14.02 |
| 19 | Multilanehwy | — | 2 | 0.4034000 | — | — | 0.4034 | 55 | 850 | — | 1 | 6 | 850 | 450.5 | — | 57.5000 | 25.26 | 57.50 | 25.26 |
| 20 | Multilanehwy | — | 2 | 1.5398000 | — | — | 1.5398 | 55 | 850 | — | 1 | 6 | 850 | 450.5 | — | 57.5000 | 96.40 | 57.50 | 96.40 |
| 21 | Multilanehwy | — | 2 | 0.6638000 | — | — | 0.6638 | 55 | 750 | — | 1 | 6 | 750 | 420 | — | 57.5000 | 41.56 | 57.50 | 41.56 |
| 22 | Multilanehwy | — | 2 | 1.0502000 | — | — | 1.0502 | 55 | 750 | — | 1 | 6 | 750 | 420 | — | 57.5000 | 65.75 | 57.50 | 65.75 |
| 23 | Multilanehwy | — | 2 | 0.5455000 | — | — | 0.4663 | 45 | 750 | — | 1 | 6 | 750 | 420 | — | 49.5000 | 33.92 | 49.50 | 33.92 |
| 24 | Sigintersection | — | 2 | 0.0568182 | 0.1076 | 0.1894 | 0.2969 | 45 | 750 | — | 1 | 14 | 712 | — | — | 49.5000 | 21.60 | 26.02 | 41.07 |
| 25 | Multilanehwy | — | 2 | 0.7652000 | — | — | 0.5251 | 45 | 850 | — | 1 | 14 | 850 | 484.5 | — | 49.5000 | 38.19 | 49.50 | 38.19 |
| 26 | Sigintersection | — | 2 | 0.2651515 | 0.1076 | 0.1894 | 0.2969 | 45 | 850 | — | 1 | 14 | 807 | — | — | 49.5000 | 21.60 | 25.33 | 42.21 |
| 27 | Multilanehwy | — | 2 | 1.0824000 | — | — | 1.0782 | 45 | 850 | — | 1 | 14 | 850 | 484.5 | — | 49.5000 | 78.42 | 49.50 | 78.42 |
| 28 | Sigintersection | — | 2 | 0.0426136 | 0.0942 | 0.0489 | 0.1431 | 45 | 850 | — | 1 | 14 | 807 | — | — | 49.5000 | 10.40 | 16.60 | 31.01 |
| 29 | Arterial | — | 2 | 1.0236742 | 0 | 0 | 0.9748 | 30 | 800 | — | 1 | 9 | 950 | — | — | 37.3300 | 98.72 | 25.21 | 146.16 |
| 30 | Twolanehwy | Passingconstrained | 1 | 0.6881000 | — | — | 0.6881 | 45 | 700 | 400 | 1 | 9 | 700 | — | 1 | 51.0003 | 48.57 | 48.33 | 51.26 |
| 31 | Twolanehwy | Passingzone | 1 | 0.4337000 | — | — | 0.3980 | 45 | 700 | 400 | 1 | 9 | 700 | — | 1 | 51.0003 | 28.10 | 48.60 | 29.48 |
| 32 | Sigintersection | — | 1 | 0.2869318 | 0.1578 | 0.2016 | 0.3594 | 45 | 700 | — | 1 | 9 | 700 | — | — | 49.5000 | 26.14 | 17.66 | 73.26 |
| 33 | Twolanehwy | Passingzone | 1 | 0.3152000 | — | — | 0.2784 | 45 | 700 | 400 | 1 | 9 | 700 | — | 1 | 51.0003 | 19.65 | 48.61 | 20.62 |
| 34 | Twolanehwy | Passingconstrained | 1 | 0.2216000 | — | — | 0.2216 | 45 | 700 | 400 | 1 | 9 | 700 | — | 1 | 51.0003 | 15.64 | 48.36 | 16.50 |
| 35 | Twolanehwy | Passingzone | 1 | 0.2394000 | — | — | 0.2394 | 45 | 700 | 400 | 1 | 9 | 700 | — | 1 | 51.0003 | 16.90 | 48.61 | 17.73 |
| 36 | Twolanehwy | Passingconstrained | 1 | 0.1837000 | — | — | 0.1837 | 45 | 700 | 400 | 1 | 9 | 700 | — | 1 | 51.0003 | 12.97 | 48.36 | 13.68 |
| 37 | Twolanehwy | Passingzone | 1 | 0.2835000 | — | — | 0.2835 | 45 | 700 | 400 | 1 | 9 | 700 | — | 1 | 51.0003 | 20.01 | 48.61 | 21.00 |
| 38 | Twolanehwy | Passingconstrained | 1 | 0.3011000 | — | — | 0.3011 | 40 | 700 | 400 | 1 | 9 | 700 | — | 1 | 45.3003 | 23.93 | 42.90 | 25.27 |
| 39 | Multilanehwy | — | 2 | 0.6538000 | — | — | 0.6059 | 40 | 700 | — | 1 | 9 | 700 | 381.5 | — | 44.5000 | 49.02 | 44.50 | 49.02 |
| 40 | Sigintersection | — | 2 | 0.0804924 | 0.0858 | 0.1255 | 0.2113 | 40 | 700 | — | 1 | 9 | 665 | — | — | 44.0000 | 17.28 | 21.22 | 35.84 |
| 41 | Multilanehwy | — | 2 | 0.3083000 | — | — | 0.2255 | 40 | 700 | — | 1 | 9 | 700 | 381.5 | — | 44.5000 | 18.24 | 44.50 | 18.24 |
Table 17.9. SR-109 segment LOS analysis results, Part 2.
| Segment ID | % Followers | Density (pc/mi/ln) | Density (veh/mi/ln) | Follower Density (veh/mi/ln) | Adj. Follower Density (veh/mi/ln) | Avg. Threshold Delay (s/veh) | Avg. Threshold Delay (%) | Avg. Free-Flow Speed Delay (s/veh) | Avg. Free-Flow Speed Delay (%) | LOS | LOS Value | Demand/Capacity | Available Capacity (veh/h) | Momentum (vol x speed) | Vehicle Miles Traveled | Vehicle Hours Traveled | Vehicle Hours of Delay |
|---|---|---|---|---|---|---|---|---|---|---|---|---|---|---|---|---|---|
| 1 | — | 9.3 | — | — | — | 0.0 | 0.0 | 0.0 | 0.0 | A | 0.84 | 0.250 | 3,007 | 58,200.0 | 350.9 | 6.03 | 0.000 |
| 2 | — | 9.4 | — | — | — | 0.0 | 0.0 | 0.0 | 0.0 | A | 0.85 | 0.251 | 2,981 | 57,500.0 | 841.7 | 14.64 | 0.000 |
| 3 | — | 10.1 | — | — | — | 0.0 | 0.0 | 0.0 | 0.0 | A | 0.92 | 0.270 | 2,707 | 57,500.0 | 215.5 | 3.75 | 0.000 |
| 4 | — | — | — | — | — | 18.6 | 67.5 | 21.1 | 84.2 | C | 2.07 | 0.600 | 589 | 29,554.1 | 378.0 | 11.51 | 5.263 |
| 5 | — | 10.1 | — | — | — | 0.0 | 0.0 | 0.0 | 0.0 | A | 0.92 | 0.270 | 2,707 | 57,500.0 | 265.4 | 4.62 | 0.000 |
| 6 | — | 7.6 | — | — | — | 0.0 | 0.0 | 0.0 | 0.0 | A | 0.69 | 0.202 | 2,957 | 43,125.0 | 127.4 | 2.22 | 0.000 |
| 7 | — | 20.7 | — | — | — | 0.0 | 0.0 | 0.0 | 0.0 | C | 2.33 | 0.553 | 1,657 | 117,875.0 | 555.1 | 9.65 | 0.000 |
| 8 | — | 11.6 | — | — | — | 0.0 | 0.0 | 0.0 | 0.0 | B | 1.09 | 0.310 | 2,557 | 66,125.0 | 478.3 | 8.32 | 0.000 |
| 9 | — | 14 | — | — | — | 0.0 | 0.0 | 0.0 | 0.0 | B | 1.43 | 0.375 | 2,585 | 89,125.0 | 785.0 | 13.65 | 0.000 |
| 10 | — | — | — | — | — | 27.5 | 101.4 | 30.0 | 121.5 | C | 2.66 | 0.870 | 199 | 37,635.2 | 571.2 | 20.91 | 11.472 |
| 11 | — | 13.1 | — | — | — | 0.0 | 0.0 | 0.0 | 0.0 | B | 1.30 | 0.351 | 2,685 | 83,375.0 | 579.4 | 10.08 | 0.000 |
| 12 | — | 10.8 | — | — | — | 0.0 | 0.0 | 0.0 | 0.0 | A | 0.98 | 0.289 | 2,831 | 66,125.0 | 347.4 | 6.04 | 0.000 |
| 13 | — | 11.7 | — | — | — | 0.0 | 0.0 | 0.0 | 0.0 | B | 1.11 | 0.314 | 2,731 | 71,875.0 | 1273.0 | 22.14 | 0.000 |
| 14 | — | 11.7 | — | — | — | 0.0 | 0.0 | 0.0 | 0.0 | B | 1.11 | 0.314 | 2,731 | 71,875.0 | 317.3 | 5.52 | 0.000 |
| 15 | — | 10.7 | — | — | — | 0.0 | 0.0 | 0.0 | 0.0 | A | 0.97 | 0.287 | 2,739 | 63,250.0 | 3491.6 | 60.72 | 0.000 |
| 16 | — | 9.7 | — | — | — | 0.0 | 0.0 | 0.0 | 0.0 | A | 0.89 | 0.260 | 2,839 | 57,500.0 | 1548.3 | 26.93 | 0.000 |
| 17 | — | 9.7 | — | — | — | 0.0 | 0.0 | 0.0 | 0.0 | A | 0.89 | 0.260 | 2,839 | 57,500.0 | 160.4 | 2.79 | 0.000 |
| 18 | — | 9.7 | — | — | — | 0.0 | 0.0 | 0.0 | 0.0 | A | 0.89 | 0.260 | 2,839 | 57,500.0 | 223.9 | 3.89 | 0.000 |
| 19 | — | 7.8 | — | — | — | 0.0 | 0.0 | 0.0 | 0.0 | A | 0.71 | 0.210 | 3,207 | 48,875.0 | 342.9 | 5.96 | 0.000 |
| 20 | — | 7.8 | — | — | — | 0.0 | 0.0 | 0.0 | 0.0 | A | 0.71 | 0.210 | 3,207 | 48,875.0 | 1308.8 | 22.76 | 0.000 |
| 21 | — | 7.3 | — | — | — | 0.0 | 0.0 | 0.0 | 0.0 | A | 0.66 | 0.195 | 3,089 | 43,125.0 | 497.9 | 8.66 | 0.000 |
| 22 | — | 7.3 | — | — | — | 0.0 | 0.0 | 0.0 | 0.0 | A | 0.66 | 0.195 | 3,089 | 43,125.0 | 787.7 | 13.70 | 0.000 |
| 23 | — | 8.5 | — | — | — | 0.0 | 0.0 | 0.0 | 0.0 | A | 0.77 | 0.211 | 2,804 | 37,125.0 | 349.8 | 7.07 | 0.000 |
| 24 | — | — | — | — | — | 17.3 | 72.9 | 19.5 | 90.2 | B | 1.95 | 0.510 | 692 | 18,529.5 | 211.4 | 8.12 | 3.853 |
| 25 | — | 9.8 | — | — | — | 0.0 | 0.0 | 0.0 | 0.0 | A | 0.89 | 0.243 | 2,641 | 42,075.0 | 446.3 | 9.02 | 0.000 |
| 26 | — | — | — | — | — | 18.5 | 77.7 | 20.6 | 95.4 | C | 2.04 | 0.570 | 597 | 20,439.0 | 239.6 | 9.46 | 4.620 |
| 27 | — | 9.8 | — | — | — | 0.0 | 0.0 | 0.0 | 0.0 | A | 0.89 | 0.243 | 2,641 | 42,075.0 | 916.5 | 18.51 | 0.000 |
| 28 | — | — | — | — | — | 19.6 | 171.0 | 20.6 | 198.1 | C | 2.04 | 0.570 | 597 | 13,399.9 | 115.4 | 6.95 | 4.620 |
| 29 | — | — | — | — | — | 23.3 | 19.0 | 47.4 | 48.1 | 1.46 | 0.000 | 0 | 23,953.4 | 972.5 | 38.57 | 12.518 | |
| 30 | 65.5 | — | 14.5 | 9.5 | 9.5 | 0.0 | 0.0 | 2.7 | 5.5 | C | 2.90 | 0.412 | 1,000 | 33,829.4 | 481.7 | 9.97 | 0.522 |
| 31 | 64.1 | — | 14.4 | 9.2 | 9.2 | 0.0 | 0.0 | 1.4 | 4.9 | C | 2.85 | 0.412 | 1,000 | 34,020.9 | 278.6 | 5.73 | 0.270 |
| 32 | — | — | — | — | — | 44.5 | 154.8 | 47.1 | 180.3 | D | 3.61 | 0.950 | 37 | 12,362.7 | 251.6 | 14.24 | 9.162 |
| 33 | 65 | — | 14.4 | 9.4 | 9.4 | 0.0 | 0.0 | 1.0 | 4.9 | C | 2.87 | 0.412 | 1,000 | 34,026.7 | 194.9 | 4.01 | 0.188 |
| 34 | 67.9 | — | 14.5 | 9.8 | 9.8 | 0.0 | 0.0 | 0.9 | 5.5 | C | 2.97 | 0.412 | 1,000 | 33,848.6 | 155.1 | 3.21 | 0.166 |
| 35 | 65.3 | — | 14.4 | 9.4 | 9.4 | 0.0 | 0.0 | 0.8 | 4.9 | C | 2.88 | 0.412 | 1,000 | 34,028.2 | 167.6 | 3.45 | 0.161 |
| 36 | 67.9 | — | 14.5 | 9.8 | 9.8 | 0.0 | 0.0 | 0.7 | 5.5 | C | 2.97 | 0.412 | 1,000 | 33,848.6 | 128.6 | 2.66 | 0.138 |
| 37 | 64.9 | — | 14.4 | 9.4 | 9.4 | 0.0 | 0.0 | 1.0 | 4.9 | C | 2.87 | 0.412 | 1,000 | 34,026.4 | 198.5 | 4.08 | 0.191 |
| 38 | 68.3 | — | 16.3 | 1.2 | 11.2 | 0.0 | 0.0 | 1.3 | 5.6 | D | 3.23 | 0.412 | 1,000 | 30,030.5 | 210.8 | 4.91 | 0.260 |
| 39 | — | 8.6 | — | — | — | 0.0 | 0.0 | 0.0 | 0.0 | A | 0.78 | 0.202 | 2,768 | 31,150.0 | 424.1 | 9.53 | 0.000 |
| 40 | — | — | — | — | — | 16.8 | 88.5 | 18.6 | 107.3 | B | 1.86 | 0.450 | 820 | 14,111.7 | 140.5 | 6.62 | 3.427 |
| 41 | — | 8.6 | — | — | — | 0.0 | 0.0 | 0.0 | 0.0 | A | 0.78 | 0.202 | 2,768 | 31,150.0 | 157.8 | 3.55 | 0.000 |
Table 17.10. SR-109 arterial segment (29) LOS analysis results.
| # | Cross Street Boundaries | Analysis Flow Rate (veh/h) | Adj. Sat. Flow Rate (veh/h) | v/c | Control Delay (s/veh) |
|---|---|---|---|---|---|
| 1 | SR-52 - Market St | 950 | 2,433 | 0.814 | 11.9 |
| 2 | Market St - McGlothin St | 2,433 | 0.814 | 11.9 | 16.5 |
| 3 | McGlothin St - College St | 2,433 | 0.814 | 11.9 | 11.8 |
| 4 | College St - Morningside Dr | NA | 0.814 | – | 38.4 |
0.2 to 0.5. Density and follower density values for the two-lane highway segments are approximately 14 veh/mi/ln and 10 followers/mi/ln, with LOS values of C. Volume-to-capacity ratios are approximately 0.4.
The highest v/c ratios along the route generally occur at signalized intersection locations. The isolated signalized intersection results are extracted from Tables 17.8 and 17.9 and summarized as follows.
| Segment ID | Control Delay (s/veh) | LOS | v/c |
|---|---|---|---|
| Segment 4 (Hancock St) | 21.1 | C | 0.600 |
| Segment 10 (Red River Rd.) | 30.0 | C | 0.870 |
| Segment 24 (SR-76) | 19.5 | B | 0.510 |
| Segment 26 (Longview Dr) | 22.3 | C | 0.550 |
| Segment 28 (SR-52) | 20.6 | C | 0.570 |
| Segment 32 (Kirby Dr) | 29.3 | C | 0.850 |
| Segment 40 (Hwy 31 W) | 18.6 | B | 0.450 |
v/c = volume-to-capacity ratio.
Additionally, the signalized intersections that are part of the arterial segment that runs through the town of Portland have delays of approximately 12 s/veh and v/c ratios of approximately 0.8
Table 17.11. SR-109 facility analysis results.
| Performance Measure | Value |
|---|---|
| Free-Flow Travel Time (s) | 1,511.1 |
| Avg. Travel Time (s) | 1,745.66 |
| Avg. Speed (mi/h) | 46.17 |
| Vehicle Miles Traveled (veh-mi) | 21,488.24 |
| Vehicle Hours Traveled (veh-h) | 454.152 |
| Delay (veh-h) | 56.833 |
| Avg. Free-Flow Speed Delay (s/veh) | 234.59 |
| Avg. Free-Flow Speed Delay (%) | 15.5 |
| Avg. Threshold Delay (s/veh) | 186.05 |
| Avg. Threshold Delay (%) | 12.3 |
| LOS Score (Weighted Travel Time) | 1.478 |
| LOS Constancy | 0.601 |
| LOS Adjustment Factor | 1.08 |
| LOS Score (Weighted Travel Time and Adjusted) | 1.596 |
| Maximum d/c | 0.95 |
(also shown in Table 17.10). The v/c ratios are relatively high for these intersections because of the lack of exclusive left-turn bays and phasing. However, the control delay values are still relatively low due to the low traffic volumes. It should also be noted that the average speed for McGlothin St–College St is very low, despite relatively low control delay, due to the short link length (315 ft). The average speed for the entire arterial of 25.2 mi/h (LOS B), however, is still very reasonable for a section of roadway with a posted speed limit of 30 mi/h.
It also needs to be noted that this route has some characteristics that currently are not explicitly considered in the HCM7 urban streets analysis methodology. For example, much of this section is without curb and gutter and has essentially continuous frontage of business access. While the through traffic volumes are currently relatively low and the local businesses do not appear to be high traffic generators, should one or both of the traffic demand characteristics increase significantly, the lack of access management along this section of roadway could lead to some operational complications.
Furthermore, if there is any considerable growth in traffic demand in this area, the signalized intersections in the city of Portland will likely need to be upgraded to include left-turn bays.
17.3 Reliability
The reliability analysis examines a 4-mile stretch of SR-109 in the rural town of Gallatin, Tennessee (see Figure 17.13). For the analysis, the facility was divided into nine segments with each segment measuring approximately 0.3–0.6 miles in length.
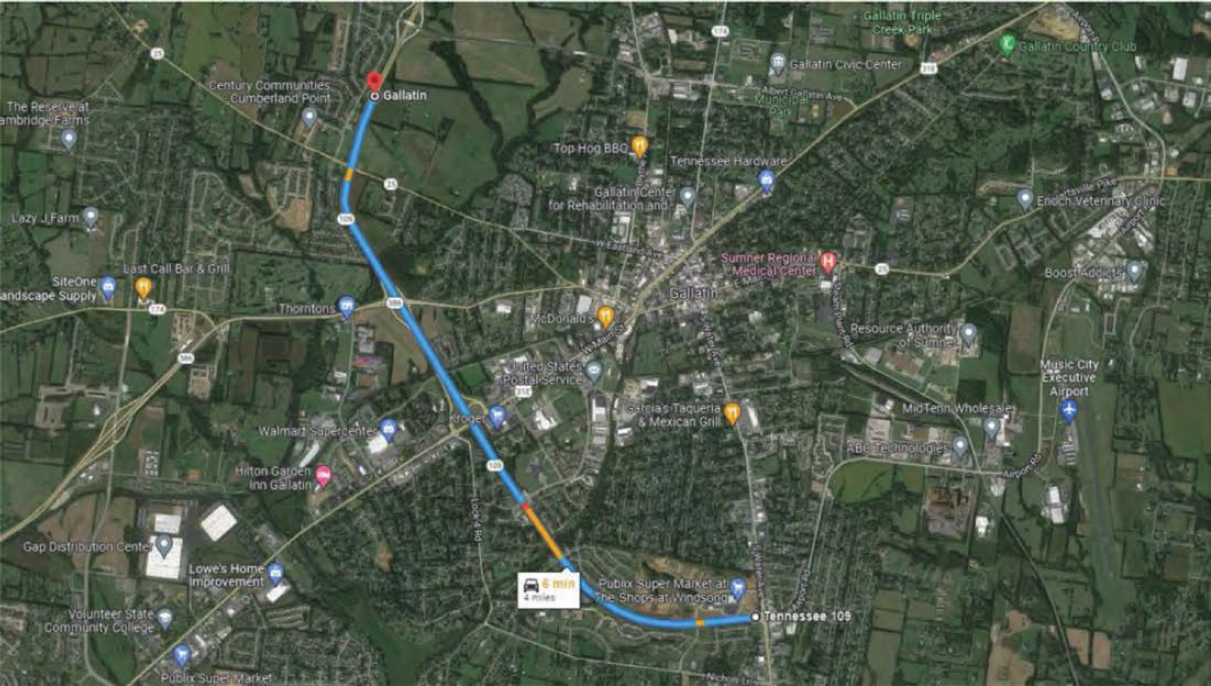
Figure 17.13. Reliability analysis section, through Gallatin, Tennessee, along SR-109.
The facility was evaluated using five data analysis and visualization techniques that convert the raw speed and travel time data into charts and graphics for analysis and interpretation. These methods are described in Section 3.6.
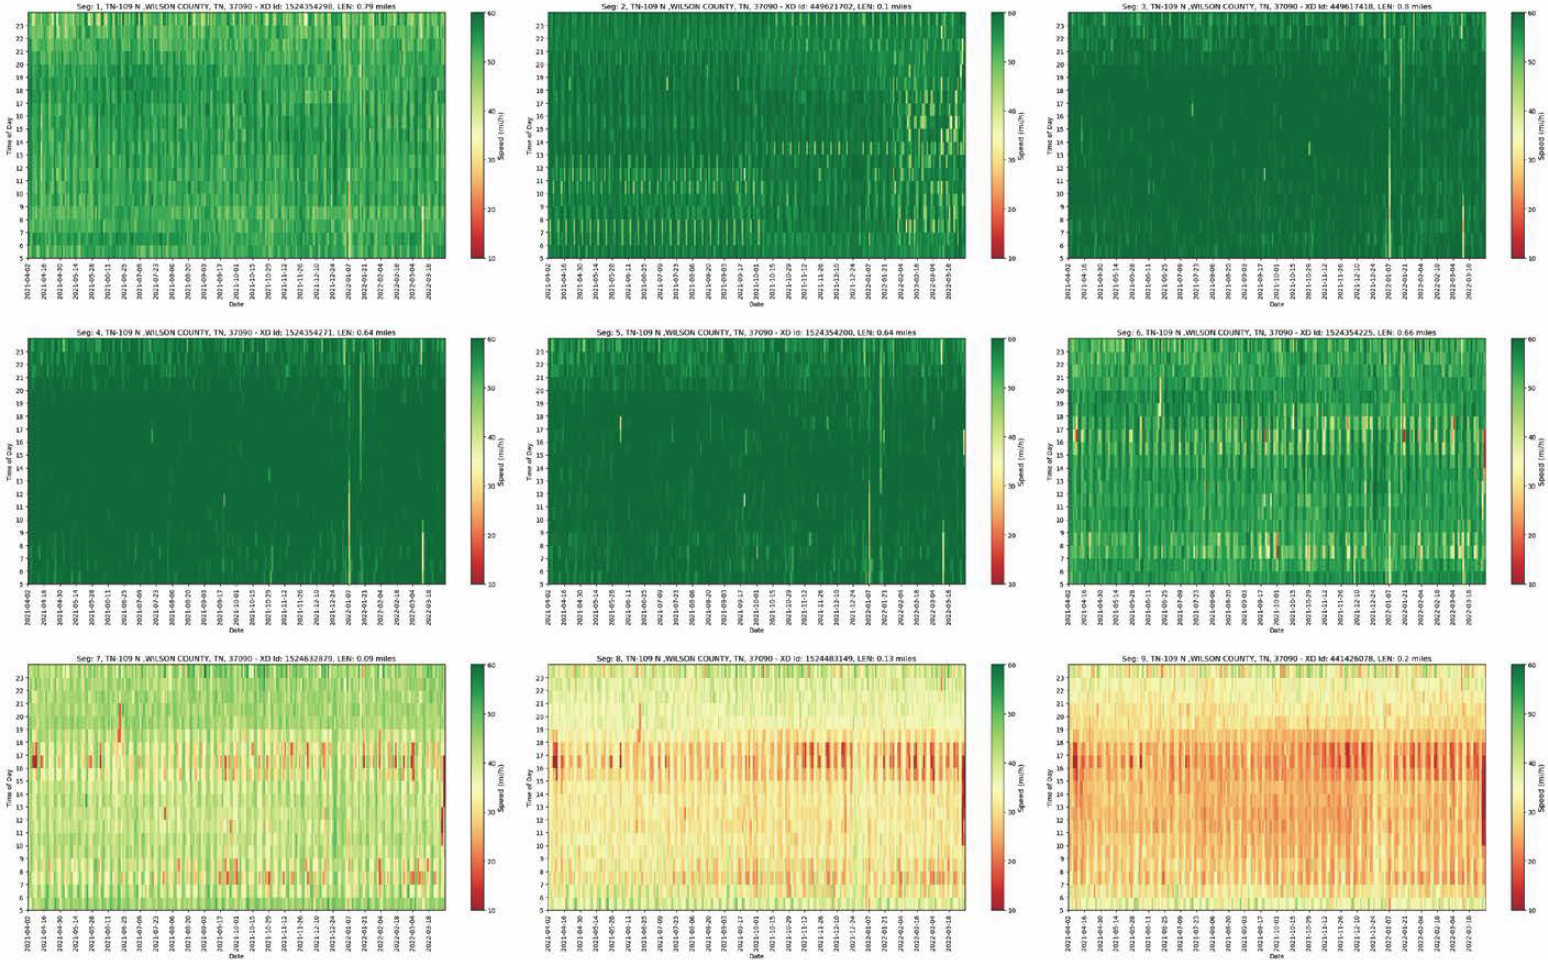
Speed Heatmaps
Speed heatmaps for the Tennessee SR-109 case study are shown in Figure 17.14.
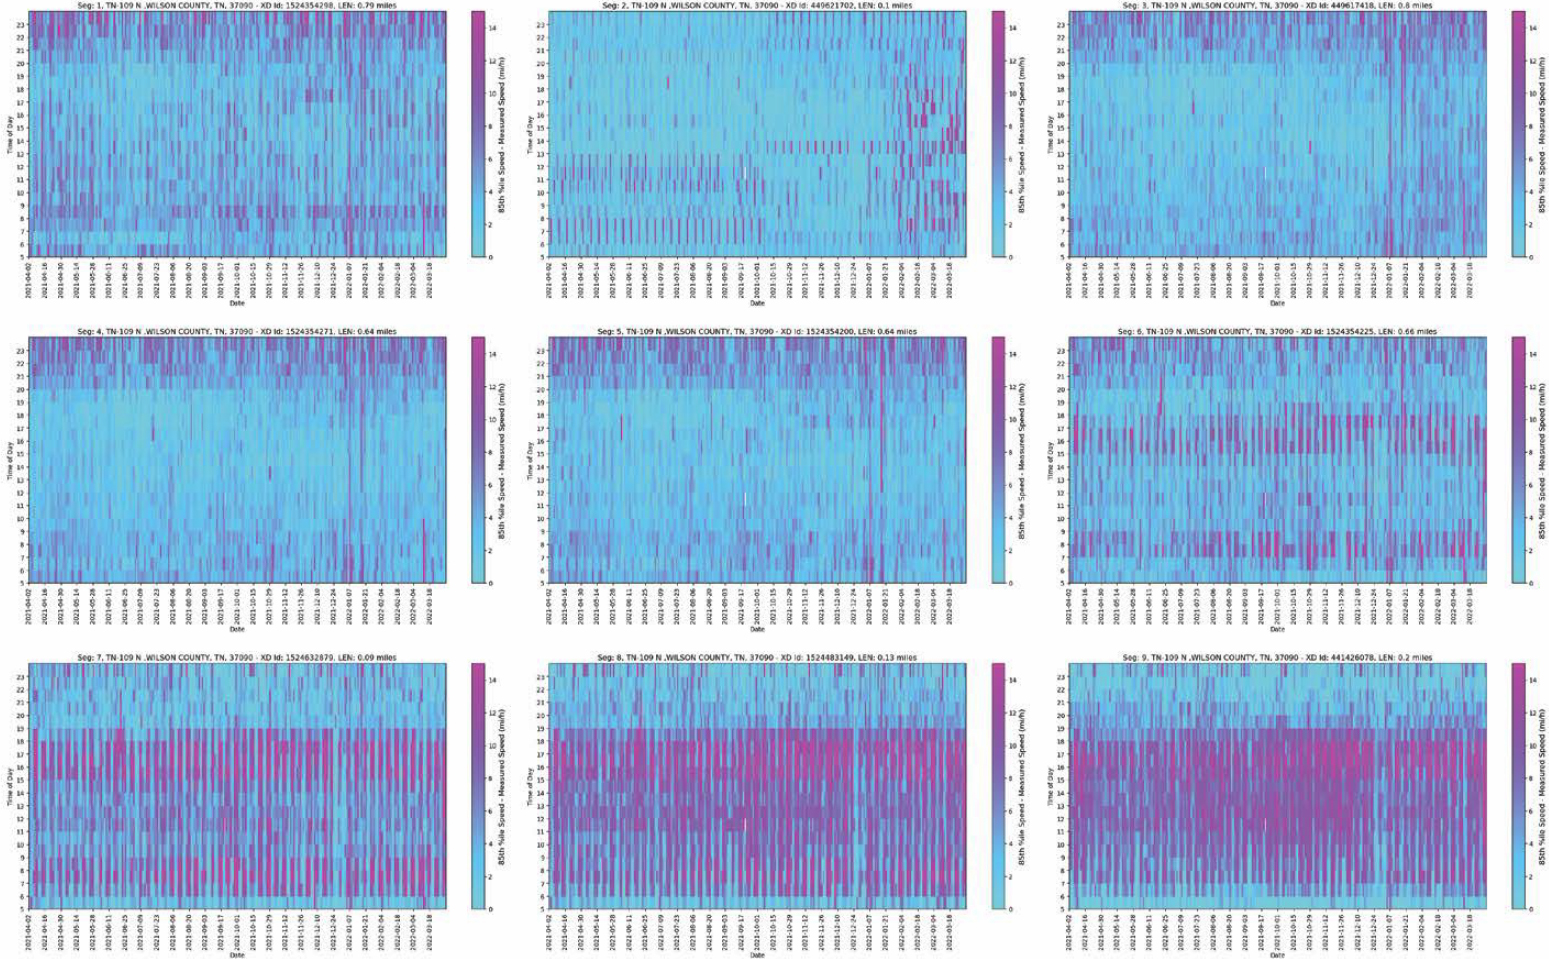
Speed Difference Heatmaps
Speed difference heatmaps for the Tennessee SR-109 case study are shown in Figure 17.15.
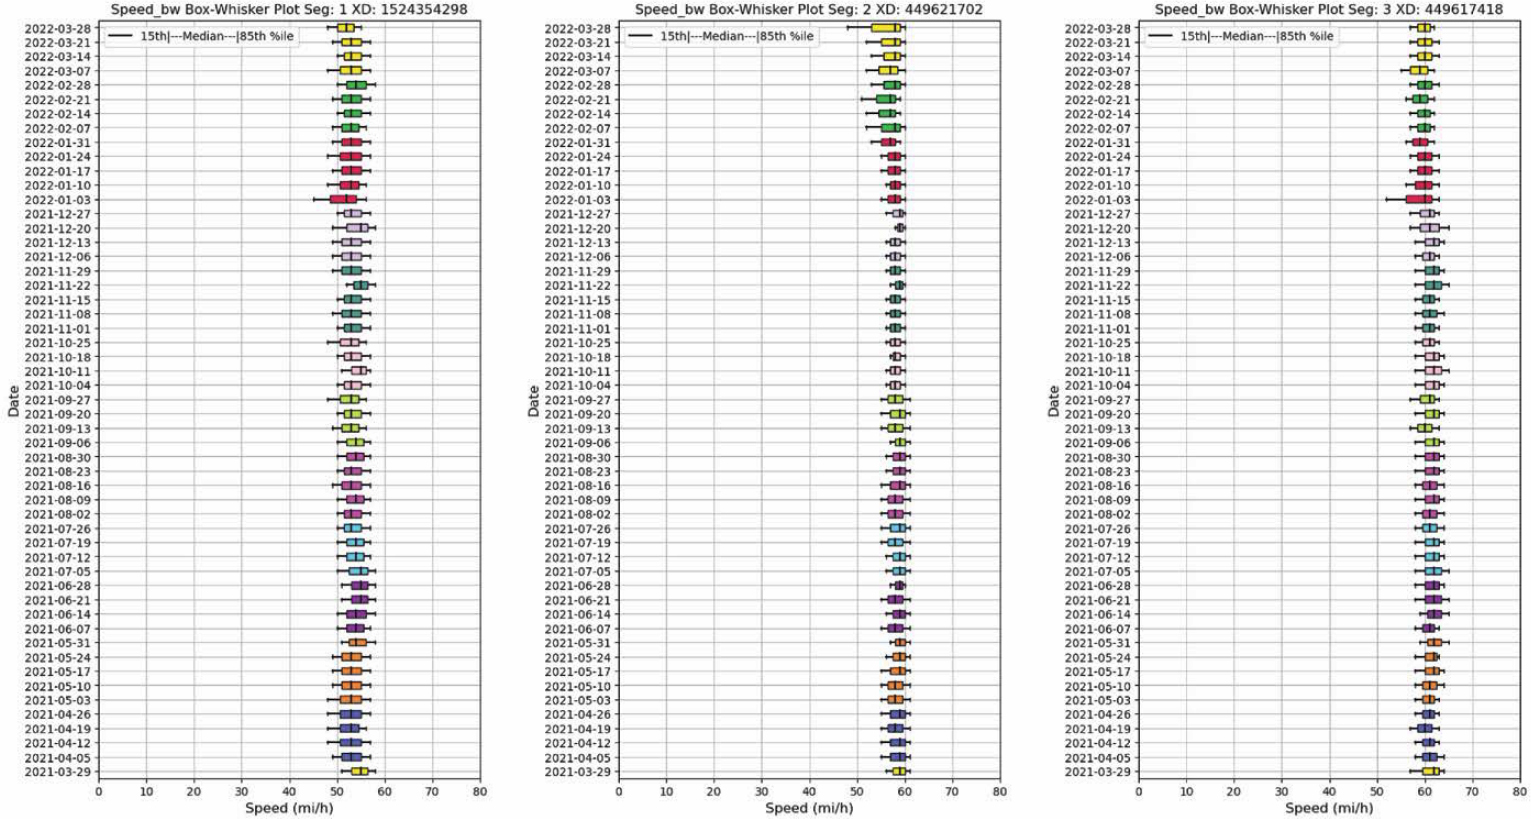
Box-and-Whisker Speed Plots
In the box-and-whisker weekly speed plots shown in Figure 17.16, speed (mi/h) is shown on the x-axis, and time (in weeks) is shown on the y-axis. The chart uses box-and-whisker plots to provide a summary of the weekly speeds for the analysis period.
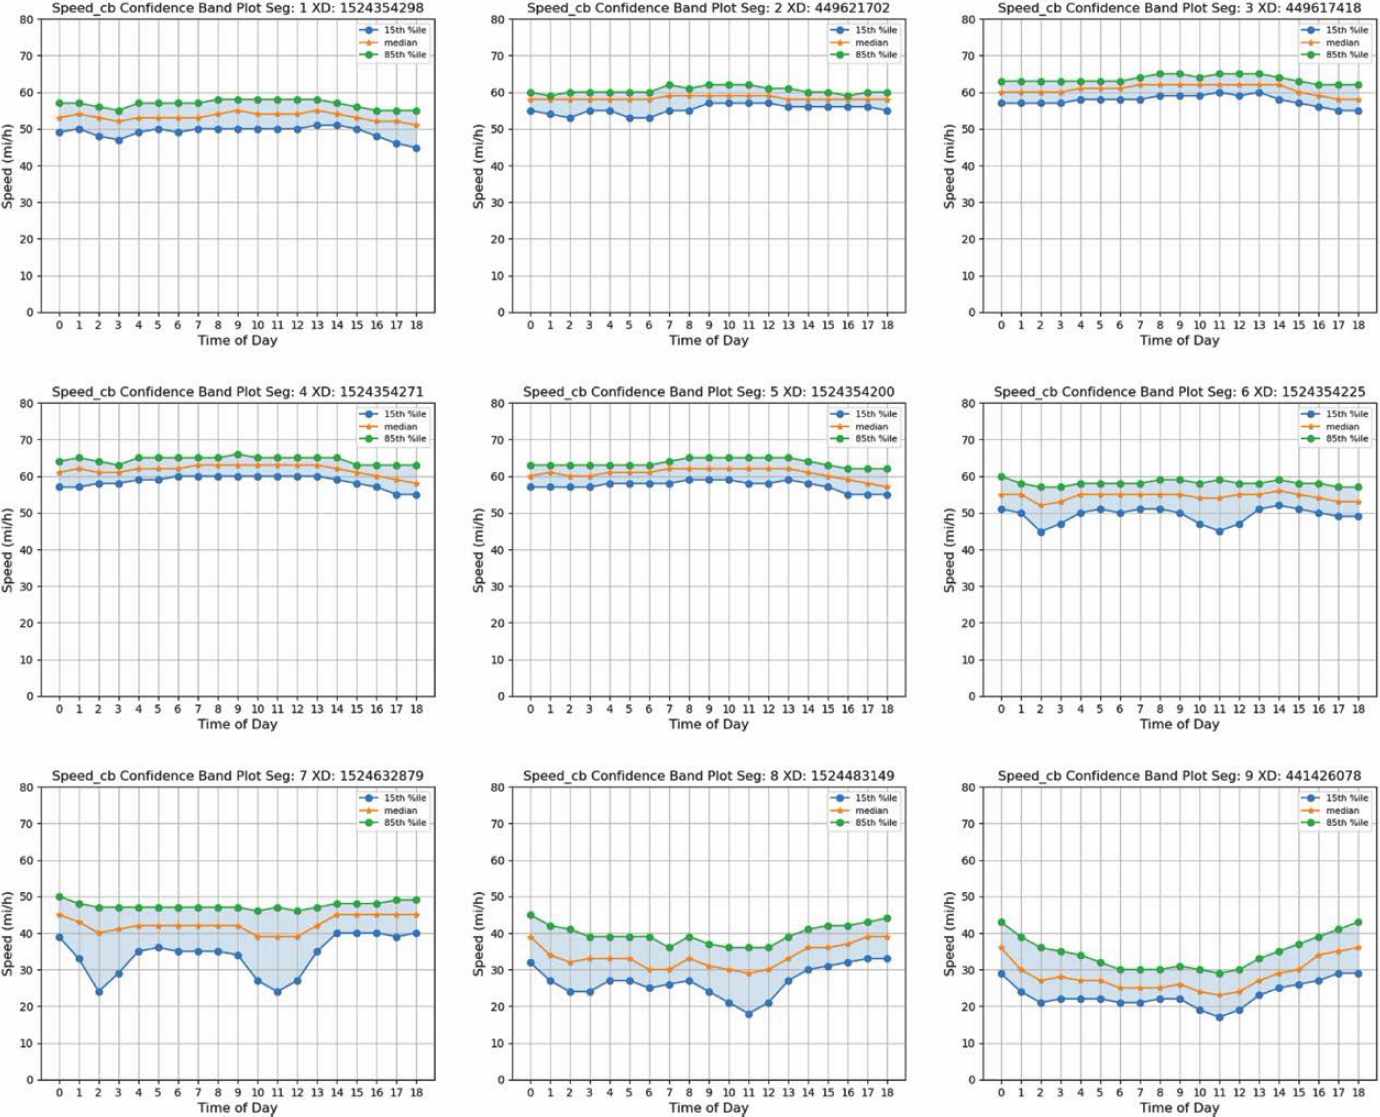
Speed Confidence Band
The speed confidence plots for the Tennessee SR-109 case study are shown in Figure 17.17.
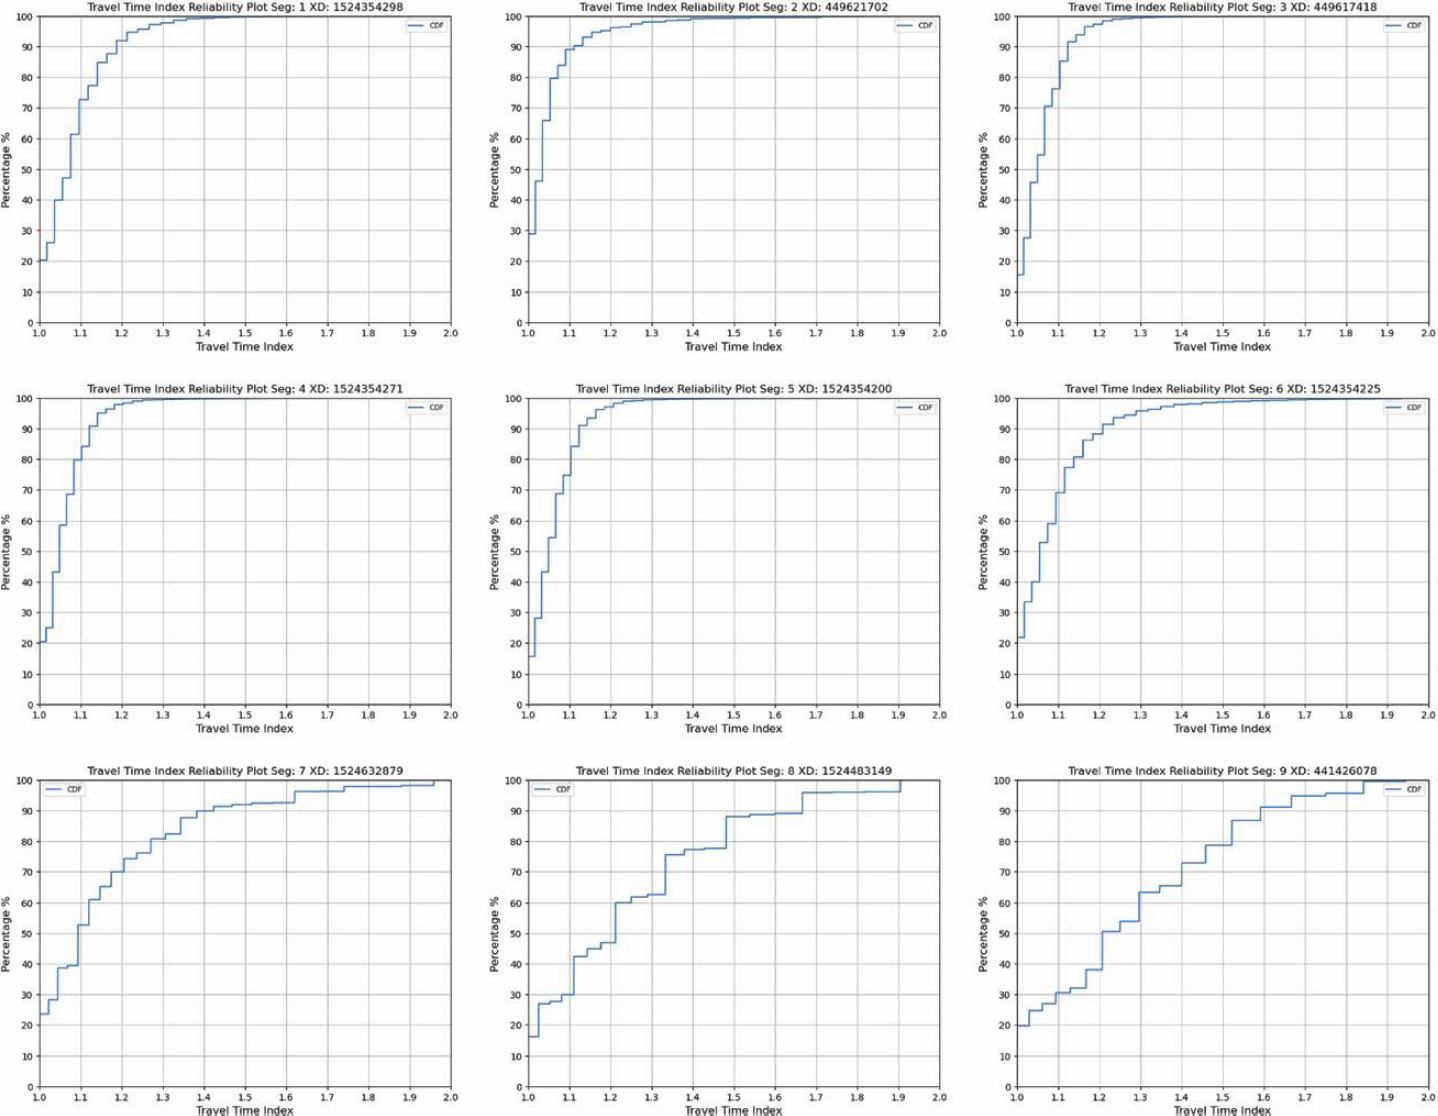
TTI
The TTI plots for the Tennessee SR-109 case study are shown in Figure 17.18.
Summary
This case study presented a data-driven approach to explore travel time reliability on a rural highway in Tennessee (i.e., SR-109) as it traverses the small town of Gallatin, three grade-separated interchanges, and rural areas. Five different visualization techniques were used to derive insights from higher-resolution vehicular probe data from INRIX XD. Segments outside Gallatin generally maintain FFSs in the range of 50–60 mi/h. The interchanges are associated with some of the sharpest slowdowns, particularly in the PM peak period.
Over the analysis year (October 2021–March 2022), this corridor did not experience a major disruption such as a natural disaster or a spike in demand. Seasonal slowdowns were noted over the winter months, from December 2021 through March 2022. These contributed to higher variability in travel times, as evidenced by the higher TTIs.