Reliability and Quality of Service Evaluation Methods for Rural Highways: A Guide (2024)
Chapter: 11 Urban Street Facility Analysis Methodology

CHAPTER 11
Urban Street Facility Analysis Methodology
The urban streets analysis methodology is contained in HCM7 Chapter 16, Urban Street Facilities, and Chapter 18, Urban Street Segments. Chapter 16 describes the aggregation of urban street segments into an urban street facility. Chapter 18 describes the calculation of link performance, namely, running time, and the aggregation of link running time with downstream intersection control delay to arrive at a segment’s average travel time and average speed. Intersection control delay values are obtained from the methodologies described in the individual intersection sections of Part 3 of this report.
11.1 Equations and Exhibits
Methodology Revision
The urban streets analysis methodology contains a model, generally termed the “platoon dispersion model,” to estimate traffic flow progression through a series of closely spaced signalized intersections that are coordinated. This model estimates a departure flow profile from an upstream intersection, the traffic flow progression along the link, and then the arrival flow profile at the downstream intersection. The departure flow profile and resultant arrival flow profile are functions of signal phasing and timing settings and link traffic and roadway characteristics. Ultimately, the arrival flow profile is used to adjust the signalized intersection control delay value, relative to a random traffic arrival pattern.
This platoon dispersion model is input data intensive and computationally intensive. Thus, for an urban street analysis within the context of a rural highway analysis, it is not recommended as the preferred analysis alternative. Instead, it is recommended that the planning-level analysis methodology for urban streets be applied. The primary difference between the planning- and operational-level methodologies is the simplification of the process to account for signal progression quality on signal delay. Instead of the more complex platoon dispersion model, the planning-level analysis makes use of the simplified progression adjustment factor (PF). This is discussed further in the signalized intersection methodology section.
The planning-level analysis methodology is described in Section 5 of Chapter 30, Urban Street Segments: Supplemental, of the HCM7. The motorized vehicle analysis methodology process is given in Exhibit 30-8 (p. 30-31). The specific equation and exhibit numbers used in the
methodology, in the general order in which they are applied, are as follows. This section focuses on the calculation of running speeds along the arterial links between intersections. The delay calculations for the arterial intersections are covered in their respective methodology sections.
The variable definitions for these equations are shown in Section 11.2 Nomenclature.
Step 1: Determine Traffic Demand Adjustments
This step generally involves adjusting traffic demand volumes to reflect capacity constraints, volume balancing, origin-destination distributions, and spillback occurrence.
See HCM7 Chapter 18, Section 3, for more information about this step.
Step 2: Determine Running Time
- Equation 18-3: Estimate base BFFS; uses value from Exhibit 18-11.
Sfo = Scalib + S0 + fCS + fA + fpk (HCM7 Eq. 18-3)
- Exhibit 18-11: BFFS adjustment factors for Equation 18-3.
The values contained in Exhibit 18-11 were generated from the equations shown in the notes section beneath the table. Those equations are shown here.
Speed constant: S0 = 25.6 + 0.47Spl
Adjustment for cross section: fcs = 1.5prm − 0.47pcurb − 3.7pcurb prm
Adjustment for access points: fA = −0.078Da/Nth
Da = 5, 280(Nap,s + Nap,o)/(L − Wi)
Methodology Simplification
To simplify the data collection process, the access point density, Da, can be determined from Exhibit 18-7 (the Suburban/Rural section) rather than counting the number of access points.
- Exhibit 18-7: Default access point density (points/mi) by speed limit (mi/h).
Area Type Median Type 25 30 35 40 45 50 55 Urban Restrictive 62 50 41 35 30 26 22 Urban Other 73 61 52 46 41 37 33 Suburban or rural Restrictive 40 27 19 12 7 3 0 Suburban or rural Other 51 38 30 23 18 14 11 Nap,s and Nap,o are determined from Exhibit 18-7.
Adjustment for on-street parking: fpk = −3.0 × proportion of link length with on-street parking available on the right-hand side (decimal).
- Equation 18-4: Estimate signal spacing adjustment factor; uses result from Equation 18-3.
(HCM7 Eq. 18-4) - Equation 18-5: Estimate FFS; uses result from Equation 18-4.
Sf = Sfo fL ≥ Spl (HCM7 Eq. 18-5)
- Equation 18-6: Estimate proximity adjustment factor; uses result from Equation 18-5.
(HCM7 Eq. 18-6) - Equation 18-7: Estimate segment running time; uses results from Equations 18-6 and 18-8 and Exhibit 18-13 (see the following discussion about this exhibit).
(HCM7 Eq. 18-7)
The dother term is intended to account for a variety of factors that are currently not explicitly accounted for in the analysis methodology. For example, this term can be used to include the effects of mid-segment delay due to on-street parking maneuvers (different from the term used in FFS estimation to account for additional speed friction from the presence of on-street parking), pedestrian crosswalk activity, or impacts from bicycle activity.
- Equation 18-8: Control-type adjustment factor.
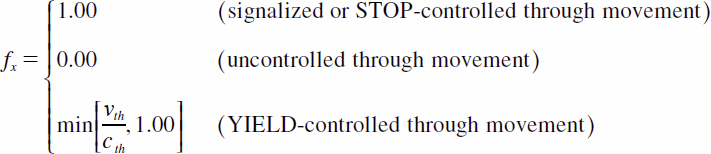
(HCM7 Eq. 18-8)
Methodology Simplification
Equation 18-7 includes a term to account for the delay imposed on through traffic by vehicles turning into access points. A very detailed procedure for estimating the delay due to turning vehicles is provided in Chapter 30, Section 4. The default is to use the values provided in Exhibit 18-13–approximate values considered appropriate for planning and preliminary engineering applications.
- Exhibit 18-13: Through vehicle delay (s/veh/point) by number of through lanes.
Midsegment Volume (veh/h/ln) 1 Lane 2 Lanes 3 Lanes 200 0.04 0.04 0.05 300 0.08 0.08 0.09 400 0.12 0.15 0.15 500 0.18 0.25 0.15 600 0.27 0.41 0.15 700 0.39 0.72 0.15
Step 3: Determine the Proportion Arriving During Green
If the intersection is unsignalized, this step is skipped. If the intersection is signalized, the previous methodology simplification is applied. This calculation is described in Step 8 of the signalized intersection analysis methodology.
Step 4: Determine Signal Phase Duration
If the intersection is unsignalized, this step is skipped. If the intersection is signalized, see Step 6 of the signalized intersection analysis methodology.
Step 5: Determine Through Delay
Calculated per corresponding intersection analysis methodology.
Step 6: Determine Through Stop Rate
This step is not implemented.
Step 7: Determine Travel Speed
- Equation 18-15: Estimate travel speed for the subject direction of travel along the segment; uses results from Equation 18-7 and through delay value from Step 5.
(HCM7 Eq. 18-15)
Step 8: Determine Spatial Stop Rate
This step is not implemented.
Step 9: Determine LOS
- Exhibit 18-1: LOS criteria (motorized vehicle mode); the LOS is determined for the major roadway through movement for the analysis direction.
Travel Speed Threshold by BFFS (mi/h) LOS 55 50 45 40 35 30 25 A >44 >40 >36 >32 >28 >24 >20 B >37 >34 >30 >27 >23 >20 >17 C >28 >25 >23 >20 >18 >15 >13 D >22 >20 >18 >16 >14 >12 >10 E >17 >15 >14 >12 >11 >9 >8 F ≤ 17 ≤ 15 ≤ 14 ≤ 12 ≤ 11 ≤ 9 ≤ 8 If the v/c > 1.0, the LOS is F.
11.2 Nomenclature
| prm = | proportion of link length with restrictive median (decimal). |
| pcurb = | proportion of segment with curb on the right-hand side (decimal). |
| Da = | access point density on segment (points/mi). |
| Nth = | number of through lanes on the segment in the subject direction of travel (ln). |
| Nap,s = | number of access point approaches on the right side in the subject direction of travel (points). |
| Nap,o = | number of access point approaches on the right side in the opposing direction of travel (points). |
| L = | segment length (ft). |
| Wi = | width of signalized intersection (ft). |
Some of the previously mentioned variables may also be used with other equations in the methodology.
| cth = | through-movement capacity (veh/h). |
| dap,i = | delay due to left and right turns from the street into access point intersection i (s/veh). |
| dother = | delay due to other sources along the segment (e.g., curb parking or pedestrians) (s/veh). |
| dt = | through delay (s/veh). |
| fA = | adjustment for access points (mi/h). |
| fCS = | adjustment for cross section (mi/h). |
| fL = | signal spacing adjustment factor. |
| fpk = | adjustment for on-street parking (mi/h). |
| fv = | proximity adjustment factor. |
| fx = | control-type adjustment factor. |
| l1 = | start-up lost time = 2.0 if signalized, 2.5 if STOP or YIELD controlled (s). |
| Ls = | distance between adjacent signalized intersections (ft). |
| Nap = | number of influential access point approaches along the segment = Nap,s + pap,ltNap,o (points). |
| Nth = | number of through lanes on the segment in the subject direction of travel (ln). |
| pap,lt = | proportion of Nap,o that can be accessed by a left turn from the subject direction of travel. |
| S0 = | speed constant (mi/h). |
| Scalib = | base free-flow speed calibration factor (mi/h). |
| Sf = | free-flow speed (mi/h). |
| Sfo = | base free-flow speed (mi/h). |
| Spl = | posted speed limit (mi/h). |
| ST,seg = | travel speed of through vehicles for the segment (mi/h). |
| tR = | segment running time (s). |
| vm = | midsegment demand flow rate (veh/h). |
| vth = | through-demand flow rate (veh/h). |


