Crash Modification Factors for Automated Traffic Signal Performance Measures (2026)
Chapter: 3 Prioritization of Knowledge Gaps
CHAPTER 3
Prioritization of Knowledge Gaps
This chapter identifies and prioritizes the knowledge gaps related to the safety effect of either (a) the use of ATSPM-based signal timing, defined as case A CMFs or (b) individual ATSPM reports, defined as case B CMFs. To achieve these objectives, the following activities were performed by the research team:
- Identify the knowledge gaps,
- Assess data availability and quality, and
- Prioritize the knowledge gaps.
Identify Knowledge Gaps
Findings from the state-of-the-practice review indicated that there are several ATSPM systems and numerous deployments throughout the United States. However, there has been very little research on the safety effects of ATSPMs. At present, there is a knowledge gap both for case A CMFs, as well as for every available ATSPM within case B, largely because no studies have been done to date that attempt to correlate crash data with the use of ATSPM.
For case B CMFs, there seem to be several opportunities to explore the changes in signal timing and their impact on safety based on the input received from the practitioners. However, because there are approximately 30 ATSPM reports that can be utilized by agencies to operate and maintain traffic signals, it was not possible for the research team to develop CMFs for each of the ATSPM metric. Table 7 shows a listing of performance measures compiled mainly from NCHRP Report 954 (Nevers et al., 2020). This report contained a comprehensive review of various performance measures developed from high-resolution data. In addition, two further performance measures are included in the list that were identified in a subsequent report or that were recently developed and incorporated into the open-source ATSPM software. The table also includes the research team’s assessment of the safety relationship for each performance measure based on the state of the practice findings. Performance measures that are shown in bold indicate to have a direct relationship with safety and identified as knowledge gaps for the CMF development.
- Flash status may reveal locations where the intersection goes into flash unexpectedly, which may pose a potential safety problem.
- The number of estimated pedestrian conflicts, revealed by the volume of conflicting vehicular movements, can indicate locations with potential issues in pedestrian service.
- The Yellow and Red Actuations report available in the open-source ATSPM software can reveal locations where vehicles are pushing into yellow and red, directly indicating a potential safety issue. Similarly, estimated numbers of red light running (RLR) occurrences can also be derived from the ATSPM data.
- The longer drivers wait for gaps, the shorter the gap they tend to accept. Left-turn gap analysis can indicate occurrences of limited available gaps for left turn traffic, which may pose a safety issue when the left turn traffic experiences more pressure to execute a turn under short gaps.
Table 7. List of performance measures identified in selected publications.
| Performance Measure Name a | Safety Impact | Source | ||
|---|---|---|---|---|
| Day et al., 2014 | Nevers et al., 2020 | Bassett et al., 2021 | ||
| X | |||
| Direct | X | ||
| X | |||
| X | X | ||
| X | X | X | |
| Indirect | X | X | X |
| Indirect | X | X | X |
| Indirect | X | X | X |
| X | X b | X | |
| Indirect | X | X c | |
| Indirect | X | ||
| X | |||
| Indirect | X | X | X |
| Indirect | X | X | |
| Direct | X | X | |
| Direct | X | X | |
| Direct | X | X | |
| X | X | ||
| Indirect | X | X | X |
| Indirect | X | X | X |
| Indirect | X | ||
| Indirect | X | ||
| Indirect | X | X | |
| Indirect | X | ||
| Indirect | X | X | X |
| X | X | ||
| Direct | X | ||
| Indirect | |||
a – Where parentheses are provided, the name listed represents a collection of similar traffic performance measures. Examples of the actual measures included are listed in the parentheses.
b – Alternative techniques for computing delay include input-output method, HCM delay model with measured volume and green time, maximum vehicle delay, and time to service.
c – Alternative techniques for computing queue length include input-output method, advance detector occupancy, and stop bar detector occupancy.
Several other performance measures have also been reported to have an indirect safety relationship. These relationships are summarized in the following list:
- The effectiveness of capacity allocation is revealed by several performance measures (phase termination; split monitor; split failures). This information can be used to adjust signal timing, reallocating green time among phases. The alleviation of capacity constraints could potentially have an effect on safety. Similarly, some other performance measures can indicate capacity issues related to pedestrian service (pedestrian phase actuation and service; estimated pedestrian delay). Alleviation of long pedestrian delays might have an indirect safety effect.
- Estimated queue length and the oversaturation severity index measures are indicators of excessive queuing, which could potentially have indirect safety effects.
- Several performance measures (19-24) focus on coordination and progression. The improvement of traffic flows along a corridor could potentially have indirect safety effects.
- Preemption details may reveal potential safety issues at intersections with railroad preemption.
- The Timing and Actuation report shows a detailed timeline of detector events relative to the signal state. Such a view could be used to find what might be described as “forensic” details of operation, with potential safety applications.
The next section discusses key findings based on the assessment of data availability and quality with a focus on knowledge gaps. Thereafter, there is a section that presents the research team’s methodology and recommendations for the prioritization of knowledge gaps.
Assess Data Availability and Quality
Data Availability and Quality for Case A CMFs
Agency representatives during the targeted interviews indicated that there are several corridors (e.g., from Georgia DOT, Virginia DOT, Maricopa County, as also discussed later) that are currently operated by ATSPMs and could be utilized for the case A CMF development. Additionally, the research team identified several potential corridors from UDOT based on a review of their logbook that was made available to the team. These corridors included a range of corridor characteristics (e.g., number of lanes, AADT, posted speed limit, number of intersections) and ATSPM system characteristics (e.g., the way ATSPMs are utilized, detection scheme, frequency of timing adjustments using ATSPMs), which would allow predicting facility-level CMFs for a proposed ATSPM-based system as a function of corridor and system characteristics.
For the case A CMF development, the availability (and archival) of the ATSPM data and specific changes made to the signal timing using the ATSPM reports were not as critical. This is because during the case A CMF development, crash data was collected for the “before ATSPMs installed” period and the “after ATSPMs installed” period and the specific signal phasing/timing changes made using the ATSPM reports were not relevant to the CMF development. Instead, the research team only needed data related to corridor characteristics and ATSPM system characteristics, which were generally available.
Regarding crash data, all agencies indicated that crash data is available and ready for use for the CMF development. Additionally, it was stated that the research team can typically go back as far as 10-15 years to extract crash data.
Data Availability and Quality for Case B CMFs
Unlike the case A CMFs, only a limited number of sites were initially provided by agencies to the research team for the case B CMF development. This was partly because most sites (or intersections) either typically use multiple ATSPM reports (e.g., a combination of Split Failure and Purdue Phase Termination) for signal phasing/timing adjustments or agencies made multiple adjustments using the same ATSPM report, which makes the before-and-after analysis challenging. To address this challenge, for the prioritized knowledge gaps that do not have a “clean” before-and-after data, the research team proposed to use a cross-sectional study method to develop the proposed set of CMFs. A description of the study design for each CMF is provided in Chapter 4: Research Approach.
Agencies also indicated certain limitations regarding the archival of the ATSPM data and the amount of data that could be available to the research team during the case B CMF development. Some agencies indicated that they started using the ATSPMs in the last few years, and therefore the ATSPM data would only be limited to that time period. Other agencies mentioned that due to data storage issues, the ATSPM data was archived (e.g., before 2020 data) and accessing this older ATSPM data requires additional coordination with the agency’s IT department. These data limitations were considered in the development of the final study designs for case B CMF development.
For the safety analysis, similar to the case A CMFs discussed above, crash data was available and used by the research team during the case B CMF development.
Prioritized Knowledge Gaps
This section prioritizes the knowledge gaps that were utilized for the case B CMF development. The prioritization focused on knowledge gaps for the case B CMFs. The prioritization process considered the following attributes of each knowledge gap in case B:
- Whether the ATSPM report has a potential safety impact,
- The practitioner’s need and interest in the ATSPM report and the associated CMF based on the usage of ATSPM reports, and
- The availability of high-quality data/sites that can be used to address the research gap, as already discussed above.
Potential Safety Impact of ATSPM Reports
As discussed above, it stands to reason that the availability of some performance measures may have a stronger impact on safety than others, particularly if they directly relate to safety (although not yet demonstrated through formal study). At the same time, other performance measures with an operational focus may have indirect consequences for safety. For example, improving progression may lead to a reduction in the number of rear-end crashes, while a change in turning movement phasing supported by ATSPM data may lead to a reduction in right-angle crashes.
For the initial prioritization of case B CMFs, the research team selected the ATSPM reports that have a potential safety impact. These performance measures are listed in Table 7 and shown as having a “direct” or “indirect” safety impact. Then, other factors were considered in the prioritization process including practitioner interest in the ATSPM reports and the availability of high-quality data/sites, as discussed above.
Practitioner Interest in ATSPM Reports
To better understand the common reports used by agencies and gauge practitioner interest, the research team examined the chart usage statistics available from Utah DOT and Georgia DOT. This information was then used during the prioritization of the knowledge gaps to focus on CMF development for reports (i.e., performance measures) that would likely be of interest to all practitioners.
Figure 3 includes information about chart usage from Utah DOT. Figure 4 includes similar chart usage information from Georgia DOT. These figures show the number of ATSPM reports generated throughout the entirety of 2022.
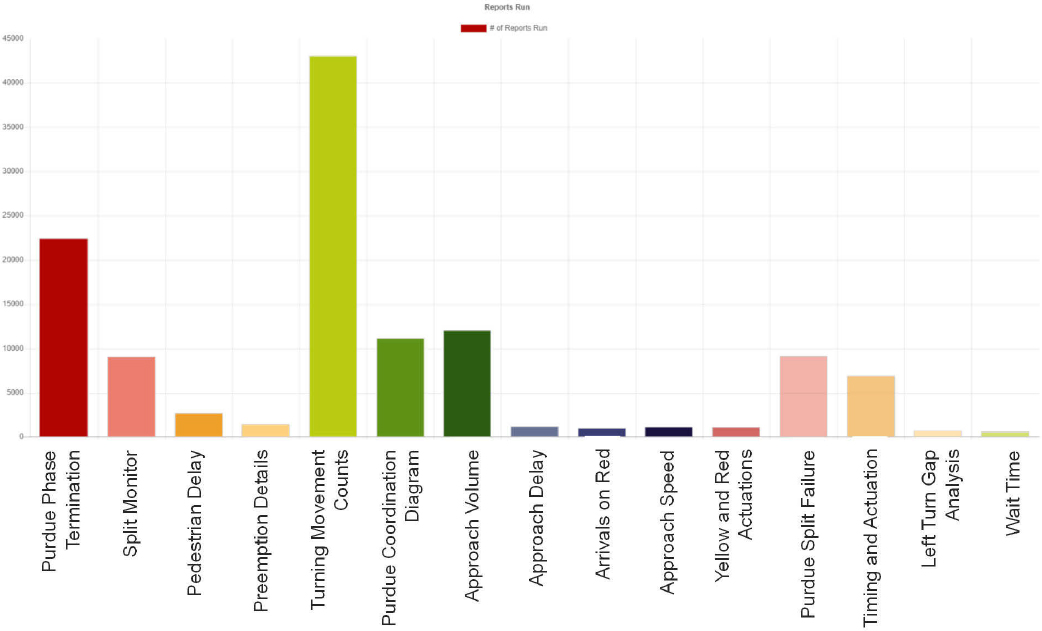

Note that even though limited responses were obtained from the agency survey, as documented in Chapter 2, they also revealed similar findings regarding the chart usage. The observations in the following list were made following a review of this data and the agency responses:
- The Turning Movement Count (TMC) data is the most used report for UDOT and is also widely used for GDOT. This is not surprising, since TMCs are essential for developing signal timing plans. Software utilities for developing such plans are widely used, and these require TMCs as input data. Additionally, TMC data can be expensive to obtain by field observation and TMC data can be used for planning purposes. The approach volume report, which is similar, is also relatively well used for UDOT. While the TMC reports are not relevant in the context of the safety effects of ATSPMs, it would be important to use this data to understand exposure during the safety analysis.
- The Purdue Split Failure report is the most-used report for GDOT, while the Purdue Phase Termination and Split Monitor reports are also extensively used. The Purdue Phase Termination report is the second-most used for UDOT, while the Split Monitor and Purdue Split Failure reports both show a moderately high amount of use. All these metrics support the examination of individual phase performance, indicating the amount of variability in the green time given to the phase (i.e., split monitor), or its outcomes in terms of the prevalence of split failures (i.e., occurrences where the green time is inadequate for the present traffic), or in terms of the termination type (i.e., gap-out versus force-off/max-out). The effects of adjusting the signal timing, such as the adjustment of splits or actuation settings, are revealed by these performance measures. The effects of such adjustments on safety are not known, at least in the context of ATSPM. This knowledge gap should be the highest priority based on the number of reports run in 2022.
- The Purdue Coordination Diagram is the fourth-most used type of report for UDOT, after TMCs, Purdue Phase Termination, and Approach Volume. For GDOT, the Purdue Coordination Diagram is the third-most widely used report. These diagrams show the quality of progression for one signal approach at a time, showing the relationship between vehicle arrivals and the status of the signal where they are arriving. Higher quality progression tends to be associated with a higher number of arrivals on green. Improving coordination is known to benefit safety (Kabir et al., 2021; Yue et al, 2022), but such benefits have not yet been quantified in the context of ATSPMs.
- The Timing and Actuation report (UDOT only in 2022) presents a highly detailed view of the status of detector occupancy versus signal state for individual phases. Because it can show data for any detector input (i.e., both stop bar and setback), the chart is rather general and could be used for many different purposes.
- Pedestrian Delay is used less often than those charts previously mentioned but is more widely used than most of the other reports. This chart shows the amount of time between the moment when a pedestrian button is pushed and when the relevant pedestrian phase receives the walk indication.
- The remaining performance measures shown in the figures are less widely used. This includes some performance measures that may directly relate to safety, such the Yellow and Red Actuations report. This report shows when a detector is actuated relative to the end yellow and red clearance intervals, thus indicating red light running activity. These reports are less widely used and would thus be lower in priority according to the criterion of revealed practitioner interest. However, it is also possible that this report may be more frequently used if it is shown to be helpful in predicting red-light-violation-related crash frequency.
Prioritization of Case B CMFs
Table 8 below shows the ATSPM reports that are identified to have a potential safety impact from Table 7 (i.e., the reports that were classified as having either a direct or indirect safety relationship) and includes an assessment of the attributes used for prioritization. Additionally, the table includes the performance measures that were used for the development of case B CMFs.
| Performance Measure | Safety Impact | Agency Interest | Data Availability | Inclusion in Phase II CMF Development |
|---|---|---|---|---|
| Flash status | Direct | Medium | Low | Maybe |
| Phase termination (gap-out, max-out, force-off frequency) | Indirect | High | High | Yes (combined as one study) |
| Split monitor | ||||
| Split failures (green and red occupancy ratios) | ||||
| Estimated queue length | Indirect | Low | Low | No |
| Oversaturation severity index | Indirect | Low | Low | No |
| Pedestrian phase actuation and service | Indirect | Low | Low | No |
| Estimated pedestrian delay | Indirect | Medium | Medium | No |
| Estimated pedestrian conflicts | Direct | Medium | Low | No |
| Yellow and red actuations | Direct | Medium | Medium | Yes (combined as one study) |
| Red-light-running occurrences | ||||
| Preemption details (percent false calls, preempt time) | Indirect | Medium | Low | No |
| Progression quality (arrivals on green/red, platoon ratio) | Indirect | High | High | Yes (combined as one study) |
| Purdue coordination diagram | ||||
| Cyclic flow profile | Indirect | Low | Low | No |
| Offset adjustment diagram | Indirect | Medium | Low | No |
| Travel time and average speed | Indirect | Low | Low | No |
| Time-space diagram | Indirect | Low | Low | No |
| Left-turn gap analysis (gaps/cycle, percent large gaps) | Direct | High | Medium | Yes |
| Timing and Actuation | Indirect | Medium | Medium | No |
Performance measures that were used for the case B CMF development (i.e., labeled as “yes”) along with the reason for inclusion are described as follows:
- Split Failures. The Split Failure report is one of the most used reports by agencies for more efficient split reallocation to prevent split (cycle) failures at intersections. As noted above, the alleviation of capacity constraints could potentially influence safety (e.g., reducing rear-end crashes). Note that other ATSPM reports such as Phase Termination and Split Monitor are also used to evaluate the performance of individual phases. Therefore, they were combined with the Split Failure report.
- Yellow and Red Actuations. This report is one of the few ATSPM reports where there are several studies that explored the relationship between safety and Yellow and Red Actuations. These
- actuations have been found to have a direct impact on safety. Agencies also utilize this report to a certain extent to make signal timing adjustments. As a result, the Yellow and Red Actuation report was included for the case B CMF development. Note that because the Red-light-running Occurrences report also provides similar metrics, it was combined with the Yellow and Red Actuation report as one study.
- Progression Quality. Progression quality using the Purdue Coordination Diagram is another report with a potential safety impact (although indirect). Because there is a large interest from practitioners in this report and readily available data, the research team included this metric for the case B CMF development. Because the Purdue Coordination Report provides similar metrics (e.g., arrivals on green, platoon ratio), it was combined with the Purdue Coordination Diagram as one study here.
- Left-turn Gap Analysis. The Left-turn Gap Analysis report produces a metric (i.e., proportion of green with long gaps) that has a direct safety relationship and is commonly used by agencies, providing potential sites for data collection in Phase II. As a result, it is also included in the case B CMF development.


