Crash Modification Factors for Automated Traffic Signal Performance Measures (2026)
Chapter: 7 Benefit–Cost Analysis Case Study
CHAPTER 7
Benefit–Cost Analysis Case Study
This chapter discusses the methodology followed for the benefit-cost analysis (BCA) case study developed to describe the application of the case A CMFs. Additionally, the chapter presents the results of the BCA by quantifying the safety benefits and costs of converting an arterial from traditional signal timing to ATSPM-based signal timing (among other costs and mobility benefits as discussed below).
It should be noted that the BCA was only conducted for the Virginia DOT and Utah DOT arterials using the case A CMF results discussed in Chapter 5. This was because for Georgia DOT, there was missing information on deployment cost (e.g., costs for controller or firmware upgrades) and operational benefit (e.g., benefits obtained during responding to failed detection, progression improvements), and therefore BCA results from Georgia DOT are not included here.
Benefit-Cost Analysis Methodology
The research team followed the methodology developed by FHWA (Day et al., 2020) to estimate the cost and benefits of converting an arterial from traditional signal timing to ATSPM-based signal timing. As also outlined in the FHWA document, the methodology uses the cost elements and benefit elements outlined in Figure 32.
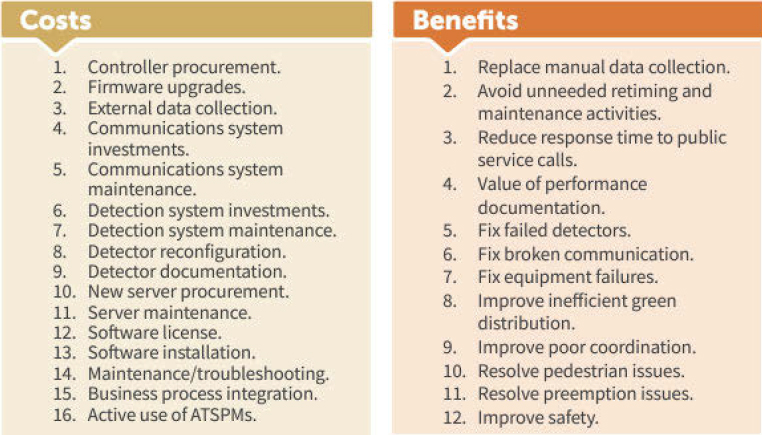
For the estimation of safety effects of ATSPMs (shown as B12. Improve Safety in the FHWA document), the research team utilized a slightly modified method. This is explained in the following section.
Methodology to Estimate Safety Effects
To derive the safety effect (B12), the number of crashes prevented per year were estimated and a dollar amount associated with them. The following formula was used to estimate this benefit.
| Equation 60 |
where,
| CCATSPM,j = | total change in crash cost due to agency implementation (and use) of ATSPMs in year j of the study period, j = 1 to ns (dollars); |
| Ccrash,Int = | total comprehensive crash unit cost for signalized intersections (all severity levels combined) (dollars/crash); |
| Ccrash,Seg = | total comprehensive crash unit cost for segments (all severity levels combined) (dollars/crash); |
| Np,change,Int,j = | change in predicted average crash frequency for signalized intersections due to agency implementation (and use) of ATSPMs in year j of the study period; and |
| Np,change,Seg,j = | change in predicted average crash frequency for segments due to agency implementation (and use) of ATSPMs in year j of the study period |
These costs can be totaled for all years and used directly to inform decisions about ATSPM deployment. They can also be used in a benefit-cost analysis that considers other ATSPM benefits and related implementation costs.
To be able to calculate the crash cost for signalized intersections and for segments, the research team used the crash costs outlined by Harmon et al. (2016), which provides estimates of the economic, quality-adjusted life years (QALY), and comprehensive crash costs by severity level for 2016. These costs represent “crash unit” costs because they reflect the average cost per crash, considering the average number of persons involved in the crash and the typical level of injury to each involved person. The costs provided by Harmon et al. (2016) have been updated to 2024 using the cost-updating procedure they describe. The updated costs are shown in columns 3, 4, and 5 of Table 56.
Table 56. Comprehensive crash unit cost by speed limit.
| Site Type | Crash Severity | Crash Unit Cost ($/crash) a | Crash Unit Cost ($/crash) by Speed Limit c | ||||||
|---|---|---|---|---|---|---|---|---|---|
| Economic | QALY | Comprehensive | 30 mph | 35 mph | 40 mph | 45 mph | 50 mph | ||
| Signalized Intersection | K | $2,251,531 | $13,197,466 | $15,448,997 | $12,823 | $14,213 | $15,912 | $17,612 | $19,466 |
| A | $169,967 | $723,678 | $893,645 | $5,174 | $5,782 | $6,434 | $7,140 | $7,882 | |
| B | $70,173 | $199,624 | $269,797 | $12,319 | $13,765 | $15,324 | $16,997 | $18,770 | |
| C | $55,584 | $114,468 | $170,052 | $26,613 | $29,737 | $33,107 | $36,718 | $40,551 | |
| O | $15,558 | $0 | $15,558 | $12,310 | $11,929 | $11,517 | $11,077 | $10,609 | |
| Total crash unit cost for all severity levels combined: | $69,239 | $75,426 | $82,296 | $89,543 | $97,277 | ||||
| Segment b | K | $2,251,531 | $13,197,466 | $15,448,997 | $39,549 | $42,176 | $44,957 | $47,892 | $50,827 |
| A | $169,967 | $723,678 | $893,645 | $9,151 | $9,759 | $10,393 | $11,063 | $11,760 | |
| B | $70,173 | $199,624 | $269,797 | $10,128 | $10,803 | $11,510 | $12,249 | $13,020 | |
| C | $55,584 | $114,468 | $170,052 | $25,243 | $26,924 | $28,688 | $30,531 | $32,454 | |
| O | $15,558 | $0 | $15,558 | $12,465 | $12,259 | $12,043 | $11,818 | $11,582 | |
| Total crash unit cost for all severity levels combined: | $96,536 | $101,921 | $107,590 | $113,553 | $119,644 | ||||
a – Comprehensive crash unit cost based on 2024 dollars. Values for 2016 obtained from Harmon et al. (2018). Economic costs for 2016 multiplied by 1.3068, representing the ratio of the consumer price indices for December of 2016 and 2024. Quality-adjusted life years (QALY) costs for 2016 multiplied by 1.3787, representing the ratio of the “median usual weekly earnings” (MUWE) values for the third quarters of 2016 and 2024.
b – Segment crashes include crashes associated with unsignalized intersections and driveways.
c – Cost by speed limit computed as severity distribution proportions multiplied by the comprehensive crash unit cost in column 5.
Next section shows the calculation of these cost and benefit elements and presents results of the BCA for the Virginia and Utah arterials (for details on the methodology and cost and benefit elements, please refer to the FHWA document).
Benefit-Cost Analysis Results
Results for the Virginia DOT Arterials
This section discusses the benefit-cost analysis applied to the ATSPM-operated corridors in Virginia (i.e., US 29 and SR 650) that are used for the case A CMF development. To calculate the present value of cost or benefit items over the life of the system (assumed to be 10 years), an interest rate of 2% was used.
Costs of Deploying and Utilizing ATSPM
The ATSPM deployment incurred the following cost items: Procurement of controllers (C1), a small cost associated with upgrading controller firmware (C2), labor costs for documenting detector configurations (C9), cost of server procurement (C10), server maintenance costs (C11), business process integration costs (C15), and cost of effort needed to extract benefits from ATSPM (C16). Details of the costs are outlined below. Other cost elements shown in Figure 32 were not needed for the ATSPM deployment. As a result, those are not included here. Note that these numbers are derived based on the conversations made with the Virginia DOT staff that regularly use ATSPMs.
- C1 – A total of $35,560 was required for controller improvements. This is based on a unit cost of $5,080, multiplied by 14 intersections, with 50% of the cost attributed to ATSPM.
- C2 – A labor cost of $87 was calculated for firmware upgrades.
- C9 – The cost of documenting detector configurations was found to be $520, based on the assumption that each intersection would require one hour, and there were 14 intersections, using an hourly rate of $28.85 for this activity.
- C10 – Server set-up cost $1,683, including the use of existing equipment with minor upgrades and labor to install the ATSPM system.
- C11 – Server maintenance was estimated to require 12 hours per year at a rate of $65 per hour, along with a unit cost of $100 per year estimated for replacements. This yields an annual cost of $880. Over a 10-year period, the net present value of the cost is $8,555.
- C15 – Business process integration cost $111,829. This was the cost of hiring a consultant to help integrate ATSPMs (e.g., setting up the open-source platform, detection mapping to configure detectors, etc.) for VDOT.
- C16 – Usage costs for ATSPM reflect the number of hours spent making use of the system to extract the necessary data. For this cost, a total of 150 person-hours per year was assumed, at a cost of $100 per hour, or $15,000 per year. Over a 10-year period, the net present value of the cost is $134,739.
The total cost of the ATSPM deployment over a 10-year period includes upfront costs and some that are spread out over the life of the project. These work out to a total of $292,971.
Benefits Derived from ATSPM
Virginia DOT reported the following benefit items: Benefit associated with reduction of agency staff hours for manual data collection (B1), scheduled maintenance or retiming (B2), or handling complaint calls from the public (B3); and public benefits associated with discovery of failed detectors (B5), improving the efficiency of green distribution (B8), and improving pedestrian operational issues (B10). Finally, a benefit associated with crash reductions (B12) was calculated using the CMFs developed in this research. Details of the benefits other than safety are described below.
- B1 – It was estimated that approximately 9 hours per year at a rate of $100 per hour could be saved with ATSPM for activities related to data collection. The annual cost of $900 per year worked out to be worth $8,152 over a 10-year period.
- B2 – It was estimated that 156 hours per year could be saved by reducing the need for schedule maintenance or retiming. Assuming a cost of $43.28 per hour, $6750 per year equates to a present value of $60,641 for a 10-year period.
- B3 – It was estimated that 104 person-hours were used for handling complaint calls on the treatment corridors, and that ATSPM would reduce this by about 50%. Assuming a cost of $28.85 per hour, the savings of $1,500 per year over 10 years is worth a present value of $13,476.
- B5 – The discovery and repair of failed detectors was assumed to be worth about $9,358 over a 10-year period. This was estimated by assuming that in the transition to ATSPM-assisted operation, 369 hours of delay would be saved, with a value of $17.50 per hour of saved delay. In subsequent years it was assumed that the delay reduction would be 5% of the initial year reduction.
- B8 – Efforts to improve capacity allocation by distributing green time more efficiently were found to be worth $428,304 over a 10-year period. An initial reduction in delay of approximately 9900 hours was estimated, and subsequent years were estimated at 10% of that value. The same unit delay costs were assumed as for B5.
- B10 – Improvement of pedestrian operations was valued at $76,283 over the service life of the ATSPM system. This was determined from savings of approximately 790 hours in year 1, with subsequent years having 50% of this benefit, and the same unit costs as before.
Safety Effects of ATSPMs
For VDOT ATSPM arterials, the following changes in intersection and segment crashes are estimated for the US 29 and SR 650 using the estimated case A CMF values:
- For US 29, a reduction of 9.39 intersection crashes and a reduction of 4.54 segment crashes were estimated during the first year because of the ATSPM deployment.
- For SR 650, a reduction of 2.31 intersection crashes and a reduction of 3.16 segment crashes were estimated during the first year because of the ATSPM deployment.
Using the crash unit cost values provided in Table 56 and the change in segment and intersection crashes provided above, the value of crash reductions and safety benefit was estimated to be worth $2,550,029 over a 10-year period.
Benefit-Cost Analysis Results for Virginia Arterials
Table 57 shows the results of the benefit and cost elements for the ATSPM operated arterials in Virginia. The monetary effect of the change in crashes is listed separately below.
Table 57. Benefit-cost analysis results for Virginia ATSPM-operated arterials.
| Agency | Estimated Benefits | Estimated Costs | Safety Effect |
|---|---|---|---|
| Virginia DOT | $596,214 | $292,973 | $2,550,029 |
Results for the Utah DOT Arterials
This section discusses the benefit-cost analysis applied to the ATSPM-operated corridors in Utah (i.e., SR 71 and SR 266) that are used for the case A CMF development. To calculate the present value of cost or benefit items over the life of the system (assumed to be 10 years), an interest rate of 2% was used.
Costs of Deploying and Utilizing ATSPM
The ATSPM deployment incurred the following cost items: Procurement of controllers (C13), installation cost for the ATSPM system, (C14), maintenance cost to maintain the detectors and the system, (C15), a small cost to integrate the system into business processes, and (C16), usage cost for the ATSPM system. Other cost elements shown in Figure 32 were not needed for the ATSPM deployment because UDOT did not need infrastructure updates to use ATSPMs. Note that these numbers are derived based on the conversations made with the Utah DOT staff that regularly use ATSPMs.
- C13 – A total of $15,297 was required for the installation cost.
- C14 – The cost of maintenance for the elements required to maintain the system was found to be $17,667.
- C15 – Business process integration cost $1,934. This cost was minimal for Utah DOT as they already have a well-established framework to use ATSPMs.
- C16 – Usage costs for ATSPM reflect the number of hours spent making use of the system to extract the necessary data. For this cost, over a 10-year period, the net present value of the cost is $140,728.
The total cost of ATSPM deployment over a 10-year period was found to be a total of $175,627.
Benefits Derived from ATSPM
Utah DOT reported the following benefit items: Benefit associated with reduction of agency staff hours for manual data collection (B1), handling complaint calls from the public (B3), public benefits associated with discovery of failed detectors (B5), improving the efficiency of green distribution (B8), and improving the efficiency of progression along arterials (B9). Details of the benefits are described below.
- B1 – It was estimated that $313,987 could be saved by avoiding manual data collection over a 10-year period.
- B3 – It was estimated that $94,475 could be saved over a 10-year period by avoiding response times to public complaints.
- B5 – It was estimated that $878,674 could be saved as a result of delay reduction due to the discovery and repair of failed detectors over a 10-year period.
- B8 – Efforts to improve capacity allocation by distributing green time more efficiently were found to be worth $175,735 over a 10-year period.
- B9 – Efforts to reduce delay by improve corridor progression were found to be worth $175,735 over a 10-year period.
Safety Effects of ATSPMs
For UDOT ATSPM arterials, the following changes in intersection and segment crashes are estimated for the SR 71 and SR 266 using the estimated case A CMF values:
- For SR 71, an increase of 8.06 intersection crashes and a reduction of 17.54 segment crashes were estimated during the first year because of the ATSPM deployment.
- For SR 650, an increase of 60.26 intersection crashes and an increase of 33.79 segment crashes were estimated during the first year because of the ATSPM deployment.
Using the crash unit cost values provided in Table 56 and the change in segment and intersection crashes provided above, the value of safety benefit was estimated to be worth -$11,142,364 over a 10-year period. The results were negative benefits due to the increase in estimated crashes since CMF values are higher than 1.0 for intersection crashes on both arterials and higher than 1.0 for segment crashes along SR 266.
Benefit-Cost Analysis Results for Utah Arterials
Table 58 shows the results of the benefit and cost elements for the ATSPM operated arterials in Utah. The monetary effect of the change in crashes is listed separately below.
Table 58. Benefit-cost analysis results for Utah ATSPM-operated arterials.
| Agency | Estimated Benefits | Estimated Costs | Safety Effect |
|---|---|---|---|
| Utah DOT | $1,638,606 | $175,627 | -$11,142,364 |


