Crash Modification Factors for Automated Traffic Signal Performance Measures (2026)
Chapter: 4 Research Approach
CHAPTER 4
Research Approach
This chapter summarizes the research approach including the data collection and data reduction efforts to develop CMFs for ATSPMs. The chapter first explains the data structure and site selection plan developed for the data collection and reduction efforts. Then, it discusses the data collection and reduction efforts for the case A CMF development. Finally, the document summarizes the data collection efforts for the development of case B CMFs.
Data Structure and Site Selection Plan
This section discusses data structure and site selection plan followed by the research team to develop case A and case B CMFs. The discussion is presented in two subsequent sections, where one section discusses these topics for case A CMFs and the second section discusses these topics for case B CMFs.
Case A CMF Data Structure and Site Selection Plan
Study Objective and Method
The objective of the case A study was to develop a set of CMFs that collectively describe the association between ATSPM deployment and the change in traffic safety on an arterial street. The set of CMFs are specific to two crash severity categories (fatal-and-injury crashes combined, property-damage-only crashes), two traffic periods (i.e., peak hours, non-peak hours), and two facility types (i.e., signalized intersections, segments). The premise was that ATSPM deployment will improve system manager awareness of current system performance, which would trigger changes to the signal operation that are likely to improve traffic safety.
A before-after study method was used to develop the proposed set of CMFs. Data was collected for a “before ATSPM system deployed” period and an “after ATSPM system deployed” period at each of six signal systems for which ATSPMs are currently being used to manage the signal system operation.
A before-after study was used to quantify the CMFs for each signal system. A comparison signal system that does not have ATSPM deployment was matched to each ATSPM-operated arterial street. The comparison site was used to account for changes that occur during the before-after time period that were not due to ATSPM deployment. Thus, the comparison system was used to compute a CMF that reflects only the change in safety due to ATSPM deployment.
A site was defined to be one signal system consisting of a section of arterial street (both travel directions) that was comprised of (a) multiple consecutive segments bounded by a signalized intersection, (b) the cross-street legs of each signalized intersection (for a distance back 500 ft), and (c) the external major-street leg at the first and last signalized intersection (for a distance back 500 ft). A segment was defined as a length of street between two adjacent signalized intersections. Segment length was measured from the center of one signalized intersection to the center of the next signalized intersection.
Two analysis periods were evaluated to provide a sensitivity to traffic demand levels and the likelihood that system performance may vary between peak and non-peak traffic periods. One analysis period consisted of the collective set of peak hours of the typical week (i.e., 7:00-9:00 am M-F, 4:00-6:00 pm MF). The second analysis period consisted of the collective set of non-peak hours of the typical week.
The data time period included at least three consecutive years of data for the “before” period and at least one year of data for the “after” period. The data-time-period coincided with the most recent years for which crash data are available. The geometric data and traffic control data were confirmed to be unchanged during this time period. Traffic volume could change during this time period because the database included one AADT volume variable for each year.
Database Structure
A highway safety database (HSD) was assembled as a flat file (using an Excel workbook). Each observation in the database describes one signal system (i.e., site). Six observations collectively describe the six ATSPM-operated signal systems and six additional observations collectively describe the six comparison signal systems. Data for a total of 12 observations were included in the HSD—one observation for each signal system. The data included variables that describe the ATSPM operation, signal timing, traffic volume, and geometric design characteristics of each system. These variables are described in the section titled Data Requirements.
A crash database (CD) was assembled as a flat file (using an Excel workbook). Each observation in the database describes one crash. The crashes included in the CD are those that occurred on one of the twelve signal systems during the data time period. The data included variables that describe the crash events, roadway conditions, driver conditions, and vehicle conditions associated with each crash.
For each signal system pair (i.e., ATSPM-operated system and its comparison site), the data time period needed to include the same calendar years. For example, if the data time period for one pair was defined to include years 2019, 2020, 2021 and 2022, then crashes occurring during the years 2019 to 2022 would be acquired for the ATSPM-operated system and for its comparison system. Ideally, the data time period would be defined to include the same calendar years for all six signal system pairs.
Sample Size Requirements
Hauer (1997) describes a procedure for estimating the crash sample size for a before-after study. This procedure was used to provide insight into the study design for the six arterial street study sites. Specifically, the procedure was used to compute a target “crash reduction factor (CRF)”. The target CRF represents a value that, if met or exceeded, allows rejection of null hypothesis that ATSPM-operated system has no effect on safety. The goal of the study design was to determine the minimum number of years in the before and after periods as well as the minimum length of the comparison sites that produce a reasonably small target CRF.
To apply the Hauer (1997) procedure, an estimate of the annual crash frequency was estimated for each of the six sites (please see below for details on selected sites). Representative crash rates were used for each signalized intersection, unsignalized intersection, and segment that comprise a site. One unsignalized intersection was assumed to be located on each segment. The ratio of minor street AADT to major street AADT was assumed to be 0.35 and 0.15 for signalized and unsignalized intersections, respectively. The computed crash frequency is listed in the second row of Table 9.
The computed target CRF values for two cases are shown in Table 9. Both cases are based on a 3-year “before” period duration. Case 1 assumes that the after period is one year in duration for each of the six sites. Case 2 assumes that the after period is two years in duration for four of the sites and one year in duration for the other two sites. The durations chosen for case 2 represent the maximum number of “after” years for which crash data are likely available based on the year the site changed from traditional timing to ATSPM-based timing.
The target CRF values shown in Table 9 for case 1 range from 12 to 24 percent. Those for case 2 range from 10 to 24 percent. For Gallows Road, the target CRF is 19 percent. This value implies that a 19-percent or more decrease in crash frequency would need to be observed to be confident that the ATSPM-based
signal operation is associated with a safety benefit at this site. If the number of years in the after period is increased to two years at this site, then the target CRF decreases to 16 percent (a 16 percent decrease). Thus, the additional year of crash data improves study sensitivity by facilitating the reliable detection of a smaller reduction in crash frequency.
Table 9. Target crash reduction factor for two study design options.
| Case | Attribute | Arterial Street Name | All Sites | |||||
|---|---|---|---|---|---|---|---|---|
| Lee Jackson Memorial Hwy. | Gallows Road | SR 71 (12300 South / 12600 South) | SR 266 (4700 S) | SR 8 (Harcourt Dr. to Montreal Rd.) | SR 8 (Lakeshore Dr. to Orion Dr.) | |||
| Exposure (mvm) a | 18 | 13 | 58 | 22 | 10 | 51 | 102 | |
| Est. crashes/yr b, c | 171 | 171 | 551 | 222 | 100 | 543 | 1758 | |
| 1 | After period years | 1 | 1 | 1 | 1 | 1 | 1 | -- |
| Target CRF (%) d | 19 | 19 | 12 | 17 | 24 | 12 | 8 | |
| 2 | After period years | 2 | 2 | 2 | 2 | 1 | 1 | -- |
| Target CRF (%) d | 16 | 16 | 10 | 14 | 24 | 12 | 7 | |
a – mvm: million vehicle miles
b – Based on typical crash rates. Signal: 1.0 crashes per million entering vehicles; unsignalized intersection: 0.6 crashes per million entering vehicles; segment: 0.63 crashes per million vehicle miles.
c – Estimated crash frequency for ATSPM-operated signal system. Comparison system assumed to have the same crash frequency.
d – Target crash reduction factor (CRF): the percent crash reduction value that, if met or exceeded, allows rejection of null hypothesis that ATSPM-operated system has no effect on safety (based on 90 percent confidence interval). Based on 3 years of crash data before conversion to ATSPM operation.
The last column of Table 9 lists the target CRFs when the data for all sites are combined. The site data can be combined when the site-to-site CRF values are consistent, or when they vary in a systematic manner (e.g., as a function of signal timing change frequency). The benefit of combining the data is that it increases the crash sample size and reduces the target CRF.
Site Identification
This section describes characteristics of the sites that make them suitable for study. The first section describes the characteristic data that were needed for the evaluation of each site. If this data cannot be acquired, then the site may not be suitable for study. The second section describes the criteria used to determine whether the characteristics and condition of a site made it suitable for study.
As noted previously, a site is defined to be one signal system consisting of a section of arterial street (both travel directions) that is comprised of multiple consecutive segments, with each segment bounded by a signalized intersection. A site will have a number of signalized intersections (N) and between each pair of signals there will be a segment. The signal and segment numbering schemes are shown in Figure 5.

Data Requirements
Table 10 lists the characteristics of interest for each arterial street study site and its associated ATSPM signal system. These characteristics were included as variables in the HSD. They represent basic counts and measurements describing one segment or signalized intersection. They were combined prior to CMF development to provide higher-order descriptors of the overall arterial street.
Table 11 lists the essential crash variables needed for CMF development. The research team was able to acquire crash data with these variables for each site studied. The crash data needed for case A CMF development included all crashes that occur within the boundaries of the arterial street study site during the data time period. The boundaries of the study site are shown in Figure 5. They include the N-1 segments, the cross-street legs of each of the N signalized intersections (for a distance back 500 ft), and the external major-street leg at the first and last signalized intersection (for a distance back 500 ft). If crashes on the cross-street legs were not available for a site, then this deficiency in the crash was in the database. Additionally, if crashes were not available for the cross-street legs of the ATSPM-operated site, then they were excluded for its comparison site (and vice-versa if they were not available for the comparison site).
Table 10. Variables describing the arterial street and ATSPM system.
| Category | Variable |
|---|---|
| Location characteristics | Roadway ID number for segment 1 b Milepost of intersection center at north or east end of segment 1 Geo-coordinates of center of intersection at north or east end of segment 1 : [repeat the above items for segments 2 to N − 1] |
| Volume characteristics | AADT volume for segment 1 for year 1 AADT volume for segment 1 for year 2 AADT volume for segment 1 for year 3 AADT volume for segment 1 for year 4 a Distribution of AADT by hour of day (24 values; assumed applicable to all N segments) : [repeat the above items for segments 2 to N − 1] |
| Arterial street characteristics | Number of signalized intersections (N) Length of segment 1 Number of through lanes on segment 1 Posted speed limit on segment 1 Median type on segment 1 (i.e., undivided, raised curb, two-way left-turn lane) Number of four-leg signalized intersections on segment 1 (0, 1, 2) Number of signalized intersections on seg. 1 with a major-street left turn bay (0, 1, 2) Number of signalized intersections on seg. 1 with a crosswalk across the major road : [repeat the above items for segments 2 to N − 1] |
| ATSPM characteristics | Number of side street approaches with stop line detection for segment 1 (0, 1, 2, 3, 4) Number of major-street left-turn bays with detection for segment 1 (0, 1, 2) Number of major-street approaches with advance detection for segment 1 (0, 1, 2) Number of major-street approaches with count detection for segment 1 (0, 1, 2) Frequency of timing changes to signals using ATSPMs bounding segment 1 for year 1c Frequency of timing changes to signals using ATSPMs bounding segment 1 for year 2 c Frequency of timing changes to signals using ATSPMs bounding segment 1 for year 3c Frequency of timing changes to signals using ATSPMs bounding segment 1 for year 4c : [repeat the above items for segments 2 to N − 1] |
a – Include one variable for each year of the data time period.
b – Number used to identify crash records associated with segment.
c – 0 = one time change, 1 = change with alerts or during complaints, 2 = change approximately 3 months or longer, 3 = change approximately less than 3 months
Table 11. Crash data variables.
| Database | Variable a |
|---|---|
| Crash characteristics | Roadway ID number associated with crash Milepost of crash occurrence Geo-coordinates of crash occurrence Date of crash (crash must occur during the data time period) Time of crash Crash type or manner of collision First contributing factor or harmful event Relationship to junction Number of involved vehicles, pedestrians, and bicycles Crash severity (KABCO scale) |
| Roadway characteristics | Road surface condition Work zone presence or status |
| Driver characteristics | Condition at time of crash |
| Vehicle characteristics | Vehicle 1 movement or direction of travel Vehicle 2 movement or direction of travel |
a – Essential set of crash variables; desirably all crash, roadway, driver and vehicle variables can be acquired.
Site Selection Criteria
This section describes the criteria used to determine whether a candidate site was suitable for use as a comparison site. A comparison site needed to satisfy these criteria to be considered “valid.”
Availability of All Required Data.
The data described in Table 10 and Table 11 must be available for each comparison site.
Site Operation is Not Based on ATSPMs.
The comparison site was not managed or operated based on ATSPM reports.
Site in Same Region as ATSPM-Operated Site.
The comparison site needed to be in the same region and area type (i.e., urban) as the ATSPM-operated site.
Similar Site Characteristics.
The comparison site, ideally, needed to have similar safety-related characteristics as the ATSPM-operated site. The characteristics of interest are identified in the following list:
- Comparison site has same median type as ATSPM-operated site (e.g., undivided, raised curb median).
- Signal spacing at comparison site should be within 20 percent of that at ATSPM-operated site.
- Speed limit at comparison site is within 5 mph of that at ATSPM-operated site.
- Congestion level at comparison site (which will be calculated using the mainline AADT/number of through lanes) should be within 20 percent of the ATSPM-operated site
- Comparison site exposure (= arterial length in miles × arterial AADT × 365 / 1,000,000) is 25 mvm or more (this criterion may be met by increasing arterial length).
No Changes During Data Time Period.
The comparison site needed to be verified to have the same geometric design, lane assignment, and traffic control for the duration of the data time period. Historical aerial imagery (e.g., Google Earth) was reviewed to verify that each site satisfies this criterion.
No Long-Term Work Zone Present During Data Time Period.
The comparison site did not have a long-term work zone during the data time period. A long-term work zone was defined as a work zone that occupies a location for one month or more. The presence of long-term work zones was determined using (a) agency construction records or (b) Google Earth historical imagery.
Case B CMF Data Structure and Site Selection Plan
Study Objective and Method
As noted earlier, four studies were used to produce CMFs describing the association between use of specified ATSPM reports and the change in traffic safety at a signalized intersection. The four studies and associated ATSPMs are identified in the following list:
- B1. Percent Arrivals on Green
- B2. Yellow and Red Actuation
- B3. Split Failure
- B4. Left-Turn Gap Analysis
The set of CMFs were specific to two crash severity categories (fatal-and-injury crashes combined, property-damage-only crashes), two traffic periods (i.e., peak hours, non-peak hours), and, for case B4: Left-Turn Gap Analysis CMF, two crash types (i.e., target crash type, non-target crash type).
A cross-sectional study method was used to develop the proposed set of CMFs. Data was originally planned to be collected for at least 50 signalized intersection approaches for which ATSPMs are currently being used to manage signal operation. However, due to data limitations, not all the ATSPMs for case B CMFs collected from at least 50 signalized intersections (e.g., the Yellow and Red Actuation Report was only available in Utah or the Left Turn Gap Analysis report was only available in Georgia).
The assembled data was used to infer a CMF using regression analysis of the yearly observations in the database. This approach facilitated the development of a CMF that is a function of independent variables.
A site was defined to be one arterial street approach to a signalized intersection, where vehicles traveling along the approach are served by coordinated signal operation during some time periods of each weekday. An intersection approach was defined to include all adjacent lanes (and turn bays) serving traffic traveling toward the intersection on one intersection leg. An intersection leg was defined to include the adjacent approaching and departing lanes on one side of the intersection.
Two analysis periods were evaluated to provide a sensitivity to traffic demand levels and the likelihood that system performance may vary between peak and non-peak traffic periods. One analysis period consisted of the collective set of peak hours of the typical week (e.g., 7:00-9:00 am M-F, 4:00-6:00 pm MF). The second analysis period consisted of the collective set of non-peak hours of the typical week.
The data time period was the number of years of data used to estimate the CMF values. It included at least three consecutive years of data. Each year of data represented a full calendar year. The evaluation time period coincided with the most recent years for which crash data are available. The data time period coincided with the most recent years for which crash data are available. The geometric data and traffic control data were confirmed to be unchanged during this time period. Traffic volume could change during this time period because the database attributes were defined to include one AADT volume variable for each year.
Database Structure
A highway safety database (HSD) was assembled as a flat file (using an Excel workbook). Each observation in the database described one intersection approach (i.e., site). The data included variables that describe the ATSPM operation, signal timing, traffic volume, and geometric design characteristics of each site. These variables were described in the section titled Data Requirements.
A crash database (CD) was assembled as a flat file (using an Excel workbook). Each observation in the database described one crash. The crashes included in the CD are those that occurred during the data time period on one of the intersection approaches represented in the HSD. The data included variables that
describe the crash events, roadway conditions, driver conditions, and vehicle conditions associated with each crash.
Sample Size Requirements
FHWA’s Safety Performance Function Decision Guide: Safety Performance Function (SPF) Calibration versus SPF Development (Srinivasan et al., 2013) suggests the minimum site sample size needed to develop a Part C crash prediction model (CPM) is at least 100 to 200 sites that collectively experience at least 300 crashes. The minimum number of sites criterion is intended to produce a CPM with many CMFs that reflect the safety influence of a diverse set geometric design elements and traffic control features. However, for this project, the goal is to infer a case B CMF (not to produce a CPM), which reduced the number of sites needed to achieve the desired diversity.
The minimum crash count criterion is intended to ensure the regression analysis will produce a reasonable number of statistically valid coefficients. This criterion can be assessed by using a typical crash rate for signalized intersections (i.e., 1.0 crashes per million entering vehicles) and by assuming that most of the intersection crashes (say, 65 percent) are associated with the major-street legs. Using these assumptions, an intersection with major- and minor-street AADTs of 33,000 and 11,500, respectively, would experience 16 crashes per year, of which 5.3 crashes per year would occur on one major-street approach (i.e., site). Even if there are fewer than 50 sites for a given case B CMF, for example 30 sites, then these sites will collectively experience 477 crashes during a three-year data time period (= 5.3 crashes/year/site × 30 sites × 3 years). This number more than satisfies the “300 crashes” criterion established by Srinivasan et al. (2013).
Site Identification
This section describes characteristics of the sites that make them suitable for study. The first section describes the characteristic data that were needed for the evaluation of each site. The second section describes the criteria used to determine whether the characteristics and condition of a site make it suitable for study.
Data Requirements
Table 12 lists the characteristics of interest for each intersection approach study site. These characteristics were included as variables in the HSD. They represent basic counts and measurements describing one intersection approach. They were combined prior to CMF development to provide higher-order descriptors of the overall approach. For example, the AADT volume and time-of-day distribution data were used to compute the leg volume during the peak hours of the average day. The site characteristic data needed describe conditions present during the data time period.
The crash data needed for case B CMF development included all crashes that occur within the boundaries of the intersection leg during the data time period. The boundary of the leg extended from the center of the intersection to a distance 400 ft back from the intersection (note that during assignment of crashes to intersection legs, the distance was refined for each state based on the review of crash data).
Table 12. Variables describing the intersection approach.
| Category | Variable | Case a | |||
|---|---|---|---|---|---|
| B1 AOG | B2 Y&R | B3 Split | B4 Lt Gap | ||
| Volume characteristics | AADT volume for leg for year 1 | X | X | X | X |
| AADT volume for leg for year 2 | X | X | X | X | |
| AADT volume for leg for year 3 b | X | X | X | X | |
| Distribution of AADT by direction and hour of day (24 values) | X | X | X | X | |
| AADT volume for leg opposing subject leg for year 1 | X | ||||
| AADT volume for leg opposing subject leg for year 2 | X | ||||
| AADT volume for leg opposing subject leg for year 3 b | X | ||||
| Intersection characteristics | Distance to upstream signalized intersection | X | X | X | |
| Number of through lanes on the approach | X | X | X | X | |
| Presence of left-turn bay on approach | X | X | X | X | |
| Posted speed limit for the approach | X | X | X | X | |
| Signal control mode (i.e., coordinated, actuated) | X | ||||
| Left-turn operation on the approach (i.e., perm., prot., prot/perm) | X | ||||
| Median type (i.e., undivided, raised curb, two-way left-turn lane) | X | ||||
| ATSPM characteristics | Option 1: Processed ATSPMs by Hour of Day | ||||
| Percent arrivals on through green during hour i, i = 1 to 24 | X | ||||
| Percent thru. green time per cycle during hour i, i = 1 to 24 | X | ||||
| Percent thru. veh. entering on yellow during hour i, i = 1 to 24 | X | ||||
| Percent thru. veh. entering on red during hour i, i = 1 to 24 | X | ||||
| Percent cycles with thru. split failure during hour i, i = 1 to 24 | X | ||||
| Percent time w/large gaps in opposing thru. traffic during hour i, | X | ||||
| Average cycle length during hour i, i = 1 to 24 | X | ||||
a – B1: percent arrivals on green; B2: yellow and red actuations; B3: split failure; B4: left-turn gap analysis.
b – Include one variable for each year of the data time period.
Data for all crashes involving one or more vehicles that occurred within the aforementioned leg boundary during the data time period were needed from the operating agency. The research team screened the crash data and decided which crashes, if any, needed to be excluded (e.g., due to extended ice-covered roads or long-term work zone presence).
Site Selection Criteria
This section describes the criteria used to determine whether a candidate site was suitable for use in the development of the case B CMFs. A site needed satisfy these criteria to be considered “valid.”
Availability of All Required Data.
The data described in Table 11 must be available for each study site.
No Changes During Data Time Period.
The site needed to be verified to have the same geometric design, lane assignment, and traffic control for the duration of the data time period. Historical aerial imagery (e.g., Google Earth) was reviewed to verify that each site satisfies this criterion.
No Long-Term Work Zone Present During Data Time Period.
The site did not have a long-term work zone during the data time period. A long-term work zone was defined as a work zone that occupies a location for one month or more. The presence of long-term work zones was determined using (a) agency construction records or (b) Google Earth historical imagery.
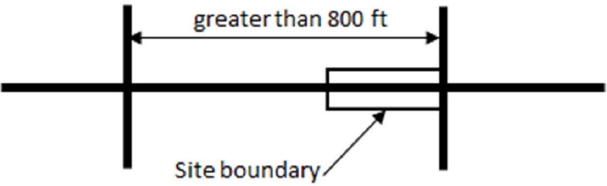
Outside Functional Area of Other Intersections.
Each site needed to be outside the functional area of another signalized intersection. A site satisfies this criterion if its associated segment length exceeded 800 feet. This relationship is shown in Figure 6.
Not at a Crossroad Ramp Terminal.
If a site forms one of the legs at the intersection of a ramp and a crossroad, then it was not considered to be valid.
Left-Turn Operation.
Each valid site needed to have protected-only, protected/permissive, or permissive-only left-turn operation. Moreover, at least two-thirds of collective set of sites for the case B4 CMF needed to have protected/permissive or permissive-only left-turn operation.
All Through Lanes Signal Controlled.
All through lanes at the site needed to be signal controlled. If one or more through lanes were not signal controlled, then the intersection was invalid. For example, a 3-leg intersection with continuous green for the major-street through movement was not a valid intersection.
Case A CMF Data Collection and Reduction Summary
This section summarizes the data collection and reduction efforts for the case A CMF development for A1. Use of ATSPMs to manage a signal system.
Data Collection for Case A Evaluation Sites
This section describes the data sources utilized for each of the ATSPM-operated arterials and summarizes the data collected and used for the case A CMF development.
Virginia DOT (VDOT) ATSPM-Operated Arterials
Several data sources were used in Virginia to collect the data listed in Table 10. These sources are identified in the following list.
- VDOT linear referencing system (source: https://www.arcgis.com/home/item.html)
- AADT database hosted by VDOT (source: https://www.virginiaroads.org/datasets/VDOT)
- VDOT speed limit map (source: https://www.arcgis.com/apps/mapviewer/index.html)
- Google Maps (source: https://www.google.com/maps)
Additionally, coordination with agency representatives was conducted to gather information related to ATSPM characteristics and other relevant data that were not available in the listed sources. Table 13 and Table 14 summarize the data collected for the VDOT arterials. It should be noted that these tables are organized such that each column represents one study segment, where each segment is bounded by signalized intersections.
Table 13. Summary of variables per segment, for Lee Highway (US 29), Virginia.
| Category | Variable | Lee Highway (US 29), Virginia | |||||||
|---|---|---|---|---|---|---|---|---|---|
| Location characteristics | Roadway ID number a | US00029S | |||||||
| Segment number | 1 | 2 | 3 | 4 | 5 | 6 | 7 | 8 | |
| Milepost | 237.99 to 238.189 238.189 to 238.56 | 238.189 to 238.56 238.56 to 238.763 | 238.56 to 238.763 238.763 to 238.9 | 238.763 to 238.9 238.9 to 239.07 | 238.9 to 239.07 239.07 to 239.593 | 239.07 to 239.593 239.593 to 239.75 | 239.593 to 239.75 239.75 to 239.89 | 239.89 to 240.094 240.094 to 240.36 | |
| Geo-coordinates | 38.872264773, - 77.263160183 | 38.872509201, - 77.255371482 | 38.87262569, - 77.251680416 | 38.872781975, - 77.249088015 | 38.872958938, - 77.246108951 | 38.873680104, - 77.235965613 | 38.873850047, - 77.233195622 | 38.874012193, - 77.231478921 | |
| Volume characteristics | AADT volume for year 2017 | 33405 | 33405 | 33405 | 33405 | 33405 | 33405 | 33405 | 33405 |
| AADT volume for year 2018 | 31559 | 31559 | 31559 | 31559 | 31559 | 31559 | 31559 | 31559 | |
| AADT volume for year 2019 | 31537 | 31537 | 31537 | 31537 | 31537 | 31537 | 31537 | 31537 | |
| AADT volume for year 2020 | 23495 | 23495 | 23495 | 23495 | 23495 | 23495 | 23495 | 23495 | |
| AADT volume for year 2021 – ATSPM Operational | 24839 | 24839 | 24839 | 24839 | 24839 | 24839 | 24839 | 24839 | |
| AADT volume for year 2022 | 26406 | 26406 | 26406 | 26406 | 26406 | 26406 | 26406 | 26406 | |
| AADT volume for year 2023 | * | * | * | * | * | * | * | * | |
| Distribution of AADT by hour of day (24 values) | ** | ** | ** | ** | ** | ** | ** | ** | |
| Arterial street characteristics | Number of signalized intersections (N) | 9 | |||||||
| Length of segment (feet) | 2200 | 1060 | 712 | 853 | 2875 | 790 | 500 | 1280 | |
| Number of through lanes on segment | 4 | 4 | 4 | 4 | 4 | 4 | 4 | 6 | |
| Posted speed limit on segment (mph) | 40 | 40 | 40 | 40 | 40 | 40 | 40 | 40 | |
| Median type on segment b | 2 | 2 | 2 | 2 | 2 | 0 | 0 | 1 | |
| # of four-leg signalized intersections on segment | 2 | 1 | 1 | 2 | 2 | 2 | 2 | 2 | |
| # of signalized intersections with a left turn bay | 2 | 2 | 2 | 2 | 2 | 2 | 2 | 2 | |
| # of signalized intersections with a crosswalk | 2 | 0 | 1 | 1 | 2 | 2 | 1 | 2 | |
| ATSPM characteristics | # of side street approaches with stop line detection | 2 | 2 | 4 | 4 | 4 | 4 | 4 | 2 |
| # of major-street left-turn bays with detection | 1 | 1 | 2 | 2 | 2 | 2 | 2 | 2 | |
| # of major-street appr. with advance detection | 1 | 1 | 2 | 1 | 1 | 2 | 2 | 2 | |
| # of major-street appr. with count detection | 0 | 0 | 0 | 0 | 0 | 0 | 0 | 0 | |
| Freq. of timing changes using ATSPMs for year 1c | 3 | 3 | 3 | 3 | 3 | 3 | 3 | 3 | |
| Freq. of timing changes using ATSPMs for year 2c | 3 | 3 | 3 | 3 | 3 | 3 | 3 | 3 | |
| Freq. of timing changes using ATSPMs for year 3c | 3 | 3 | 3 | 3 | 3 | 3 | 3 | 3 | |
| Freq. of timing changes using ATSPMs for year 4c | 3 | 3 | 3 | 3 | 3 | 3 | 3 | 3 | |
a – Number used to identify crash records associated with segment.
b – 1 = undivided, 2 = raised curb, 3 = two-way left-turn lane.
c – 0 = one time change, 1 = change with alerts or during complaints, 2 = change approximately 3 months or longer, 3 = change approximately less than 3 months
* - not available at the time of writing this report
** - to be extracted from ATSPM data where available or using hourly distributions using historical volumes
Table 14. Summary of variables per segment, for Gallows Road, Virginia.
| Category | Variable | Gallows Road, Virginia | ||||||||
|---|---|---|---|---|---|---|---|---|---|---|
| Location characteristics | Roadway ID number a | 2900650 | ||||||||
| Segment number | 1 | 2 | 3 | 4 | 5 | 6 | 7 | 8 | 9 | |
| Milepost | 3.84 to 3.71 3.71 to 3.667 | 3.71 to 3.667 3.667 to 3.38 | 3.667 to 3.38 3.38 to 3.292 | 3.38 to 3.292 3.292 to 3.191 | 3.292 to 3.191 3.191 to 3.044 | 3.191 to 3.044 3.044 to 2.937 | 3.044 to 2.937 2.937 to 2.758 | 2.937 to 2.758 2.758 to 2.621 | 2.621 to 2.44 2.44 to 2.267 | |
| Geo-coordinates | 38.872440714, - 77.227132633 | 38.870601096, - 77.227311699 | 38.867873035, - 77.227608585 | 38.866759755, - 77.227646183 | 38.86560736, - 77.227704741 | 38.863000439, - 77.227712347 | 38.861468171, - 77.227266408 | 38.858901898, - 77.22609032 | 38.856889875, - 77.225455789 | |
| Volume characteristics | AADT volume for year 2017 | 35303 | 35303 | 35303 | 35303 | 37955 | 37955 | 37955 | 37955 | 37955 |
| AADT volume for year 2018 | 39151 | 39151 | 39151 | 39151 | 35670 | 35670 | 35670 | 35670 | 35670 | |
| AADT volume for year 2019 | 39199 | 39199 | 39199 | 39199 | 35714 | 35714 | 35714 | 35714 | 35714 | |
| AADT volume for year 2020 | 29148 | 29148 | 29148 | 29148 | 26556 | 26556 | 26556 | 26556 | 26556 | |
| AADT volume for year 2021 – ATSPM Operational | 28112 | 28112 | 28112 | 28112 | 29192 | 29192 | 29192 | 29192 | 29192 | |
| AADT volume for year 2022 | 29885 | 29885 | 29885 | 29885 | 31033 | 31033 | 31033 | 31033 | 31033 | |
| AADT volume for year 2023 | * | * | * | * | * | * | * | * | * | |
| Distribution of AADT by hour of day (24 values) | * | * | * | * | * | * | * | * | * | |
| Arterial street characteristics | Number of signalized intersections (N) | 10 | ||||||||
| Length of segment (feet) | 660 | 1018 | 406 | 416 | 955 | 574 | 1005 | 751 | 918 | |
| Number of through lanes on segment | 6 | 6 | 6 | 6 | 6 | 7 | 6 | 6 | 5 | |
| Posted speed limit on segment (mph) | 35 | 35 | 35 | 35 | 35 | 35 | 35 | 35 | 35 | |
| Median type on segment b | 1 | 1 | 1 | 1 | 1 | 1 | 1 | 1 | 1 | |
| # of four-leg signalized intersections on segment | 1 | 1 | 1 | 1 | 1 | 1 | 1 | 1 | 2 | |
| # of signalized intersections with a left turn bay | 2 | 2 | 2 | 1 | 1 | 2 | 1 | 2 | 1 | |
| # of signalized intersections with a crosswalk | 1 | 2 | 0 | 0 | 0 | 0 | 1 | 2 | 0 | |
| ATSPM characteristics | # of side street appr. with stop line detection | 4 | 3 | 2 | 1 | 1 | 3 | 3 | 3 | 4 |
| # of major-street left-turn bays with detection | 2 | 2 | 2 | 0 | 0 | 2 | 2 | 2 | 2 | |
| # of major-street appr. with advance detection | 2 | 2 | 1 | 0 | 1 | 0 | 0 | 1 | 0 | |
| # of major-street approaches with count detection | 0 | 0 | 0 | 0 | 1 | 2 | 2 | 2 | 2 | |
| Freq. of timing changes using ATSPMs for year 1c | 3 | 3 | 3 | 3 | 3 | 3 | 3 | 3 | 3 | |
| Freq. of timing changes using ATSPMs for year 2c | 3 | 3 | 3 | 3 | 3 | 3 | 3 | 3 | 3 | |
| Freq. of timing changes using ATSPMs for year 3c | 3 | 3 | 3 | 3 | 3 | 3 | 3 | 3 | 3 | |
| Freq. of timing changes using ATSPMs for year 4c | 3 | 3 | 3 | 3 | 3 | 3 | 3 | 3 | 3 | |
a – Number used to identify crash records associated with segment.
b – 1 = undivided, 2 = raised curb, 3 = two-way left-turn lane.
c – 0 = one time change, 1 = change with alerts or during complaints, 2 = change approximately 3 months or longer, 3 = change approximately less than 3 months
* - not available at the time of writing this report
** - to be extracted from ATSPM data where available or using hourly distributions using historical volumes
Utah DOT (UDOT) ATSPM-Operated Arterials
For ATSPM-operated arterials (i.e., treatment sites) in Utah, several data sources were used to describe arterial characteristics and ATSPM system characteristics. These data were obtained from the sources identified in the list below.
- UDOT ATSPM website (source: https://udottraffic.utah.gov/atspm/)
- AADT database 1 hosted by UDOT (source: https://uplan.maps.arcgis.com/apps/mapviewer/index.html)
- AADT database 2 hosted by UDOT (source: https://udot.utah.gov/connect/docs/aadt-google-map/)
- Google Maps (source: https://www.google.com/maps)
Similar to the ATSPM-operated arterials in Virginia, in addition to the data sources listed above, coordination with agency representatives was conducted to gather information that was not obtainable from the mentioned data sources. Table 15 through Table 17 summarize the data collected for selected UDOT ATSPM-operated arterials.
Table 15. Summary of variables per segment, for SR 71, Utah.
| Category | Category | SR 71, Utah | ||||||
|---|---|---|---|---|---|---|---|---|
| Location characteristics | Roadway ID number a | Not used for crash assignment in Utah | ||||||
| Segment number | 1 | 2 | 3 | 4 | 5 | 6 | 7 | |
| Milepost | Not used for crash assignment in Utah | |||||||
| Geo-coordinates | 40.522314, - 111.957726 | 40.522291198, - 111.945964727 | 40.522286403, - 111.941231108 | 40.522269249, - 111.938791169 | 40.522285885, - 111.929208438 | 40.526778157, - 111.906659578 | 40.526752211, - 111.898961677 | |
| Volume characteristics | AADT volume for year 2017 | 33000 | 33000 | 33000 | 28000 | 28000 | 33000 | 33000 |
| AADT volume for year 2018 | 34000 | 34000 | 34000 | 29000 | 29000 | 33000 | 33000 | |
| AADT volume for year 2019 | 34000 | 34000 | 34000 | 29000 | 29000 | 33000 | 33000 | |
| AADT volume for year 2020 – ATSPM Operational | 30096 | 30096 | 30096 | 25554 | 25091 | 29107 | 29107 | |
| AADT volume for year 2021 | 33346 | 33346 | 33346 | 28314 | 27801 | 32251 | 32251 | |
| AADT volume for year 2022 | 34113 | 34113 | 34113 | 28,965 | 28440 | 32992 | 32992 | |
| AADT volume for year 2023 | * | * | * | * | * | * | * | |
| Distribution of AADT by hour of day (24 values) | ** | ** | ** | ** | ** | ** | ** | |
| Number of signalized intersections (N) | 15 | |||||||
| Length of segment (feet) | 3268 | 1320 | 668 | 2669 | 6696 | 2137 | 910 | |
| Number of through lanes on segment | 4 | 4 | 4 | 4 | 4 | 4 | 4 | |
| Posted speed limit on segment (mph) | 40 | 40 | 40 | 40 | 50 | 45 | 40 | |
| Median type on segment b | 2 | 1 | 1 | 2 | 1 | 1 | 1 | |
| # of four-leg signalized intersections on segment | 2 | 2 | 2 | 2 | 2 | 2 | 2 | |
| # of signalized intersections with a left turn bay | 2 | 2 | 2 | 2 | 2 | 2 | 2 | |
| # of signalized intersections with a crosswalk | 1 | 2 | 2 | 2 | 2 | 2 | 2 | |
| ATSPM characteristics | # of side street appr. with stop line detection | 4 | 4 | 4 | 4 | 4 | 4 | 4 |
| # of major-street left-turn bays with detection | 2 | 2 | 2 | 2 | 2 | 2 | 2 | |
| # of major-street appr. with advance detection | 1 | 1 | 1 | 2 | 2 | 2 | 2 | |
| # of major-street approaches with count detection | 2 | 2 | 2 | 2 | 2 | 2 | 2 | |
| Freq. of timing changes using ATSPMs for year 1c | 1 | 1 | 1 | 1 | 1 | 1 | 1 | |
| Freq. of timing changes using ATSPMs for year 2c | 1 | 1 | 1 | 1 | 1 | 1 | 1 | |
| Freq. of timing changes using ATSPMs for year 3c | 1 | 1 | 1 | 1 | 1 | 1 | 1 | |
| Freq. of timing changes using ATSPMs for year 4c | 1 | 1 | 1 | 1 | 1 | 1 | 1 | |
a – Number used to identify crash records associated with segment.
b – 1 = undivided, 2 = raised curb, 3 = two-way left-turn lane.
c – 0 = one time change, 1 = change with alerts or during complaints, 2 = change approximately 3 months or longer, 3 = change approximately less than 3 months
* - not available at the time of writing this report
** - to be extracted from ATSPM data
Table 16. Summary of variables per segment, for SR 71, Utah – continued.
| Category | Variable | SR 71, Utah | ||||||
|---|---|---|---|---|---|---|---|---|
| Location characteristics | Roadway ID number a | Not used for crash assignment in Utah | ||||||
| Segment number | 8 | 9 | 10 | 11 | 12 | 13 | 14 | |
| Milepost | Not used for crash assignment in Utah | |||||||
| Geo-coordinates | 40.526768357, - 111.895714743 | 40.526772409, - 111.891135882 | 40.526750656, - 111.888587212 | 40.52673772, - 111.886538189 | 40.526753039, - 111.885001355 | 40.526729038, - 111.881799375 | 40.526736, - 111.877983 | |
| Volume characteristics | AADT volume for year 2017 | 33000 | 32000 | 32000 | 32000 | 32000 | 36000 | 36000 |
| AADT volume for year 2018 | 34000 | 33000 | 33000 | 33000 | 33000 | 37000 | 37000 | |
| AADT volume for year 2019 | 34000 | 33000 | 33000 | 33000 | 33000 | 37000 | 37000 | |
| AADT volume for year 2020 – ATSPM Operational | 29591 | 28592 | 28592 | 28592 | 28592 | 32251 | 32251 | |
| AADT volume for year 2021 | 32787 | 31680 | 31680 | 31680 | 31680 | 35734 | 35734 | |
| AADT volume for year 2022 | 33541 | 32409 | 32409 | 32409 | 32409 | 36556 | 36556 | |
| Distribution of AADT by hour of day (24 values) | * | * | * | * | * | * | * | |
| Number of signalized intersections (N) | 15 | |||||||
| Length of segment (feet) | 1258 | 722 | 555 | 456 | 882 | 1050 | 1850 | |
| Number of through lanes on segment | 6 | 6 | 6 | 5 | 5 | 4 | 4 | |
| Posted speed limit on segment (mph) | 40 | 40 | 40 | 40 | 40 | 40 | 40 | |
| Median type on segment b | 1 | 1 | 1 | 1 | 1 | 2 | 1 | |
| # of four-leg signalized intersections on segment | 2 | 2 | 1 | 1 | 2 | 2 | 2 | |
| # of signalized intersections with a left turn bay | 2 | 1 | 1 | 1 | 2 | 2 | 2 | |
| # of signalized intersections with a crosswalk | 1 | 1 | 1 | 0 | 2 | 1 | 2 | |
| ATSPM characteristics | # of side street appr. with stop line detection | 4 | 2 | 0 | 2 | 4 | 2 | 2 |
| # of major-street left-turn bays with detection | 2 | 1 | 0 | 1 | 2 | 2 | 1 | |
| # of major-street appr. with advance detection | 2 | 2 | 1 | 1 | 2 | 2 | 2 | |
| # of major-street approaches with count detection | 2 | 1 | 0 | 1 | 2 | 1 | 1 | |
| Freq. of timing changes using ATSPMs for year 1c | 1 | 1 | 1 | 1 | 1 | 1 | 1 | |
| Freq. of timing changes using ATSPMs for year 2c | 1 | 1 | 1 | 1 | 1 | 1 | 1 | |
| Freq. of timing changes using ATSPMs for year 3c | 1 | 1 | 1 | 1 | 1 | 1 | 1 | |
| Freq. of timing changes using ATSPMs for year 4c | 1 | 1 | 1 | 1 | 1 | 1 | 1 | |
a – Number used to identify crash records associated with segment.
b – 1 = undivided, 2 = raised curb, 3 = two-way left-turn lane.
c – 0 = one time change, 1 = change with alerts or during complaints, 2 = change approximately 3 months or longer, 3 = change approximately less than 3 months
* - extracted from ATSPM data where available or from permanent count stations and used for the CMF development
Table 17. Summary of variables per segment, for SR 266, Utah.
| Category | Variable | SR 266, Utah | ||||
|---|---|---|---|---|---|---|
| Location characteristics | Roadway ID number a | Not used for crash assignment in Utah | ||||
| Segment number | 1 | 2 | 3 | 4 | 5 | |
| Milepost | Not used for crash assignment in Utah | |||||
| Geo-coordinates | 40.667560372, - 111.97703232 | 40.667522371, - 111.967512787 | 40.667593816, - 111.957974492 | 40.667595649, - 111.953315176 | 40.667577654, - 111.949863919 | |
| Volume characteristics | AADT volume for year 2017 | 18000 | 43000 | 44000 | 47000 | 47000 |
| AADT volume for year 2018 | 18000 | 44000 | 45000 | 47000 | 47000 | |
| AADT volume for year 2019 – ATSPM Operational | 18000 | 44000 | 45000 | 48000 | 48000 | |
| AADT volume for year 2020 | 15955 | 38653 | 39139 | 41449 | 41449 | |
| AADT volume for year 2021 | 17678 | 42828 | 43366 | 45925 | 45925 | |
| AADT volume for year 2022 | 18085 | 43813 | 44363 | 46982 | 46982 | |
| Distribution of AADT by hour of day (24 values) | * | * | * | * | * | |
| Number of signalized intersections (N) | 6 | |||||
| Length of segment (feet) | 2656 | 2650 | 1295 | 938 | 390 | |
| Number of through lanes on segment | 4 | 4 | 5 | 5 | 5 | |
| Posted speed limit on segment (mph) | 40 | 40 | 40 | 40 | 40 | |
| Median type on segment b | 2 | 2 | 2 | 1 | 1 | |
| # of four-leg signalized intersections on segment | 2 | 2 | 2 | 2 | 1 | |
| # of signalized intersections with a left turn bay | 2 | 2 | 1 | 1 | 1 | |
| # of signalized intersections with a crosswalk | 2 | 2 | 1 | 0 | 1 | |
| ATSPM characteristics | # of side street appr. with stop line detection | 4 | 4 | 3 | 2 | 3 |
| # of major-street left-turn bays with detection | 2 | 2 | 1 | 1 | 1 | |
| # of major-street appr. with advance detection | 1 | 2 | 2 | 1 | 2 | |
| # of major-street approaches with count detection | 2 | 2 | 1 | 1 | 1 | |
| Freq. of timing changes using ATSPMs for year 1c | 1 | 1 | 1 | 1 | 1 | |
| Freq. of timing changes using ATSPMs for year 2c | 1 | 1 | 1 | 1 | 1 | |
| Freq. of timing changes using ATSPMs for year 3c | 1 | 1 | 1 | 1 | 1 | |
| Freq. of timing changes using ATSPMs for year 4c | 1 | 1 | 1 | 1 | 1 | |
a – Number used to identify crash records associated with segment.
b – 1 = undivided, 2 = raised curb, 3 = two-way left-turn lane.
c – 0 = one time change, 1 = change with alerts or during complaints, 2 = change approximately 3 months or longer, 3 = change approximately less than 3 months
* - extracted from ATSPM data where available or from permanent count stations and used for the CMF development
Georgia DOT (GDOT) ATSPM-Operated Arterials
For treatment sites in Georgia, several data sources were used to collect data of interest to describe arterial characteristics and ATSPM-system characteristics. These data sources are identified in the following list.
- GDOT ATSPM website (source: https://traffic.dot.ga.gov/atspm)
- AADT database hosted by GDOT (source: https://www.dot.ga.gov/GDOT/Pages/RoadTrafficData.aspx)
- Google Maps (source: https://www.google.com/maps)
In addition to the mentioned sources, coordination with agency representatives was conducted to gather information that was not obtainable from the data sources mentioned. Table 18 through Table 20 summarize the data collected for selected GDOT ATSPM-operated arterials.
Table 18. Summary of variables per segment, for SR 8 (Harcourt Dr. to Montreal Rd.), Georgia.
| Category | Variable | SR 8 (Harcourt Dr. to Montreal Rd.), Georgia | ||||
|---|---|---|---|---|---|---|
| Location characteristics | Roadway ID number a | Not used for crash assignment in Georgia | ||||
| Segment number | 1 | 2 | 3 | 4 | 5 | |
| Milepost | Not used for crash assignment in Georgia | |||||
| Geo-coordinates | 33.817920, -84.267360 | 33.822606, -84.262886 | 33.826029, -84.256085 | 33.826666, -84.253886 | 33.827649, -84.251634 | |
| Volume characteristics | AADT volume for year 2017 | 33,000 | 33,000 | 33,000 | 33,000 | 33,000 |
| AADT volume for year 2018 | 32,000 | 32,000 | 32,000 | 32,000 | 32,000 | |
| AADT volume for year 2019 | 27,000 | 27,000 | 27,000 | 27,000 | 27,000 | |
| AADT volume for year 2020 | 21,300 | 21,300 | 21,300 | 21,300 | 21,300 | |
| AADT volume for year 2021 | 20,700 | 20,700 | 20,700 | 20,700 | 20,700 | |
| AADT volume for year 2022 – ATSPM Operational | 21,500 | 21,500 | 21,500 | 21,500 | 21,500 | |
| AADT volume for year 2023 | 26,000 | 26,000 | 26,000 | 26,000 | 26,000 | |
| Distribution of AADT by hour of day (24 values) | * | * | * | * | * | |
| Number of signalized intersections (N) | 6 | |||||
| Length of segment (feet) | 2183 | 2384 | 660 | 744 | 606 | |
| Number of through lanes on segment | 4 | 4 | 6 | 6 | 6 | |
| Posted speed limit on segment (mph) | 45 | 45 | 45 | 45 | 45 | |
| Median type on segment b | 2 | 2 | 1 | 1 | 2 | |
| # of four-leg signalized intersections on segment | 1 | 1 | 1 | 1 | 1 | |
| # of signalized intersections with a left turn bay | 2 | 2 | 1 | 1 | 1 | |
| # of signalized intersections with a crosswalk | 2 | 2 | 1 | 1 | 0 | |
| ATSPM characteristics | # of side street appr. with stop line detection | 1 | 4 | 2 | 2 | 2 |
| # of major-street left-turn bays with detection | 2 | 2 | 2 | 1 | 1 | |
| # of major-street appr. with advance detection | 2 | 2 | 2 | 2 | 2 | |
| # of major-street approaches with count detection | 2 | 2 | 2 | 2 | 2 | |
| Freq. of timing changes using ATSPMs for year 1c | 3 | 3 | 3 | 3 | 3 | |
| Freq. of timing changes using ATSPMs for year 2c | 3 | 3 | 3 | 3 | 3 | |
| Freq. of timing changes using ATSPMs for year 3c | 3 | 3 | 3 | 3 | 3 | |
a – Number used to identify crash records associated with segment.
b – 1 = undivided, 2 = raised curb, 3 = two-way left-turn lane.
c – 0 = one time change, 1 = change with alerts or during complaints, 2 = change approximately 3 months or longer, 3 = change approximately less than 3 months
* - extracted from ATSPM data where available or from permanent count stations and used for the CMF development
Table 19. Summary of variables per segment, for SR 8 (Lakeshore Dr. to Orion Dr.), Georgia.
| Category | Category | SR 8 (Lakeshore Dr. to Orion Dr.), Georgia | ||||||
|---|---|---|---|---|---|---|---|---|
| Location characteristics | Roadway ID number a | Not used for crash assignment in Georgia | ||||||
| Segment number | 1 | 2 | 3 | 4 | 5 | 6 | 7 | |
| Milepost | Not used for crash assignment in Georgia | |||||||
| Geo-coordinates | 33.77172, - 84.32503 | 33.77152, - 84.32114 | 33.77418, - 84.31622 | 33.776408, - 84.311198 | 33.776408, - 84.311198 | 33.77905, - 84.30901 | 33.78267, - 84.30585 | |
| Volume characteristics | AADT volume for year 2017 | 42000 | 42000 | 42000 | 42000 | 42000 | 42000 | 42000 |
| AADT volume for year 2018 | 42000 | 42000 | 42000 | 42000 | 42000 | 42000 | 42000 | |
| AADT volume for year 2019 | 38000 | 38000 | 38000 | 38000 | 38000 | 38000 | 38000 | |
| AADT volume for year 2020 | 28100 | 28100 | 28100 | 28100 | 28100 | 28100 | 35900 | |
| AADT volume for year 2021 | 30400 | 30400 | 30400 | 30400 | 30400 | 30400 | 30700 | |
| AADT volume for year 2022 – ATSPM Operational | 31600 | 31600 | 31600 | 31600 | 31600 | 31600 | 32000 | |
| AADT volume for year 2023 | 38000 | 38000 | 38000 | 38000 | 38000 | 38000 | 38000 | |
| Distribution of AADT by hour of day (24 values) | * | * | * | * | * | * | * | |
| Number of signalized intersections (N) | 15 | |||||||
| Length of segment (feet) | 1217 | 2216 | 1870 | 1052 | 1335 | 1165 | 1548 | |
| Number of through lanes on segment | 4 | 4 | 4 | 4 | 4 | 4 | 4 | |
| Posted speed limit on segment (mph) | 45 | 35 | 35 | 35 | 25 | 40 | 35 | |
| Median type on segment b | 0 | 0 | 0 | 0 | 0 | 0 | 0 | |
| # of four-leg signalized intersections on segment | 0 | 0 | 0 | 1 | 1 | 1 | 0 | |
| # of signalized intersections with a left turn bay | 0 | 0 | 0 | 1 | 1 | 1 | 1 | |
| # of signalized intersections with a crosswalk | 2 | 0 | 2 | 1 | 2 | 2 | 2 | |
| ATSPM characteristics | # of side street appr. with stop line detection | 2 | 2 | 2 | 2 | No Data | 4 | No Data |
| # of major-street left-turn bays with detection | 0 | 0 | 0 | 0 | No Data | 2 | No Data | |
| # of major-street appr. with advance detection | 2 | 2 | 2 | 2 | No Data | 2 | No Data | |
| # of major-street approaches with count detection | 2 | 2 | 2 | 2 | No Data | 2 | No Data | |
| Freq. of timing changes using ATSPMs for year 1c | 3 | 3 | 3 | 3 | 3 | 3 | 3 | |
| Freq. of timing changes using ATSPMs for year 2c | 3 | 3 | 3 | 3 | 3 | 3 | 3 | |
| Freq. of timing changes using ATSPMs for year 3c | 3 | 3 | 3 | 3 | 3 | 3 | 3 | |
| Freq. of timing changes using ATSPMs for year 4c | ||||||||
a – Number used to identify crash records associated with segment.
b – 1 = undivided, 2 = raised curb, 3 = two-way left-turn lane.
c – 0 = one time change, 1 = change with alerts or during complaints, 2 = change approximately 3 months or longer, 3 = change approximately less than 3 months
* - extracted from ATSPM data where available or from permanent count stations and used for the CMF development
| Category | Category | SR 8 (Lakeshore Dr. to Orion Dr.), Georgia | ||||||
|---|---|---|---|---|---|---|---|---|
| Location characteris tics | Roadway ID number a | Not used for crash assignment in Georgia | ||||||
| Segment number | 8 | 9 | 10 | 11 | 12 | 13 | 14 | |
| Milepost | Not used for crash assignment in Georgia | |||||||
| Geo-coordinates | 33.7849, - 84.30398 | 33.78787, - 84.29935 | 33.79352, - 84.29011 | 33.79520, - 84.28729 | 33.79859, - 84.28211 | 33.80027, - 84.28082 | 33.80363, - 84.2775 | |
| Volume characteris tics | AADT volume for year 2017 | 23700 | 23700 | 42000 | 42000 | 42000 | 62950 | 62950 |
| AADT volume for year 2018 | 23700 | 23700 | 42000 | 42000 | 42000 | 62950 | 62950 | |
| AADT volume for year 2019 | 21440 | 21440 | 38000 | 38000 | 38000 | 56960 | 56960 | |
| AADT volume for year 2020 | 23300 | 23300 | 41300 | 41300 | 41300 | 61900 | 61900 | |
| AADT volume for year 2021 | 25200 | 25200 | 36600 | 36600 | 36600 | 66900 | 66900 | |
| AADT volume for year 2022 – ATSPM Operational | 28900 | 28900 | 38100 | 38100 | 38100 | 67100 | 67100 | |
| AADT volume for year 2023 | 21440 | 21440 | 38000 | 38000 | 38000 | 56960 | 56960 | |
| Distribution of AADT by hour of day (24 values) | * | * | * | * | * | * | * | |
| Number of signalized intersections (N) | 15 | |||||||
| Length of segment (feet) | 1024 | 1745 | 3444 | 1012 | 1957 | 625 | 1585 | |
| Number of through lanes on segment | 4 | 4 | 5 | 6 | 6 | 6 | 6 | |
| Posted speed limit on segment (mph) | 40 | 40 | 40 | 40 | 40 | 40 | 40 | |
| Median type on segment b | 2 | 2 | 2 | 2 | 2 | 1 | 1 | |
| # of four-leg signalized intersections on segment | 1 | 1 | 2 | 1 | 0 | 0 | 0 | |
| # of signalized intersections with a left turn bay | 1 | 2 | 2 | 2 | 2 | 2 | 2 | |
| # of signalized intersections with a crosswalk | 2 | 2 | 2 | 2 | 1 | 1 | 2 | |
| ATSPM characteris tics | # of side street appr. with stop line detection | 2 | 2 | 4 | 1 | 2 | 2 | 2 |
| # of major-street left-turn bays with detection | 2 | 0 | 2 | 1 | 0 | 1 | 2 | |
| # of major-street appr. with advance detection | 2 | 2 | 2 | 2 | 1 | 2 | 2 | |
| # of major-street approaches with count detection | 2 | 2 | 2 | 2 | 1 | 2 | 2 | |
| Freq. of timing changes using ATSPMs for year 1c | 3 | 3 | 3 | 3 | 3 | 3 | 3 | |
| Freq. of timing changes using ATSPMs for year 2c | 3 | 3 | 3 | 3 | 3 | 3 | 3 | |
| Freq. of timing changes using ATSPMs for year 3c | 3 | 3 | 3 | 3 | 3 | 3 | 3 | |
| Freq. of timing changes using ATSPMs for year 4c | ||||||||
a – Number used to identify crash records associated with segment.
b – 1 = undivided, 2 = raised curb, 3 = two-way left-turn lane.
c – 0 = one time change, 1 = change with alerts or during complaints, 2 = change approximately 3 months or longer, 3 = change approximately less than 3 months
* - extracted from ATSPM data where available or from permanent count stations and used for the CMF development
Data Collection for Case A CMF Comparison Sites
For appropriate selection of comparison sites so that the non-ATSPM-operated sites have similar corridor characteristics, the research team considered a list of variables. The next sections describe the evaluation criteria for the comparison sites for each state along with the selected arterials for the comparison sites.
Comparison Site Selection in Virginia
For the selection of comparison sites in Virginia, given that both ATSPM-operated arterials are located in the Northern Virginia (NOVA) region, the research team initially reached out to NOVA region representatives to identify arterials that could be potentially utilized as comparison sites. Based on the discussions with the NOVA region representatives, it was found that almost all arterials in the NOVA region are within the ATSPM platform, and ATSPM reports are frequently used for operation and maintenance of traffic signals. Therefore, the research team coordinated with agency representatives from other regions for identification of comparison sites. Initially, three sites from Culpeper District (located in central Virginia) were examined, including US Route 250 (Ivy Rd), Route 29 (Seminole Trail) and Route 29 (S Seminole Trail). Table 21 shows a summary of relevant variables considered during the evaluation of arterials to identify comparison sites in Virginia. Based on the evaluation, none of these three sites were suitable for comparison sites as they have largely different operational characteristics. For instance, US Route 250 (Ivy Rd) was not selected as this section has one-lane per direction of travel, which has very distinctive traffic operations and safety performance when compared to multi-lane treatment sites. Route 29 (Seminole Trail) was also excluded as it has very high average signal spacing and large difference in speed limit.
In addition to the Culpeper District, coordination was conducted with the Salem District (located in southwest Virginia) to identify additional corridors as comparison sites. Based on the discussions, the research team identified five additional sites as potential candidates for comparison sites. These included Route 221 (Forest Rd), Route 419 (Electric Rd), Route 221 (Brambleton Ave), Route 460 (Challenger Ave), and Route 460B (N Franklin St). Table 21 shows a summary of relevant variables considered for these arterials. The table also highlights the treatment sites and selected comparison sites along with their corridor characteristics to allow for comparison.
For the selection of the comparison sites, Route 221 (Brambleton Ave) and Route 460B (N Franklin St) were excluded due to low exposure since 25 million vehicle miles (mvm) is the ideal target for selection (8.8 mvm for Route 221 and 6.1 mvm for Route 460B). Additionally, Route 460 (Challenger Ave) was excluded due to a very large average intersection spacing (4,430 feet) compared to the treatment sites. It should also be noted that the research team tried separating some of the long arterials by considering a subset of intersections to create conditions that are similar to the treatment sites. Rte 419 (Electric Rd) Partial shown in Table 21 is created as such to reduce average intersection spacing so that it could potentially be utilized as a comparison site to Gallow Road. However, reducing corridor length considerably lowered exposure on this site, and therefore not selected for the comparison site.
Based on the evaluation of various criteria as shown below, Route 221 (Forest Rd) and Route 419 (Electric Rd) were selected as comparison sites for Lee Hwy and Gallows Rd, respectively. The research team recognizes that some variables such as average signal spacing and speed limit between the comparison treatment and comparison sites do not match exactly. But given the overall similarity considering other variables such as median type, congestion level, and AADT, the research team decided to proceed with these arterials.
In addition to the variables considered and outlined in Table 21, the research team investigated the presence of long-term work zones and changes in geometric design, lane assignment and traffic control, as these changes may have considerable impacts on safety performance. Specifically, the research team considered the following criteria during this investigation for the selected analysis period:
- Presence of a “long-term work zone”, defined as a work zone that occupies a location for one month or more; or
- One or more through lanes have been added or removed for one or more major street segments; or
- One or more turn bays have been added to one or more signalized intersection approaches on the major street; or
- Median type has been changed for one or more major street segments; or
- Signal control has been added to one or more intersections.
These characteristics were investigated using Google Earth (Google Maps) historical imagery and in coordination with agency representatives. For comparison sites in Virginia, the research team confirmed that none of these criteria existed during the analysis period for the selected comparison sites.
Table 21. Summary of variables for comparison sites in Virginia.
| Type of Site | Corridors | Median Type a | AADT | # Of Lanes | AADT per Lane | Exposure (mvm) b | Average Signal Spacing (ft) | Speed Limit (mph) | # of Signals | Length (miles) |
|---|---|---|---|---|---|---|---|---|---|---|
| Treatment 1 | Lee Hwy | 2 | 24,800 | 2/2 | 6,200 | 17.6 | 1,283 | 40 | 9 | 1.9 |
| Comparison 1 - Selected | Rte 221 (Forest Rd) | 2 | 26,000 | 2/2 | 6,500 | 36.7 | 2,880 | 45 | 7 | 3.9 |
| Treatment 2 | Gallows Rd | 1 | 28,650 | 3/3 | 4,775 | 13.3 | 744 | 35 | 10 | 1.3 |
| Comparison 2 - Selected | Rte 419 (Electric Rd) | 1 | 25,000 | 2/2 | 6,250 | 28.8 | 2,382 | 45 | 8 | 3.2 |
| Comparison - Excluded | Rte 250 (Ivy Rd) | 2 | 12,000 | 1/1 | 6,000 | 7.6 | 1,522 | 45 | 7 | 1.7 |
| Comparison - Excluded | Rte 29 (Seminole Trail) | 1 | 35,000 | 2/2 | 7,625 | 82.3 | 6,800 | 55; 45 | 6 | 6.4 |
| Comparison - Excluded | Rte 29 (S Seminole Trail) | 1 | 18,300 | 2/2 | 4,625 | 25.9 | 5,127 | 55; 35 | 5 | 3.9 |
| Comparison - Excluded | Rte 221 (Brambleton Ave) | 2 | 18,500 | 2/2 | 4,625 | 8.8 | 1,712 | 35 | 5 | 1.3 |
| Comparison - Excluded | Rte 419 (Electric Rd) Partial | 1 | 25,000 | 2/2 | 6,250 | 10.2 | 1,480 | 45 | 5 | 1.1 |
| Comparison - Excluded | Rte 460 (Challenger Ave) | 1 | 27,600 | 2/2 | 6,900 | 33.8 | 4,430 | 45 | 5 | 3.4 |
| Comparison - Excluded | Rte 460B (N Franklin St) | 1 | 19,000 | 3/3 | 3,080 | 6.1 | 930 | 45 | 6 | 0.9 |
a – 1 = undivided, 2 = raised curb, 3 = two-way left-turn lane.
b – Exposure = segment length in miles x AADT x 365 / 1,000,000 (mvm)
Comparison Site Selection in Utah
Similarly to the NOVA region in Virginia, all state-owned signals are ATSPM operated in Utah. In discussions with the UDOT staff, it was found that even some local jurisdictions use ATSPMs for operations and maintenance of signals. As a result, finding arterials that do not use ATSPMs was a main challenge for the comparison site selection in Utah.
In coordination with UDOT representatives, three arterials within Salt Lake County that do not use ATSPMs for operations and maintenance of signals were proposed as potential candidates for comparison sites. These included 3100S, 6200 South, and E 11400 S.
Site 6200 South was excluded due to two reasons: (1) traffic signals during midday peak are not coordinated while both ATSPM-operated arterials are coordinated during midday, and (2) during AM and PM peak, due to presence of schools, there is frequent congestion and queuing on the corridor. Sites 3100S and E 11400 S, shown in Table 22, were selected as comparison sites for SR 71 and SR 266, respectively.
For the 3100S site, a portion of the arterial was derived from the originally defined site to eliminate segments with one travel lane per direction. This reduced the exposure from 13.9 mvm to 10.4 mvm). The research team recognizes that such exposure is lower than ideal, however, by increasing analysis years, exposure can be increased and be closer to the target 25 mvm exposure. Given the limited available arterials that could be considered for comparison sites and considering other variables of interest are generally well aligned with treatment sites, the research team decided to proceed with the selected sites as shown in Table 22.
Table 22. Summary of variables for comparison sites in Utah.
| Type of Site | Corridors | Median Type a | AADT | # Of Lanes | AADT per Lane | Exposure (mvm) b | Average Signal Spacing (ft) | Speed Limit (mph) | # of Signals | Length (miles) |
|---|---|---|---|---|---|---|---|---|---|---|
| Treatment 1 | SR 71 | 1;2 | 34,600 | 2/2; 3/3 | 8,650; 5,700 | 58.4 | 1,745 | 40 | 15 | 4.63 |
| Comparison 1 - Selected | SR 3100 S Partial | 2 | 19,000 | 2/2 | 4,750 | 10.4 | 1,980 | 35 | 5 | 1.50 |
| Treatment 2 | SR 266 | 2;1 | 40,600 | 2/2 | 10,150 | 22.2 | 1,585 | 40 | 6 | 1.50 |
| Comparison 2 - Selected | E 11400 S | 2 | 25,000 | 2/2 | 6,250 | 18.0 | 1,735 | 40 | 7 | 1.97 |
| Comparison - Excluded | SR 3100 S | 2 | 15,200 | 2/2, 1/1 | 3,800 | 13.9 | 2,200 | 35 | 7 | 2.50 |
a – 1 = undivided, 2 = raised curb, 3 = two-way left-turn lane.
b – Exposure = segment length in miles x AADT x 365 / 1,000,000 (mvm)
Similar to the VDOT arterials, the comparison sites in Utah did not have long term work zones or a major change in lane configuration, median type, or signal control mode.
Comparison Site Selection in Georgia
Based on discussions with GDOT representatives, the research team was provided with two sites for comparison to the ATSPM-operated arterials. These are SR 120 arterial and SR 9 arterial. Based on the comparison of key variables, as shown in Table 29 below, these corridors were considered to be feasible for CMF development.
Table 23. Summary of variables for comparison sites in Georgia.
| Type of Site | Corridors | Median Type a | AADT | # Of Lanes | AADT per Lane | Exposure (mvm) b | Average Signal Spacing (ft) | Speed Limit (mph) | # of Signals | Length (miles) |
|---|---|---|---|---|---|---|---|---|---|---|
| Treatment 1 | SR 8 (N) | 2;3 | 27,000 | 2/2; 3/3 | 6,750; 4,500 | 102 | 1,370 | 45 | 5 | 1.30 |
| Comparison 1 - Selected | SR 120 | 2;3 | 25,000 | 3/3 | 4,170 | 77 | 880 | 45 | 6 | 1.00 |
| Treatment 2 | SR 8 (S) | 1;2;3 | 38,000 | 2/2; 3/3 | 9,500; 6,330 | 359 | 1,500 | 35/40/45 | 13 | 3.70 |
| Comparison 2 - Selected | SR 9 | 3 | 30,000 | 2/2 | 7,500 | 270 | 1,410 | 40 | 12 | 3.20 |
a – 1 = undivided, 2 = raised curb, 3 = two-way left-turn lane.
b – Exposure = segment length in miles x AADT x 365 / 1,000,000 (mvm)
Crash Data Collection Summary for Case A CMF Development
The research team collected historical crash data from Virginia, Utah, and Georgia for inclusion in the development of case A CMFs. This section provides a summary of the data collection activities and presents findings to demonstrate the way crash data was assigned to ATSPM-operated arterials.
Crash Data Collection in Virginia
The team obtained crash data from the entire state of Virginia for the period January 2015 to December 2023. All variables describing the crash event, roadway, driver and vehicle are included in the crash data, as listed in Table 24.
Table 24. Crash data variables.
| Database | Variable |
|---|---|
| Crash characteristics | Roadway ID number associated with crash Milepost of crash occurrence Geo-coordinates of crash occurrence Date of crash (crash must occur during the data time period) Time of crash Crash type or manner of collision First contributing factor or harmful event Relationship to junction Number of involved vehicles, pedestrians, and bicycles Crash severity (KABCO scale) |
| Roadway characteristics | Road surface condition Work zone presence or status |
| Driver characteristics | Condition at time of crash |
| Vehicle characteristics | Vehicle 1 movement or direction of travel Vehicle 2 movement or direction of travel |
Data Time Period
The data time period included at least three consecutive years of data for the “before” period and at least one year of data for the “after” period. For each signal system pair (i.e., ATSPM-operated system and its comparison site), the data time period included the same calendar years. For Virginia, treatment and comparison sites included crash data in 2017, 2018, and 2019 in the before period, and 2021 and 2022 in the after period. Note that there was a data gap between the before and after period. This was because an acclimation period was used after the implementation of ATSPMs to separate the before and after periods.
Crash Data Assignment
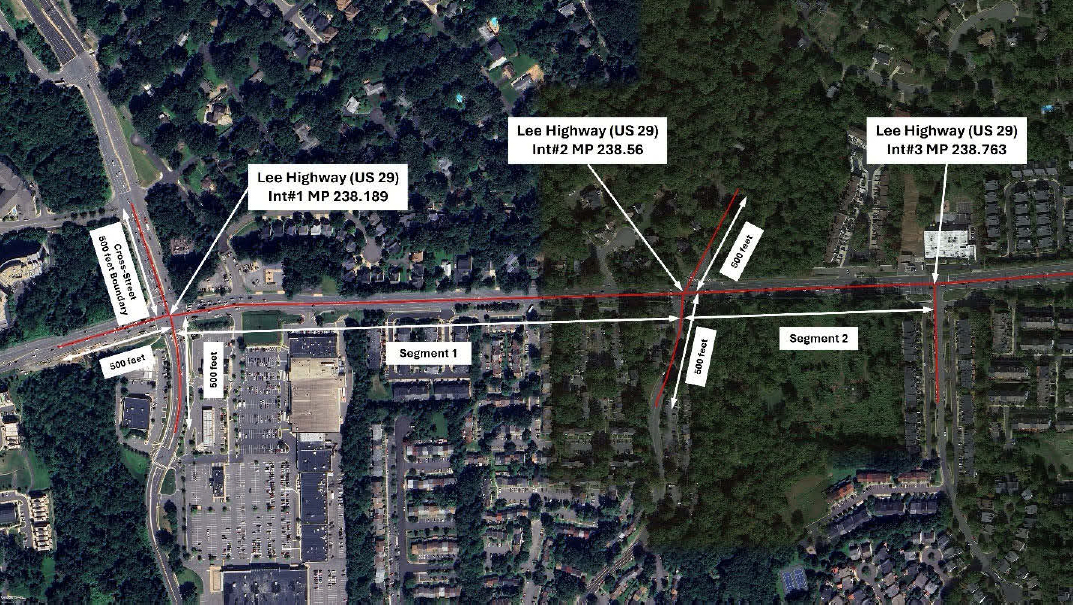
The crash data needed for case A CMF development included all crashes that occur within the boundaries of the arterial street study site during the data time period. The boundaries of a study site included segments between signalized intersections, the cross-street legs of each signalized intersection (for a distance back 500 ft), and the external major-street leg at the first and last signalized intersection of the corridor (for a distance back 500 ft), as also described earlier in the Data Structure and Site Selection Plan section.
Figure 7 illustrates the first two segments and three intersections on the Lee Highway (US 29) ATSPM-operated corridor in Virginia. The crash data was assigned to each study segment based on the milepost information.
Crash Data Collection in Utah
The research team obtained crash data from the state of Utah for the period January 2010 to December 2023. Similar to the VDOT study sites, all variables listed in Table 24 were obtained for the Utah sites.
Data Time Period
Utah SR 71 ATSPM corridor and comparison site included crash data in 2017, 2018 and 2019 in the before period, and 2021 and 2022 in the after period. Utah SR 266 ATSPM corridor and comparison site included crash data in 2016, 2017 and 2018 in the before period, and 2020 and 2021 in the after period.
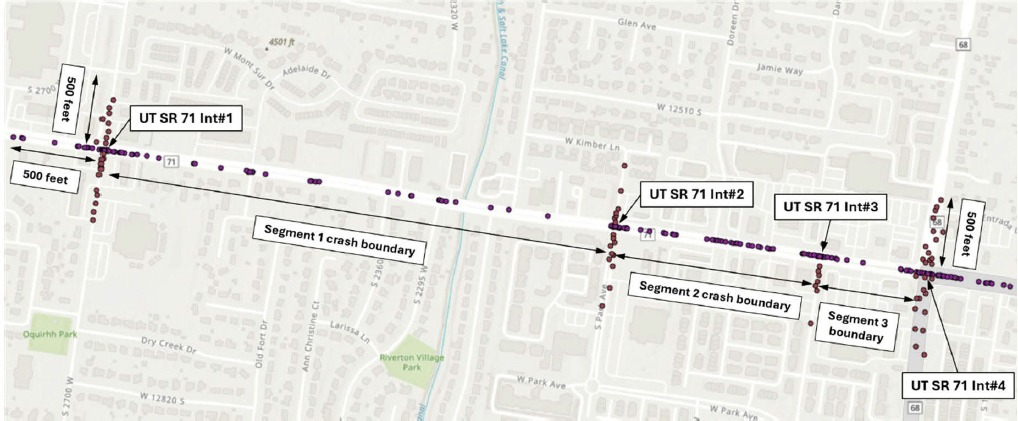
Crash Data Assignment
Figure 8 shows the first few segments and intersections on the ATSPM corridor SR 71 in Utah. The team created crash data shapefiles based on the latitude and longitude information provided in the crash data package. The research team screened the crash data to exclude winter weather related crashes with weather condition variables snow and blowing snow. The Utah crash data was assigned to each segment based on the geolocations in ArcGIS Pro. For example, the geocoordinate of the center of an intersection along the study corridor was identified first. The crashes occurred between the boundaries of the two consecutive intersections were assigned to corresponding segment.
Crash Data Collection in Georgia
Crash data for Georgia was made available to the research team through the Georgia Electronic Accident Reporting System (GEARS) website (www.gearsportal.com). This website allows registered users to query the reported crashes and obtain detailed crash data at the crash, vehicle (unit), and person levels. Crash data for the period between January 1, 2018 and December 31, 2023 were queried and downloaded. Similar to the VDOT study sites, all variables listed in Table 24 were obtained for the Georgia sites.
Data Time Period
SR 8 (Harcourt Dr to Montreal Rd E) ATSPM corridor and comparison site included crash data from 1/1/2017 to 6/30/2020 in the before period, and from 1/1/2021 to 12/31/2023 in the after period. This approach was used because the ATSPM was functional for several months before 1/1/2021 in this corridor. The same data time period was used for the SR 8 (Lakeshore Dr to Orion Dr) ATSPM corridor. Note that because the month of the ATSPM deployment was provided to the research team for the Georgia sites, a 6-month acclimation period was used in Georgia while the research team used one-year acclimation period when the month of the ATSPM deployment was unknown.
Crash Data Assignment
Similar to the crash data assignment in Utah, the research team used the latitude and longitude information provided in the crash data package. The research team also screened the crash data to exclude crashes due to extreme conditions such as work zone related crashes.
Case B CMF Data Collection and Reduction Summary
This section describes the data collection and reduction efforts conducted for case B CMF development.
Intersection Variables Data Collection Summary
To the extent possible, the research team used the data that has already been collected for the case A CMF development. This was to minimize the level of data collection effort as the research team has already summarized variables describing intersection approaches such as volume characteristics data and intersection characteristics data. However, the team also recognizes that not all the ATSPM-operated arterials have the appropriate detection scheme to be able to generate all four ATSPM reports that will be
used for case B CMF development. Additionally, VDOT was unable to provide the research team with the raw high-resolution signal controller logs, which was necessary to summarize ATSPM metrics for each hour of the typical weekday. To address this issue and increase the number of data collection states so that the developed CMFs can be applied nationally, the research team reached out to additional agencies to identify other intersections for inclusion in case B CMF development.
Table 25 displays the agencies that the research team collected data from for each ATSPM report for the case B CMF development. Additionally, the table shows the ATSPM reports that can be generated by each agency for the selected corridors. A few items that are important to highlight are described in the following list.
- For B2. Yellow and Red Actuation ATSPM reports, based on the discussions with agencies, it was noted that only Utah corridors have the appropriate detection scheme to be able to generate this ATSPM report. As a result, during the case B CMF development, the research team collected all intersection approaches data from Utah for Case B2 CMF development.
- For B4. Left Turn Gap Analysis, due to the unique detection scheme required to generate this ATSPM report, only Georgia intersections can generate this report. As a result, the research team collected data for all intersection approaches from Georgia for Case B4 CMF development.
Table 25. Case B CMF data collection summary and ATSPM Reports that can be generated.
| Agency | ATSPM Report for Case B CMF | |||
|---|---|---|---|---|
| B1. Percent arrivals on green | B2. Yellow and red actuation | B3. Split failure | B4. Left turn gap analysis | |
| Utah DOT | X | X | X | N/A |
| Georgia DOT | X | N/A | X | X |
| Concord, North Carolina | X | N/A | X | N/A |
ATSPM Data Collection Summary
The team collected raw high-resolution signal controller data and detector mapping data to support development of case B CMFs. In addition to the raw high-resolution signal controller data, the research team obtained detector mapping from agencies.
Summary of ATSPM Data Collected from Agencies
To produce the four case B CMFs that describe the association between use of specified ATSPM reports and the change in traffic safety, raw high-resolution signal controller data were collected from UDOT, GDOT, and Concord, NC. Table 26 provides a summary of the collected high-resolution signal controller data.
Table 26. Case B CMF ATSPM data collection summary.
| Source Agency | Number of Intersections | Years of Data | Data Used for Case B CMFs |
|---|---|---|---|
| Utah DOT | 15 | 2021, 2022, 2023 | B1. Percent arrivals on green B2. Yellow and red actuation B3. Split failure |
| Georgia DOT | 18 | 2021, 2022, 2023 | B1. Percent arrivals on green B3. Split failure B4. Left turn gap analysis |
| Concord, North Carolina | 9 | 2022, 2023 | B1. Percent arrivals on green B3. Split failure |
Script Development and Verification to Analyze Raw ATSPM Data
The research team developed scripts to process and analyze the raw high-resolution signal controller data. Verification was conducted to ensure the developed scripts accurately process the data and generate the target metrics for the case B CMF development.
Verification of the developed ATSPM script to process and analyze the data was conducted using a sample of data that was available to the research team from GDOT (different from the ATSPM data provided to the team for this research). The data was from one of the GDOT corridors that included 14 signalized intersections. Single day of data (November 29, 2021) was utilized for the verification process. Next sections present results of the verification process.
B1. Percent Arrivals on Green
Figure 9 shows the percent-arrivals-on-green (AoG) along with the percent-green-proportion (GT) and platoon ratio at Intersection #1386 for Phase 6 during the AM peak (6-9 AM), Plan 10. The results shown here were obtained from GDOT’s open-source platform. The same metric was also calculated by the research team for phase at the same intersection. The calculated metric is shown in Figure 10. A comparison of the results in these two figures suggest that the metrics calculated by the research team are similar to those from the GDOT platform. The research team also compared similar results for several other intersections and similar results were obtained.


B2. Yellow and Red Actuation
The Yellow and Red Actuation metric was not available in GDOT’s open-source platform. This is because the Yellow and Red Actuation metric requires special detection setting, which is not used by GDOT at signalized intersections. Therefore, the research team was unable to verify the Yellow and Red Actuation calculations using the GDOT data. Additionally, the team was unable to verify the script outputs by comparing them to the UDOT’s open-source platform. This is because the open-source platform by UDOT only allows going back a few months while our latest high-resolution data was from 2023. As a result, instead of conducting quantitative comparisons, the team conducted qualitative comparisons using our judgment to ensure script outputs are generally reasonable. Some of these comparisons included the change in the number of yellow and red actuations over different times of the day (e.g., late night versus during the day) as well as exploring percent yellow and red actuations during different time periods.
B3. Split Failure
The number of split failures were obtained for verification purposes from the select intersections in Georgia and compared using the open-source platform and the script generated by the research team. Phase 1 split failures were used at Intersection #1387 for the comparison. Figure 11 shows the total number of split failures between 6 AM and 7 PM for Phase 1 using the open-source platform. The same results are also displayed in Figure 12 using the script developed by the team. Results show that both the open-source platform and the script generated the same number of split failures (18 split failures) and their distribution over the hours are also identical.
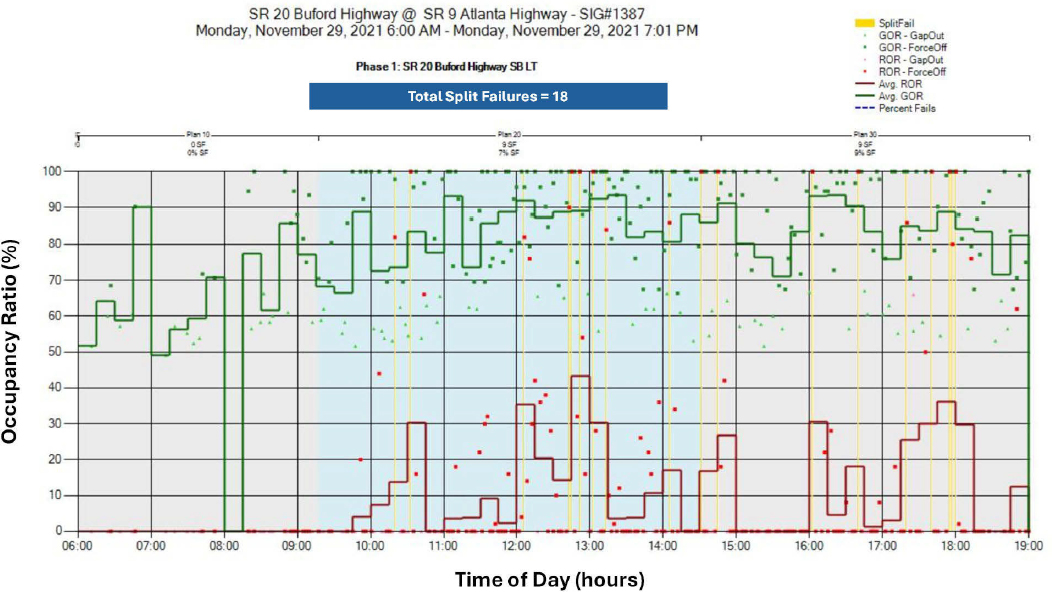

B4. Left Turn Gap Analysis
The verification of the left turn gap analysis metric was conducted by comparing the % of large gaps (i.e., gaps that are greater than 7.4 seconds) at Intersection #1383 for Phase 6 from a single day. Figure 13 displays the % of large gaps for Phase 6 using the GDOT’s open-source platform. Figure 14 displays the % of large gaps using the script developed by the team. Results show that for Phase 6, the % of large gaps are close to 100% at night with both methods in which it drops considerably at 8 AM. This behavior can also be observed both with the open-source platform and the script developed by the team.


Crash Data Collection Summary for Case B CMF Development
For case B CMF development, the research team used historical crash data obtained from Utah and Georgia as described earlier. Additionally, the research team obtained crash data from North Carolina since case B CMFs also include data from Concord, NC. Because crash data collection efforts from Utah and Georgia have already been presented earlier, this section only summarizes crash data collection in North Carolina.
Crash Data Collection in North Carolina
The team obtained crash data from the entire state of North Carolina from January 2021 to December 2023. All essential crash variables describing crash, roadway, driver and vehicle are included in the crash data. In addition, North Carolina DOT has crash report instruction manual that provides additional information related to the way all law enforcement officers report motor vehicle crashes in North Carolina (Microsoft Word - 349_Instruction_Manual[1].doc (ncdot.gov)). The research team reviewed this document to better understand how each crash is recorded in North Carolina.
Data Time Period
The data time period included at least three consecutive years of data for each intersection approach when ATSPMs are in operation. In Concord, NC, based on our discussion with agency representatives, they have been using ATSPMs for signal operations and maintenance since 2020. Therefore, intersection approaches included crash data in 2021, 2022, and 2023. Note that while the ATSPM was in operation since 2020, due to the data storage issues, only two years of ATSPM data was provided to the research team (2022 and 2023). As a result, during the development of case B CMFs, two years of crash data were used, as discussed later.
Crash Data Assignment
The crash data needed for case B CMF development (both for the sites in Concord, NC and other sites from different jurisdictions) included all crashes that occur within the boundaries of the intersection leg during the data time period. As discussed earlier, the boundary of the leg extends from the center of the intersection to a distance of 400 feet back from the intersection. Detailed investigation was conducted during the assignment of crashes to intersection legs (see Chapter 4). The research team also screened the crash data to exclude crashes due to extreme conditions such as work zone related crashes.


