Cooperating with Nature: Confronting Natural Hazards with Land-Use Planning for Sustainable Communities (1998)
Chapter: 5 Hazard Assessment: The Factual Basis for Planning and Mitigation
CHAPTER FIVE
Hazard Assessment: The Factual Basis For Planning And Mitigation
ROBERT E. DEYLE, STEVEN P. FRENCH, ROBERT B. OLSHANSKY, AND ROBERT G. PATERSON
TRADE-OFFS BETWEEN RISKS are inherent to the land use management choices made by property owners, planners, and government officials for areas subject to natural hazards. Prospective property owners choose whether to invest in property and how to use the land they purchase. They make choices about design of the site and the structures built there, construction materials, and insurance. Local officials, with input from land use planners, make comparable choices about where to direct land uses and where to provide public infrastructure and facilities to support private land use. In making such choices, they face trade-offs between risks to public safety and public and personal property on the one hand, and economic benefits that may result from developing hazardous areas on the other. Local officials, as well as state and federal officials, also make choices about how to reduce the risks associated with development in hazardous areas. Choices may be the unintended or unconsidered result of official action, rather than the result of deliberately weighing the benefits and risks of alternatives. Indeed, choices involving risk are frequently made in the face of substantial misunderstand-
ings or uncertainty about the severity or likelihood of adverse consequences.
Sustainable land use cannot be achieved for hazardous areas when decision making is not adequately informed about risk. To make informed choices, local officials and their constituents must know how many people are subject to injury, how many structures can be damaged, and how much infrastructure can be lost, as well as the likelihood that such impacts will occur. They also must understand how changes in land use can affect natural hazards themselves. Hazard assessment is intended to provide the factual basis for estimating the likely costs and benefits of alternative land use scenarios and various strategies for reducing risks. Knowledge of the risks posed by extreme natural events and an understanding of how such knowledge can influence human behavior are, therefore, central to assessing the potential of land use planning and management strategies for achieving safer, more sustainable communities.
This chapter examines the choices that face local officials when they use hazard assessment, and summarizes the state of practice and the state of the art in applying hazard assessment to evaluate and implement alternative land use planning and management strategies. We begin by explaining the basic concepts and levels of hazard assessment and discussing how hazard assessment can be and is used in land use planning and management. We then examine the choices that must be made in applying hazard assessment, including choices about the precision and geographic scale of analysis, temporal perspective and boundaries, and the level of hazard assessment to use. We follow our discussion of these choices with a review of the state of knowledge and information used in hazard assessment, and a detailed summary of the state of practice for floods, earthquakes, landslides, hurricanes and coastal erosion, and wildfire.
This discussion leads to several conclusions. First, the form of hazard assessment that is most often used at present is hazard identification, which is the essential foundation for managing land use in hazardous areas. Communities make considerably less use of vulnerability assessments to predict the impacts of natural hazards, and they rarely use formal risk analysis. Second, the advent of geographical information systems and digitized land use data has opened the way for the development and use of probabilistic risk analysis to predict the impacts of natural hazards and assess the costs and benefits of alternative plans and land use management strategies. Third, the principal obstacles to greater use
of these capabilities appear to be: (1) limited knowledge of the probabilities, magnitudes, and locations of some types of extreme natural events; (2) lack of parcel-specific data on relevant attributes of land uses such as the type, design, and construction of buildings; (3) lack of empirically validated data on hazard effects (referred to as damage functions) that are accurate at the building or infrastructure-component level for some natural hazards; (4) lack of professional expertise to incorporate sophisticated risk analysis models into land use decision making; and (5) lack of understanding and confidence in these models by appointed and elected officials.
APPLYING HAZARD ASSESSMENT TO LAND USE PLANNING AND MANAGEMENT
The first step in appreciating the potential utility of hazard assessment is to understand how it is conducted and how it has been used and can be applied to land use planning and management. The terminology of hazard assessment is muddied by inconsistent definitions and usage of key terms such as ''hazard," "vulnerability," and "risk." In this chapter we use the following definitions: Hazard refers to an extreme natural event that poses risks to human settlements. Vulnerability is the susceptibility of human settlements to the harmful impacts of natural hazards. Impacts of concern include injuries and deaths to human populations; damage to personal property, housing, public facilities, equipment, and infrastructure; lost jobs, business earnings, and tax revenues, as well as indirect losses caused by interruption of business and production; and the public costs of planning, preparedness, mitigation, response, and recovery. Risk is "the possibility of suffering harm from a hazard" (Cohrssen and Covello, 1989, p. 7).
Hazard assessment can be conducted at three levels of sophistication:
Hazard identification, which defines the magnitudes (intensities) and associated probabilities (likelihoods) of natural hazard that may pose threats to human interests in specific geographic areas.
Vulnerability assessment, which characterizes the exposed populations and property and the extent of injury and damage that may result from a natural hazard event of a given intensity in a given area.
Risk analysis, which incorporates estimates of the probability of
various levels of injury and damage to provide a more complete description of the risk from the full range of possible hazard events in the area.
All three levels of hazard assessment are necessary to realize the full potential of the process. However, each level provides information that is useful in its own right.
Many land use planning and development management applications use information generated from hazard identification or vulnerability assessment rather than full-scale risk analysis. All three levels of hazard assessment may be used not only for future land use planning but also for redevelopment planning and regulation of existing land uses. When applied to future land use, these techniques may be used to identify and avoid potential problems associated with developing hazardous areas. This is the practice of identifying "critical areas" where development should be restricted or regulated by strict performance standards, such as floodplains, seismic fault areas, and areas prone to wildfires.
Where land already has been developed, these techniques may be used to justify the imposition of requirements on existing development, to define areas where such controls are necessary, and to assess the benefits of other means of mitigating hazards. For example, building codes designed to reduce the risk of significant structural damage have been applied retroactively to existing buildings subject to earthquake damage in Los Angeles and Palo Alto, California. Within designated hazard zones, structures that are damaged beyond a specified threshold, such as 50 percent of market or replacement value, are often required to be rebuilt to current codes, which include measures to reduce vulnerability to natural hazards.
Degree of Use of the Three Levels of Hazard Assessment
Table 5-1 presents estimates of the extent to which the three levels of hazard assessment are used in the formulation, design, or justification of various land use planning and management tools. The table was constructed using a modified Delphi technique with the authors of this volume, based on their familiarity with the practice of planning for hazardous areas. Table 5-1 indicates that hazard identification is the most widely used form of hazard assessment. Hazard identification may be directly incorporated into a planning or management tool, as in the designation of hazardous area overlay zones or the specification of hazard setbacks in subdivision ordinances. Vulnerability assessments are used
TABLE 5-1 Use of Hazard Assessment in Land Use Planning and Management
primarily to build support for hazard management policies and programs. Their potential for evaluating the relative benefits of alternative policies has not yet been realized fully. Full-scale risk analyses have not been used extensively, possibly because planners and local officials are less familiar with risk analysis concepts and methods, and because of the relative paucity of land use management tools that are based on risk rather than vulnerability.
Hazard Identification
Hazard identification, the essential foundation upon which all hazard assessment is based, is the process of estimating the geographic extent of the hazard, its intensity, and its probability of occurrence. Geographic extent may vary with the magnitude of the event, as with riverine flooding, but this is not always the case. For instance, stronger hurricanes do not necessarily affect larger geographic areas than hurricanes with higher central pressures and lower wind speeds.
Intensity refers to the damage-generating attributes of a hazard. For example, water depth and velocity are commonly used measures of the intensity of a flood. For hurricanes, intensity typically is characterized with the Saffir/Simpson scale, which is based on wind velocity and storm surge depths (see Table 5-2). The absolute size of an earthquake is given by its Richter magnitude (and other similar magnitude scales), but its effects in specific locations are described by the Modified Mercalli Intensity (MMI) Scale (see Table 5-3). Earthquake intensity is also ascertained by physical measures such as peak ground acceleration (expressed as a decimal fraction of the force of gravity, e.g., 0.4 g), peak velocity, or spectral response, which characterizes the frequency of the energy content of the seismic wave. For wildfires, intensity can be expressed as fire line intensity (a measure of the rate at which a fire releases heat, or the unit length of the fire line); the rate of fire spread (feet per second); and flame length. A more qualitative intensity measure is based on the primary fuels being burned. Three classes are defined: (1) ground or subsurface fires, which are the lowest intensity and most controllable forms of combustion; (2) surface fires, which can be of low or high intensity depending on environmental conditions and fuel characteristics; and (3) crown fires, which are largely uncontrollable through traditional suppression methods and which have various intensity levels of their own.
TABLE 5-2 Saffir/Simpson Hurricane Scale
Storm Category | Wind Speed (mph) | Storm Surge (ft) |
1 | 74-95 | 4-5 |
2 | 96-110 | 6-8 |
3 | 111-130 | 9-12 |
4 | 131-155 | 13-18 |
5 | > 155 | > 18 |
TABLE 5-3 Modified Mercalli Intensity Scale (Earthquakes)
Intensity | Detectability/Level Impact |
I | Detected only by sensitive instruments |
II | Felt by a few persons at rest, especially on upper floors |
III | Felt noticeably indoors, but not always recognized as a quake |
IV | Felt indoors by many, outdoors by a few |
V | Felt by most people |
VI | Felt by all, many frightened and run outdoors, damage small |
VII | Everybody runs outdoors, damage to buildings varies |
VIII | Panel walls thrown out of frames, fall of walls and chimneys |
IX | Buildings shifted off foundations, cracked, thrown out of plumb |
X | Most masonry and framed structures destroyed, ground cracked |
XI | New structures still standing, bridges destroyed, ground fissures appear |
XII | Damage total, waves seen on ground surface |
SOURCE: Jaffe et al., 1981, p. 61. | |
The likelihood or probability of a hazard occurring usually is calculated on an annual basis, for example, a 10 percent chance of a particular area being struck by a Category 1 hurricane (Saffir/Simpson scale) or a level VI intensity earthquake (Modified Mercalli scale) in a given year. For many hazards, likelihood often is expressed as a recurrence interval, such as a 100-year storm (a storm with a 1 percent annual probability) or a 475-year earthquake (a 0.2 percent annual probability).
Hazard identification typically takes the form of hazard maps. These may be prepared for a single scenario for an extreme event of a specified intensity such as a 100-year flood, or for the composite of several levels of hazard, defined by intensity or probability, such as hurricane storm surge maps. Hazard maps also may indicate areas that are subject to a particular natural hazard over a range of intensities and probabilities, such as the Boulder County (Colorado) Wildfire Hazard Information Mitigation System which uses a hazard model based on geographic information system technology to assign hazard ratings, on a scale of 0 to 10, to neighborhoods, structures, and lots (Boulder County Land Use Department, 1994).
The Flood Insurance Rate Maps produced by the National Flood Insurance Program are the most familiar example of hazard identification (see Figure 5-1). They delineate the floodway and the floodplain for the 100- and 500-year floods and provide contours that depict flood elevations within the 100-year floodplain. Hurricane storm surge maps follow a different approach, depicting the areas subject to storm surge

FIGURE 5-1 Reproduction of a portion of a Flood Insurance Rate Map for Kauai County, Hawaii. Key: Zone AE = area of 100-year flood; Zone VE = area of 100-year coastal flood with velocity (wave) action; Zone X = area of undetermined but possible flood; elevations (e.g., EL 13) = Base (100-year) flood elevation in feet [NGVD = National Geodetic Vertical Datum]; A = symbol for cross sections used to compute base flood elevations; M25 = river (coast) mile marker; ![]() = floodway area (the channel of a river or other watercourse plus any adjacent floodplain areas that must be kept free of encroachments so that the 100-year flood discharge can be conveyed without increasing the elevation of the 100-year flood more than a specified amount).
= floodway area (the channel of a river or other watercourse plus any adjacent floodplain areas that must be kept free of encroachments so that the 100-year flood discharge can be conveyed without increasing the elevation of the 100-year flood more than a specified amount).
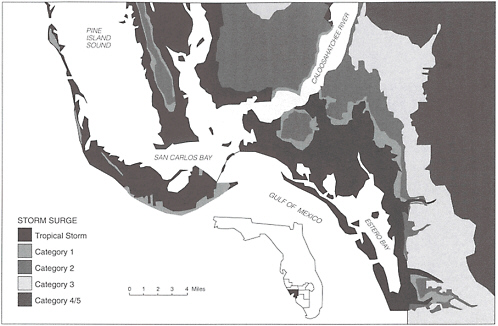
flooding from hurricanes at each of the Saffir/Simpson scale intensities (see Figure 5-2). The probabilities for the individual storm categories vary substantially from one location to another.
Demarcations of earthquake and landslide hazards are not as standardized as flood maps. California's Alquist-Priolo Earthquake Fault Zoning Act (Calif. Public Resources Code, section 2621) defines earthquake fault-zone areas based on proximity to a fault that has been active within the past 10,000 years. Landslide hazard zones are defined either as (1) on or downhill from an active or potentially active landslide deposit, or (2) in geologic terrains that are known to be prone to landslides. These designations are not based on any specific recurrence interval or hazard intensity measure.
Simple hazard identification can be quite an effective tool for land use planning and management. Hazard identification is necessary for providing public information and for building commitment among elected officials. Awareness of hazards and their locations is the first step toward initiating land use solutions for the problems they pose. Hurricane storm surge maps defining evacuation zones are widely disseminated in hurricane-prone communities. Earthquake ground-shaking maps have been disseminated both in hard copy and on the Internet to inform the general public and local officials of earthquake hazard areas in northern California. Several states also use hazard maps to define the boundaries within which hazards must be disclosed. For example, California has an earthquake hazard disclosure requirement tied to real estate transactions in designated active fault zones. Massachusetts has proposed a similar requirement for property subject to coastal hazards.
Maps of hazards often are used in planning documents to demarcate areas within which specific land use policies are to be applied. For instance, Florida's 1985 growth management legislation requires communities to define coastal high-hazard areas within which they must analyze vulnerability and for which they are required to develop hazard mitigation goals, objectives, and policies as part of their comprehensive plans. The statute requires localities to base their delineation of the coastal high-hazard area on the area subject to flooding by storm surge associated with a Category 1 hurricane. The California Seismic Hazards Mapping Act requires that localities include seismic hazard maps in their general plans (Calif. Public Resources Code, chapter 2690).
Hazard maps also are used to define the area within which specific land use management tools are applied. Communities that participate in the National Flood Insurance Program prohibit development within the 100-year floodway and apply special building code provisions to structures built within the 100-year floodway fringe. Local governments in Florida are required to adopt and enforce certain minimum building code standards for flood-damage prevention and wind resistance within an area designated as the "coastal building zone." The zone is based on the 100-year velocity zone defined under the National Flood Insurance Program and, in areas with sandy shorelines, a setback from the area subject to erosion by a 100-year storm. Similarly, several coastal states define a zone subject to coastal erosion or flooding of a specified magnitude and probability as an area within which permits are required for land development or where other restrictions apply, such as setbacks from the mean high-water line. Model building codes include seismic hazard maps with
zones that indicate the level of ground shaking that should be incorporated into equations for structural design. Portland (Oregon) is using seismic hazard maps to set priorities in implementing the state's new seismic-retrofit law.
Hazard identification also can be used to define areas in which more detailed studies are required prior to development. This approach defers decisions about mitigation from the scale of the community to the scale of individual building sites. California's 1971 Alquist-Priolo Special Studies Zone Act (renamed the Alquist-Priolo Earthquake Fault Zoning Act) defines special study zones, based on active fault zones, in which site-scale studies must be done. Within these zones, detailed geologic analysis is required as a part of the subdivision or building permit process for large developments. These special studies may then lead to the imposition of specific site-design or construction standards through a locality's zoning ordinance or subdivision regulations; at a minimum, the state prohibits new construction within 50 feet of an active fault. A similar approach has been followed by some communities for designated landslide areas (Olshansky, 1990).
Hazard maps can be used to identify property or structures to be acquired or relocated for hazard mitigation purposes. Hazard maps also are used to define areas within which federal, state, and local policies concerning critical and capital facilities apply. The federal Coastal Barrier Resources Act, and similar executive and legislative initiatives in Florida and Massachusetts, limit federal or state spending for growth-inducing infrastructure on hurricane-prone barrier islands. Florida's 1985 comprehensive planning mandate similarly requires local governments to limit investments in infrastructure in designated coastal high-hazard areas. In like fashion, where taxation initiatives have been directed at mitigating natural hazards, hazard maps have been used to define the areas subject to the policies.
Vulnerability Assessment
Vulnerability assessment, the second level of hazard assessment, combines the information from hazard identification with an inventory of the existing (or planned) property and population exposed to a hazard. It provides information on who and what are vulnerable to a natural hazard within the geographic areas defined by hazard identification; vulnerability assessment can also estimate damage and casualties that will result from various intensities of the hazard.
It is relatively easy to determine where people live, even though most residents may be at work, at school, or engaged in other activities for much of the day. Estimating the population of commercial areas or of tourist areas can be more difficult than estimating residential population, but reliable estimates that take account of daily and seasonal movements are generally possible. Over the past several years it has become clear that some segments of the population will be affected more than others by natural disasters (Bolin, 1993a; Tobin and Ollenburger, 1992). This presents significant equity issues that are not commonly accounted for in contemporary hazard assessments. To account for these differential societal impacts, it is important to conduct an inventory that captures the age, ethnicity, income, and relevant health characteristics of the population at risk. Recently a number of researchers have developed methods to estimate the societal impacts of natural hazards. For example, Perkins (1992) has developed a method for estimating the need for temporary housing in the event of an earthquake. French et al. (1996) have developed a method using small-area census data to assess the demographic characteristics of populations affected by damaged infrastructure.
When considering property at risk, it is generally desirable to consider the building inventory separately from the infrastructure systems that serve the community. Building inventories should include type and location of structure. Age also may be useful since it can often be related to the degree to which mitigation measures were incorporated (for example, in conformance with building codes in existence at the time of construction). With earthquake vulnerability assessment in particular, it is critical to classify the buildings by structural type (i.e., wood frame, steel frame, unreinforced masonry, etc.) because different classes of structures respond differently to given levels of ground-motion intensity. Structural classification is also useful when considering vulnerability to hurricane winds or wildfire hazards. Building occupancy may be important if life safety or casualties are to be considered; the use of the building is important if the assessment is to incorporate secondary economic impacts.
Infrastructure includes roads, bridges, water supply, sewerage, and electric-power systems. These systems generally consist of a variety of different components, each of which may exhibit a different response to a natural hazard. Only in recent years has it become possible to perform vulnerability assessments that take into account the performance of individual components of these systems (Patel, 1991; Sato and Shinozuka, 1991). Repair costs, replacement values, and length of service interrup-
tions are important in estimating the economic vulnerability associated with infrastructure (Davis et al., 1982a, b; Seligson et al., 1990). Service-interruption estimates also are important in planning emergency response and in determining the demand for temporary food and shelter.
Vulnerability assessments attempt to predict how different types of property and population groups will be affected by a hazard. Vulnerability functions are empirically derived relationships that describe the response of populations, structures, or facilities to a range of hazard intensities. Examples of vulnerability functions include the damage-probability and restoration-time matrices for earthquake damage to buildings and infrastructure published by the Applied Technology Council (1985, 1991) (see Figure 5-3); the Standardized Earthquake Loss Estimation Methodology under development by the National Institute of Building Sciences, which can be used to estimate the probable number of deaths and injuries and potential economic and housing losses from earthquakes (National Institute of Building Sciences, 1994); and the flood damage tables developed by the National Flood Insurance Program (see Table 5-4).
One of the principal applications of vulnerability assessment has been the production of damage-loss assessments, which typically are used to estimate probable damages to private property from a natural hazard of one or several specified intensities under existing land use conditions. These are sometimes referred to as deterministic damage-loss assessments, which can be distinguished from probabilistic assessments, which assign probabilities to a whole range of likely events. Probabilistic assessments are the product of a full-scale risk analysis.
Deterministic damage-loss assessments have been done for hurricane-prone areas (e.g., Berke and Ruch, 1985; Ruch, 1983; U.S. Army Corps of Engineers, 1988, 1990; Withlacoochee Regional Planning Council, 1987) and for earthquake-prone areas (Association of Bay Area Governments, 1995; Central United States Earthquake Preparedness Project, 1990; Steinbrugge et al., 1987). They are primarily used to predict demand for emergency response services, public disaster assistance, and insurance losses. These loss assessments are usually done for hazards that affect large areas; they are not common for wildfires or landslides, for which more localized vulnerability assessments are typically conducted. Vulnerability assessments are also commonly used to assess structural alternatives for flood control within individual drainage basins (see, for example, South Florida Water Management District, 1984). Less common are studies that assess the impact of land use change on flood vulnerability (Linn, 1988).
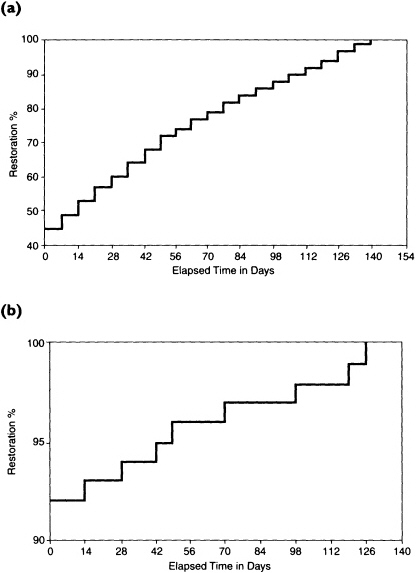
FIGURE 5-3 Restoration time for electric power following earthquakes of different magnitudes. (a) Residual capacity of Washington State's electric power following Puget Sound event (M = 7.5); (b) residual capacity of Missouri electric power following New Madrid event (M = 7.0) (Applied Technology Council, 1991, p. 386).
TABLE 5-4 Damage Percentages Based on Flood Depth (One-Floor Buildings, No Basement, Non-velocity Zones)
Water Depth (ft) | Percent Damage (based on claims data) |
1 | 15.16 |
2 | 24.14 |
3 | 28.12 |
4 | 31.77 |
5 | 36.85 |
6 | 35.21 |
7 | 40.94 |
8 | 40.22 |
9 | 44.24 |
10 | 46.50 |
11 | 51.44 |
12 | 44.03 |
13 | 45.87 |
14 | 41.21 |
15 | 55.03 |
16 | 40.48 |
17 | 36.00 |
18 | 36.92 |
SOURCE: Federal Emergency Management Agency (1995a). | |
Vulnerability assessment can be applied across the full range of land use planning and management tools. It provides the fundamental data upon which emergency-response plans are based. For example, Florida's planning mandate links emergency planning and land use planning by requiring local governments to maintain or reduce hurricane evacuation times within designated coastal high-hazard areas. This requires detailed characterization of the populations within hazard zones, but not estimates of damage or injury. Forecasts of casualties and property damage for different land use scenarios may be used to design and justify a variety of public initiatives, for example: (1) building codes or other development regulations; (2) property acquisition programs; (3) policies concerning critical and public facilities; (4) taxation strategies for mitigating risks from natural hazards; and (5) information programs for members of the public who are at risk.
Risk Analysis
Risk analysis is the most sophisticated level of hazard assessment. It involves making quantitative estimates of the damage, injuries, and costs
likely to be experienced within a specified geographic area over a specific period of time. Risk, therefore, has two measurable components: (1) the magnitude of the harm that may result (defined through vulnerability assessment); and (2) the likelihood or probability of the harm occurring in any particular location within any specified period of time (risk = magnitude x probability). A comprehensive risk analysis includes a full probability assessment of various levels of the hazard as well as probability assessments of impacts on structures and populations.
There are relatively few examples of probabilistic analyses of potential damages from natural hazards, although it appears this level of analysis is becoming more common. One example of such an application is the analysis performed by engineer Andrew Dzurik and his planning colleagues (1990) for Gasparilla Island in Lee County, Florida. Dzurik and his associates estimated the probable damage from each of five hurricane-intensity categories for a given year based on the value and structural characteristics of 461 existing habitable buildings and the probability of each storm category. They generated an annual probable loss value of $2.7 million based on 1986 land use. The Tampa Bay Regional Planning Council (1993) used a similar approach to calculate annualized losses from hurricanes for their region of Florida. Litan and colleagues (1992), in a report for the National Committee on Property Insurance, estimated the expected costs over 40 years of earthquake damages in Memphis and Los Angeles County.
Full-scale risk analysis can be used to support proposals for land use management policies or specific development projects, but there is little documentation of such use by local governments. Environmental impact analysis of proposed projects subject to the National Environmental Policy Act of 1969 (P.L. 91-190, sec.2; U.S. Code, vol. 42, sec. 4321), and similar state legislation, ideally should be based on assessment of the potential natural hazards at a site and the characteristics of the populations, property, and natural resources at risk. Benefit-cost analyses performed by the Army Corps of Engineers for flood control projects use probabilistic risk models to estimate damage avoided from floods of differing magnitudes. Federal regulations governing the siting of facilities such as nuclear power plants, hazardous waste management facilities, dams, and wastewater-treatment plants also require evaluation of the risks posed by floods or earthquakes.
Full-scale risk analysis also is appropriate for making decisions about hazard mitigation initiatives through property acquisition, design and siting of critical and public facilities, and taxation. Researchers
with the Florida Planning Laboratory at Florida State University have worked with Lee County, Florida, to develop a risk-based fee system for county emergency management services (Smith and Deyle, 1994). This project used probabilistic models of storm surge and wind damage to personal property, public facilities, and infrastructure to devise a fee system linked to the risk incurred by development of land in different hurricane hazard zones within the county. Risk analysis also can be used to monitor the effectiveness of land use and other mitigation strategies over the long run. As development occurs, and as these programs are implemented, a community's expected losses are likely to change. Periodically conducting a full-scale risk analysis can provide decision makers with feedback on how their decisions are cumulatively affecting the overall sustainability of the community. While there are no extant examples of risk analysis being used in this manner, long-term monitoring of risk provides an interesting prospect as we look for measures of sustainability.
CHOICES IN APPLYING HAZARD ASSESSMENT
Planners, policy analysts, and other public officials must make a number of decisions in applying hazard assessment to land use planning and management. These include decisions about the precision of data and the geographic scale to be used in the analysis, recurrence intervals and the temporal perspective, and the level of hazard assessment to use. In some instances, these choices are made by federal or state agencies without careful consideration of the implications for local officials who use the analysis. In cases where analysis and decision making are conducted at the same level of government, decision makers and their staffs exercise direct control over these choices. In this section we discuss each of these choices and their implications in terms of utility to local planners and decision makers, political feasibility, and legal constraints.
Precision and Geographic Scale of Analysis
Choices about data precision and geographic scale for hazard assessment ideally ought to be a function of the uses to be made of the analysis. Public information and commitment building can be accomplished with relatively imprecise information about the characteristics of hazards and vulnerable populations and property. However, as a general rule, greater precision is required of the data as the size of the decision-making juris-
diction decreases. Thus, simplification of assumptions about the characteristics of hazards and vulnerable communities is more acceptable for state and federal policy analysis (for example, estimating costs of disaster assistance) than for hazard assessments done for local land use planning or management. At national, state, or regional scales it may be possible to use relatively crude definitions of hazardous areas and generalized data about populations and building stocks. Local land use planning and management, however, require greater levels of precision both to politically justify differential treatment of land in various locations and to meet the constitutional test of equal protection where land use is to be regulated.
The utility of hazard assessment may be compromised where the precision of data is inappropriate for users. For example, studies of hurricane losses are typically performed for multicounty regions (Ruch, 1983; U.S. Army Corps of Engineers, 1990). These studies use a number of simplifying assumptions about the relationships between broad categories of land use and the dollar value of property damage. Such assumptions are acceptable when providing broad estimates of potential hurricane losses, but they are of limited use to local governments for estimating losses within their jurisdictions under different land use or regulatory scenarios. As a result, there has been a decline in their production, at least in Florida (Michael McDonald, Florida Department of Community Affairs, Division of Emergency Management, personal communication, 1993). Scenario-based loss studies done for earthquakes have a similar need for precise data (Association of Bay Area Governments, 1995; Central United States Earthquake Preparedness Project, 1990; and Steinbrugge et al., 1987).
The precision and scale of hazard information are especially crucial to land use management initiatives. Olshansky et al. (1991), in a series of interviews with local planners, found that seismic-hazard maps must meet three criteria to effectively guide local policy decisions: (1) the level of hazard varies (some zones within a city or county are shown to be more hazardous than others); (2) this variation occurs regardless of the magnitude or location of an earthquake; and (3) each zone implies a list of feasible policy options.
Mapping precision—that is, the ability to define a line that separates areas with significantly different levels of hazard—is determined by the available data and the nature of the physical phenomenon that presents a hazard. Where hazard data are obtained from secondary sources, such as regional, state, or federal agencies, the density of data points may be insufficient for defining the precise boundaries of hazards. Greater pre-
cision may require expensive and time-consuming special studies. Thus, state and federal agencies should be particularly cognizant of the needs of local governments for precise data if they intend for hazard information to be useful in land use planning and management.
For some natural phenomena there is little spatial contrast in levels of hazards, thus it is difficult to define meaningful boundaries between hazardous and non-hazardous areas. For example, the intensities and probabilities of seismic ground shaking and hurricane winds do not vary significantly at geographic scales that are useful for land use planning or management. For flooding, intensity and probability vary over a spatial continuum that principally is a function of topography. Thus the differences in hazards across any particular zonal boundary—for example, the 100-year floodplain—can be relatively slight unless there is a dramatic topographic change. The spatial contrast for liquefaction and landslide hazards, however, is well defined because these hazards are a function of soils and geologic substrate. Similarly, wildfire hazard zones can be defined reasonably well on the basis of vegetative/fuel-load characteristics, orientation (e.g., southwestern slopes), and topography.
Where hazards do not vary spatially, it is difficult to justify drawing boundaries that determine allowable land use types or intensities or the imposition of different development regulations. Instead, building design is used to mitigate these hazards. Macrozones are defined to specify the forces to be used in structural design (see, for example, Figure 5-4).
Where the intensities and probabilities of hazards vary over space, as with flooding, planners and local officials must make more difficult choices about acceptable levels of risk. While the justification for regulating development within 100-year floodplains (with a 1 percent annual chance of flooding) versus 500-year floodplains (with a 0.2 percent annual chance of flooding) may be reasonably clear, the rationale for regulating property within the 100-year floodplain but not adjoining property in the 101-year floodplain is less so.
The intended use of the analysis and the desired level of precision determine the appropriate geographic scale of hazard assessment. A relatively coarse hazard mapping scale, such as 1 inch to the mile, is adequate for public information purposes and for fostering commitment to public policy initiatives. Such a scale also may be adequate for national or state policy analysis. Hazard information at a scale of 1 inch to 2,000 feet (the scale used for U.S. Geological Survey 7.5-minute quadrangles) usually is sufficient for general land use planning and for decisions about locating public facilities. However, at this scale it is difficult to distin-
guish individual parcels of property. To support land use management applications at the level of the specific parcel, scales from 1 inch to 2,000 feet to 1 inch to 200 feet are required.
For planning and policy analysis by local governments, vulnerability assessment probably is done best using block-level census data and parcel-specific data on land use and structures. Census block data provide information not only on the number of people exposed at a level of resolution to fit hazard maps, but also some basic demographic facts on the age and ethnicity of the population. This information can be important in evaluating the social impacts of a disaster. Property inventories ideally ought to be done at the parcel level. More sophisticated analytic methods, such as geographic information system (GIS) technology, make it possible to use detailed levels of data available from secondary sources such as records maintained by tax assessors or inventories of public facilities. Substituting such detailed inventory data for generalized estimates should improve the precision of hazard assessments.
Unfortunately, increasing the precision of hazard identification and vulnerability assessment increases the cost of the assessment. Communities have to decide how much precision they are willing to pay for. Larger-scale hazard information can be used in land use management to identify areas where permit applicants are to be required to provide site-specific information. This strategy, however, forces local governments to depend on information provided by developers and their consultants. This may lead to problems with comparability among projects when different methods and standards are employed. Can a community support the types of planning and land use management it desires with general information that often comes from secondary sources? Do the benefits of more precise information justify the cost? The answers to these difficult questions depend on the severity of the local hazard and the community's commitment to deal with the problem.
Time Factors
Planners and analysts face two choices related to time factors in hazard assessment: (1) the recurrence interval of extreme events for which planning and development management should be done, and (2) the temporal perspective of the assessment, that is, whether to analyze risks involving current land use practices or future risks accompanying alternative land use scenarios.
All three levels of hazard assessment must take recurrence intervals
into account. At one end of the temporal continuum are chronic hazards that produce modest levels of damage on a relatively frequent basis, generally with a recurrence interval of less than 20 years. At the other end are catastrophic events that recur less frequently, only once every several hundred years or more, but produce devastating levels of damage.
Choosing the appropriate recurrence level as the basis for planning and land use management is quite difficult for local officials. As a rule, their training and expertise is oriented towards short-term issues and decisions. The choice of a recurrence interval represents a value judgment that is difficult to deal with in the political arena. Many communities in California experienced difficulty in preparing the seismic safety elements of their general plans because they first had to select an acceptable level of risk. Communities do not face this problem in relation to flooding because of a federal mandate to plan for the 100-year flood, although they are free to select a more frequent recurrence interval. Most do so for the design of stormwater management systems, where facilities are typically designed for 5-, 10-, and 25-year events. Few communities design for floods that are less frequent than the 1-in-100-year event.
It is important to recognize that the recurrence interval is a function of the geographic scale from which one views the problem. While the 100-year flood only has a 1 percent probability of occurrence in any given year for a single community, at the national scale it is virtually certain that a series of 100-year events will occur each year. Thus, what appears to be a catastrophic event at the local level is a chronic problem at the state or national level. This difference in perspective lies at the heart of the disjuncture in hazard mitigation policy objectives that is the focus of Chapter 3.
The fact that recurrence intervals vary for different geographic areas also suggests that uniform land use policies ought not to be tied solely to hazard intensity. The contrast between seismic hazards in the central United States and California is illustrative. The New Madrid seismic zone can expect a magnitude 6.0 earthquake every 70 years, magnitude 7.6 every 254 years, and magnitude 8.3 every 550 years. The last magnitude 6.0 was in 1895. The last magnitude 8.0 was in 1812; earthquakes of magnitude 8.0 or greater are rare but can happen. The probabilities on the West Coast are much higher. For example, the Working Group on California Earthquake Probabilities estimated an 80 to 90 percent probability of an earthquake exceeding magnitude 7.0 in south-
ern California before 2024 (USGS, 1995), and a previous Working Group estimated a 67 percent probability of an earthquake exceeding magnitude 7.0 in the San Francisco Bay region by 2020 (USGS, 1990). The City of Los Angeles can justify the expense of retrofitting all its unsafe buildings, because there is a high probability that it will save lives. In the central United States, the enormous expense and economic disruption are not warranted by the hazard. If we assume that buildings wear out in 50 to 100-years, then over time a policy of seismic design for new construction will eventually ensure that the building stock is seismic resistant. This seems a prudent gamble in the central United States because of the time between earthquakes (an exception may be made for certain critical facilities), but it does not seem so for southern California.
The temporal perspective of hazard assessment as we define it here is not particularly relevant to simple hazard identification. It is, however, relevant to vulnerability assessment and risk analysis. The vast majority of vulnerability assessments and risk analyses are performed for existing land use patterns. In a few instances, researchers extend the analysis to predicting the impacts of forecasted growth according to existing plans. However, we have not found any examples where vulnerability assessment or risk analysis have been used to evaluate alternative land use scenarios. Dzurik and his associates (1990) estimate future annualized damages for Gasparilla Island (Florida) based on population growth projections. Berke and Ruch (1985) perform a similar analysis for Corpus Christi and Nueces County, Texas, based on a deterministic damage-loss assessment. Both groups of researchers suggest that their methodologies could be used to compare alternative future land use scenarios.
Level of Hazard Assessment
One of the important choices facing planners and policy analysts is the level of hazard assessment that should be conducted to support land use planning or management initiatives for hazardous areas. Hazard identification is the essential, minimum level of assessment needed to define the spatial extent of a hazard and to suggest any land use policies for mitigation of the hazard. It also is essential to generating commitment for such public policy initiatives. The product of hazard identification, which usually takes the form of a map, is relatively easy to understand, although as noted above, the utility of such maps depends on choices made about precision and geographic scale.
When and why should planners and local officials go beyond hazard
identification? Vulnerability assessment ought to be used in the planning process itself because it is necessary to understand the consequences of alternative land use configurations. This type of analysis can measure damages that can be evaluated along with other aspects of each land use alternative in the development of a comprehensive plan, recovery or post-disaster reconstruction plan, or capital and public facilities policies. It also is important for setting priorities for property acquisition and for determining appropriate rates for impact fees or other revenue-generating policies linked to natural hazards.
Vulnerability assessment also is the minimum level of analysis required if a community desires to weigh the costs and benefits of various mitigation strategies. Hazard identification does not, by itself, provide the rationale for taking land use management initiatives. Vulnerability assessment, by providing information about the casualties and damages that may result from an extreme natural event in an area, provides the justification for deciding what level of hazard intensity warrants public intervention in private sector decision making. Vulnerability assessment is a stronger foundation for building commitment than is hazard identification because it provides decision makers with explicit measures of the potential impacts of natural hazards.
Vulnerability assessments require less information and less effort than full-scale risk analyses, and they are relatively easy to explain to decision makers, who usually are not well versed in probability theory. Vulnerability assessments, which typically analyze the losses from one or several hazard scenarios, do not formally incorporate the dimension of probability into hazard assessment. This does not mean that likelihood will be ignored, however. Instead, decision makers and their constituents will be guided by their perceptions of the likelihood of different hazard scenarios. Various studies have shown, however, that the perceptions of lay persons generally diverge fairly substantially from empirical probabilities (Sandman, 1985; Slovic et al., 1979).
Probabilistic risk analysis can provide a more accurate picture of the overall risk situation. By considering losses associated with the entire range of hazard intensities and probabilities, from the fairly common, low-intensity event to the extremely rare, catastrophic event, they capture the full range of potential casualty and damage experiences. Where a rational, comprehensive approach to decision making is desirable, such as through the use of benefit-cost analysis, the whole damage distribution should be considered based on a probabilistic risk analysis.
Aside from the technical difficulty and data demands of full-scale
risk analyses, the principal constraint on their use is the ability of public officials and their constituents to comprehend them and apply them to policy choices. Berke and Ruch (1985) report that they purposely did not calculate annualized probable losses in conducting hurricane damage-loss assessments for several counties in Texas on the advice of state planners, who suggested that local officials would have difficulty understanding such information. Yet researchers such as Mushkatel and Nigg (1987a) have shown that the perceptions people have of risk, and their behavior, can be influenced by objective, quantitative risk information. Other researchers (e.g., Johnson et al., 1988) have found that fairly simple means of communication, such as booklets that present concise summaries of risks and mitigation alternatives, can change public perceptions and behavior.
Many hazard assessments are couched in such technical terms that they are not intelligible to local planners and engineers, much less elected and appointed officials or the general public. Hazard assessments must be presented in terms that are relevant to the policy choices faced by local officials (Panel on Earthquake Loss Estimation Methodology, 1989). This is a challenge that must be met by those who advocate land use planning and management as hazard mitigation strategies.
Of equal or greater importance, however, is the need for credibility. Public decision makers and their constituents must have confidence in the predictions and estimates derived from hazard assessment before they will be willing to make the difficult choices often required for hazard mitigation through land use management. Because risk analysis in particular is based on probabilities, it contains a significant amount of uncertainty. Many local decision makers are reluctant to impose restrictive land use controls given the political conflict often engendered by such controls and the degree of uncertainty present in damage models. They fear that their actions will not withstand political or legal challenges due to this uncertainty. Explicit consideration of uncertainty requires use of confidence intervals, which presents an additional challenge to risk communication.
Choices about the level of hazard assessment to use in land use planning or development management ought to be based on an understanding of the state of the art and the constraints that it may pose for understanding and mitigating different natural hazards. In the next two sections we discuss the major dimensions of the state of hazard assessment knowledge and information and the state of the art for specific natural hazards.
THE STATE OF KNOWLEDGE AND INFORMATION
Effective use of the different levels of hazard assessment in land use planning and management depends on the ability of scientists and planners to collect and analyze data for hazard identification, vulnerability assessment, and risk analysis. Significant advances have occurred in the past 20 years in scientific understanding of extreme natural events, availability of data, and capacity to model and analyze natural hazards, but gaps and uncertainties remain. When planning for and making choices about land use management in hazardous areas, these uncertainties must be recognized and communicated to those who make and are affected by land use policy decisions. Failure to acknowledge these uncertainties and limitations can result in inappropriate reliance on natural hazards assessment information. However, as noted in the preceding discussion of choosing the level of hazard assessment, awareness of these uncertainties and limitations also may impede the acceptance of more sophisticated levels of hazard assessment by elected officials and the public.
Knowledge about Extreme Natural Events
Scientists and planners identify hazardous areas and estimate the likelihood of extreme events based on their understanding of the fundamental causes and processes of natural phenomena. But scientific understanding of these phenomena is imperfect. What causes an earthquake? Where will the next one occur? Why do some years have more hurricanes than others? Which slopes will fail in the next intense rainstorm? What environmental conditions spawn firestorms? Scientists do not fully understand the causal processes of many of these natural phenomena. Or if the process is understood, the systems (dynamic atmosphere, heterogeneous earth) are too complex to be fully understood and modeled. In either case, lack of understanding of causation means that the ability to predict is limited too. Storms can be predicted several days before they occur, and floods and landslides can be predicted based on storm precipitation estimates, but we cannot predict where and when earthquakes or wildfires will occur with any precision.
Nevertheless, advances are being made in understanding the behavior of some natural hazard phenomena. Each new extreme event provides additional information that helps scientists understand underlying causal relationships. In addition, modeling initiatives in some fields are providing new tools for land use planning and management.
Data on Hazard Characteristics and Vulnerability
The lack of good causal models requires analysts to use statistical models of probability based on historic data to estimate the likelihood of natural hazards affecting specific geographic areas. Historic data are lacking, however, for many extreme natural events. Another impediment to hazard assessment is an inability to define hazardous areas at high levels of geographic resolution. Nonetheless, there has been a huge increase in information on hazard characteristics and vulnerable populations and property within the past 20 years, which has significantly advanced the ability to use hazard assessment in land use planning and management.
The dissemination of floodplain maps under the National Flood Insurance Program is the best known example of the new wealth of information available for hazard assessment. Substantial advances have been made for other natural hazards as well. The U.S. Geological Survey and the California Division of Mines and Geology have produced maps that rate the potential for earthquake ground shaking, liquefaction, and landslides for some localities in California, the Pacific Northwest, Utah, and other earthquake-prone areas. Wildfire hazard mapping has been done at the national level in Australia, at the state level in California, and at the local level in areas such as Boulder County (Colorado) and the East Bay Hills area in Oakland (California). The U.S. Army Corps of Engineers has assisted states and counties in developing storm surge hazard maps for areas exposed to hurricanes.
Increasingly the data needed for hazard assessment are available in digital form. This allows them to be manipulated with a geographic information system (GIS) or loaded into an automated damage-modeling system. Population and housing data are now available on CD-ROM at the block level from the U.S. Bureau of the Census (1991). In addition, many local governments have developed land parcel databases that include building and value information for all the properties within their jurisdictions, and many local public works departments have infrastructure inventory data on computer-aided design (CAD) systems or GIS.
The greatest problem with obtaining data on the characteristics of natural hazards is the necessity for extrapolating that data from a limited historic record. Thus, there is sometimes little data from which to estimate the probabilities of hazard occurrence and the magnitude and spatial extent of extreme natural events. Flood policy, for example, is based on the concept of the 100-year flood, but virtually no river in America
has 100-years of record (and even more than 100-years of record would be necessary to make a statistically acceptable estimate). For some phenomena, researchers are able to identify prehistoric events, but there is no way of knowing whether all such events have been captured. For example, the recurrence of large earthquakes on the San Andreas Fault is well known, because the trace of the fault can be exposed and studied. In contrast, the number and size of prehistoric earthquakes on the Cascadia subduction zone off the coast of Oregon and Washington is virtually unknown.
For some natural phenomena the ability to accurately estimate the probability of extreme events of specific magnitude decreases as the geographic area diminishes in size. This may be the result of limited historic data for small geographic areas, as is the case for hurricanes at the county level or flooding in small watersheds. In the case of earthquakes, there is great uncertainty about where a fault will rupture and thus what the level of ground motion may be for any specific area.
For some natural phenomena, such as coastal erosion, riverine flooding, wildfire, and landslides and liquefaction associated with earthquakes, the magnitude and probability of the hazard vary greatly over small distances, so that regional values provide little useful information. For these hazards, detailed, local assessments are essential. In some areas, sufficiently detailed data exist for specific natural hazards so that accurate, small-area, hazard assessments can be conducted. Hazard data also may be inaccurate, however, where human actions have altered the magnitude or areal extent of the hazard, such as through increases in impervious surface area in small watersheds or changes in wildfire fuel loads on private lands.
Modeling Impacts
In addition to limitations on the availability of data on the characteristics of hazards, databases and models for vulnerability functions historically have been limited in quantity or quality. Furthermore, the data collection and processing tasks are enormous: one must gather statistics on damage, structural type, and exposure for thousands of damaged structures in each disaster. However, two relatively recent advances have made it easier for planners and engineers to conduct hazard assessments: (1) improved scientific understanding of vulnerability functions, and (2) the advent of geographic information system technology.
Through post-disaster empirical research and simulation modeling,
significant advances have been made in understanding the vulnerability functions that describe the effects of floods, hurricanes, and earthquakes on people and the built environment. For other hazards, such as landslides and wildfire, there are no standard ways of describing intensity of damage. Damage-loss assessment models have been applied predominantly to private property (e.g., Berke and Ruch, 1985; King, 1991). While damage functions are available for major types of public infrastructure, only recently have researchers begun to develop models to predict the other public sector costs of response and recovery from natural disasters. The state of knowledge is markedly better than it was 20 years ago, but a significant amount of uncertainty remains in this area. For details about the state of vulnerability assessment, see the next section of this chapter.
The ability to use damage functions and other vulnerability functions to perform credible hazard assessments has been enhanced significantly by the development and widespread deployment of geographic information system technology. Traditionally building inventories were collected by a field survey of the hazard area. This was extremely expensive and time consuming. Modern GIS technology provides the ability to overlay a natural hazard area on a digital parcel map (French and Isaacson, 1984; Hwang and Lin, 1993). Typically the parcel layer includes information on ownership, value, and use of the structure. This allows the user to differentiate the population, structures, and infrastructure components exposed to varied levels of hazard. For example, using this technology it is fairly straightforward to determine with a high degree of precision the number, types, and value of structures that will be inundated by a 100-year flood event.
Most modern geographic information systems also provide the data management capabilities of a relational database. This allows the user to store and manage the large amounts of data required for a complete inventory of the people and property at risk. Using the complete inventory improves hazard assessment by eliminating the need to make estimates regarding the number of people and amount of property exposed to the hazard. This technology has become so accessible that virtually any planner or policy analyst can use it today, as long as a GIS database has been developed for the geographic area of concern. By the end of 1996, several GIS-based hazard assessment software systems were under development (see, for example, the descriptions of the HAZUS and RAMP systems in the section of this chapter on earthquakes, below.)
With the development of better damage models, improved availabil-
ity of hazard information, and the advent of new technologies such as GIS and expert systems, staff capacity is becoming the limiting factor. Local governments routinely identify staff training among the most serious problems they encounter in implementing GIS and other advanced technologies (French and Wiggins, 1989). The staff expertise available to apply these techniques to natural hazards problems is likely to be a major constraint in many jurisdictions. Local governments will typically have three options to deal with this problem. First, they can add new staff who have skills and expertise that are readily applicable to hazard assessment. This likely will not be feasible for many jurisdictions with limited staff resources and demand for a wide range of planning expertise. Second, communities can invest in educating existing staff on the techniques of risk assessment. This is probably the most desirable course of action, except for the scarcity of means available to provide this education. Finally, communities can turn to specialized consultants who have the expertise. This is probably the most feasible solution, but it prevents the use of hazard assessment techniques on a routine basis. Thus, a combination of the second and third options will probably provide the best mix of expertise and availability.
ASSESSMENT OF SPECIFIC NATURAL HAZARDS
In this section, we summarize knowledge of the hazards posed by floods, earthquakes, landslides, hurricanes and coastal erosion, and wildfire, and the practice of hazard assessment for these phenomena.
Floods
Hazard assessment for floods begins with hydrologic modeling. The HEC-1 and HEC-2 models developed by the U.S. Army Corps of Engineers are the most widely used flood analysis models. They begin with the rainfall record for the local area and then simulate the likely discharge that will result from storms of various probabilities. This discharge is then routed through a cross section of the floodplain to estimate flood depths at various locations.
To do an accurate analysis of property at risk from flooding, the base elevation of the first floor of a structure is required. Where this is available in digital form, a GIS can be used to combine this information with data layers on the spatial location of the flood hazard and property data usually used for tax assessment purposes. There are, however, many
local governments that do not have data on the elevation of buildings built prior to a community's entrance into the National Flood Insurance Program. Once the depth of flooding is known for buildings in an area, it is a relatively straightforward matter to calculate dollar damages using a vulnerability function (stage-damage curve) derived from past flood events. Stage-damage curves developed by the Corps of Engineers estimate damage as a percentage of value based on the depth of flooding experienced. Probable casualties, loss of life, and losses from business interruption are harder to estimate.
A key problem with traditional flood hazard mapping is that it is based on existing upstream conditions in the watershed. The amount of flood discharge depends on a number of factors including the duration and intensity of the storm event, the size of the watershed, and the amount of impervious surface area. The latter is largely a function of land use decisions. Thus, as upstream development occurs, the amount of run-off in the watershed increases; the depth, areal extent, and velocity of flooding increase in turn (see Figure 5-5). In small, urban watersheds, significant land use changes can dramatically alter flood discharge volumes. In such areas, frequent revisions to flood hazard maps are required. The Denver Urban Drainage and Flood Control District has tackled the watershed development problem by assuming complete development of each watershed for its models. As a result, its estimates of
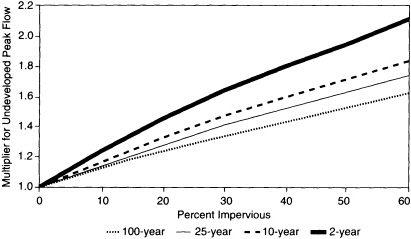
FIGURE 5-5 Impacts of urban development on peak
flow. Source: Debo and Reese, 1995, p. 193.
flood depth and the geographic extent of its floodplains are greater than what is indicated on the Flood Insurance Rate Maps published by the National Flood Insurance Program. Conventional flood hazard mapping also does not account for the impacts from failure of flood protection works or the effects of debris in flood waters.
Earthquakes
Earthquake hazard assessment differs from other natural hazards in one important way: earthquake hazard is not as precisely tied to location. The hazard is diffuse, and wide areas share similar potential to be affected by an earthquake. As with floods, hurricanes, and wildfires, the structural characteristics of the property at risk are very important. Type and quality of construction play a major role in determining whether a building will be severely damaged by earthquake shaking. Thus, a building inventory is essential.
To perform an earthquake hazard assessment, seismologists and geologists must first identify earthquake source zones and assess long-term, magnitude-frequency relationships. This is complicated by the fact that some areas are exposed to earthquake hazards from multiple sources. In the central United States this is not a significant issue; there is a single major source, the New Madrid seismic zone. But on the West Coast analysts must account for the hazard posed by the San Andreas Fault system, large offshore subduction zones, and a multiplicity of smaller continental faults. Any given location has the potential to be shaken by an earthquake emanating from one of a large number of multiple sources. This makes it difficult to do a composite hazard map, although the Southern California Earthquake Center is doing just this. They have produced a map that adds up the hazard posed by all the faults and shows the probability of each location in southern California experiencing shaking greater than 0.2 g over a 30-year period.
The absolute size of an earthquake is expressed by a logarithmic magnitude scale based on seismometer readings. Because longer fault ruptures cause larger magnitude earthquakes, empirical formulas exist to estimate expected maximum magnitude as a function of observed fault length (Hanks and Kanamori, 1979). Given an earthquake magnitude, ground shaking at a site is estimated based on the site's underlying geologic material (Borcherdt, 1994) and its distance from the assumed earthquake source (e.g., Boore and Joyner, 1994). Locations farther away from the fault rupture shake less severely than locations closer to the
rupture. Softer soil sites shake more severely than firm soil or bedrock sites. In general, damage and loss of life in recent major earthquakes have been concentrated in areas underlain by soft-soil deposits (Borcherdt, 1994). Estimates of ground shaking measured as effective peak acceleration are available at the county level, and models are being developed that predict ground shaking measured as peak velocity at the zip code and census tract levels (e.g., National Institute of Building Sciences, 1994). However, estimates of ground shaking are subject to great uncertainty at this scale, and as a result, they may be too crude for regulatory purposes.
Earthquake hazards generally can be grouped into three categories, all of which can be mapped: (1) direct damage from surface fault rupture; (2) damage caused by ground shaking; and (3) damage caused by shaking-induced ground failure. When fault movement occurs on the earth's surface, the structures built directly upon the fault trace will be damaged. Maps that identify active faults do not exist for most of the United States. California, however, has produced detailed maps of active faults, as required under the Alquist-Priolo Earthquake Fault Zoning Act (Hart, 1994).
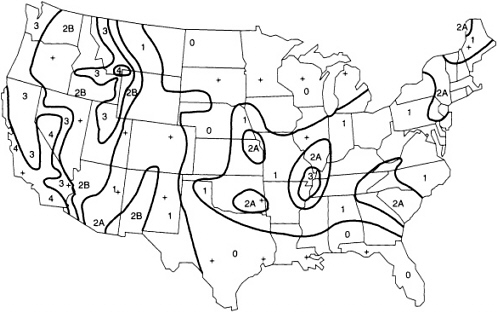
Ground shaking is the most common cause of earthquake damage to buildings. From knowledge of past earthquakes, the Applied Technology Council and the U.S. Geological Survey have developed maps of expected forces of earthquake shaking throughout the United States (see Figure 5-6). Examples of these maps and descriptions of their historical development are given by Leyendecker et al. (1995). These maps form the basis for the seismic zonation maps used in all the seismic building codes in the United States. California, in 1991, enacted the Seismic Hazards Mapping Act, which calls on the state geologist to undertake a statewide seismic hazard mapping and technical advisory program (Real and Reichle, 1995; Tobin, 1991). This pioneering program in government-sponsored seismic hazard mapping is developing mapping guidelines and methods in several USGS quadrangles in southern California.
Strong ground shaking can trigger numerous types of ground failure, most notably landslides and liquefaction. These are some of the most hazardous effects of earthquakes, because they are not easily addressed by better design and construction of buildings. The U.S. Geological Survey has developed methods for generally assessing the susceptibility of slopes to earthquake-triggered landsliding (Keefer, 1984; Wilson and Keefer, 1985), but these maps only identify broad areas that could experience slope failures from a given earthquake. Liquefaction is a type of
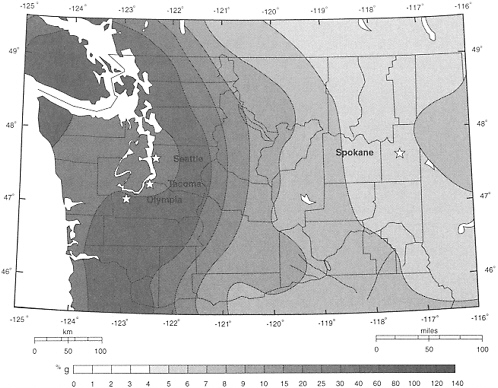
FIGURE 5-6 Map of Washington State showing the level of earthquake ground shaking that has a 10 percent chance of being exceeded in any 50-year period. It is shown in terms of peak horizontal acceleration, expressed as a percent of gravity. Source: Walter Hays, USGS, 1997.
ground failure in which soils temporarily lose their ability to support structures. Liquefied sands beneath the surface can cause differential settlement of overlying layers. Liquefaction also can cause lateral spreading, where blocks of overlying soil move apart and cause ground fissures. Because liquefaction occurs only in certain types of sandy soils, it is relatively easy to produce maps that show areas where liquefaction is possible when ground shaking exceeds a specified threshold. Such maps have become relatively common since the early 1980s, and many cities now include liquefaction potential maps in their comprehensive plans (e.g., Los Angeles County, 1990). One limitation of such maps is that they designate only how hazardous a zone is relative to other zones, rather than the expected extent of liquefaction that would occur in each zone in a given earthquake. Many areas within such a zone would not be susceptible to liquefaction. More detailed studies are needed to determine the presence of the hazard.
Earthquakes also can trigger secondary hazards, such as flooding and fires, caused by failures in structures. Maps showing the maximum extent of inundation from failed dams are common and are technically straightforward to prepare. The spread of fire after earthquakes, however, is not well understood, difficult to model, and typically not well addressed in earthquake loss estimates.
To assess vulnerability to earthquake damage, it is important to consider the type of buildings in the community. Low-rise, wood-frame buildings perform best, and unreinforced masonry (brick) buildings perform worst. Mobile homes also fare badly. Recently, reinforced-concrete frame buildings also have generated concern, as they can collapse catastrophically.
Under the National Earthquake Hazard Reduction Program, the Federal Emergency Management Agency, along with a consortium of professional organizations, has developed methods for evaluating the safety of existing buildings (Building Seismic Safety Council, 1992) and for designing new buildings for seismic safety (Building Seismic Safety Council, 1991).
Earthquake vulnerability assessments have been based on estimates of damage and injuries from single events. Until recently, these data collection and processing efforts were primarily for insurance purposes (e.g., Algermissen and Steinbrugge, 1978). However, damage estimates for given shaking levels have become more widely available since the early 1980s. For example, the Applied Technology Council's ATC-13: Earthquake Damage Evaluation Data for California (1985) provides detailed damage probability matrices that are much more advanced than what was previously available. (See also Association of Bay Area Governments, 1995; Central United States Earthquake Preparedness Project, 1990; Earthquake Engineering Research Institute, 1994; Steinbrugge and Algermissen, 1990; Steinbrugge et al., 1987.)
There are several problems, however, in using these assessments for public decision making. The methods of analysis vary considerably, so it is difficult to compare the assessments. They also are difficult and expensive to execute because each analysis must start from scratch. Both problems were addressed in a project for the Federal Emergency Management Agency led by the National Institute of Building Sciences (1994), entitled the Standardized Earthquake Loss Estimation Methodology. This project, with numerous consultants, oversight committees, and working groups, began in 1992, completed its work in 1997. The end result was a GIS-based, damage-estimation software system, known as HAZUS,
designed to run on desktop personal computers, so that any city can perform its own loss estimate (CUSEC Journal, 1996). The user must provide the data on the geologic and built environment. The system is designed to run at various levels of precision, depending on the detail of input data, and it has default levels designed to give a first-cut approximation using generally available data. In addition to direct dollar losses, the NIBS system includes vulnerability functions for casualties, business interruption losses, secondary economic impacts, and social impacts such as the demand for sheltering. The system also can be used to perform formal risk analysis. A somewhat similar hazard assessment tool called RAMP (Regional Assessment of Mitigation) was under development in 1996 by EQE International, a consulting firm based in Irvine, California, under contract with the California Office of Emergency Services. RAMP is a GIS-based system that uses probabilistic models of seismic hazards and inventory data on critical facilities such as schools and hospitals to estimate annualized expected damage values. The designers indicate that the system will be capable of estimating the damage reduction benefits of alternative mitigation strategies and will be suitable for incorporation in benefit-cost analysis (Laurie Johnson, Urban Planner, EQE International, personal communication, 1996).
Landslides
Landslides occur in hilly regions and on river bluffs and sea cliffs all over the world. These slope movements pose a variety of hazards to human settlements. Fast-moving landslides are potentially deadly, because there is no time to warn occupants of downhill buildings. Slow-moving landslides can damage property but generally do not threaten lives. A single landslide does not affect as wide an area as floods or earthquakes. Patterns of landslide activity after a major storm or earthquake, however, can affect wide areas.
Landslide hazard assessment usually consists of hazard mapping only. These maps typically show areas with the potential for landsliding when the necessary threshold conditions of heavy rain or earthquake shaking are met. The assumption is that any structures affected by a landslide will be damaged severely. It is difficult to perform a quantitative vulnerability assessment or risk analysis because the uncertainty and imprecision of the hazard maps are too great.
Unlike floods, landslides do not occur in locations that are simple to define, and the same events do not predictably reoccur in the same places.
Frequency of landslide occurrences is usually unknown, and therefore predictability is poor. Some researchers have identified rainfall or ground-shaking threshold values that lead to good estimates of the frequency of events that can trigger landslides themselves at specific locations (Olshansky, 1990).
Although it is not yet possible to accurately estimate site-specific landslide probabilities, it is possible to identify hazard zones qualitatively. Brabb (1984a), Hansen (1984), and Varnes (1984) have published reviews of landslide hazard mapping methods. Most hazard mapping systems they report are based on the principle that if landslides have occurred in certain geologic environments, then all such environments in a region should be considered hazardous. In many cases, the hazard maps consist only of a landslide inventory, showing the areas that have actually had landslides in the past. It is still not possible, in the absence of costly subsurface investigation, to point to a given part of the landscape and identify the probability of landslide.
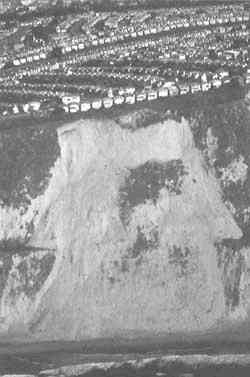
Landslide in Southern California (Walter Hays, USGS).
The U.S. Geological Survey, as well as several state geological surveys, have prepared landslide susceptibility maps in order to educate local planning agencies. The California Division of Mines and Geology prepared numerous landslide hazard maps under the Landslide Hazard Identification Program established by law in 1983. This program has now been incorporated into the Seismic Hazards Mapping Program.
Bernknopf et al. (1988) produced a landslide probability map for 5the Cincinnati area, which was a significant first attempt at producing a probabilistic landslide susceptibility map. This study also used damage estimates to evaluate the costs and benefits of identifying landslide hazards. The method used in this study probably could be replicated elsewhere but has not yet been repeated.
A few estimates have been made of the costs of landsliding, though all have been very approximate, and none has been based on a systematic inventory of people or properties at risk (e.g., Brabb, 1984b; Brabb and Harrold, 1989; and Schuster and Fleming, 1986). Petak and Atkisson (1982) systematically estimated landslide costs for the United States by combining a national landslide hazard map with county-scale population data. Probably the most systematic landslide hazard assessment to date was that done as part of the Urban Geology Master Plan for California, produced by the California Division of Mines and Geology (Alfors et al., 1973).
Hurricanes and Coastal Erosion
Hurricane hazard assessment has been hindered by the limited effort that has been made to develop data and models to support probabilistic damage models. By far the greatest effort has been exerted to support evacuation planning rather than hazard mitigation through land use and other controls. The principal hazard mitigation measures used have been building codes and, to a lesser extent, land use regulations such as setbacks; use of these measures has been based on deterministic models keyed to storms of a specified intensity or probability.
Hurricane evacuation planning is based principally on the delineation of storm surge hazard zones for each of the five categories of hurricane intensity (see Table 5-2). The Sea, Lake, and Overland Surge from Hurricane (SLOSH) model, developed by Chester Jelesnianski and Jye Chen of the National Weather Service, is used to calculate the maximum possible still-water flood depth resulting from the composite of an array of possible storms of a given intensity. Because SLOSH models are based
on an elliptical telescoping grid method, the precision of estimates of surge heights varies from site to site. Jarvinen and Lawrence (1985) compared SLOSH predictions with actual surge heights in 10 storms at 523 sites and found that 79 percent of the errors were within 2 feet of the mean error of -0.3 foot.
Probabilities are not calculated for the different storms used to estimate these maximum-of-maximum storm surge inundation heights. Thus the hazard zones so defined represent worst-case conditions for a given storm intensity. No single storm of a given intensity category would inundate all the areas depicted on a SLOSH map, but at the time when evacuation decisions must be made, emergency management officials do not know precisely what the heading, forward speed, and landfall location of the storm will be.
It is widely acknowledged that storm surge inundation depths should be adjusted for wave height (Simpson and Riehl, 1980). Several rules-of-thumb have been used to estimate maximum likely wave height (Balsillie, 1983). Deterministic models have been developed to predict wave heights at specific locations based on near-shore bottom contours (Balsillie, 1983) and, for storm surge flooding, taking account of on-shore features such as dunes, structures, and vegetation (National Academy of Sciences, 1977). However, no attempts have been made to generate probabilistic estimates of wave heights at different locations for the full array of possible storms to which an area might be exposed. Storm surge inundation depths will also be affected by long-term changes such as sea-level rise and subsidence. Little research has been done to document these phenomena.
The state of the art for defining wind hazard zones lags considerably behind that for storm surge. While it is well known that hurricane wind velocities subside rapidly when hurricanes make landfall (Simpson and Riehl, 1980), only limited work has been done to model wind-speed degradation within the first 10 or 20 miles of landfall (e.g., Schwerdt et al., 1979). The most advanced wind degradation model for hurricane landfall (Kaplan and DeMaria, 1995) has been developed for land areas at the multistate, regional level and does not model wind-speed degradation at a spatial scale that is useful for hazard mitigation planning at the local level.
Coastal erosion hazard zones principally have been defined on the basis of long-term, chronic erosion rather than the erosion associated with individual storm events. Michigan, North Carolina, and South Carolina define regulatory zones for coastal construction based on some
multiple of the average annual erosion rate determined by one of several methods of analyzing historic trends in erosion at specific coastal locations (Crowell et al., 1993). No probabilities have been formally estimated for these erosion-hazard zones, although the data probably would permit such estimates. In Florida, a regulatory zone for coastal construction is defined for sandy open shorelines by the area likely to be eroded by a 100-year storm. Location of the line is determined from analysis of historic data on storm and hurricane tides, maximum wave uprush, shoreline morphology, and existing upland development (Chiu and Dean, 1984). The Florida model could support development of a deterministic risk model.
Although the Federal Emergency Management Agency was directed to designate flood-related, coastal erosion-hazard zones under the 1973 Flood Disaster Protection Act, no such E-zones were ever designated. The original intent was to designate those areas subject to acute erosion caused by wave action. However, several bills that were introduced prior to enactment of the 1994 amendments to the National Flood Insurance Act recommended basing such zones on multiples of the annual erosion rate. In the 1994 amendments, Congress directed the agency to conduct a pilot project to evaluate the costs and benefits of defining erosion hazard zones.
The limited availability of data on the frequency of hurricane strikes makes hazard assessment difficult. The probability of a hurricane directly hitting any specific locality is very low (Jarrell et al., 1992), and the area directly affected is typically small; the radius of maximum winds around the hurricane center averages about 15 miles, and the direct hit zone averages about 50 miles (Hebert et al., 1993). As a result, estimates of the probabilities of hurricane strikes of specified magnitudes for geographic areas as small as counties or municipalities are based on Monte Carlo simulation using a model known as HURISK (Neumann, 1987; Science Applications International Corporation, 1989). These estimates are hampered to some extent by the limits of the historic database, especially for storm events with longer return frequencies than 100-years (Neumann, 1987, p. 53). However, the model output is readily accessible from the National Hurricane Center, and the model can be run on a PC by users who wish to perform their own analyses (Science Applications International Corporation, 1989).
Hurricane damage functions have been developed for still-water, storm surge flooding; velocity surge (waves); and wind associated with hurricanes. Most of these functions are based on broad categories of
structures (e.g. one floor, no basement; two floors, with basement) rather than on specific structural characteristics. Most still-water-surge damage functions estimate structural damage from water height relative to the first finished floor of a structure (Federal Emergency Management Agency, 1995a ; Friedman, 1974, 1975; Friedman and Roy, 1966). The principal constraint on their application is the lack of data on first-floor elevations of structures within the geographic area of concern. Where property appraisal data are contained in a local government's GIS, first-floor elevations are likely to be included for structures built after a community began participating in the National Flood Insurance Program. Data for older structures are less likely to be available.
Wave damage functions also estimate damage based on first-floor elevations but consider both damage from flooding as well as the pounding effect of breaking waves (FEMA, 1981; Friedman and Roy, 1966). As with still-water-surge damage functions, the lack of comprehensive data on the elevation of structures makes it difficult to apply wave damage functions. Furthermore, as noted above, the data available are inadequate to define probabilistic wave hazard zones for the full range of possible storm events. (The V-zones designated under the National Flood Insurance Program represent only the area affected by a 100-year storm.) The Federal Insurance Administration wave damage functions, which are used to set V-zone flood insurance rates, are constrained by a limited database, the result of a relatively small number of claims for damage within V-zones (Howard Leiken, Chief Actuary, Federal Insurance Administration, FEMA, personal communication, 1996).
Richard Smith (1995) found substantial variation among the wind damage curves that have been developed, especially for predicted damage to mobile homes. Gary Hart (1976) offers the best documentation, but his curves are based on detailed information about structure type and building materials, most of which is not likely to be available in the databases of property appraisers. Damage curves developed by the U.S. Army Corps of Engineers (1990) are widely used.
Coastal erosion damage estimates are problematic because erosion is both a chronic and catastrophic phenomenon. The collapse of a structure from scouring and undermining of its foundation or pilings during a hurricane is the result of the progressive, long-term erosion of the site as well as erosion caused by a storm. Partly for this reason, and because most damage associated with hurricanes and other catastrophic coastal storms is due primarily to storm surge and wind, erosion damage curves have been difficult to develop. However, the Mobile and Philadelphia
districts of the U.S. Army Corps of Engineers have developed such curves (U.S. Army Corps of Engineers, 1994). (For a comparison of the erosion damage curves developed by the two districts, see Coastal Planning and Engineering, 1992.)
The damage functions currently available for hurricane vulnerability assessments primarily apply to private structures and major categories of public infrastructure. Greenwood and Hatheway (1996) summarize a method developed by the Michael Baker Corporation for the Federal Emergency Management Agency's emergency management support teams, which was used during the approach of Hurricane Opal in 1995 to generate ''real-time" maps and dollar estimates of damage to public and private structures based on damage functions. Similar approaches have been taken by Science Applications International Corporation (SAIC) in developing the Consequences Assessment Tool Set (CATS) for FEMA, and by Watson Technical Consulting in developing a hurricane damage model (TAOS) for the Organization of American States. SAIC's CATS model produces real-time and simulation estimates of ordinal levels of damage by structure type from wind storms and storm surge as well as earthquakes and various technological disasters (J. Pickus, Science Applications International Corporation, personal communication, 1997). Watson's TAOS uses a unique storm surge and wind model to estimate damages to various types of private structures and public facilities and is also capable of estimating debris generation and secondary economic impacts (Watson, 1995; C. C. Watson, Watson Technical Consulting, personal communication, 1997).
Several other initiatives are under way. FEMA is working with the National Institute of Building Sciences to extend their HAZUS earthquake loss estimation methodology to flooding and wind storms (see "Earthquakes," above). Researchers at the Florida Planning Lab at Florida State University are developing a model to predict the local costs of response and recovery to hurricanes for each of the public assistance categories under the federal Stafford Act (Boswell et al., 1997). Their model is based on key storm parameters and local land use and demographic information.
Wildfire
Wildfire hazards exist wherever development and wildland fuels meet. Over the last decade, wildfires have devastated over 20,000 square miles, consumed more than 6,500 structures, caused losses estimated in
excess of $2.5 billion, and resulted in over 40 deaths. Yet wildfires in remote wilderness areas are of little consequence in many cases. In fact, from an environmental standpoint, these events actually may be beneficial: some ecosystems require periodic fire (for plant reproduction and nutrient cycling).
Wildfire experts have defined three types of wildfire hazard zones that land use planners should assess:
The classic wildland-urban interface exists where well-defined urban and suburban development presses up against open expanses of wildland areas. The 1985 Palm Coast fire (Florida) is an example of this hazard. The highly intense grassland-crown fire swept into a bordering community subdivision and destroyed 99 homes within just a few hours (Abt et al., 1987).
The mixed wildland-urban interface is more characteristic of the problems being created by exurban development: isolated homes, subdivisions, and small communities situated in predominantly wildland settings. The 1994 Chelan County (Washington) fire is an example, a fire which burned 2,970 square miles (nearly 8 percent of the county land area), destroyed 35 homes and countless nonresidential structures, and required mobilization of 10,000 firefighting personnel (Green, 1994).
The occluded wildland-urban interface exists where islands of wildland vegetation occur inside a largely urbanized area. Prior to the 1991 Oakland firestorm (which took 25 lives, destroyed 2,700 structures, and caused an estimated $1.68 billion in damages), the most notable example of an occluded wildland fire event was the 1933 Griffith Park fire, which took the lives of 25 firefighters in Los Angeles—the worst fire in the nation's history for firefighter casualties (Davis, 1988).
The lesson from the above typology is that very few communities are likely to be completely immune from wildfire hazards, because wildland fuels can be found in a variety of settings. Yet, as in the case of most natural hazards, hazard assessments for wildfires consist primarily of hazard mapping with some extension into vulnerability assessment. Moreover, wildfire hazard mapping itself is not widespread even in traditional wildland settings. To date, most mapping and simulations have been conducted to manage prescribed burns and plan response to fires, rather than for land use planning or policy making about managing development. Yet some notable mapping and mitigation efforts have spe-
cifically addressed wildland-urban-interface problems. These include the Australian Fire Hazard Mapping System (Morris and Barber, 1982), the California Division of Forestry State Responsibility Wildfire Hazard Mapping Program (Paul Barrette, Forester, California Department of Forestry and Fire Prevention, personal communication, 1996), the East Bay Hills Vegetative Management Consortium wildfire hazard mapping project (Radke, 1995), and the Boulder County (Colorado) Wildfire Hazard Information and Mitigation System program (Boulder County Land Use Department, 1994; Hay, 1994). These wildfire hazard mapping efforts vary considerably in scale, detail, and sophistication.
The Australian Fire Hazard Mapping System allows mapping of fire hazard to structures in mixed wildland-urban-interface areas on a map scale of one inch to 50,000 feet. The fire hazard model provides a crude form of risk analysis: estimates of the likelihood of fire occurrence are on an ordinal scale, and probable levels of damage are based on estimated fire intensity and suppression capability. Variables used in the model include frequency of fire season, length of fire season, slope aspect, slope steepness, vegetative cover and moisture levels, fire history, land uses (residential, forestry, etc.), egress from an area, and fire suppression capacity (Morris and Barber, 1982).
The California Division of Forestry has mapped most State Responsibility Areas (SRAs) of the state (about 35 million acres) for high wildfire hazard, taking into account topography, fuel loads, climate, and structural density (at scales of 1 inch to 1 or 2 miles) (Barrette, personal communication, 1996). Senate Bill 79 (1981) and Senate Bill 1916 (1982) require zoning of these predominantly unincorporated areas by county boards of supervisors according to the degree of fire hazard. The Division of Forestry also assisted numerous charter cities and counties in identifying 201 "very high hazard severity zones," as mandated by the Bates Bill, which was enacted after the 1991 Oakland firestorm in the hopes of preventing recurrence of such tragedies. The statute requires localities to identify very high hazard severity zones and adopt ordinances to mitigate wildfire hazards at a level of protection equivalent to or more restrictive than required by state law (e.g., vegetative clearance for a 30-foot perimeter around structures, spark arrestors on chimneys, and Class A roof materials). A subsequent California Attorney General opinion, however, emasculated the Bates Bill by interpreting the statute to require only identification of hazard areas, not official mapping of the hazard zones (Robert Irby, Deputy Chief, California Department of Forestry and Fire Prevention, personal communication, 1996).
The East Bay Hills Hazard Mapping Project is perhaps the most sophisticated occluded interface wildfire hazard identification project completed to date. Professor John Radke of the University of California developed two deterministic hazard models, one based on traditional wildland, fire hazard risk factors (e.g., topography, climate, weather, and fuel conditions) and the other based on expert judgments of urban/ residential fire hazards (e.g., structural and vegetative fueling characteristics). Model outputs are integrated and embedded within a geographic information system to map regional and neighborhood vulnerability for existing and future development. The model also can be used to estimate the impact of mitigative actions on risk. According to Radke (1995), preliminary field analyses of the model have verified the accuracy of the hazard classification system.
The Boulder County Wildfire Hazard Information and Mitigation System (WHIMS) was created through the collaborative efforts of public and private entities to reduce wildfire risks to existing and future development. The WHIMS program uses a GIS-based, vulnerability assessment model to estimate the vulnerability of neighborhoods, structures, and lots to wildfire damage. County fire personnel conduct field surveys to generate much of the data needed for the hierarchical nested model. The model uses 27 variables to produce a vulnerability rating on a 0 (low) to 10 (extreme) scale (Hay, 1994). Model inputs include topographic traits, construction characteristics, vegetative cover, accessibility, and suppression capacity. Results from the model are used for fire prevention outreach to neighborhoods and individual property owners to identify effective mitigation measures to reduce vulnerability to acceptable levels (Boulder County Land Use Department, 1994).
In the future, planners may be able to integrate fire models into GIS-based wildfire hazard assessments. Fire models can describe many aspects of wildfire behavior useful for detailed vulnerability assessment and mitigation planning, including the rate of spread, future perimeter, area of the blaze, length-to-width ratio, and flame lengths (Fuller, 1991). Such modeling would allow land use planners to better understand the relative costs and benefits of alternative mitigation and development scenarios. However, existing models are only designed to consider wildland risk factors, not wildland-urban-interface factors (Finney, 1996; Fuller, 1991). Thus, high-risk meteorological and environmental conditions can be identified, but ignition points are impossible to estimate, and the list of potential sources is extensive (for example, lightning strikes, cigarettes, sparks from machinery, campfires, etc.). The relationship between wild-
fires and urban-interface factors such as structures and public infrastructure is not well enough understood at present to allow for integrated modeling (Radke, 1995). Yet, as the data themes necessary for modeling fires within the wildland-urban interface become increasingly easier to access in GIS-compatible formats, advances may be forthcoming.
IMPLICATIONS FOR POLICY FORMULATION AND IMPLEMENTATION
Land use planning is a complex process that requires the balancing of multiple objectives. For natural hazards to play a significant role in land use management decisions, the factual base detailing the nature and severity of the hazard must be at least as credible as that for the host of other issues that go into determining appropriate land use including real estate feasibility, economic development, transportation, service cost, environmental impact, and impacts on neighboring properties. Hazard assessment is the mechanism that provides this factual basis.
Clearly, a solid baseline of information that identifies hazards is needed for all hazards on a national basis. Regional, state, and federal entities can facilitate use of hazard assessment by providing much of this information, but it is clear that decisions about data precision and geographic scale will affect the utility of such information for local governments. The information will be most useful if it is at a scale of 1 inch to 2,000 feet or better. This level of information is currently available for floods and some aspects of hurricane hazards as a result of mapping carried out for over 20 years by the National Flood Insurance Program. While there is a substantial amount of earthquake information available, it is at varied scales and reflects a wide variety of recurrence intervals and different parameters for characterizing the ground motion. Landslide and wildfire information is available only for a limited number of areas. More extensive application of land use planning and management techniques thus requires a better factual base upon which to operate.
Local planners, policy analysts, and decision makers have important choices of their own to make about the data precision and geographic scale of hazard assessment, the temporal perspective and recurrence interval, and the level of hazard assessment to use. Where data available from secondary sources are not adequate, local officials must decide whether investment in better data is worthwhile. An important consideration in making such decisions will be the level of precision needed to politically justify, and legally defend, decisions about where to draw
boundaries that determine allowable land uses or impose different development regulations.
An even more difficult decision concerns the appropriate recurrence interval that should be the basis for plan making and land use management. This choice crosses the line from technical issues to issues of policy as it directly relates to the question of acceptable risk. For flooding, national policy is to accept the 100-year (1 percent per year) standard; life and property need to be protected against any flood up to this size. The implication is that larger floods are too rare and costly to mitigate through land use means. For seismic hazards, building codes have been based on ground shaking with a 475-year return period. This is higher than for flooding, but it is a life safety standard only—buildings can be damaged, but not collapse. Acceptance of this standard implies that it is worth the expense to save lives for an earthquake up to this size, but that we cannot afford to design for larger earthquakes.
Regardless of whether local officials follow state or federal mandates or incentives, such as the National Flood Insurance Act, or choose recurrence intervals themselves, there is the risk that both public officials and citizens will treat the resulting boundaries, such as the 100-year flood zone, as absolute boundaries between hazardous and non-hazardous areas. This problem can be reduced where local officials and their constituents explicitly consider the trade-offs of alternative specifications of acceptable risk.
Making choices about acceptable risk, that is, what magnitude and likelihood of losses are deserving of public attention, raises a third issue: what level of hazard assessment should be used? One of the greater opportunities that has not been pursued extensively is the potential to use vulnerability assessment and risk analysis to analyze the risks associated with alternative land use plans. Similarly, these two levels of hazard assessment have the potential to provide better understanding of and commitment to land use planning and management initiatives to mitigate natural hazard risks.
Our review of the state of practice, summarized earlier in Table 5-1, reveals that current applications of hazard assessment in land use planning and management predominantly focus on hazard identification, and, to a lesser extent, on using deterministic vulnerability assessment to predict the impacts of extreme natural events of a limited range of intensities. Our review of the state of the art of hazard assessment shows that the last 20 years have seen significant advances in analytic capabilities and digitized land use data which make more advanced hazard assess-
ment feasible. The principal constraints on greater use of these capabilities appear to include the following: (1) uneven knowledge of the probabilities, magnitudes, and locations of some types of extreme natural events; (2) limited parcel-specific data on relevant attributes of land uses, such as the type, design, and construction of buildings; (3) lack of empirically validated damage functions that are accurate at the building or infrastructure-component level for some natural hazards; (4) lack of professional expertise to incorporate sophisticated risk analysis models into land use decision making; and (5) lack of understanding and confidence in these models by appointed and elected officials. These findings suggest areas for research, education, and technical assistance initiatives by state and federal governments, educational institutions, and professional organizations.