Community-Driven Relocation: Recommendations for the U.S. Gulf Coast Region and Beyond (2024)
Chapter: 5 Current Realities of the Gulf Coast
5
Current Realities of the Gulf Coast
This chapter discusses the following:
- U.S. Gulf Coast Region social and economic demographics and associated risks
- In-migration to the U.S. Gulf Coast Region and Gulf coastal shoreline communities
- Reasons why people live in this region, including place attachment and other economic and social factors
- Brief profiles of six Gulf Coast communities that include quantitative information from federal agency datasets (e.g., Federal Emergency Management Agency [FEMA], Centers for Disease Control and Prevention [CDC], U.S. Environmental Protection Agency [EPA]) about flood and other environmental hazards, social vulnerability, health, environmental justice issues, and the impacts of recent tropical cyclones interspersed; the profiles also include community testimonials about these issues
INTRODUCTION
The committee sought to understand the Gulf Coast simultaneously as a region of deep and diverse cultural and social ties to community and place, a key producer of fossil fuels and petrochemical products and services, a destination for recreationists and retirees, a region with cutting-edge
research centers and universities, a major source of marine resources and fisheries, and a harbinger of the nation’s experience with the effects of climate change. In many respects, the U.S. Gulf Coast is a distinctive region with unique demographic, economic, environmental, and social conditions. At the same time, it reflects processes and conditions that occur in coastal regions throughout the country. The history reviewed in the previous chapter reveals Gulf Coast communities’ deep attachment to the land, even as they endured forced migration to and from the region. This chapter functions as a complement to the previous chapter’s long-term historical view and will offer a more contemporary view of the present human condition along the Gulf Coast. To do this, it first reviews the current demographics and migration patterns that are presently shaping risk in this dynamic region. As the population grows mainly along the shore, despite the risks, the committee considers it essential to understand and account for the strong attachments to place that are based in histories, livelihoods, and local cultures. Additionally, this chapter examines economics and commerce as factors in shaping life and society in the region. Finally, it concludes with a series of community profiles from across the Gulf Region that couples the scale of the threat of displacement (introduced in Chapter 2) with existing socioeconomic, health, and environmental justice datasets. The community profiles are of communities the committee engaged during workshops and webinars in each Gulf state.
Gulf Coast Demographics
The Brookings Institution created maps based on 2020 Census data that reflect coastal counties with significant “non-White” populations (defined as counties with ethnic groups exceeding the national average for that group).1 Coastal counties in Texas and Florida reflect significant Latino or Hispanic populations. Alabama, Mississippi, and Louisiana coastal counties have sizable Black populations. Southeast Texas and Terrebonne Parish, Louisiana, reflect large populations that self-identify as belonging to two or more racial groups (Frey, 2021). Data from the American Community Survey (ACS) and the 2010 U.S. Census showed that throughout the Gulf Coast, Hispanics or Latinos make up the largest racial or ancestry group after White, reported as over 29 percent in 2010 (LSU AgCenter, 2012). African Americans represent the second largest race or ancestry group at 19 percent of the total population. Asians represent almost 3 percent of the population. Indigenous peoples represent about two-thirds of 1 percent.
___________________
1More information about the Brookings Institution’s diversity maps is available at https://www.brookings.edu/articles/mapping-americas-diversity-with-the-2020-census/
Individuals identifying as White constituted 64 percent of the population (LSU AgCenter, 2012).
Gulf Coast Economies and Associated Risks
Population distributions across the Gulf Coast are a mixture of high- and low-density communities. Major urban agglomerations (e.g., Tampa/St. Petersburg, Mobile, New Orleans, Houston) are hubs for an array of urban services, including finance, medicine, education, and entertainment. A number of smaller cities (e.g., Pensacola, Biloxi, Gulfport, Houma, Lake Charles, Galveston, Corpus Christi) depend on ports and shipbuilding, the military, gaming, and petroleum-related industries. Smaller coastal communities depend on commercial fishing and oil and mineral extraction, and have also evolved into retirement and tourism enclaves.
From the extraction of fossil fuels to the abundance of marine life, natural resources lie at the heart of many economies of Gulf Coast communities. This section details several ways in which these communities are economically impacted by and vulnerable to changes in the environment, major weather events, and climate change. A coastal economic vulnerability index noted that within the territory from the central panhandle of Florida to Galveston Bay, the coasts of Terrebonne, Lafourche, and Plaquemines parishes were the most economically vulnerable (Thatcher et al., 2013). Key factors in defining economic vulnerability were physical exposure to coastal hazards and a concentration of economic infrastructure. Lower Lafourche Parish has substantial offshore mineral industry infrastructure at Port Fourchon, plus a highly exposed physical setting. Adjacent Terrebonne Parish has both mineral and fisheries infrastructure and low-lying topography. Southeast Texas and southwest Louisiana also had elevated scores in the index with their concentration of petrochemical industry infrastructure. These locations tend to have modest economic diversity, which could accentuate vulnerability. In contrast, low vulnerability tends to exist in locations with low population density and urban development, along with lower physical exposure, such as the Mississippi and Alabama coasts (Thatcher et al., 2013).
Natural resource-based economies depend on adequate resources. Humans pursue those resources, deploy technology to gather them efficiently, and market those products. The Gulf of Mexico is productive with numerous forms of commercial marine life: shrimp, crabs, oysters, menhaden, and mullet, along with numerous types of sport fish. These marine species have supported commercial fisheries since the 19th century and have suffered overfishing in the past. Conservation policies enacted since the late 19th century sought to protect these marine populations to ensure sustainable fisheries. Policies limiting the seasons and regulating harvest gears improve
the abundance and distribution of target species, although fishing families have found some regulations to impede customary practices, thus forcing adaptations to traditional livelihoods (Colten, 2014).
Environmental conditions directly impact the economic viability of coastal communities. Additionally, these conditions are often affected by human activity, both in terms of pollution and clean up. Nutrients transported into the Gulf from farm fields in the upper Mississippi River basin have contributed to a chronic seasonal hypoxic zone in the Gulf that impacts marine life. Pollution from industry and cities has disrupted fisheries in Apalachee and Galveston bays, and algal blooms and red tides are disruptive off the coast (Kennicutt, 2017; United Nations Environment Programme, 2018). Proposed coastal restoration projects in Louisiana would impact shrimp and oyster production (Parker, 2022; Schleifstein, 2023). In addition to the impacts of environmental conditions on the economic viability of coastal communities, fisher families are facing increased competition from farm-raised shrimp in Asia and high fuel costs, which makes shrimping a marginal livelihood (Bourgeois et al., 2016; Marks, 2012). Subsistence fishing of shrimp and mullet is also important to local diets and culture (Burley, 2010; Mayer et al., 2015; Zacks, 2019). These natural-resource economic pursuits are important locally and do not have an assured future.
While agriculture is a vital component of the economies of the Gulf Coast states, the coastal shoreline counties are seldom among the top agricultural counties (other than aquaculture). Ranching is found in coastal counties in Texas and Louisiana, where extreme heat can stress dairy cows and livestock (Carter et al., 2014) and water inundation can become fatally deep for some calves (Gustin, 2017). Pine plantations exist from Florida to Louisiana; however, tropical cyclones can have a profound impact on pine forests, croplands, and grazing lands. Strong winds can topple trees and destroy a slow-growing crop. Sugar cane in Texas and Louisiana can suffer destruction during hurricanes as well. Meanwhile, rising sea levels mean that saltwater intrusion threatens aquifers used by rice farmers in Louisiana and Texas for flooding their fields (McClain, 2003; Zhang, 2020).
The oil and gas industry is an important component of Gulf Coast economies, but it faces serious risks from rising seas and more intense storms. This industry includes both oil extraction, mostly offshore, and transport and processing in key petrochemical hubs near Houston, Lake Charles, and New Orleans. The combination of rising sea levels and intensifying storms can threaten operations near the coast, particularly around Galveston Bay, Port Arthur, Lake Charles, and downstream from New Orleans (Hemmerling, Barra et al., 2020). For example, tropical cyclones can damage or disrupt the petrochemical infrastructure on the Gulf Coast. They can also prompt temporary shutdowns of oil and gas platforms, including the evacuation of personnel, in order to minimize harm to personnel and
facilities. Such shutdowns affect local workers and are also disruptive to the national petroleum supply chain.
In addition to its susceptibility to storm disruptions, the oil and gas industry has a record of boom and bust economic cycles (Brown et al., 2011; Gramling & Brabant, 1986). Activity soars when global prices are high and sags when prices sink. This causes economic and social stress to communities dependent on these industries (see Figure 5-1).
Oil releases from offshore operations and tanker spills, caused by natural events, have disrupted commercial fisheries since the 1930s and negatively affected recreational activities (Colten et al., 2012, 2015). Damage to industrial facilities during Hurricane Katrina released hazardous materials and petroleum, and the overall disruption to production in the region caused a spike in gasoline prices (Santella et al., 2010). Damage in the Houston/Galveston Bay region during recent hurricanes also caused damage and fires at industrial facilities (Misuri et al., 2019). Lake Charles refineries also experienced damage that contributed to the emission of chemicals due to Hurricane Laura (Schwartz & Tabuchi, 2020). Thus, while oil and gas have strong support from state governments in Louisiana and Texas, the eastern Gulf Coast states are wary of the damage this economic sector can cause to their recreational economies (Hedden, 2020; Nelson & Grubesic, 2018).
CLIMATE CHANGE AND RECENT/PROJECTED MIGRATION TOWARD AND AWAY FROM THE COAST
According to the 2010 U.S. Census, 23,802,699 people lived in coastal shoreline counties in the Gulf region (National Oceanic and Atmospheric Administration [NOAA], 2013). Florida has more than 14 million residents living in shoreline counties (Gulf and Atlantic coasts combined), followed by Texas, where over 6 million people live in shoreline counties (as shown in Table 5-1). Alabama and Mississippi have narrow coasts with multiple bays and inlets, and together they have fewer than 1 million residents in shoreline counties. Louisiana has a larger, less habitable coastline, where over 2 million people live in shoreline counties.
In-Migration to the U.S. Gulf Coast Region and Gulf Coastal Shoreline Communities
Increased population density increases risks to people, infrastructure, and ecologies. NOAA reported that coastal population growth rates outpaced those of inland areas, with 123.3 million (39% of the U.S. total) people living in coastal shoreline counties. Florida and Texas have seen the
SOURCE: U.S. Census Bureau. (2019). Coastline America. https://www.census.gov/library/visualizations/2019/demo/coastline-america.html
most dramatic population growth in shoreline Gulf counties (U.S. Census Bureau, 2021b; see Table 5-1). In-migration caused Florida’s total population to nearly triple from 6.8 million in 1970 to 22 million in 2020 (U.S. Census Bureau, 2021b). Growth was pronounced in the coastal shoreline counties, where the growth rate was 165 percent between 1970 and 2010 (NOAA, 2013). The Tampa-St. Petersburg-Clearwater metropolitan statistical area grew from 1 million in 1970 to over 3.1 million in 2020 (U.S. Census Bureau, n.d.; U.S. Department of Commerce, 1972).
Texas’ statewide population more than doubled from 11.2 million in 1970 to 29.1 million in 2020. The state’s coastal shoreline counties registered a 107 percent growth between 1970 and 2010 (NOAA, 2013; U.S. Census Bureau, 2021b). The Houston-The Woodlands-Sugar Land metropolitan statistical area, which includes Galveston, grew from 2.2 million in 1970 to over 7.1 million in 2020 (Texas Real Estate Research Center, 2022).
Louisiana’s shoreline population growth between 1970 and 2010 was the smallest of the five Gulf Coast states, with a high percentage of elderly residents, many of whom retired and chose to stay at their current locales.
Other coastal metropolitan areas, such as Pensacola, Mobile, Biloxi-Gulfport, and Corpus Christi, also reported significant growth (Macrotrends, 2023; Mississippi Regional Economic Analysis Project, 2023). Upward projection of current trends and the amplification of existing trends portend upward trends for other Gulf Coast cities facing more intense tropical cyclones and sea level rise.
The impact on human and ecological communities in the aftermath of tropical cyclones, in conjunction with social and economic factors, has significantly impacted coastal population growth trends. A common pattern of demographic change in the U.S. Gulf Coast Region is the continuation, acceleration, and exacerbation of current trends (e.g., urban renewal,
| State | Shoreline County Population | % of Population Change 1970–2010 | % Change Over 65 Years of Age 1970–2010 | % Living in Poverty |
|---|---|---|---|---|
| Alabama | 595,257 | 58 | 702 | 17 |
| Florida | 14,468,197 | 165 | 208 | 13 |
| Louisiana | 2,2247,053 | 23 | 89 | 16 |
| Mississippi | 370,702 | 54 | 202 | 15 |
| Texas | 6,121,490 | 107 | 198 | 18 |
SOURCE: NOAA. (2013). State of the coast: National Coastal Population Report, Population trends from 1970 to 2020. https://aambpublicoceanservice.blob.core.windows.net/oceanserviceprod/facts/coastal-population-report.pdf
gentrification, rural depopulation) following major storms, which contributes to an increase in population in those areas that can offset short-term decreases in population immediately after the storm.
Florida, for example, has experienced short-lived population departures from coastal areas following major storms. The panhandle region registered a delayed out-migration in 1996 after Hurricane Opal in 1995, but over the course of several years, there was also in-migration, which offset the departures. The 2005 hurricane season in Florida followed multiple storms in 2004. Home sales in southwest Florida declined, but the downward trend was not long-lived (National Association of Realtors, 2006). Following Hurricane Ivan (2004), Pensacola, Florida, showed higher price trends from larger and expensive homes sold immediately after the storm and speculations of wealthy vacation owners inclined to sell and withdraw from the market (National Association of Realtors, 2006).
Population growth after major storms is not always the case, however. New Orleans had been experiencing population loss since the 1960s. In 2000 the population of New Orleans was 484,674 but fell by more than 50 percent by 2006 (Hurricane Katrina occurred in 2005; Plyer, 2016), with significant loss occurring in the city’s center (Zaninetti & Colten, 2012). Importantly, population change via migration in one community suggests change in other communities, and much of the post-Hurricane Katrina movement was to and from nearby areas within the region (Curtis et al., 2015; Fussell et al., 2014). Hurricanes Laura (2020) and Ida (2021) prompted some residents to relocate, although there was not complete abandonment of towns and other factors have contributed to the chronic rural depopulation in the region (Mitchell, 2023). In southeast Louisiana, migration has occurred mostly among those with the means (i.e., wealth, job opportunities, etc.) to relocate inland. Elderly and minority populations remain as younger and more mobile individuals move away from the coast (Hemmerling, 2017).
In more extreme cases of storm impact on population, numerous coastal towns across the Gulf have been “depopulated” by storms throughout the Gulf’s history. For example, the once thriving port of Indianola, Texas, fell victim to hurricanes in 1875 and again in 1886, which forced citizens to abandon the town. Cheniere Caminada, Louisiana, a small fishing village, experienced gradual abandonment effort after an 1893 storm. Galveston, Texas, however, launched a major rebuilding and fortification after a devastating 1900 hurricane. Biloxi-Gulfport, Mississippi, also rebounded after Hurricane Camille in 1969 and Hurricane Katrina in 2005 (Colten & Giancarlo, 2011). It is important to note that severe weather events alone rarely cause complete abandonment of older, larger legacy communities. However, when combined with other social, economic, and political factors, severe weather events contribute to the process of displacement.
Receiving communities often lack the support or political, social, and economic resources to prepare for influxes of displaced, traumatized families
in need of social services like health care, education, infrastructure (housing, roads, etc.), and employment support. The tendency for unsustainable growth and development (e.g., St. Tammany Parish, Louisiana, building in floodplains; Hickey, 2022) is compounded by a lack of broader regional plans to help guide population shifts (Vock, 2021).
Hauer et al. have projected demographic changes for coastal locations facing sea level rise by 2100. Their research indicates that the Tampa-St. Petersburg metropolitan area (site of Workshop 3) is a U.S. Gulf Coast Region that may experience “serious levels of population impact” and risk of decline under a 1.8 sea level rise scenario (Hauer et al., 2016, p. 693). Alabama, Texas, Mississippi, and Louisiana also are projected to see populations at risk of decline. In a follow-up study, Hauer (2017) projected considerable population departures from southwest Florida and southeast Louisiana, as opposed to fewer departures from the Florida Panhandle, southern Alabama and Mississippi, and coastal Texas (with the exception of the Houston metro area). Significantly, Hauer’s research suggests that not all coastal areas will see future mass out-migration, as explained below. For example, local topography and deliberate adaptation measures might offer protection in some locations, thereby potentially mitigating the need to move away from the coast. Study scenarios suggest that future inland migration will likely flow toward nearby cities. For departures from the Gulf Coast, the study projects inland cities such as Orlando, Atlanta, and Austin as receiving cities (Hauer, 2017).
Louisiana, with its exceptionally vulnerable coastline and compromised barrier islands (primarily used for recreation and fishing), is already experiencing inland migration and has been for some time. By using post office closures as a measure of depopulation, Hemmerling (2017) has shown a gradual migration since the 19th century. Notable pulses of population decline followed major storms from 2000 to 2010. Inland movement among Louisiana’s coastal residents, those with deep family ties and place-based relationships, has tended to be modest shifts “up the bayou” where migrants can still live supported by familial and cultural ties (Colten et al., 2018; Hemmerling, 2017; see Box 5-1). These movements have not been coordinated or assisted by government programs. In fact, from a comparative perspective across the Gulf region, Louisiana has the lowest in-migration rates, and migration is largely within the state. Data released by the U.S. Census Bureau report that between April 1, 2020, and July 1, 2022, 67,508 residents left Louisiana (Skinner, 2022; U.S. Census Bureau, 2023b).
REASONS WHY PEOPLE LIVE ON THE GULF COAST
Several factors contribute to modern settlement along the Gulf Coast. Prior to 1900, coastal settlements were founded in areas where trade,
BOX 5-1
Community Testimonial: Migrating up the Bayou
“Migration is a part of our history. It’s something that, as coastal residents, that our families have been doing for an awful long time. So, this isn’t necessarily anything new. This isn’t our first rodeo with this experience. Most of our people migrate one town north up the same watershed. And I’m an example of that, in my family over the past three generations. And so, my dad grew up in Cocodrie, which is the town that is the furthest down the bayou [...] And so, he grew up in a town the furthest down the bayou. He and my mom got married, and then moved to Chauvin, one town north. Hurricane Juan in 1985 put two feet of water in our house, and that’s when our parents—my parents decided to look for land that was a little bit higher. So, while the water was high, they drove around and found that Bourg was the highest bit of land that they saw. And they said this is where we’re going to buy property and build our home. And so, they did. But then, when it came time for me to buy a house, I went up the same watershed and moved to Houma. Now, again, in terms of those watersheds, Terrebonne Parish has five bayous. So, if I’m in Cocodrie and moving to Chauvin, then I’m moving to Bourg. If I’m in Cocodrie, I’m not moving to Montegut, and I’m not moving to Dulac, I’m moving up the same watershed, right.”
SOURCE: Jonathan Foret, Executive Director, South Louisiana Wetlands Discovery Center. Workshop 3: Assisted Resettlement and Receiving Communities in Louisiana, July 2022, Houma, Louisiana.
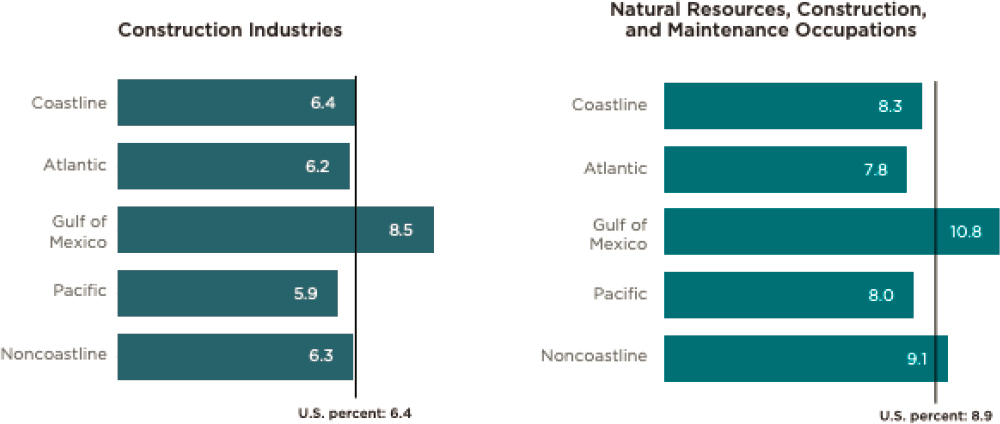
shipping, and natural resources provided livelihoods (Davis, 2017) and local resource extraction drove economies, beginning with agricultural exports (rice, sugar, and cotton), forest resources (pine, cypress, oak, cedar, and naval stores), fishing, and oil and gas. Since the mid-20th century, beaches, recreation, and warm-weather retirement, and more recently gaming, have fueled rapid development in Texas, Mississippi, Alabama, and Florida (Davis, 2017; Meyer-Arendt, 1987). Additionally, the U.S. Gulf Coast Region broadly (i.e., coastal and inland) has the highest percentage of the workforce in construction industries and in natural resources, construction, and maintenance occupations as compared with other coastal regions in the United States (see Figure 5-1, above). In some cases, land allotments (i.e., reservations) for federally recognized tribes are instrumental for Indigenous peoples to remain on or near traditional lands in the coastal region (Parfait, 2019). This section first identifies place attachment as a factor in decisions to stay or move away and looks at various forms this attachment takes; it then briefly reviews other factors shown to influence decisions around relocation.
Place Attachment
Place attachment presents both practical and psychological barriers to relocation alongside obstacles such as a lack of economic opportunities and a distrust of top-down relocation options (Chapters 4 and 7). Broadly, “place attachment” refers to the relationship between people, place, and process (i.e., ways individuals and groups relate to a place; Scannell & Gifford, 2010) and can be understood in terms of an emotional bond between people and their environments (Masterson et al., 2017). Individuals develop personal connections to place, whereas groups develop social meanings associated with place via, for example, ancestral and social structural ties, religious sentiment and rituals, historic events, material and livelihood connections, and other expressive cultural forms such as names, stories, songs, and visual art, all of which comprise communities’ senses of place (Amundsen, 2015; Feld & Basso, 1996; Thornton, 2008). The environment in and of itself gives form to the social meaning of place and thus informs place attachment (Stedman, 2003).
Scholars have conceptualized place attachment in multiple ways, including sense of place, place identity, place making, place dependence, topophilia, and rootedness (DeMiglio & Williams, 2008; Gurney et al., 2017; Khalil & Jacobs, 2021; Low & Altman, 1992; Tuan, 1980; Ujang, 2012). Some scholars delineate elements of place attachment (i.e., place identity and place dependence; Dandy et al., 2019; Williams & Vaske, 2003), while others assert such distinctions are artificial. The latter point often, although not exclusively, emerges in contexts of Indigenous peoples and communities (Carter, 2010). Generally, sense of place and place attachment are the principal terms used to describe how humans create and relate to places through “dwelling” or inhabitation.
Economic relationships with the environment also inform place attachment. People with livelihoods dependent on natural resources relate to their natural environment in distinct ways; additionally, they may perceive and respond to environmental risks differently (Kroll-Smith & Couch, 1993). For example, studies in the U.S. Gulf Coast and Canada have found environmental complacency (i.e., inaction in the face of climate change) among oil workers in contrast to fishers, whose well-being is dependent on a healthy marine environment (Cope et al., 2013; Milnes & Haney, 2017; Picou & Gill, 1996). Damage to the resource base results in damage to fishers’ identity and way of life (Henry & Bankston, 2002; Oberg et al., 2016). However, it is important to note that both oil workers and fishers have limited influence on how their respective industries affect the environment.
Attachment to place, strong family ties, and land and water relationships are essential to quality of life, security, and cultural sovereignty (see Chapter 6). Burley (2010) and Simms et al. (2021), among others, emphasize the
powerful bonds that coastal residents in Louisiana have to their home territory. Additionally, strong place identification is prominent among residents of Galveston, which has housed island communities since Indigenous migrations (Hardwick, 2002). (Chapter 6 further elaborates on place attachment in relation to relocation and well-being.) Consequently, despite grave risks such as tropical cyclones and sea level rise, many coastal residents are reluctant to move inland. Long-term residents and place-based communities are accustomed to tropical cyclones. They may “retreat” temporarily but have a high dependence on coastal resources and historically possessed the capacity to rebuild, and therefore have not considered seasonal hurricanes as a sufficient reason to migrate. Fishing communities across the coast, including those with other diverse backgrounds, share a similar connection to local livelihoods that cannot be replicated inland. Rich histories and lifeways in old settlement communities like Port Arthur, Texas, currently surrounded by petrochemical industries, are a powerful dissuasive force. In addition, participants from the Port Arthur workshop and community meeting were mindful that the unknowns of a new destination would deter retreat and departures from home (National Academies of Sciences, Engineering, and Medicine, 2022c). For legacy populations—descendants of earlier migrants, including Acadian, Black, Isleño, or Southeast Asian groups—a familiarity with the local ecology and traditional fishing practices and a strong sense of cultural and ethnic identity shared by members of the community constitute an attachment to place and contribute to the resilience and strength of community (Colten, 2017). However, even with a strong track record of adaptations to remain in place, the present and future projections of rising seas and more extreme weather could exceed the adaptive capacity of Gulf Coast residents.
Other Reasons to Remain in Place
Alongside attachment to place, there are additional anchors that bind people to their current Gulf Coast locales. Retirees from outside the Gulf region who have migrated to Florida, for example, have already uprooted themselves and are not inclined to move again. Vietnamese residents in Alabama also recall their forced dislocation from their homeland and struggles to re-establish themselves in the United States (National Academies, 2022d). The painful process of establishing strong roots and re-building “place” discourages interest in relocating.2
___________________
2Based on comments the committee heard at public information-gathering sessions. More information about these sessions is available at https://www.nationalacademies.org/our-work/managed-retreat-in-the-us-gulf-coast-region#sectionPastEvents
Familiarity with local institutions and services is another compelling reason why many seniors opt not to follow younger family members inland (Simms, 2017; Simms et al., 2021). The rising cost of flood insurance makes selling houses in coastal areas more difficult and reduces the equity a homeowner could apply to an inland home, increasing the weight of the anchor of place (Colten, 2017). While tropical weather events can have devastating impacts, long-term coastal residents often believe that they know how to cope with these storms; like people in other locations with different hazardscapes, they do not see familiar risks as sufficient reason to relocate, and indeed, many have endured many tropical cyclones and remained in place. With rising seas and more extreme weather, newer residents to the Gulf Coast are likely to be unable to adapt to these environmental changes.
COMMUNITY PROFILES
This section features comparative profiles of six coastal communities across the region facing climate threats. Communities are introduced via summaries of community profiles (the full profiles are available in Appendix C) and residents’ first-hand accounts of their experiences, here called “Community Testimonials.” Together, these data provide a composite portrait of the diverse communities in the region. The committee notes that when considering a community’s capacity to plan for and participate in adaptive relocation, it is necessary to also consider the breadth of social, economic, and environmental issues faced by the community; the history of climate impacts and potential future climate-induced hazards on the locale; and community planning to address these issues (e.g., hazard mitigation, comprehensive plans). The following profiles combine the “scale of the threat of displacement” (as explored in Chapter 2 of this report) with datasets about hazard and health risks, and EPA’s Environmental Justice Index (EJI).
To “ground truth” the sociodemographic data (Carp, 2008; National Academies, 2019a), the committee interacted with community stakeholders through public information-gathering sessions (Chapter 1, Box 1-2) and discussed risks and how risks influence decision making about relocation. Community testimonials give important context to the quantitative datasets and articulate community needs in terms of climate services and other support. The committee’s approach to understanding community experiences and how risks influence relocation decision making underscores the utility of pairing quantitative and qualitative information. As we note at the end of this chapter, the committee’s approach resulted in two conclusions about the utility of data.
Overview of the Following Profiles
This section includes an abbreviated community profile and data visualizations for each community in which the committee hosted a workshop, plus Mobile and Harrison Counties in Alabama and Mississippi, respectively, highlighting the communities of Bayou La Batre, Alabama, and Turkey Creek, Mississippi. Each of the community profiles in this chapter includes a brief introduction, followed by data on current and projected flood risk, social vulnerability and health, risk to 19 natural hazards included in FEMA’s National Risk Index, environmental justice issues based on EPA’s Environmental Justice Screening Tool (EJScreen), and a list of significant tropical cyclones affecting the community’s portion of the Gulf Coast since 2000. More information on each community and the data sources used for these profiles can be found in Appendix C.
City of St. Petersburg, Florida, Including Pinellas County
Introduction
St. Petersburg, the location of this study’s second workshop, is located on the Gulf Coast of Florida in Pinellas County on the Pinellas Peninsula, between Tampa Bay and the Gulf of Mexico. The city was incorporated in 1903 (City of St. Petersburg, 2023) and, as of 2020, had an estimated population of 258,356 (U.S. Census Bureau, 2023a), making it the fifth most populous city in the state. It forms part of the Tampa-St. Petersburg-Clearwater metropolitan statistical area, which has a population of approximately 3.2 million (U.S. Census Bureau, 2022).
Current and Projected Flood Risk
The Coastal County Snapshots from the NOAA Office for Coastal Management3 reveal that almost 40 percent of Pinellas County’s land is within the designated 100-year floodplain. This floodplain region is inhabited by nearly 30 percent of the total populace and 34 percent of individuals aged 65 or older, and houses 16.4 percent of crucial facilities and nearly a quarter of local businesses. The county witnessed more than 12,000 flood insurance claims between 1991 and 2020, amounting to 152 million dollars. An analysis by the Union of Concerned Scientists4 predicts that under
___________________
3The Coastal County Snapshots online tool is available at https://coast.noaa.gov/digitalcoast/tools/snapshots.html
4More information on the national analysis from the Union of Concerned Scientists is available at https://ucsusa.maps.arcgis.com/apps/MapSeries/index.html?appid=cf07ebe0a4c9439ab2e7e346656cb239
a moderate sea level rise scenario, 256 homes in St. Petersburg, valued at nearly 130 million dollars, will risk chronic inundation by 2035. By 2100, this risk is expected to escalate to include 19,383 homes, accommodating 35,665 residents, with a value of close to 5 billion dollars. This heightened threat to housing from flooding coupled with other infrastructure loss and damage emphasizes the pressing need for elected officials to tackle these intersecting issues to guarantee the well-being of Pinellas County residents (see Boxes 5-2 and 5-3).
Social Vulnerability Index and Health
Pinellas County is classified as having a medium-to-high level of vulnerability, according to a 2020 Social Vulnerability Index (SVI) score of 0.7247 out of 1, which combines sociodemographic factors such as poverty, access to transportation, and crowded housing.5 Pinellas County’s high SVI score of 0.8444 for housing type and transportation indicates significant vulnerabilities related to housing conditions and accessibility, pointing to potential issues such as inadequate affordable housing and limited or unreliable public transportation. While St. Petersburg generally exhibits levels of asthma, heart disease, and poor mental health close to national averages,
BOX 5-2
Community Testimonial: Cascading Problems—Housing and Transportation
“What’s going on with housing right now? People being forced out of their neighborhoods or their communities because of gentrification. The majority of these people are workers. If transportation is abysmal, how are they supposed to get into the city and work these 15-dollar-an-hour jobs as essential workers? People don’t think about the planning that goes into making the city function and we need to see some changes from our elected officials because of all these intersecting vectors people aren’t paying attention to it.”
SOURCE: Getulio Gonzalez-Mulattieri, Resident of St. Petersburg, Florida. Workshop 2: Opportunities & Challenges of Climate Adaptation on Florida’s Gulf Coast, July 2022, St. Petersburg, Florida.
___________________
5The highest SVI score is 1, meaning that all SVI scores will be 1 or lower. A location’s social vulnerability decreases as the SVI decreases. The SVI represents a ranking for each tract or county, meaning that a score of 1 indicates the county or tract with the most vulnerability within the state or nation. SVIs reported in this chapter reflect rankings within the state. More information about the SVI from CDC’s Agency for Toxic Substances and Disease Registry is available at https://www.atsdr.cdc.gov/placeandhealth/svi/fact_sheet/fact_sheet.html
BOX 5-3
Community Testimonial: Sea Level Rise, Flooding, and Isolation
“But really, the nature of sea level rise inundation is going to fundamentally reshape living on the coast. It’s making places unlivable. It’s making livelihoods unlivable. And it really is an irreversible condition. But for municipalities that are already juggling these multiple priorities with limited funding, they are seeking to strike a rational balance. They don’t want to over-adapt, especially in the face of uncertainty and slow change. But they also don’t want to under-adapt to the inevitability of these future risks. So, the struggle here is, at what point do the community risk of exposure and impact outweigh the benefit of being on the coast, right? When did they become salient enough to trigger commitment to a strategic and costly movement away from the coast to higher ground?”
SOURCE: Tisha Holmes, Assistant Professor, Department of Urban & Regional Planning, Florida State University. Workshop 2: Opportunities & Challenges of Climate Adaptation on Florida’s Gulf Coast, July 2022, St. Petersburg, Florida.
“I live in Clearwater, and my home is about 15 feet above sea level. There is good drainage, so we really have not had an issue with flooding in my specific area. However, every time we experience heavy rainfall, it becomes difficult to access or leave my area. The main roads, which are two-lane roads with one lane going and one lane coming, turn into rivers. We find ourselves isolated whenever severe water-related situations occur. And that’s a main concern that we have.”
SOURCE: Eliseo Santana, Resident of St. Petersburg, Florida. Workshop 2: Opportunities & Challenges of Climate Adaptation on Florida’s Gulf Coast, July 2022, St. Petersburg, Florida.
underserved regions such as Child’s Park, Lake Maggiore, and Pinellas Park, where over 25 percent lack health insurance, reveal heightened vulnerability within the county (see Box 5-4).6
FEMA’s National Risk Index
FEMA’s National Risk Index is a dataset and online tool that provides a “baseline risk measurement” for U.S. counties and census tracts to
___________________
6Health data come from the CDC Places website (https://experience.arcgis.com/experience/22c7182a162d45788dd52a2362f8ed65) using data from CDC’s Behavioral Risk Factor Surveillance System (https://www.cdc.gov/brfss/index.html).
BOX 5-4
Community Testimonial: Climate-Related Health Concerns
“Air quality control is an issue here in South St. Pete, Childs Park area specifically. And we have a campaign: Smell Something, Say Something. And we’ve actually started putting up air quality monitors in that area, and we’re in the process of putting up more. But this is a very, very important issue. We’ve known about it years’ past in industrial areas, but unfortunately, there’s still areas here today that are industrial, and there’s bad air quality. Which, as we know, causes different sicknesses and illnesses, particularly in our communities […] we have a website through the city, See, Click, Fix. So anytime somebody smells something that’s out of the ordinary, they report it. So now we have data tracking the air quality issues.”
SOURCE: Antwaun Wells, Resident of St. Petersburg, Florida. Workshop 2: Opportunities & Challenges of Climate Adaptation on Florida’s Gulf Coast, July 2022, St. Petersburg, Florida.
“Without regards to climate, African Americans are disproportionately affected by human disease such as heart disease, which is the number one cause of death in the African American community, and in the White community as well. But African Americans have a higher incidence of heart disease. African Americans have […] the highest incidence of prostate cancer than any other group in the world […] Most other cancers are disproportionately affecting the African American communities […] Then you have cerebrovascular disease, renal disease, HIV and AIDS, nine times the incidence, five times the incidence of amputations as a result of diabetes.”
SOURCE: Kenneth Bryant, Founder and Chief Executive Officer of Minority Health Coalition of Pinellas, Inc. Workshop 2: Opportunities & Challenges of Climate Adaptation on Florida’s Gulf Coast, July 2022, St. Petersburg, Florida.
“illustrate the communities most at risk for 18 natural hazards.”7 FEMA’s National Risk Index is calculated using three components: a natural hazard risk component (expected annual loss [EAL]8), a consequence enhancing
___________________
7More information about FEMA’s National Risk Index is available at https://hazards.fema.gov/nri/learn-more and in the National Risk Index Technical Documentation (Zuzak et al., 2023).
8According to FEMA, “Expected Annual Loss (EAL) represents the average economic loss in dollars resulting from natural hazards each year. It is calculated for each hazard type and quantifies loss for relevant consequence types: buildings, people, and agriculture. As the natural hazards component of the National Risk Index, an Expected Annual Loss score and rating represent a community’s relative level of expected losses each year when compared to all other communities at the same level. An Expected Annual Loss score is positively associated to a community’s risk; thus, a higher Expected Annual Loss score results in a higher Risk Index score.” More information is available at https://hazards.fema.gov/nri/expected-annual-loss
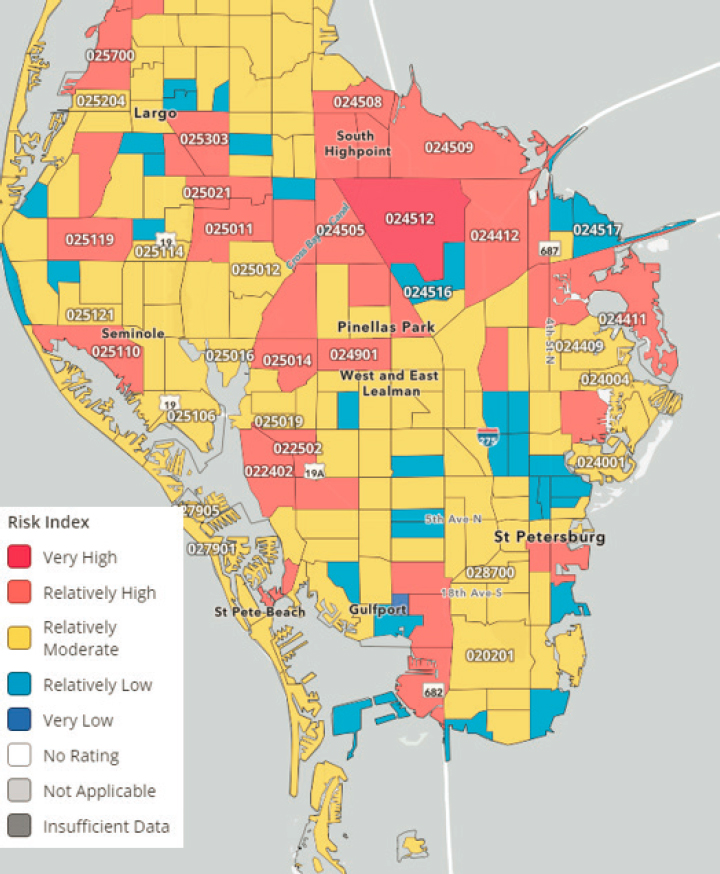
risk component (social vulnerability9), and a consequence reduction risk component (community resilience10; Zuzak et al., 2023).11 The index ranks Pinellas County in the 99th percentile in the nation and 91st percentile within Florida (see Figure 5-2), meaning that only about 1 percent of counties in the United States and 9 percent of counties in Florida have a higher risk index than Pinellas County.
The National Risk Index for Pinellas County (see Figure 5-2) reflects relatively high12 EAL and social vulnerability with very low community resilience (FEMA, 2023h). Of the 18 hazards included in the National Risk Index, Pinellas County has ratings above the 80th percentile in the nation for coastal flooding, cold wave, hurricane, lightning, and tornado. With percentiles around 99th and above, Pinellas County is one of the most at-risk counties in the United States for hurricanes, lightning, and tornadoes. The EAL from all hazards (building value, population, and/or agriculture value) for Pinellas County is over 325 million dollars.
EPA’s EJScreen
According to EPA’s EJScreen,13 St. Petersburg is above the 50th percentile in the nation on particulate matter 2.5 (“fine inhalable particles, with diameters that are generally 2.5 micrometers and smaller”14), ozone15 (a greenhouse gas composed of three atoms of oxygen), diesel particulate matter, air toxics cancer risk, air toxics respiratory hazard index (HI), toxic releases to air, traffic proximity, lead paint, superfund proximity, proximity
___________________
9Social vulnerability comes from the SVI (described previously in this profile). More information is available at https://hazards.fema.gov/nri/social-vulnerability
10The community resilience score in the National Risk Index represents the relative level of a community’s resilience compared to all other communities at the same level. A community’s Community Resilience score measures its national rank and is inversely proportional to a community’s risk. A higher Community Resilience score results in a lower Risk Index score. More information is available at https://hazards.fema.gov/nri/community-resilience
11Community resilience measures come from the University of South Carolina’s Hazards and Vulnerability Research Institute’s Baseline Resilience Indicators for Communities (Zuzak et al., 2023, p. 4-4). More information is available at https://hazards.fema.gov/nri/community-resilience
12The National Risk Index ranks levels of risk in the following categories: very high risk is 80th–100th percentile, relatively high is 60th–80th, relatively moderate is 40th–60th, relatively low is 20th–40th, and very low is 0–20th (Zuzak et al., 2023, p. 3-3).
13More information about EPA’s EJScreen is available at https://ejscreen.epa.gov/mapper
14More information is available at https://www.epa.gov/pm-pollution/particulate-matter-pm-basics
15High ground-level ozone (ozone in the troposphere) may cause an array of health issues that irritate the lungs, especially in individuals with lung conditions like asthma, as well as in children and the elderly. More information is available at https://www.epa.gov/ozone-layer-protection/basic-ozone-layer-science
SOURCE: FEMA. (2023h). National Risk Index: Explore the map. https://hazards.fema.gov/nri/map
to hazardous waste, underground storage tanks, and wastewater discharge (see Box 5-5). In general, the higher the percentile, the more vulnerable the selected area is compared to the entire state and country.
Tropical Storms and Hurricanes That Have Impacted Florida Since 2000
Florida has faced a series of notable disasters from the year 2000 to present day, including Hurricanes Ian (2022), Irma (2017), Jeanne (2004), Frances (2004), and Charley (2004), each of which were federally declared major disasters. The total financial impact from Hurricane Ian was estimated to be upward of 4.5 billion dollars to the state and individual households for loans, flood insurance, and federal grants (FEMA, 2023d), and the Florida Department of Law Enforcement (2023) reported 149 deaths in the state attributed to the storm. Other notable recent environmental disasters affecting St. Petersburg include the 2021 Piney Point Wastewater Disaster16 and the 2018 Red Tide Event.17 See Table C-2 in Appendix C for more information.
BOX 5-5
Community Testimonial: Recent Environmental Disasters and Community Responses and the 2021 Piney Point Wastewater Disastera
“Our community does what they can from a reactionary level […] they clear the dead fish off the beach, and they’re putting them in dumpsters, but the red tide bloom is out there, and it’s washing new fish and new toxins into the air all the time […] You know, individual households […] you close your windows, you run your air conditioning, you maybe buy a better air conditioning filter, maybe you buy filters for your home. It was particularly bad because I have a young daughter, and she would wake up in the night coughing.”
__________________
a More information, including a timeline of the Piney Point wastewater disaster, is available at https://www.floridamuseum.ufl.edu/earth-systems/blog/a-timeline-of-the-piney-point-wastewater-disaster
SOURCE: Chelsea Nelson, Resident of Madeira Beach, Florida. Workshop 2: Opportunities & Challenges of Climate Adaptation on Florida’s Gulf Coast, July 2022, St. Petersburg, Florida.
___________________
16More information about the Piney Point Wastewater Disaster is available at https://www.floridamuseum.ufl.edu/earth-systems/blog/a-timeline-of-the-piney-point-wastewater-disaster/
17More information about the 2018 Red Tide Event is available at https://oceanservice.noaa.gov/hazards/hab/florida-2018.html
Mobile County and Community of Bayou La Batre, Alabama
Introduction
This community profile supplies information about Mobile County and spotlights the community of Bayou La Batre. In addition, stakeholders from communities across Mobile County and Baldwin County contributed to this study through virtual discussions; these included Africatown (aka, “AfricaTown U.S.A.” and “Plateau”), Foley, and Gulf Shores. To provide an inclusive representation of communities in the coastal region of Alabama, this profile considers Mobile County-level data. When data from Mobile were not available, the committee included data from Bayou La Batre.
Located in the southwestern region of Alabama, with a population of 414,620, Mobile County stands as the second most populous county in the state and is home to its sole seaport.18 The county is marked by a long history of different colonial occupations. From 1702 to 1763, the area was under French occupation, followed by British control from 1763 to 1780. The Spanish took over the region from 1780 to 1813, when the United States ultimately claimed the territory. On December 18, 1812, Governor of the Mississippi Territory David Holme officially established Mobile County, envisioning it as a deepwater port along the Mobile River. The northern part is inhabited by the Mobile and Washington County Band of Choctaw, who settled in the area following the conclusion of the Creek War in 1814.19 A portion of the southern reaches of the county is inhabited by a large population of Southeast Asian immigrants and their descendants (see Boxes 5-6 and 5-7). The county also encompasses various islands, including Dauphin Island, Gaillard Island, and Mon Louis Island. Mobile County’s economy has seen steady growth in its traditional sectors such as “shipping, port facilities, shipbuilding and repair, forest products, chemicals, oil and gas production and exploration, seafood industry, and water-oriented tourism and recreation.”20 In recent times, the county has also experienced robust expansion in newer industries like aircraft production and repair, as well as steel and steel products.
___________________
18More information about Mobile County is available at https://www.britannica.com/place/Mobile-Alabama
19More information is available at https://www.mobilecountyal.gov/government/about-mobile-county/
20More information about Mobile County’s economic history is available at https://www.mobile.org/things-to-do/history/
BOX 5-6
Community Testimonial: Cultural Preservation and Relocation
“When I think of [managed retreat] for the Gulf Coast, I think about how to navigate the challenges, especially with the Asian community that originally came to the Gulf Coast and became part of the seafood industry. I think about the challenge it would be to move this community somewhere that has a climate they aren’t familiar with, or where they won’t be able to earn a living or find the skills or education to find another job to support their family. So, there are just so many challenges when I think about managed retreat and how it would even be possible, especially for the first generation people who immigrated here from Vietnam.”
SOURCE: Jane Nguyen, Program Manager, Boat People SOS. Virtual Focused Discussion: Mississippi and Alabama Gulf Coast Community Stakeholder Perspectives on Managed Retreat, March 2023.
Current and Projected Flood Risk
The Coastal County Snapshots from NOAA21 reveal that 22 percent of the land is within the designated 100-year floodplain; that area is home to roughly 14 percent of the population in Mobile County, with 13 percent of that population over 65 years of age. These flood zones also include around 5 percent of important facilities like schools, police stations, fire stations, and medical facilities, and approximately 10 percent of businesses. The area had over 10,600 flood insurance claims between 1991 and 2020, costing over 315 million dollars. An analysis by the Union of Concerned Scientists22 predicts that, under a moderate sea level rise scenario, approximately 3 percent of community homes collectively valued at more than 72 million dollars, including 580 people and over 300 homes in Bayou La Batre, could be at risk of chronic inundation by 2035. This risk is expected to escalate to nearly 1,800 homes, 17 percent of the community, with a collective value of more than 377.7 million dollars by 2100.
SVI and Health
With an SVI of 0.697 out of 1 in 2020, Mobile County is classified as having a medium-to-high level of vulnerability at the national level,
___________________
21See footnote 3.
22See footnote 4.
BOX 5-7
Community Testimonial: Impacts of Flooding Events and Pollution
“One problem is the gradual impact of climate change—hurricanes, severe flooding, health case access. I don’t know where to begin with the Vietnamese community and issues with them relocating. Hurricane Katrina severely affected the fishing community of Bayou La Batre, where we also have an office, and where everyone’s livelihood relies on the seafood industry. Severe flooding and the opening of the Bonnet Carre Spillway, which was open for over 120 days, killed off massive numbers of oyster and shrimp from the spillovers of toxins. In addition to extreme weather, healthcare access along the Gulf Coast is almost non-existent. Just in the three lower counties of Mississippi, Harrison, Hancock, and Jackson County alone, there are 10,000 Vietnamese and not one single medical physician can speak Vietnamese. Many are refused care if they don’t have an in-person interpreter. So, there are so many issues with the Vietnamese community. I think one reason they don’t relocate and want to remain here is because of past trauma, as many of them are refugees who escaped the Vietnam war. Before coming here, many of them were shrimpers and fishermen because many of them lived in southern Vietnam. These are the skills they brought with them to America, and this is how these communities developed along the Mississippi and Alabama gulf coast. But settling down and integrating into the seafood industry, many of them faced a lot of animosity and violence. Because they fought for their spot here and their rights and developed their livelihoods, they are resistant to just move to another area. Another issue is limited English proficiency, which means they need a lot of assistance for housing (buying, renting etc.), and reliable public transportation is almost non-existent. The seafood industry is increasingly difficult to earn a living wage to even think about relocation. So, there are many issues with remaining and also many barriers to relocating.”
SOURCE: Jane Nguyen, Program Manager, Boat People SOS. Virtual Focused Discussion: Mississippi and Alabama Gulf Coast Community Stakeholder Perspectives on Managed Retreat, March 2023.
according to factors such as poverty, access to transportation, and crowded housing.23 This ranking means that less than 31 percent of counties in Alabama are classified as more socially vulnerable than Mobile County. Mobile County’s high SVI scores of 0.8272 for socioeconomic status and 0.8253 for racial and ethnic groups indicate considerable challenges related to socioeconomic inequality and racial disparities for county residents. While Mobile County generally exhibits levels of asthma, heart disease,
___________________
23More information about Mobile County’s SVI is available at https://ucsusa.maps.arcgis.com/apps/MapSeries/index.html?appid=cf07ebe0a4c9439ab2e7e346656cb239
poor mental health, and lack of health insurance close to national averages, a few neighborhoods show levels substantially higher than the national averages.24 This indicates that within the county there are areas of higher and lower vulnerability. Mobile County is composed of cities, such as Mobile City and Africatown, that are surrounded by various chemical and industrial plants that release toxic pollutants into the air and water25 and have previously been connected to several forms of cancer prevalence in the surrounding communities.26
FEMA’s National Risk Index
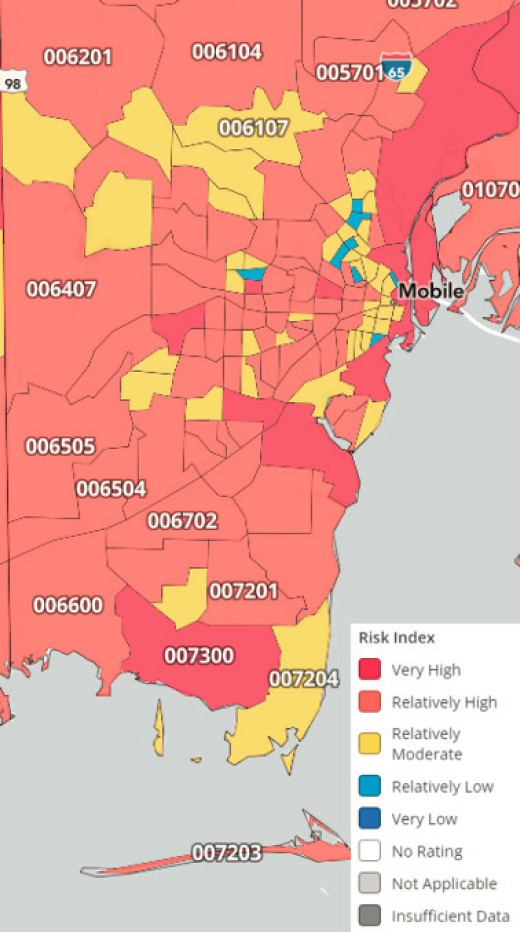
FEMA’s National Risk Index27 ranks Mobile County in the 98.8th percentile in the nation and in the 100th percentile within Alabama (see Figure 5-3). This ranking means that only about 1 percent of counties in the United States and 0 percent of counties in Alabama have a higher risk index than Mobile County. FEMA’s National Risk Index is calculated using three components: a natural hazard risk component (EAL28), a consequence enhancing component (social vulnerability29), and a consequence reduction component (community resilience30; Zuzak et al., 2023). With scores above the 99th percentile, Mobile County is one of the most at-risk counties in the United States for hurricanes and lightning. The EAL from all hazards (building value, population, and/or agriculture value) for Mobile County is over 274 million dollars. Mobile County reflects relatively high EAL, social vulnerability, and community resilience (FEMA, 2023h). Of the 18 hazards included in the National Risk Index, Mobile County has ratings above the 90th percentile in the nation for heat wave, riverine flooding, and tornado.
EPA’s EJScreen
According to EPA’s EJScreen,31 Mobile County is close to the 60th percentile in the nation for particulate matter, ozone, diesel particulate matter, air toxics cancer risk, air toxics respiratory HI, toxic releases to air, traffic
___________________
24See footnote 6.
25More information about plants in Mobile County is available at https://ejatlas.org/conflict/africatown-united-states
26More information about cancer risk in Africatown is available at https://www.theguardian.com/us-news/2018/jan/26/africatown-site-of-last-us-slave-ship-arrival-sues-over-factorys-pollu=share_btn_link and more information about cancer risk throughout the United States is available at https://projects.propublica.org/toxmap/
27See footnote 7.
28See footnote 8.
29See footnote 9.
30See footnotes 10 and 11.
31See footnote 13.
SOURCE: FEMA. (2023h). National Risk Index: Explore the map. https://hazards.fema.gov/nri/map
proximity, lead paint, superfund proximity, Risk Management Plan (RMP) facility proximity, proximity to hazardous waste, underground storage tanks, and wastewater discharge (see Boxes 5-8 and 5-9).
Tropical Storms and Hurricanes That Have Impacted Alabama Since 2000
Alabama has faced a series of notable disasters from the year 2000 to present day, including Hurricanes Ida (2021), Zeta (2020), Sally (2020), Katrina (2005), and Ivan (2004), each of which were federally declared major disasters. Notable storms include Hurricane Katrina and Hurricane Ivan, which were two of the strongest and most expensive storms to impact Alabama. Another seriously damaging storm was Hurricane Sally; due to its registration as a category 2 hurricane, many residents failed to evacuate, which led to high levels of preventable damage and costs. Throughout these disasters, FEMA has worked closely with Alabama Emergency Management Agency to identify local partners to distribute funds and resources from federal programs to affected communities. See Table C-3 in Appendix C for more information.
Harrison County and Community of Turkey Creek, Mississippi
Introduction
This community profile is for Harrison County and spotlights the community of Turkey Creek (see Box 5-13). In addition, a number of
BOX 5-8
Community Testimonial: Response to Pollution
“The City of Mobile experiences floods and extreme weather events, for sure. Those are reasons why we would and should consider moving, in addition to serious pollution issues. One of our biggest examples is the community that lives around Africatown. In the 40s a bunch of really heavy industry was built all around that community. But the community wants to be there. They want to live in a place that is their history and is important to our community’s story.”
SOURCE: Casi Callaway, Chief Resilience Officer, City of Mobile, Alabama. Virtual Focused Discussion: Mississippi and Alabama Gulf Coast Community Stakeholder Perspectives on Managed Retreat, March 2023.
BOX 5-9
Bayou La Batre
Bayou La Batre is a small Gulf Coast city along Portersville Bay on the Mississippi Sound in the county of Mobile, Alabama, about 25 miles south of the city of Mobile. Bayou La Batre can be characterized as a fishing community and contains a processing harbor for seafood brought in on fishing and shrimp boats. It has been described as the “Seafood Capitol” of Alabama (Mississippi-Alabama Sea Grant Consortium, 2021). The bayou itself was called “Riviere D’Erbane” by early French colonizers and eventually acquired its current name (which translates into “bayou of the battery”) in the late 1700s with the construction of the French-maintained artillery battery on the bayou’s west bank. The bayou runs from Portersville Bay inland for approximately 5.5 miles and provides boat access to the Mississippi Sound, Mobile Bay, and the Gulf of Mexico. The city of Bayou La Batre was officially incorporated in 1955. Its population has averaged about 2,200 people since the 1950s (Kaetz, 2023). Despite having a small population, its lucrative seafood industry has more than an 80-million-dollar economic impact on the state of Alabama annually (Coastal Alabama Partnership, 2022), and it is also a place known for the design and construction of a variety of boats (Kaetz, 2023).
Bayou La Batre is also known for its multi-ethnic population, principally the result of the resettlement of displaced people from Vietnam, Cambodia, and Laos in the 1970s during the Vietnam War. About 20,000 displaced Asians were resettled in the Gulf states, from Texas to Florida, and some people that were settled in other regions migrated to the Gulf (Macchi, 2015). In 2021, 18.5 percent of the population of Bayou La Batre was Asian, compared to less than 1 percent for the state of Alabama (U.S. Census Bureau, 2021a). Like elsewhere on the Gulf, many Asian immigrants to Bayou La Batre were from southern Vietnam, where they sustained livelihoods from the seafood industry in environmental conditions similar to the Gulf Coast. After arrival to the Gulf Coast in the 1970s, Asian immigrants struggled to integrate into the local and regional seafood industry because of language barriers, animosity, and racism (Macchi, 2015). However, over time, they found a place in every part of the industry (e.g., boat construction, shrimping, fishing, processing), established themselves as dependable workers, and founded community institutions and support networks. Today, nearly a third of the seafood industry in Bayou La Batre is composed of Asian immigrants and their descendants (Mississippi-Alabama Sea Grant Consortium, 2021).
In 2005, Hurricane Katrina devastated Bayou La Batre and destroyed boats, businesses, and facilities critical to sustaining the livelihoods of residents. The storm surge was nearly 20 feet, more than 2,000 of 2,300 residents were displaced from their homes, and 23 shrimp boats were stranded on land (Gaillard, 2007). Despite barriers to recovery, such as language, literacy, cultural differences in help-seeking, and the challenges of navigating disaster recovery bureaucracy (Nguyen & Salvesen, 2014), the Asian community of Bayou La Batre exhibited resilience to the social and economic setbacks they suffered. As with Vietnamese communities in New Orleans after Hurricane Katrina (National Academies, 2023a), levels of trust, cooperation, and collaboration mitigated the damage during and after the recovery period (Nguyen & Salvesen, 2014). Additionally,
the devastation of Hurricane Katrina promoted the international aid organization Boat People SOS (BPSOS) to establish a Gulf Coast branch, with offices in New Orleans, Biloxi, and Bayou La Batre, to assist with recovery; BPSOS remains a strong and supportive community institution today.a
__________________
a BPSOS is a nonprofit international aid organization founded in 1980 to rescue Vietnamese people fleeing Vietnam by boat and help them gain refugee rights in asylum camps. It has since expanded services to rescue, protect, and aid victims of persecution and trafficking in Vietnam, the United States, Russia, Ghana, and other countries. More information is available at https://www.bpsos.org/about
stakeholders from communities across Harrison County and Jackson County contributed to the study through virtual discussions; these included Biloxi, East Biloxi (see Box 5-10), and Gulfport as well as Pascagoula and Ocean Springs. To provide an inclusive relation of communities at the Mississippi coast, this profile considers Harrison County-level data except where county data were not available and the City of Biloxi was focused on instead.
Harrison County, founded in 1841, is located on the state’s Gulf Coast. It is the second most populous county in Mississippi, with a population of 207,382 (Mississippi Encyclopedia, 2023; World Population Review, 2023).32 There are a number of oil and chemical refineries located near the coastal cities of Harrison County, which are also major tourist destinations (e.g., Biloxi Beach) and the site of the Keesler Air Force Base.
Current and Projected Flood Risk
The Coastal County Snapshots from NOAA33 reveal that almost 20 percent of Harrison County’s land and over a quarter of its population resides within the designated 100-year floodplain, a region where almost a third of the residents are over the age of 65 and nearly 30 percent live in poverty (see Box 5-11). Critical community facilities, such as schools and fire stations, along with 14 percent of businesses, are also in this flood-prone area, which has had more than 1 billion dollars in flood insurance claims between 1991 and 2020. While most development within
___________________
32More information about Harrison County is available at https://harrisoncountyms.gov/index.php
33See footnote 3.
BOX 5-10
Community Testimonial: Factors Affecting Resilience in the Face of Flooding
“I call it Heartland East Biloxi, kind of like the core of the community that has long been part of the African American community […] We have a lot of history. We want to preserve that history. We want to use it as a platform to preserve our community and continue to rebuild […] We have our challenges. We are in the flood zone. We are looking at the sea level map and it does show that East Biloxi will be more affected in the next five [to] ten years. Whatever homes or buildings that need to be built now need to be elevated. And we’ve still got a low-income community that deals with high utility bills. And also deals with the high cost of flood insurance.”
SOURCE: Gordon Jackson, Board President, Steps Coalition. Virtual Focused Discussion: Mississippi and Alabama Gulf Coast Community Stakeholder Perspectives on Managed Retreat, March 2023.
the floodplain predates 1996, an additional 11.6 percent of development occurred between 1996 and 2016. An analysis by the Union of Concerned Scientists34 predicts that under a moderate sea level rise scenario, by 2035, one house (less than 1%) valued at $316,057, or two people, is expected to be chronically inundated with water. This is expected to rise to 154 homes (1%) in Harrison County, valued at over 30 million dollars and housing 348 residents, by 2100.
SVI and Health
With an SVI in 2020 of 0.6296 out of 1 within the state of Mississippi, Harrison County is classified as having a medium-to-high level of vulnerability, according to factors such as poverty, access to transportation, and crowded housing.35 This ranking means that less than 38 percent of counties in Mississippi are classified as more socially vulnerable than Harrison County. With high SVI scores across socioeconomic status (0.9236), household characteristics (0.831), racial and ethnic minority status (0.7543), and housing and transportation (0.8568), Harrison County has notable socioeconomic, demographic, and infrastructural vulnerabilities.
___________________
34See footnote 4.
35See footnote 5.
BOX 5-11
Community Testimonial: Response to Air Pollution and Climate-Related Health Concerns
“We get industry pollution that is coming in on us. We’ve already proven to everyone how bad the toxic air is for us to breathe. We’ve lost [had pass away] 27 residents in the last five years out of 120 households. We currently have about seven active people taking chemo at this time. So, it’s a major health issue, plus the flood issue and industry continues to pollute. So that’s why everything here is so prominent in that we work to get relocated. So, we can basically survive and live […] Where is my clean air? Where is my clean water? I don’t have either one. We have a senior citizen that says, ‘I would love to go to kind of like a condo situation where it would be like a senior citizen community. But Pasco County has no place like that for me to go,’ is what her answer was. There’s been several that said, ‘Well with relocating, am I going to have enough funds through this relocation or through this buyout to go, relocate and live somewhere else.’ Then others say, ‘No, I don’t want to stay here, because I know what the toxin is doing to me so I’m ready to go.’ Matter of fact, right down the street we have one who has cancer that’s returned, and she says, ‘I just hope I could live long enough to get out of here.’ That was her answer that she could live long enough to get out of here.”
SOURCE: Barbara Weckesser, Head of Concerned Citizens of Cherokee Subdivision and Resident of Pascagoula, Mississippi. Virtual Focused Discussion: Mississippi and Alabama Gulf Coast Community Stakeholder Perspectives on Managed Retreat, March 2023.
FEMA’s National Risk Index
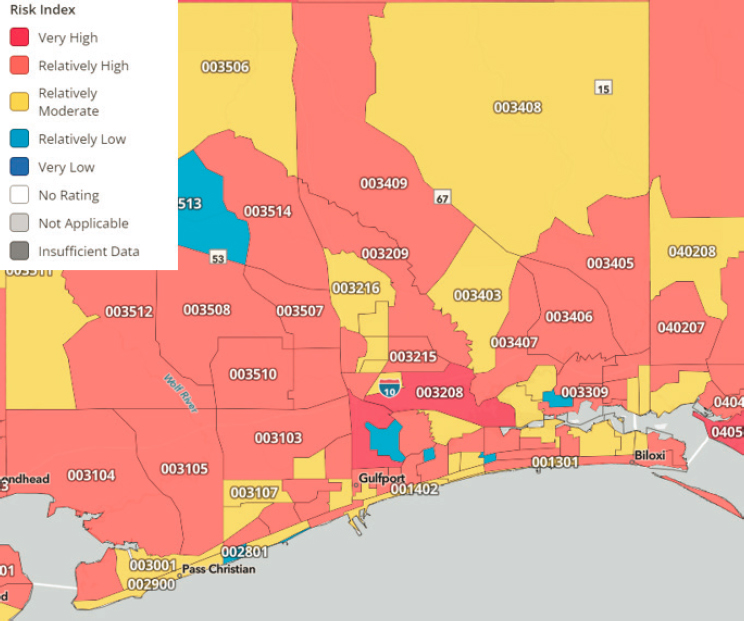
FEMA’s National Risk Index36 ranks Harrison County in the 97th percentile in the nation and 100th percentile within Mississippi (see Figure 5-4). This ranking means that only 3 percent of counties in the United States and 0 percent of counties in Mississippi have a higher risk index than Harrison County. FEMA’s National Risk Index is calculated using three components: a natural hazard risk component (expected annual loss37), a consequence enhancing component (social vulnerability38), and a consequence reduction component (community resilience39; Zuzak et al., 2023). The National Risk Index for Harrison County reflects relatively high40 EAL and community resilience, and very high social vulnerability (FEMA,
___________________
36See footnote 7.
37See footnote 8.
38See footnote 9.
39See footnotes 10 and 11.
40See footnote 12.
SOURCE: FEMA. (2023h). National Risk Index: Explore the map. https://hazards.fema.gov/nri/map
2023i). Of the 18 hazards included in the National Risk Index, Harrison County has a relatively high score (above the 90th percentile) in the nation for hurricane, lightning, and tornado. With scores above the 97th percentile, Harrison County is one of the most at-risk counties in the United States for hurricanes and lightning. The EAL from all hazards (building value, population, and/or agriculture value) for Mobile County is over 142.8 million dollars.
EPA’s EJScreen
According to EPA’s EJScreen,41 Harrison County is approximately at or above the 50th percentile in the nation in particulate matter, ozone,
___________________
41See footnote 13.
BOX 5-12
Community Testimonial: Environmental Justice
“Environmental justice isn’t just justice for low income and minority people in communities. Environmental justice, properly understood, is the best bar or standard that would accomplish environmental and community health resiliency for all because it’s environmental justice in communities like East Biloxi, Africatown, Turkey Creek, and so forth that has most often experienced, contemplated, argued, advocated, to avail or to no avail, around these issues that increasingly cause people in communities to have to consider relocation.”
SOURCE: Derrick Evans, Executive Director, Turkey Creek Community Initiatives in Gulfport, Mississippi, and Gulf Coast Fund for Community Renewal and Ecological Health (2005–2013). Virtual Focused Discussion: Mississippi and Alabama Gulf Coast Community Stakeholder Perspectives on Managed Retreat, March 2023.
diesel particulate matter, air toxics cancer risk, air toxics respiratory HI, toxic releases to air, traffic proximity, superfund proximity, RMP facility proximity, proximity to hazardous waste, and underground storage tanks (see Boxes 5-12 and 5-13).
Tropical Storms and Hurricanes That Have Impacted Mississippi Since 2000
Mississippi has faced a series of notable disasters from the year 2000 to present day, including Hurricanes Ida (2021), Zeta (2020), Nate (2017), Isaac (2012), and Katrina (2005), each of which were federally declared major disasters. The impact of these storms on Mississippi has been significant, with power outages, storm surges, heavy rainfall, and tornadoes causing widespread destruction of infrastructure, housing, and cultural institutions, and loss of life. The federal response to these disasters has varied, with assistance ranging from millions to billions of dollars to support housing, public assistance grants, and other needs. See Table C-4 in Appendix C for more information.
BOX 5-13
Community Spotlight: Come Hell or High Water—The Battle for Turkey Creek
Turkey Creek, an African American community in Gulfport, Mississippi, was established over 150 years ago following the Civil War. The environment was characterized by swamps, mangroves, lagoons, and maritime forests and has been home to Indigenous peoples and self-liberated Africans. Self-sufficient residents built their own town structures and have acted as stewards of the surrounding ecosystems. In 1926, Mississippi State Highway 49 was built, fragmenting the community and disrupting access to the creek. In the decades following, Turkey Creek has struggled to protect their community and surrounding ecosystem against practices and infrastructure that have removed native plants, destroyed wetlands and a cemetery, displaced people, and contributed to petrochemical runoff leading to water pollution (Butler-Ulloa, 2022; Mahan, 2013).
“In years past (roughly 2005–2010), I worked closely as a Gulf Coast Fund Advisor with Chief Albert Naquin and others facing the unfortunate fate of their native Isle de Jean Charles, so I know quite well how serious and ultimately imminent relocation is and will be for a growing number of coastal communities—including irreplaceable cultural enclaves akin to Turkey Creek. I am more than certain, however, that many of them (and definitely Turkey Creek or Africatown [Mobile, Alabama] in particular) will never even remotely entertain relocating until and unless they were already permanently under water (and probably not then either, lol). And given our unique historic, cultural and continuous political circumstances, even discussing the concept in theory is a very tall order. Nevertheless, relocation where adaptation is not possible or sufficient is a topic warranting deeper discussion regionally, and I would certainly be interested in contributing to a deeper analysis of both place-based and broader scientific and cultural variables that do confront Turkey Creek and similar Gulf Coast communities broadly, but also diversely. I firmly believe, for example, that the vastly needed, possible, and far from finished work of climate ‘adaptation’—i.e., ambitious conservation and restoration of Turkey Creek’s coastal and upland wetlands—remains the community’s most important need and very best bet for confronting and surviving imminent sea level rise.”
SOURCE: Derrick Evans, Executive Director, Turkey Creek Community Initiatives in Gulfport, Mississippi, and Gulf Coast Fund for Community Renewal and Ecological Health (2005–2013). Personal Email to Debra Butler, Committee Member, February 10, 2023.
Southeast Louisiana (Lafourche and Terrebonne Parishes)
Introduction
This community profile provides information about the location of this study’s third workshop, held in both Lafourche Parish (Thibodaux, Louisiana) and Terrebonne Parish (Houma, Louisiana).
Lafourche and Terrebonne are coastal parishes located in the bayou region of southeast Louisiana and are connected by a network of waterways
BOX 5-14
Community Testimonial: Housing and Land Loss
“So, we have dealt with land loss and learned about land loss […] Do we know the technical scientific terms, no. But we know we lose land. We know we lose about a football field of land a day. So, we know that, but we can’t always see that. But what we can see is insurance not covering our homes and making it unrealistic to live here because you can’t keep paying out of pocket every year to repair a home.”
SOURCE: Cherry Wilmore, Resident of Houma, Louisiana. Workshop 3: Assisted Resettlement and Receiving Communities in Louisiana, July 2022, Houma, Louisiana.
“I think that we were some of the first to realize the land loss that Louisiana is experiencing. Every year we’d go to these shrimp growing platforms, and we could see less and less of the marshland. Louisiana has been sinking since its inception […] As land loss and subsidence became more of an issue people kept moving further and further north to get out of harm’s way. Rising sea tides and land loss are definitely having an effect on communities such as Chauvin. I feel that people who enjoy what our area has to offer are changing. More people are building camps rather than buying […] property to raise their families.”
SOURCE: Thaddeus Pellegrin, Resident of Houma, Louisiana. Workshop 3: Assisted Resettlement and Receiving Communities in Louisiana, July 2022, Houma, Louisiana.
and industrial channels.42 The population of Lafourche is 95,89043 and Terrebonne is 104,786.44 The cities of Thibodaux and Houma, home to the United Houma Nation, are located within the Lafourche and Terrebonne Parishes, respectively.45 Among others, the bayou region includes members of the Cajun and Creole cultures and high concentrations of Indigenous peoples (Yeoman, 2023). The bayou region is considered one of the most productive fishing grounds in the United States, including shrimp, oysters, redfish, and trout, and is a popular destination for wildlife and recreational tourism (Heart of Louisiana, 2023).
___________________
42More information about Lafourche and Terrebonne Parishes is available at https://bayouregion.com/doing-business-here/region/
43More information about the Lafourche population is available at https://www.census.gov/quickfacts/fact/table/lafourcheparishlouisiana,US/PST045222
44More information about the Terrebonne population is available at https://www.census.gov/quickfacts/fact/table/terrebonneparishlouisiana/PST045222
45More information about the United Houma Nation is available at https://education.nationalgeographic.org/resource/bayou/
Current and Projected Flood Risk
The Coastal County Snapshots from NOAA46 reveal a high vulnerability to flooding in both Lafourche and Terrebonne Parishes, with over 90 percent of their land within the designated 100-year floodplain (see Box 5-14). In Lafourche, 63 percent of residents and almost 40 percent of businesses lie in this region, while in Terrebonne, 53 percent of the population and 23 percent of businesses lie in this region. Between 1991 and 2020, flood insurance claims in Lafourche totaled about 51 million dollars; in Terrebonne, the amount was significantly higher, at 270 million dollars. An analysis by the Union of Concerned Scientists47 predicts that under a moderate sea level rise scenario, 34 percent of existing houses in Lafourche and 23 percent in Terrebonne face chronic inundation due to sea level rise by 2035 (see Box 5-15). By 2100, the figures are expected to rise to 75 percent and 60 percent, respectively (see Box 5-16).
SVI and Health
Lafourche Parish, with an SVI in 2020 of 0.3175 at the state level, is classified as having a low-to-medium level of vulnerability at the national level, according to factors such as poverty, access to transportation, and crowded housing.48 This classification implies that less than 68 percent of counties in Louisiana have a higher social vulnerability level than Lafourche Parish. Similarly, Terrebonne Parish, with a score of 0.5079, exhibits a medium-to-high level of vulnerability, indicating comparable factors. This score means that it is as socially vulnerable as about 50 percent of the other counties in Louisiana. Within the various subcategories measured by the SVI, Lafourche and Terrebonne Parish have relatively high SVI scores, which indicates that both parishes face vulnerabilities in socioeconomic status (0.7438 and 0.817, respectively), household characteristics (0.7632 and 0.7807), and housing and transportation (0.7957 and 0.825). In addition, Terrebonne’s racial and ethnic minority status score of 0.7212 suggests possible issues with racial and ethnic disparities.
FEMA’s National Risk Index
FEMA’s National Risk Index49 ranks Lafourche Parish in the 94th percentile in the United States and in the 83rd percentile within Louisiana,
___________________
46See footnote 3.
47See footnote 4.
48See footnote 5.
49See footnote 7.
BOX 5-15
Community Testimonial: Community Members Understand the Risks, but Still Plan to Stay
“I’ve seen the Coastal Master Plan and I’ve worked on it in a community setting, looking at it, over the last three that they’ve had for the community. And if you look at it, in all three of the stages of light, moderate, and severe, and what they’ve shown for Terrebonne and Lafourche Parish, you know, in that 50-year plan, we’re not here with the tidal surge. But people are still staying. And when it’s been presented at different community events looking at it, people are still staying. And we’re going to—I’m going to stay. And I know the severity, and I understand the language of what they’re saying, you know, of what our future looks like. But I’m not going anywhere, you know. My people are water people. And, you know, we’re going to ride it out until we can’t ride it anymore, you know. And we’ll go back to boats, you know.”
SOURCE: Bette Billiot, the United Houma Nation. Workshop 3: Assisted Resettlement and Receiving Communities in Louisiana, July 2022, Houma, Louisiana.
“These occurrences are not new occurrences. These things continue to happen. But yet, after each event, I see the delays in receiving resources to help people get back to living, you know, in their homes and in their communities. The delays have increased exponentially. So, in my opinion, there’s [sic] —I see a prevalence towards conversations to look towards the coastal zone, the coastal region to industrialization. And I think that’s the big thing that we have to worry about, not gentrification, per se, although we do see some of that happening. But I think we need to dissuade those who have the perspective of thinking that we are going to let this happen and not speak out against our removals from our land because they fail to, you know, put in the resources necessary for us to continue our lives and our inhabitation that that’s going to happen easily. It’s not. We are determined to remain where we are. We’re going to work for reforms. We’re going to have the conversations for people who are like-minded and who advocate for us to find ways to live with the changes until we can find something different. But I think that gentrification is not the word that we need to start focusing on. We need to look at industrialization.”
SOURCE: Elder Rosina Philippe, Atakapa-Ishak/Chawasha Tribe and President of the First Peoples’ Conservation Council. Workshop 3: Community Viability and Environmental Change in Coastal Louisiana, July 2022, Thibodaux, Louisiana.
meaning that about 6 percent of U.S. counties and 17 percent of counties in Louisiana have a higher risk index than Lafourche Parish. Terrebonne Parish is in the 96th percentile in the United States and in the 89th percentile within the state, meaning that only about 4 percent of U.S. counties and 11 percent of counties within Louisiana have a higher risk index than Terrebonne Parish. FEMA’s National Risk Index is calculated using three
components: a natural hazard risk component (EAL50), a consequence enhancing component (social vulnerability51), and a consequence reduction component (community resilience52; Zuzak et al., 2023). The National Risk Index for Lafourche Parish reflects relatively moderate53 EAL while Terrebonne Parish reflects relatively high EAL; ratings for both parishes reflect very high social vulnerability and community resilience (see Figure 5-5). Of the 18 hazards included in the National Risk Index, Lafourche Parish has a rating above the 80th percentile in the nation for hurricanes, tornadoes, coastal flooding, and lighting, while Terrebonne Parish has a rating above the 80th percentile for hurricanes, tornadoes, riverine flooding, coastal flooding, lighting, and heatwaves. With percentiles around 95 and above, Lafourche Parish is one of the most at-risk counties for hurricanes, and Terrebonne Parish is one of the most at-risk counties in the United States for hurricanes and lighting. The total EAL from all hazards (i.e., total building value, population, and/or agriculture value) for both Lafourche Parish and Terrebonne Parish is over 190.6 million dollars.
EPA’s EJScreen
According to EPA’s EJScreen,54 Lafourche Parish is approximately at or above the 50th percentile in the nation for particulate matter, ozone, diesel particulate matter, air toxics cancer risk, air toxics respiratory HI, toxic releases to air, lead paint, superfund proximity, RMP facility proximity, hazardous waste proximity, underground storage tanks, and wastewater discharge. Terrebonne Parish is approximately at or above the 50th percentile in the nation for particulate matter, ozone, diesel particulate matter, air toxics cancer risk, air toxics respiratory HI, toxic releases to air, traffic proximity, lead paint, superfund proximity, RMP facility proximity, proximity to hazardous waste, underground storage tanks, and wastewater discharge.
Tropical Storms and Hurricanes That Have Impacted Louisiana Since 2000
Louisiana has faced a series of notable disasters from the year 2000 to present day, including Hurricanes Ida (2021), Zeta (2020), Laura (2020), Delta (2020), Isaac (2012), Gustav (2008), and Katrina (2005), each of
___________________
50See footnote 8.
51See footnote 9.
52See footnotes 10 and 11.
53See footnote 12.
54See footnote 13.
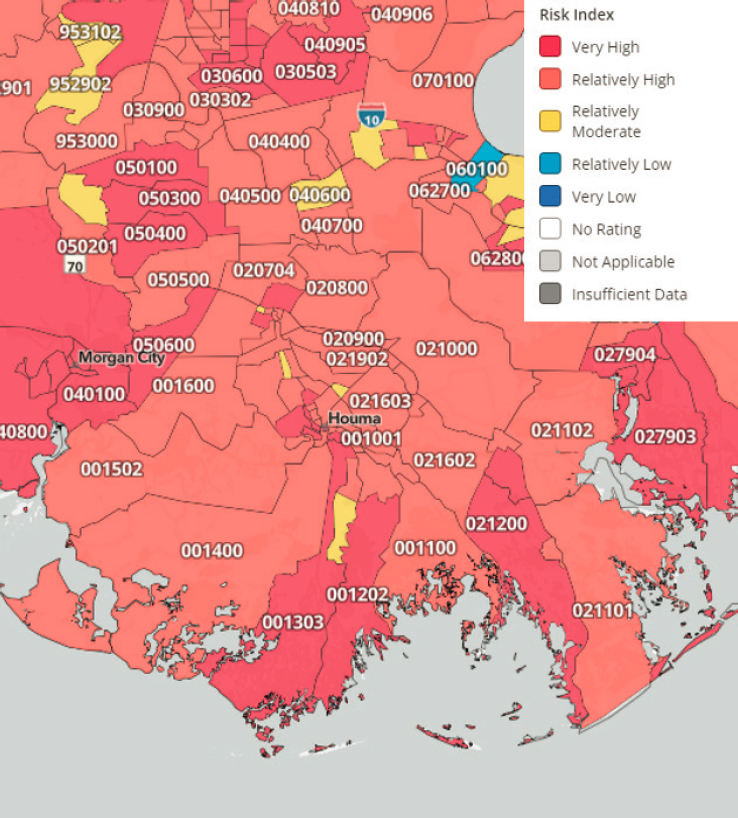
SOURCE: FEMA. (2023h). National Risk Index: Explore the map. https://hazards.fema.gov/nri/map
BOX 5-16
Community Testimonial: Response to Hurricanes
“We’ve all just experienced Hurricane Ida, and it was a very, very hard time for all of us here, and still is. Still very difficult. And one of the things that was most difficult for me to grapple with was that I wanted my son, who’s a year and a half, to be able to have the experiences that I had as a kid. And I wanted him to grow up in this culture that I found so dear to my heart. And it wasn’t until the hurricane that I realized that the town I grew up in, Chauvin, in the ‘80s no longer exists. And that no longer existed before the storm, right. And it’s because this migration took place long before the hurricane, because, again, it’s a part of our story. So, my son is not going to grow up in that same way, but that’s just the way that it is for different reasons.”
SOURCE: Jonathan Foret, Executive Director, South Louisiana Wetlands Discovery Center. Workshop 3: Assisted Resettlement and Receiving Communities in Louisiana, July 2022, Houma, Louisiana.
which were federally declared major disasters (see Boxes 5-17 and 5-18). The most severe of these hurricanes was Hurricane Katrina, with a total of 186 billion dollars in damages and 41.1 billion dollars in insured damages in the United States (25.3 billion dollars in insured damages in Louisiana) in 2005 (Hartwig & Wilkinson, 2010; Knabb et al., 2023). The federal response to these disasters involved major disaster declarations; financial assistance for affected residents; and funding for public infrastructure projects, emergency protective measures, and hazard mitigation programs, including relocation (see Box 5-19). See Table C-5 in Appendix C for more information.
Port Arthur, Texas
Introduction
This community profile provides this information for one of the locations of this study’s first workshop, Port Arthur in southeast Texas along the Gulf of Mexico. However, some datasets were only available at the county level of Jefferson County, where Port Arthur is located.
Port Arthur is a coastal city located in Jefferson County about 90 miles east of Houston in the Beaumont-Port Arthur metropolitan area. Port Arthur has a population of 55,757, with 42.2 percent identifying as Black or African American, 43.0 percent identifying as White, and 32.2 percent
BOX 5-17
Community Testimonial: Locals Are Used to Flooding, but Hurricane Ida Brought Damaging Winds, Exposing Community Vulnerabilities
“Now, the difference, for us, in past hurricanes, everybody knew what to do. So, you had a flood, and you cut out four feet of your walls, and you wainscoted it, and you moved on, because Cajun men knew how to fix their homes. And you might have had Chauvin that was affected, but Bourg not so much, and Montegut not so much. So, they came together to help the people who needed it. For Ida, it was very, very different. Very different. Whether it is climate change, a better levy system, we were spared from the flooding. But, for the first time ever, the damages were different […] I would like to know the percentages of who lost their roofs, and those men didn’t know how to fix that, nor do you really have the capability to put your own roof on. You have to hire somebody. So, I think we lost so many residents [i.e., they moved away] this hurricane because it was a different monster of a hurricane. We knew how to handle water; nobody knew how to handle what we went through for Ida. And so, it was tough. And so, yeah, I think we’ll see people, I think, leave because they can’t fix their homes, you know. Most of them just couldn’t even fix their homes, where in the past they could have done it themselves.”
SOURCE: Genie Ardoin, Resident of Houma, Louisiana. Workshop 3: Assisted Resettlement and Receiving Communities in Louisiana, July 2022, Houma, Louisiana.
“I hadn’t thought about that before because I kept hearing people say this is a storm like we’ve never had before. And in my head, it was that it was so destructive, and it was more of a wind event than a water event because we’re used to water events. But I think maybe what you just said may be more of what it’s about. It’s that we weren’t able to help each other. And we couldn’t use the storm as a unifying event, which storms in the past kind of had been. Because we’d come together, you have that experience. You’re eating at somebody’s house because you’re helping them. And we’re all helping each other. And it kind of makes you feel good. This one, we all needed help. And it didn’t come and it’s still not coming. And we are a people who rely on ourselves. And it’s sort of like we couldn’t like we could.”
SOURCE: Jonathan Foret, Executive Director, South Louisiana Wetlands Discovery Center. Workshop 3: Assisted Resettlement and Receiving Communities in Louisiana, July 2022, Houma, Louisiana.
BOX 5-18
Community Testimonial: Planning for Protecting Culture Lags Behind Planning for Protecting Land
“In Louisiana we’ve talked about the coastal Master Plan. We are ahead of the game in restoring land because we’ve been thinking about that for a long time. Remaking Barrier Islands and making levies and we’re really good at that but I have a feeling what we’re going to talk about today is we’re behind on that real important part of the formula of saving the culture and the Rougarou Fest is like a step in the right direction. Right? But there’s this—everybody knows that if the people from all down the bayou communities, if they all move to Houma, it still wouldn’t quite be the same. So, there’s this effort—there’s an idea that maybe we can save those places. So, to me there’s a paradox. It’s like—Chauvin is almost like—in a Hospice situation. Like if you’ve had someone in your family in Hospice, you know it’s coming. You know it’s coming but they’re still alive and Chauvin is kind of like that. The paradox is I want to save the little town of Chauvin. I wish we could save it but it’d be really hard for me to tell my daughters okay, go move there. Yes, go put a house in Chauvin. It just does not make sense to build a new house in a place like Pointe-aux-Chenes or Chauvin. It just doesn’t add up because it seems too dangerous. Right? So, it seems like to me we have this conflict that we’re facing and so maybe state policy makers, since we put so much effort into saving the land, the next step is to come up with plans and strategies to save the culture so that we don’t lose that. That’s what I wanted to say.”
SOURCE: Gary LaFleur, President, Barataria-Terrebonne National Estuary Foundation and Professor, Biological Sciences, Nicholls State University. Workshop 3: Assisted Resettlement and Receiving Communities in Louisiana, July 2022, Houma, Louisiana.
identifying as Hispanic or Latino. It is adjacent to the Sabine and Neches Rivers and borders the state of Louisiana. The Sabine Lake area has been occupied for over 1,500 years, when its first settlers were primarily the Atakapa tribe.55 In 1901, the “Lucas Gusher,” an oil discovery near Beaumont, led to Port Arthur serving as a hub for the emerging petrochemical industry.56 Gulf Oil Corp and Texaco established refining plants in the city in 1901 and 1902, respectively. The Motiva Refinery, the largest oil refinery in the United States, is located in the city (Motiva, 2020).
___________________
55More information about Sabine Lake and the Atakapa Tribe is available at https://www.portarthurtx.gov/236/About-Us
56This oil discovery launched the modern petroleum industry. More information is available at https://aoghs.org/petroleum-pioneers/spindletop-launches-modern-oil-industry/
BOX 5-19
Community Testimonial: Cascading Problems—Housing and Transportation
“The only thing we wanted was guidance from our mayor […] but then he was absent […] The plan was [to get them] into housing and helping them […] But yet whenever you’re in a situation where there’s chronic unemployment or there’s chronic loss of houses and habitat, someone needs to talk to the people; someone needs to guide people. We didn’t have that leadership and that guidance at that particular time, so we were really, really excited to get the mayor on the phone and one of their plans was basically […] to house people on barges. So that plan kind of fell through. It didn’t work out [and] the next thing you know they were talking to the U.S. Army about bringing in tents, and that’s actually what they did. They brought in a bunch of tents, set up those tents by the public library on Highway 73, and they started housing people there.”
SOURCE: Hilton Kelley, Founder and Director, Community In-Power and Development Association Inc. Workshop 1: Strategic Relocation and Environmental Perception: Community Perspectives from Port Arthur, Texas, June 2022.
“One of my big pet peeves about being on the west side is that they feel that they don’t have to do certain things that they really should do because of who we are, where we are, and what they think we don’t have to offer. We have people that live on the west side that are very educated that are there because they want to be there, not because they have to be there. Retirees, people that have relocated back home after retiring from other places, because the cost of living here is cheaper, but they pay the price of having to live in these areas. So, but that is what I would like to see, I would like to see Port Arthur cleaned up. I would like to see the west side cleaned up.”
SOURCE: Pamela Graham, Resident of Port Arthur, Texas. Workshop 1: Strategic Relocation and Environmental Perception: Community Perspectives from Port Arthur, Texas, June 2022.
Current and Projected Flood Risk
The Coastal County Snapshots from NOAA reveal that 1.5 percent of Jefferson County’s population resides in low-lying areas.57 However, all critical facilities, including schools and medical establishments, are located outside these low-lying areas. An analysis by the Union of Concerned Scientists58 projects that under a moderate sea level rise scenario, by 2035, fewer
___________________
57Low-lying areas are defined as “less than 2 feet of sea level rise.” More information is available at https://coast.noaa.gov/digitalcoast/tools/snapshots.html
58See footnote 4.
than 1 percent of homes in Port Arthur, valued at $689,230 and housing 18 residents, will be chronically inundated. This risk is expected to escalate to include 62 homes (still less than 1% of the total), accommodating 141 people, with a value of close to 5 million dollars by 2100 (see Boxes 5-20 and 5-21).
SVI and Health
With an SVI of 0.8063 in 2020 within the state of Texas, Jefferson County is classified as having a high level of vulnerability, according to factors such as poverty, access to transportation, and crowded housing.59 This ranking means that less than 5 percent of counties in the United States and less than 20 percent of counties in Texas are classified as more socially vulnerable than Jefferson County. With high SVI scores across socioeconomic status (0.9188), household characteristics (0.9112), racial and ethnic minority status (0.9233), and housing and transportation (0.8978), Jefferson
BOX 5-20
Community Testimonial: Flooding Complications
“It’s a continuous spiral and you feel like you are never going to be able to recover. After Hurricane Harvey [2017], a lot of the homes that we see in Port Arthur that weren’t in the floodplain are now all of a sudden in a floodplain. Now these folks are required to get flood insurance just to potentially get some help in the future if they ever do flood. So, it’s like you’re stuck in a corner and now the tables have turned, all of a sudden, your home is in a floodplain, and you have to purchase flood insurance that you cannot afford.”
SOURCE: Michelle Smith, Community In-Power and Development Association Inc. Workshop 1: Strategic Relocation and Environmental Perception: Community Perspectives from Port Arthur, Texas, June 2022.
“It was devastating. I’m 75 years old, I felt like I was aged when finally, I found a place where I was comfortable. It was devastating to lose my home in that flood because my husband had passed away. It was just me. So, I’ve got to get back to trying to bring things back together and make it a home—that was devastating to me. And they’ve talked about buyouts. I have considered it, I really have, because I don’t want to go through another storm.”
SOURCE: Octavia Sanders, Resident of Port Arthur, Texas. Workshop 1: Strategic Relocation and Environmental Perception: Community Perspectives from Port Arthur, Texas, June 2022.
___________________
59See footnote 5.
BOX 5-21
Community Testimonial: Emissions-Related Health Concerns
“I’m a person who is quite sensitive to emissions that are in the air because there are times at night when I wake up my nose is runny, I’m coughing, I’m sneezing, [but] I know my house is clean. But still I wake up [coughing at night]. I take vitamins. I am very healthy. I’ve never really been sick a day in my life and I’ve been here 65 years. But now every morning, you’re sneezing and you’re coughing, you’re sneezing and you’re coughing. Your eyes are burning. There’s nowhere to go. There’s no one to talk to. What can we do? Where can we go? We’re healthy people and now we’re getting sick every week.”
SOURCE: Marie Kelley, Community In-Power and Development Association Inc. Workshop 1: Strategic Relocation and Environmental Perception: Community Perspectives from Port Arthur, Texas, June 2022.
“The large number of emissions that were being dumped from the air, like sulfur dioxide, benzine, ethylene oxide you name it, people in West Port Arthur breathe. And we have scars to prove it, many of us have died, many of us are still suffering from cancer, respiratory problems, liver and kidney disease.”
SOURCE: Hilton Kelley, Founder and Director, Community In-Power and Development Association Inc. Workshop 1: Strategic Relocation and Environmental Perception: Community Perspectives from Port Arthur, Texas, June 2022.
County possesses notable socioeconomic, demographic, and infrastructural vulnerabilities. One of the most significant challenges facing Port Arthur is the pollution caused by the petrochemical industry (Environmental Integrity Project, 2017). The city is home to several large refineries and chemical plants, which emit toxic pollutants into the air and water. These pollutants have been linked to a range of health problems, including chronic and acute bronchitis, cancer, acute myocardial infarction, emergency room visits, restricted activity days, and even adult and infant mortality (Environmental Integrity Project, 2017).
FEMA’s National Risk Index
FEMA’s National Risk Index60 ranks Jefferson County in the 97.74th percentile in the nation and 95.7th percentile within Texas (see Figure 5-6). This ranking means that only about 2 percent of counties in the United States and 4 percent of counties in Texas have a higher risk index than
___________________
60See footnote 7.
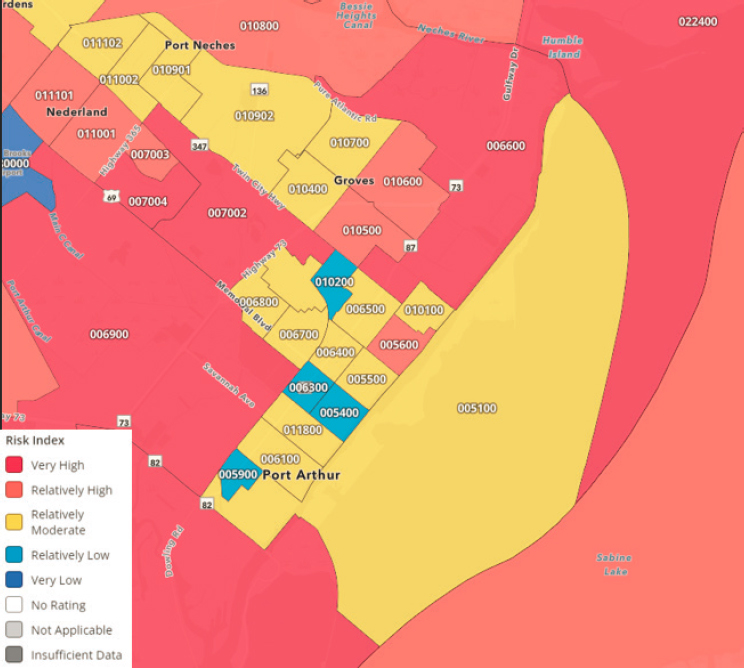
SOURCE: FEMA. (2023h). National Risk Index: Explore the map. https://hazards.fema.gov/nri/map
Jefferson County. FEMA’s National Risk Index is calculated using three components: a natural hazard risk component (EAL61), a consequence enhancing component (social vulnerability62), and a consequence reduction component (community resilience63; Zuzak et al., 2023). The National Risk Index for Jefferson County reflects relatively high64 EAL and very high social vulnerability with relatively high community resilience (FEMA, 2023h; see Box 5-22). Of the 18 hazards included in the National Risk Index, Jefferson County is above the 85th percentile rating in the nation for hail and heat waves. With percentiles around 98th and above, Jefferson County is one of the most at-risk counties in the United States for hurricanes, riverine
___________________
61See footnote 8.
62See footnote 9.
63See footnotes 10 and 11.
64See footnote 12.
BOX 5-22
Community Testimonial: Residents Have Few Choices
“There was one woman who got ripped off by contractors. She was trying to rebuild a home and her husband needed a breathing machine just to survive […] They were staying in a shelter that it wasn’t okay for them to have [the respirator] there, that he didn’t have enough to actually [… use] the breathing machine. They had mold in the house, they moved back into that home with mold and his health conditions that he had because they had no other choice. And it’s plenty of people who can tell you the same story of how they had no other choice.”
SOURCE: Landry Patin, Resident of Port Arthur, Texas. Workshop 1: Strategic Relocation and Environmental Perception: Community Perspectives from Port Arthur, Texas, June 2022.
flooding, tornadoes, and lightning. The expected annual loss from all hazards (building value, population, and/or agriculture value) for Jefferson County is over 161.6 million dollars.
EPA’s EJScreen
According to EPA’s EJScreen,65 Port Arthur is approximately at or above 90th percentile in the nation for particulate matter, ozone, air toxics cancer risk, toxic releases to air, superfund proximity, RMP facility proximity, hazardous waste proximity, underground storage tanks, and wastewater discharge. The only EJI for which Port Arthur is below the 80th percentile in the nation is diesel particulate matter and air toxics respiratory HI.
Tropical Storms and Hurricanes That Have Impacted Port Arthur Since 2000
Port Arthur has experienced several notable disasters from the year 2000 to present day, including Hurricanes Laura (2020), Harvey (2017), Ike (2008), Gustav (2008), and Rita (2005), each of which were federally declared major disasters. These hurricanes caused widespread and significant power outages, flooding, death and injury, and temporary relocation, and widespread damage to homes, infrastructure, and businesses. FEMA and other federal assistance programs supported much of the state of Texas to assuage flooding and storm damages to businesses and infrastructure. See Table C-6 in Appendix C for more information.
___________________
65See footnote 13.
DATA AVAILABILITY ACROSS PROFILES
Data availability was not uniform across the places that were profiled above. Smaller communities completely lacked or had gaps in publicly available information. For example, data from the U.S. Census Bureau were not publicly available for Bayou La Batre, Alabama, or Turkey Creek, Mississippi, and summarized or “QuickFacts” were not available in communities with less than a population of 5,000.66 In Port Arthur, Texas, some U.S. Census Bureau data were “suppressed to avoid disclosure of confidential information” or “did not meet publication standards.”67 For FEMA’s National Risk Index, most case locations were only available at the parish level or at the county level.68 The NOAA Coastal Flood Exposure Mapper did not include data for Turkey Creek at the community or ZIP code level, where all other cases were represented. Finally, there is a lack of clarity among data and statistics for notable recent disasters; some sites report damages, repairs, and deaths differently, making summarizing the damage and impacts as well as the federal response post-storms difficult.
Data scale and application context is often a barrier to accurately representing smaller communities (National Academies, 2018a). Additionally, the U.S. Census Bureau’s annual ACS has high margins of error and lower response rates in less populated areas than more populated areas, creating inconsistent data metrics (Scally & Burnstein, 2020).69 Other challenges for collecting data in rural areas include higher poverty rates, limited access to technology, higher unemployment rates, and lower high school graduation rates (O’Hare, 2017). Finally, there is a higher number of hard-to-count counties in rural areas (O’Hare, 2017).
SUMMARY
The community members’ testimonials foregrounded in this chapter have provided invaluable insight into the varied experiences, desires, and concerns that people living in this region bring to decisions around how to respond to changing environmental realities. The statistics reviewed in each
___________________
66More information about the U.S. Census Bureau is available at https://www.census.gov/en.html
67More information is available at https://www.census.gov/quickfacts/fact/table/stpetersburgcityflorida,portarthurcitytexas,terrebonneparishlouisiana,lafourcheparishlouisiana/PST045222#qf-flag-D
68More about FEMA’s National Risk Index information is available at https://hazards.fema.gov/nri/map
69ACS metrics are combined over five years to compensate for smaller sample sizes. Additionally, there has been a gradual transition to an internet-based census, which is limiting for rural areas. More information about this is available at https://www.urban.org/urban-wire/rural-communities-need-better-data
community profile add to these insights, and it is the hope of the committee that these profiles illuminate important aspects of this complex topic. In the committee’s judgment, it is critical for policy makers and community stakeholders to understand and acknowledge the following:
- Climate change projections and pre-existing socioeconomic vulnerabilities result in Gulf Coast communities of diverse geographic scale and demographics facing the threat of displacement.
- Population is increasing in all Gulf Coast areas except in Louisiana. Increases in population place more people and property at risk in the Gulf region.
- Resource- or amenity-based livelihoods deter residents from considering relocation. Strong attachments to place among traditional cultures also minimize the interest in relocation.
The next chapter approaches the concept of relocation from a different angle as it examines well-being frameworks in the context of climate change, displacement, and relocation. Specifically, it focuses attention on how well-being frameworks help understand, navigate, and prioritize mental and psychological health and identifies tools to enhance resilience, social capital, community cohesion, and communal/collective efficacy.
CONCLUSIONS
Conclusion 5-1: Community profiles, combining quantitative and qualitative analyses, illustrate how and why communities across the U.S. Gulf Coast Region are vulnerable to increasing climate change risks and the limits of their capacities to adapt-in-place. As climate change impacts accumulate, compound, and intensify, the analysis also suggests which areas of the region will require consideration of relocation and on what timescales.
Conclusion 5-2: Despite environmental threats, Gulf Coast populations have increased steadily for 50 years. Movement toward the coast has increased construction and real estate values and thereby enhanced risk, while contributing to gentrification. Traditional placed-based communities with long relationships to coastal lands and waters have expertise, social networks, and skillsets evolved from local knowledge and centuries of resilient behaviors. Place-based communities are often reluctant to relocate because of their unique economic, social, and cultural attachments to place, and they also often lack access to resources if they do want to relocate.
Conclusion 5-3: The combination of increasing population, growth of urban areas, economic activity, and infrastructure investment make the Gulf Coast even more susceptible to the impacts of extreme weather and sea level rise than decades ago.
Conclusion 5-4: If decisions about relocation are to be community-driven, data that influence those decisions need to be transparent to residents, accessible, and up to date.
Conclusion 5-5: Data relevant to community-driven decision making about relocation are effective and can be efficiently leveraged if they are generated by pairing quantitative information with the qualitative experiences of residents; in this report, qualitative input was obtained through dialogue with the people that live in the context that the data quantify.
This page intentionally left blank.


