Community-Driven Relocation: Recommendations for the U.S. Gulf Coast Region and Beyond (2024)
Chapter: Appendix C: Community Profiles
Appendix C
Community Profiles
SUMMARY
This appendix presents the community profiles of select cities along the Gulf Coast: St. Petersburg, Florida; Mobile County and the community of Bayou La Batre, Alabama; Harrison County and the community of Turkey Creek, Mississippi; southeast Louisiana (Lafourche and Terrebonne Parishes); and Port Arthur, Texas. These profiles focus on unique aspects and critical vulnerabilities of these communities, such as sociodemographic characteristics, abilities, flood and heat risks, environmental justice indexes, and notable recent disasters. This appendix serves as a valuable resource as coastal communities grapple with compounding challenges induced by environmental hazards.
DEFINITIONS AND CONCEPTS FOR PROFILE CHARACTERISTICS
Health
A population’s physical and mental health can increase its vulnerability to climate and environmental hazards, so understanding the incidence of certain diseases and health conditions is a key component of a community’s profile. The data and images in this section are obtained from the Centers
for Disease Control and Prevention (CDC) PLACES interactive map.1 Prevalence data come from CDC’s Behavioral Risk Factor Surveillance System.2 Age-adjusted3 incidence rates are reported so that rates can be compared across cities (Anderson & Rosenberg, 1998).
Environmental Justice Index
The U.S. Environmental Protection Agency (EPA) defines environmental justice as “the fair treatment and meaningful involvement of all people regardless of race, color, national origin, or income with respect to the development, implementation and enforcement of environmental laws, regulations and policies” (CDC/Agency for Toxic Substances and Disease Registry [ATSDR], 2022, p. 5). It is therefore important to be able to examine demographic and environmental factors in concert. EPA created environmental justice indexes (EJIs)4 at a census tract level to combine demographic factors (low-income and people of color populations) with a single environmental factor (e.g., particulate matter, ozone, traffic proximity, hazardous waste proximity). The EJI is a location-specific tool for assessing environmental burdens in relation to human health and equity. It assigns a score to each community, helping health officials identify and address areas most at risk due to factors like poverty, race, ethnicity, and pre-existing health conditions. This aids in prioritizing support for the most affected communities (CDC/ATSDR, 2022c). These environmental indicators reflect potential air and water quality issues, among other things. For example, ozone and particulate matter have harmful impacts on respiratory and cardiovascular health and are associated with diseases such as asthma and cardiovascular events (Manisalidis et al., 2020). A higher EJI means that a census tract has
___________________
1 More information is available at https://experience.arcgis.com/experience/22c7182a162d45788dd52a2362f8ed65
2 CDC’s Behavioral Risk Factor Surveillance System is “the nation’s premier system of health-related telephone surveys that collect state data about U.S. residents regarding their health-related risk behaviors, chronic health conditions, and use of preventive services.” More information is available at https://www.cdc.gov/brfss/index.html
3 Age-adjusted rates account for the age of a specific population, adjusting rates so that they represent what the rates would be if the “population under study had the same age distribution as the ‘standard’ population.” More information is available at https://health.mo.gov/data/mica/CDP_MICA/AARate.html
4 EJI “uses data from the U.S. Census Bureau, the U.S. Environmental Protection Agency, the U.S. Mine Safety and Health Administration, and the U.S. Centers for Disease Control and Prevention to rank the cumulative impacts of environmental injustice on health for every census tract. Census tracts are subdivisions of counties for which the Census collects statistical data. EJI ranks each tract on 36 environmental, social, and health factors and groups them into three overarching modules and ten different domains” (CDC/ATSDR, 2022c). More information about EJI is available at https://www.atsdr.cdc.gov/placeandhealth/eji/index.html. More information about EPA’s tool EJScreen is available at https://ejscreen.epa.gov/mapper/
more residents that are low income and/or people of color, and/or have a higher environmental indicator value.5 Each index, representing a distinct aspect of environmental quality or impact, is evaluated separately within each city. These indexes can be used to compare census tracts and identify areas with higher environmental and economic burdens (CDC/ATSDR, 2022c).
National Oceanic and Atmospheric Administration’s (NOAA’s) Coastal Flood Exposure Mapper
One component of flood risk projection is profile maps that come from the NOAA Coastal Flood Exposure Mapper.6 The tool allows users to select a hazard layer (options include coastal flood hazard composite, high tide flooding, Federal Emergency Management Agency [FEMA] flood zones, tsunami, storm surge, sea level rise [SLR]), societal exposure (options include, for example, population density, poverty rates, elderly, employees), infrastructure exposure (development, critical facilities, development patterns), and ecosystem exposure (natural areas and open space, potential pollution sources, natural protection, wetland potential). In this appendix, poverty rates and flood hazard zones are displayed in separate maps because when one is superimposed over the other, it is difficult to see both statistics. When areas with high poverty rates are also flood hazard zones, it indicates that vulnerable populations are also at risk of being impacted by flooding.
Projected Flood Risk and Extreme Heat
The Union of Concerned Scientists (UCS) conducted an analysis of coastal property in the United States at risk of SLR using data from Dahl, Spanger-Siegfried et al. (2017), Spanger-Siegfried et al. (2017), and the Zillow Transaction and Assessment Database.7 More information about their analysis can be found under the “About this Analysis” tab of the footnoted website. Projected extreme heat was taken from the National Integrated Heat Health Information System.8
___________________
5 More information about what EJI means is available at https://www.epa.gov/ejscreen/ej-and-supplemental-indexes-ejscreen
6 More information about NOAA’s Coastal Flood Exposure Mapper is available at https://coast.noaa.gov/digitalcoast/tools/flood-exposure.html
7 More information is available at https://ucsusa.maps.arcgis.com/apps/MapSeries/index.html?appid=cf07ebe0a4c9439ab2e7e346656cb239
8 More information about the National Integrated Heat Health Information System is available at www.Heat.gov
Social Vulnerability Index (SVI)
Social vulnerability can be defined as the factors (e.g., poverty, lack of access to transportation, crowded housing) that “may weaken a community’s ability to prevent human suffering and financial loss in a disaster.”9 In order to assist emergency response planners and public health officials in identifying “communities that will most likely need support before, during, and after a hazardous event,” CDC and ATSDR created the SVI.10
Population and Sociodemographics
Table C-1 summarizes relevant census data for the six Gulf Coast communities: city of St. Petersburg, Florida; Mobile County, Alabama; Harrison County, Mississippi; Lafourche Parish, Louisiana; Terrebonne Parish, Louisiana; and the city of Port Arthur, Texas. Sociodemographics data of these places are compared with national averages for the United States, including analysis of race and ethnicity, income and poverty, education, families and living arrangements, housing, residential mobility factor, transportation, and disability. The information for cells marked “Not Available” was not captured by the census.
COMMUNITY PROFILE: ST. PETERSBURG, FLORIDA
Social Vulnerability Index
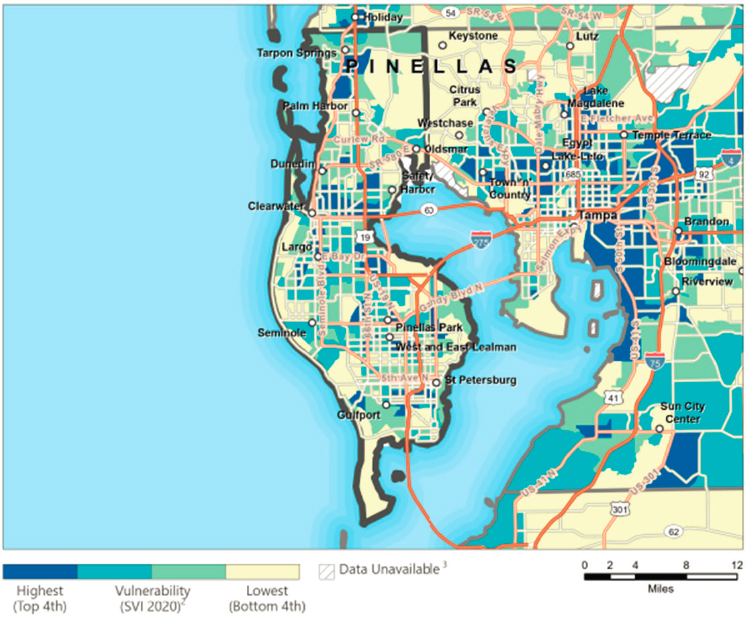
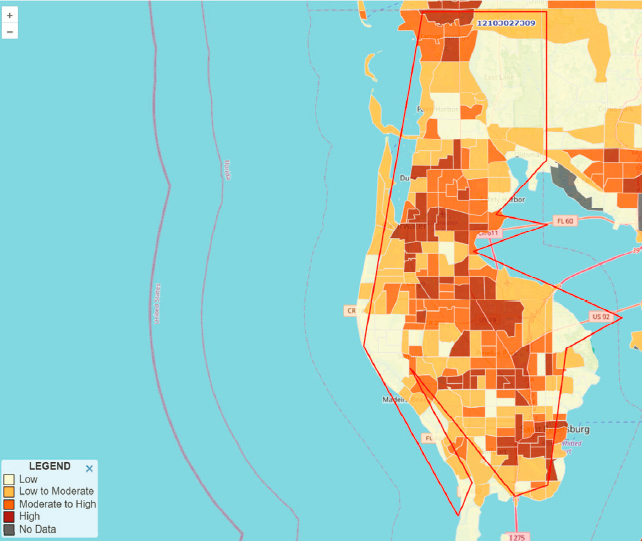
The 2020 national overall SVI score for Pinellas County, Florida, was 0.7247 where possible scores range from 0 (lowest vulnerability) to 1 (highest vulnerability). This score indicates a medium to high level of vulnerability (see Figure C-1).
___________________
9 More information is available at https://www.atsdr.cdc.gov/placeandhealth/svi/fact_sheet/fact_sheet.html
10 In order to determine social vulnerability, the CDC/ATSDR SVI ranks every census tract on 16 social factors pulled from U.S. Census data. The 16 factors fit into four themes: socioeconomic status, household characteristics, racial and ethnic minority status, and housing type and transportation. Each tract is then given a ranking for each of these four themes and an overall ranking, which indicate a census tract’s SVI.
TABLE C-1 Population Sociodemographics
| St. Petersburg | Mobile County | Harrison County | Lafourche Parish | Terrebonne Parish | Port Arthur | National | |
| Population | 258,245 | 414,620 | 207,382 | 97,677 | 110,100 | 55,757 | 329,725,481 |
| Pop Density (persons/square mile) | 4,178.7 | 337.4 | 212.5 | 66.28 | 52.93 | 727.0 | 93.8 |
| Age 65+ | 20.2% | 16.3% | 16.0% | 15.6% | 14.6% | 12.7% | 16.8% |
| Race (2021 1-year estimates)a | |||||||
| American Indian and Alaska Native | 0.2% | 0.4% | 1.0% | 1.9% | 5.1% | 0.6% | 1.0% |
| Asian | 3.3% | 2.2% | 2.7% | 0.7% | 1.2% | 6.5% | 5.8% |
| Black or African American | 20.1% | 36.1% | 22.3% | 12.0% | 17.1% | 42.2% | 12.1% |
| Native Hawaiian/Pacific Islander | 0.02% | 0.0% | 0.1% | 0.0% | 0.0% | 0.1% | 0.2% |
| Other | 2.0% | 1.9% | 0.9% | 1.7% | 0.2% | 3.6% | 7.2% |
| Two or more | 9.5% | 3.5% | 10.8% | 6.5% | 9.1% | 4.1% | 12.6% |
| White | 64.5% | 55.9% | 62.3% | 76.9% | 67.3% | 43.0% | 61.2% |
| Ethnicity: Hispanic or Latino | 8.4% | 3.1% | 5.7% | 4.6% | 5.6% | 32.2% | 18.8% |
| St. Petersburg | Mobile County | Harrison County | Lafourche Parish | Terrebonne Parish | Port Arthur | National | |
| Income and Povertyb | |||||||
| Median household income | $64,375 | $51,169 | $51,590 | $58,747 | $57,940 | $42,933 | $69,021 |
| Per capita income | $41,493 | $27,942 | $27,664 | $30,552 | $29,885 | $22,557 | $37,638 |
| Persons in poverty | 12.4% | 17.6 % | 17.9% | 15.7% | 17.8% | 25.8% | 12.6% |
| Education (age 25+) | |||||||
| High school graduate + | 93.5% | 87.9% | 89.0% | 80.9% | 81.1% | 77.5% | 88.9% |
| Bachelor’s degree + | 38.8% | 23.9% | 24.5% | 17.3% | 16.5% | 10.9% | 33.7% |
| Families & Living Arrangements | |||||||
| Household size (persons) | 2.26 | 2.58 | 2.56 | 2.51 | 2.59 | 2.71 | 2.60 |
| Households with children <18 | 21.1% | 30.3% | 30.2% | 29.1% | 30.4% | Not available | 30.6% |
| Multigenerational households | 2.2% | 3.4% | 3.5% | 4.22% | 4.59% | Not available | 3.4% |
| Non-English spoken at home | 12.6% | 4.4% | 6.4% | 11.1% | 8.5% | 33.9% | 21.7% |
| Housing | |||||||
| Median gross rent | $1,251 | $916 | $958 | $816 | $913 | $859 | $1,163 |
| Occupancy rate | 80.9% | Not available | Not available | 89.2% | 89.2% | 81.0% | 88.8% |
| Types of Structures | |||||||
| Single unit | 59.4% | 74.5% | 67.1% | 75.3% | 73.4% | 70.2% | 67.6% |
| Multi-unit | 38.0% | 18.1% | 13.6% | 8.3% | 12.0% | 28.3% | 26.4% |
| Mobile home | 2.6% | 7.2% | 11.8% | 16.3% | 14.6% | 1.5% | 5.9% |
| Boat, RV, van, etc. | 0.08% | 0.2% | 7.5% | 0.2% | 0.3% | 0.0% | 0.1% |
| Residential Mobility Factors | |||||||
| Owner-occupied unit rate | 62.7% | 63.5% | 58.1% | 77.7% | 72.7% | 57.1% | 64.6% |
| Same house as 1 year ago | 85.5% | 88.2% | 81.0% | 89.2% | 88.0% | 90.6% | 86.6% |
| Transportation | |||||||
| Minutes to work | 23.6 | 25.7 | 23.7 | 28.5 | 25.5 | 23.2 | 26.8 |
| No vehicle available | 7.7% | 5.2% | 6.2% | 7.5% | 9.0% | 10.4% | 8.0% |
| Disability (under age 65) | 9.4% | 9.1% | 12.9% | 17.1% | 16.9% | 11.0% | 8.7% |
| St. Petersburg | Mobile County | Harrison County | Lafourche Parish | Terrebonne Parish | Port Arthur | National | |
| No Health Insurance | 10.3% | 11.4% | 14.3% | 6.7% | 7.2% | 29.1% | 8.8% |
NOTE: Demographic statistics come from the American Community Survey (ACS) 2021 5-year estimates unless otherwise noted.
a 2021 1-year estimates were reported for race and ethnicity because these variables were revised in 2020 for all areas except for race in Port Arthur. See https://www.census.gov/library/stories/2021/08/improved-race-ethnicity-measures-reveal-united-states-population-much-more-multiracial.html. For Port Arthur, Texas, 2021 ACS statistics were not available for race so 2020 Decennial Census data were used.
b Income is reflected in 2021 inflation-adjusted dollars over the past 12 months.
SOURCES:
U.S. Census Bureau. (2021a). Quick facts—United States. https://www.census.gov/quickfacts/fact/table/US/HSG445221
___. (2021b). Quick facts—St. Petersburg city, Florida; Mobile County, Alabama; Harrison County, Mississippi; Lafourche Parish, Louisiana; Terrebonne Parish, Louisiana; Port Arthur city, Texas. https://www.census.gov/quickfacts/fact/table/stpetersburgcityflorida,mobilecountyalabama,harrisoncountymississippi,lafourcheparishlouisiana,terrebonneparishlouisiana,portarthurcitytexas/FIPS
___. (2021c). American Community Survey 2021 5-year estimates: Income in the past 12 months. https://data.census.gov/table?q=S1901&g=050XX00US01097,22057,22109,28047_160XX00US1263000,4858820&tid=ACSST5Y2021.S1901
___. (2021d). American Community Survey 2021 5-year estimates: Educational attainment. https://data.census.gov/table?q=S1501&g=050XX00US01097,22057,22109,28047_160XX00US1263000,4858820&tid=ACSST5Y2021.S1501
___. (2021e). American Community Survey 2021 5-year estimates: Households and families. https://data.census.gov/table?q=S1101:+HOUSEHOLDS+AND+FAMILIES&g=050XX00US01097,22057,22109,28047_160XX00US1263000,4858820&tid=ACSST5Y2021.S1101
___. (2021f). American Community Survey 2021 5-year estimates: Household type by units in structure. https://data.census.gov/table?q=UNITS+IN+STRUCTURE&g=050XX00US01097,22057,22109,28047_160XX00US1263000,4858820&tid=ACSDT5Y2021.B11011
___. (2021g). American Community Survey 2021 5-year estimates: Selected characteristics of health insurance coverage in the United States. https://data.census.gov/table?q=health+insurance+coverage+status+&g=010XX00US&tid=ACSST5Y2021.S2701
___. (2021h). American Community Survey 2021 1-year estimates: Hispanic or Latino origin. https://data.census.gov/table?q=B03003:+HISPANIC+OR+LATINO+ORIGIN
___. (2021i). American Community Survey 2021 1-year estimates: Race. https://data.census.gov/table?q=race&tid=ACSDT1Y2021.B02001
___. (2020). 2020: Decennial Census demographic and housing characteristics. https://data.census.gov/table?q=race&g=160XX00US4858820&tid=DECENNIALDHC2020.P8
SOURCE: CDC/ATSDR. (2023). CDC/ATSDR Social Vulnerability Index Interactive Map 2020. https://www.atsdr.cdc.gov/placeandhealth/svi/interactive_map.html
Health
In St. Petersburg,11 the estimated age-adjusted12 prevalence of asthma among adults aged 18+ was 9.1 percent (confidence interval [CI]: 9.0, 9.1) in 2020. This is below the national average13 of 10 percent, but south St. Petersburg has several census tracts with an asthma incidence rate above
___________________
11 To view maps of the city’s prevalence rate of health risk factors, visit the CDC PLACES website at https://experience.arcgis.com/experience/22c7182a162d45788dd52a2362f8ed65
12 Age-adjusted is reported in the text. Only crude prevalence rate was provided by CDC PLACES.
13 CDC PLACES reports both the tract and place level national averages and legends. The national average is reflected in the legend and reported in the text on this page and in the following health maps.
the national average. The highest incidence is found around the Child Park neighborhood and the area just north of Lake Maggiore.
The estimated age-adjusted prevalence of coronary heart disease among adults age 18+ was 5.7 percent (CI: 5.6, 5.7) in 2020, below the national average of 7.1 percent. Like asthma, there are high rates of heart disease in the neighborhoods north of Lake Maggiore, with one census tract showing an incidence rate of 9.4 percent. Another area of high incidence (8.4%) is seen along Riviera Bay and Grande Bayou.
The estimated age-adjusted prevalence of adults aged 18+ who reported their mental health as “not good” for 14 or more days out of the past 30 was 16.0 percent (CI: 15.9, 16.2) in 2020. This is slightly higher than the national average of 15.1 percent. Like asthma and heart disease, some of the highest incidence rates of poor mental health in St. Petersburg can be found around Child Park and Lake Maggiore. One census tract reports an incidence rate of over 21 percent.
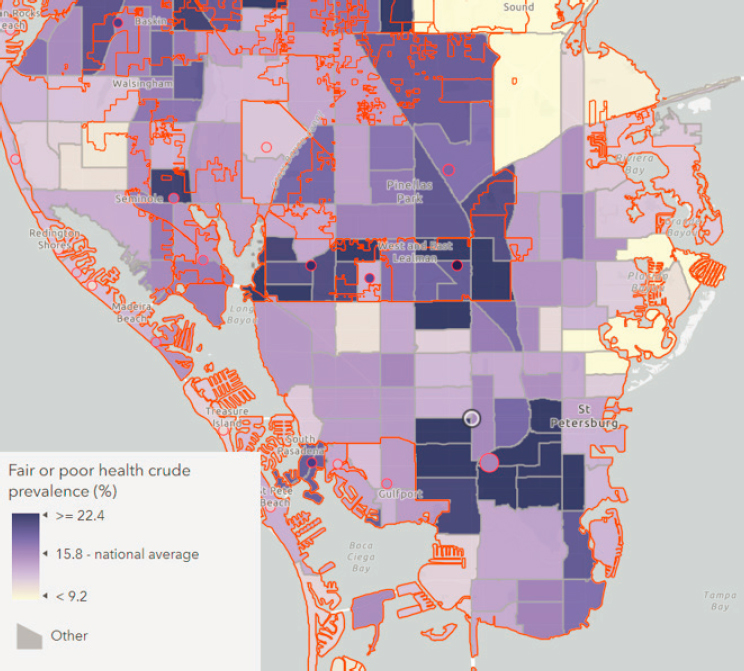
The estimated age-adjusted prevalence of fair or poor health among adults aged 18 years and older was 33.1 percent (CI: 29.7, 37.0) in 2020, almost double the national average of 15.8 percent (see Figure C-2).
Current Flood Risk
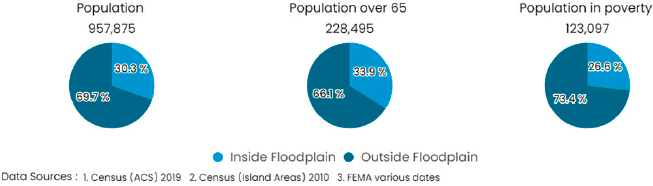
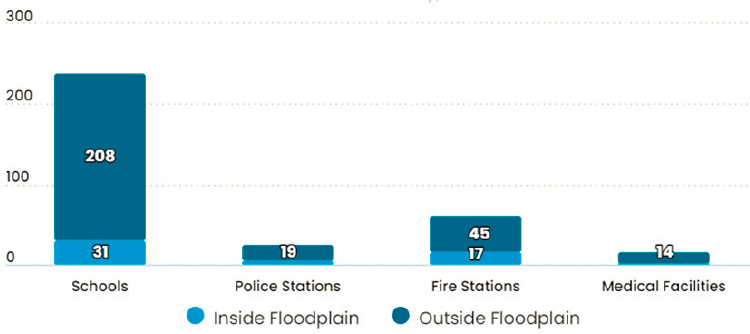
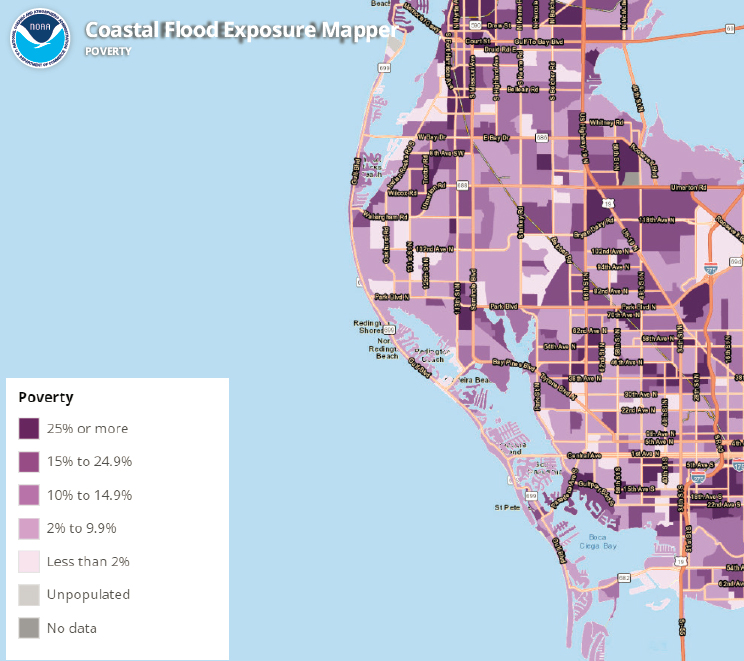
NOAA’s Coastal County Snapshot14 for Special Flood Hazard in Pinellas County reports that 35.6 percent of county land falls within the 100-year floodplain where just over 30 percent of the county’s population resides. Almost 34 percent of the population over age 65 lives in the 100-year floodplain and almost 27 percent of this population is in poverty (see Figure C-3). According to FEMA and U.S. Geological Survey (USGS) data, 16.4 percent of critical facilities (schools, police and fire stations, and medical facilities) in Pinellas County are located within the 100-year floodplain, including 31 schools and 17 fire stations (see Figure C-4), and almost a quarter of Pinellas County businesses (almost 12,000), meaning that many community services, revenues, and salaries are at risk. Since 1991, over 12,000 flood insurance claims totaling 152 million dollars have been made in Pinellas County, with over 35 million dollars in National Flood Insurance Program payouts between 2016 and 2020. Although 95 percent of development inside the 100-year floodplain existed by 1996, the other 5 percent (3.5 square miles) was added between 1996 and 2016. Although homes
___________________
14 NOAA’s Coastal County Snapshot tool uses data from multiple complex datasets to give communities a snapshot of their county’s resilience and risk “in terms of flood hazards, critical facilities, jobs, businesses, and more” (Office for Coastal Management, 2023). The tool provides snapshots in four different areas: marine economy, total coastal economy, SLR, and special flood hazard. More information is available at https://coast.noaa.gov/digitalcoast/tools/snapshots.html
SOURCE: CDC. (2023). CDC PLACES. https://www.cdc.gov/places
built since 2015 “are likely to be built to a more hazard resilient code,” this only accounts for a very small proportion of homes in St. Petersburg (Hazard Aware, 2022).
Projected Flood Risk and Extreme Heat
By 2035, 256 homes (<1%), home to 471 people, are projected to be at risk of chronic inundation15 in St. Petersburg (see Figure C-5). Together, these homes are valued at just under 130 million dollars and contribute over 2.1 million dollars to the local property tax base. By 2100, 19,383
___________________
15 Chronic inundation means that “tidal flooding occurs 26 times per year, or on average, about twice a month” (Spanger-Siegfried et al., 2017).
SOURCE: Office for Coastal Management. (n.d.a). Coastal County Snapshots: Special flood hazard. National Oceanic and Atmospheric Administration. https://coast.noaa.gov/digitalcoast/tools/snapshots.html
SOURCE: Office for Coastal Management. (n.d.a). Coastal County Snapshots: Special flood hazard. National Oceanic and Atmospheric Administration. https://coast.noaa.gov/digitalcoast/tools/snapshots.html
homes (11%) with 35,665 residents will be at risk of chronic inundation. These homes are valued at almost 5 billion dollars and contribute over 74 million dollars to the local property tax base.16
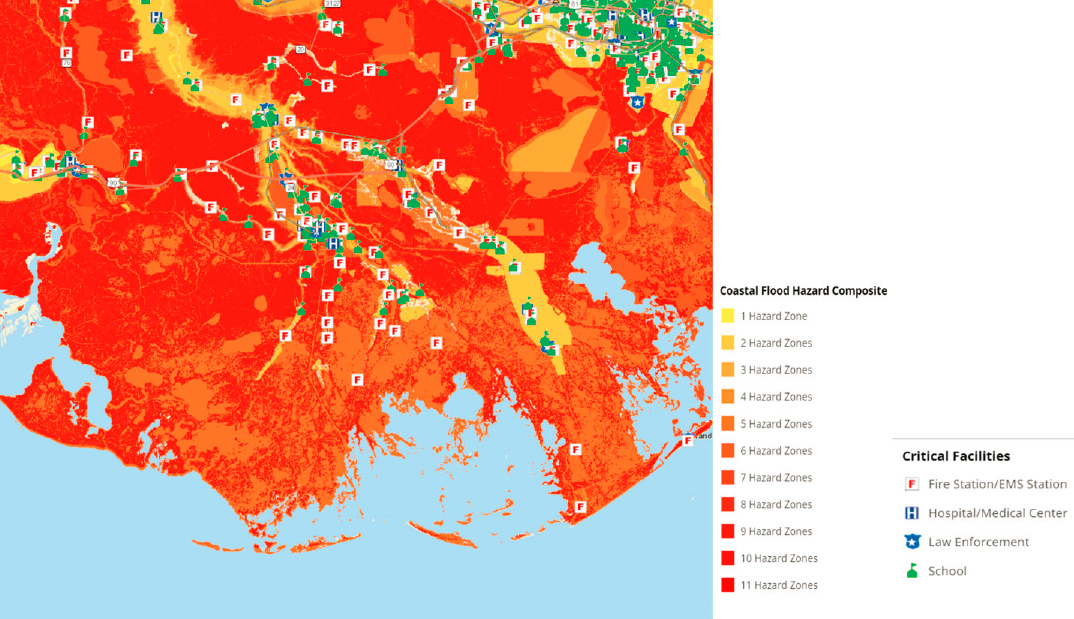
The first map in Figure C-5 shows critical facilities (hospitals, schools, fire and police stations, etc.) and “areas prone to flooding from one or more of the following hazards: high tide flooding; high risk (1% annual chance for A and V zones) and moderate risk (0.2% annual chance) flooding (designated by the Federal Emergency Management Agency); storm surge
___________________
16 UCS Rising Seas’ website uses 2014 National Climate Assessment SLR scenarios. The moderate SLR scenario assumes 1 foot global average SLR by 2035 and 4 feet by 2100.
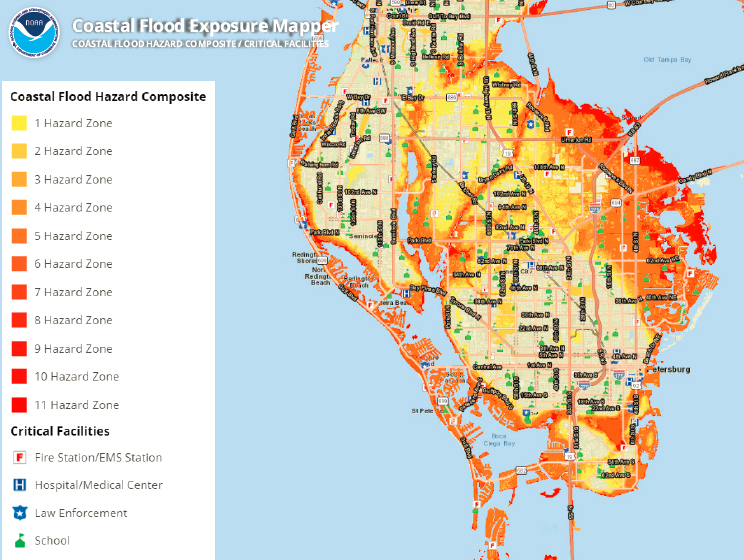
NOTES: NOAA’s Coastal Flood Exposure Mapper allows users to select a hazard layer (options include coastal flood hazard composite, high tide flooding, FEMA flood zones, tsunami, storm surge, SLR), societal exposure (options include population density, poverty, elderly, employees), infrastructure exposure (development, critical facilities, development patterns), and ecosystem exposure (natural areas and open space, potential pollution sources, natural protection, wetland potential). Poverty rates and flood hazard zones are displayed in separate maps because when one is superimposed over the other, it is difficult to see both statistics. When areas with high poverty rates are also flood hazard zones, it indicates that vulnerable populations are also at risk of being impacted by flooding.
SOURCE: Office for Coastal Management. (n.d.c). Coastal Flood Exposure Mapper. National Oceanic and Atmospheric Administration. https://coast.noaa.gov/digitalcoast/tools/flood-exposure.html
for category 1 through category 3 hurricanes; sea level rise scenarios of 1, 2, and 3 feet; tsunami run-up zones (for high risk areas). The darker red color on the map indicates more flood hazard zones for that area” (Office for Coastal Management, n.d.b).
The second map in Figure C-5, based on 2014–2018 American Community Survey (ACS) five-year estimates, shows the “percentage of people living below the poverty line for census block groups in or near coastal flood-prone areas (e.g., four-person family with annual cash income below $23,283). People in poverty may not have adequate resources to prepare for or respond to hazards. Their limitations may include substandard housing, lack of transportation to evacuate, lack of social support systems, and incomes that limit their ability to afford temporary lodging, relocation, or housing improvements” (Office for Coastal Management, n.d.b).
National Integrated Heat Health Information System
- Days above 90F: Projected number of days (based on Representative Concentration Pathway [RCP] 8.5)17 with temperature over 90F in 2050 = 145 (compared to 75 days per year on average from 1976 to 2005)
- Extreme heat days: Projected number of days per year warmer than the top 1 percent historically in 2050 = 66 (compared to four per year from 1976 to 2005)
Environmental Justice Indexes
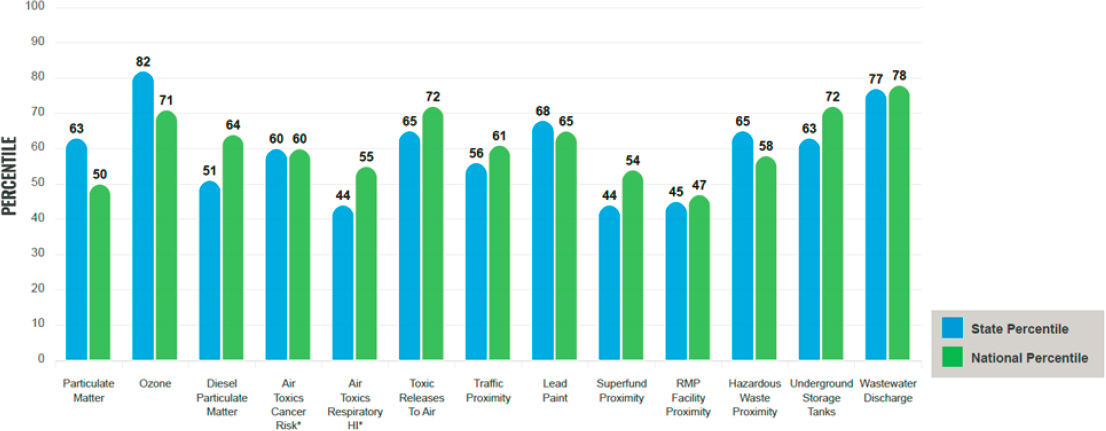
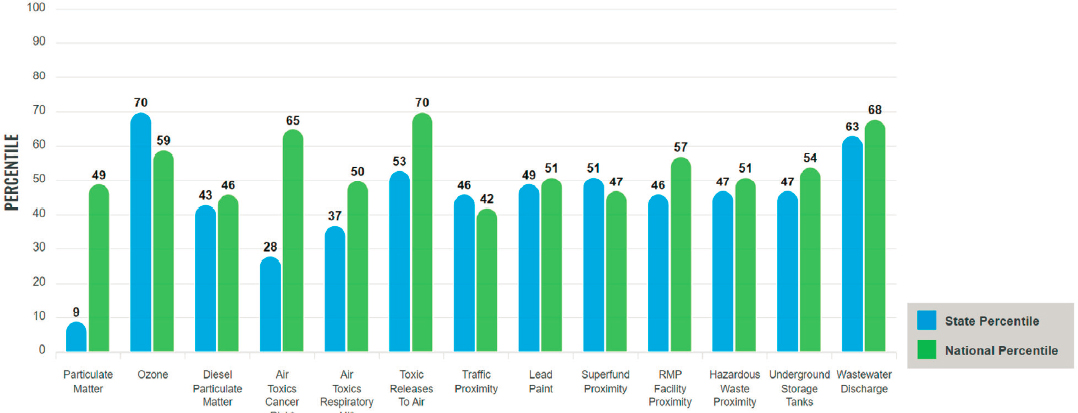
The graph below18 shows where St. Petersburg falls in relation to the rest of the state and nation by using a percentile for various EJIs within state and national contexts. For example, St. Petersburg’s EJI for ozone levels is in the 82nd percentile for the state of Florida and 71st for the nation as a whole. This means that only about 18 percent of the population of Florida lives in a block group with a higher EJI for ozone than the average person in St. Petersburg (see Figures C-6 and C-7). Almost 30 percent of the U.S. population lives in a block group with a higher EJI for ozone than the average person in St. Petersburg. In general, the higher the percentile,
___________________
17 RCPs of an 8.5 emissions scenario from the Fourth National Climate Assessment. RCPs capture a range of potential greenhouse gas emissions pathways and associated atmospheric concentration levels through the year 2100.
18 This information was obtained by using the EPA EJ Screener (https://ejscreen.epa.gov/mapper/). To access, click the “Reports” icon in the upper left-hand corner; click “Select City”; search for the city name in the text box in the upper right-hand corner; and click on city map area. To generate a pdf of the standard report, click “EJScreen Community Report” in the pop-up box.
NOTE: “The years for which the data are available, and the methods used, vary across these indicators. Important caveats and uncertainties apply to this screening-level information, so it is essential to understand the limitations on appropriate interpretations and applications of these indicators. Please see EJScreen documentation for discussion of these issues before using reports.”
SOURCE: EPA. (n.d.). Environmental Justice Screening and Mapping Tool. https://ejscreen.epa.gov/mapper/
SOURCE: CDC. (n.d.). Climate and Health Program Heat and Health Tracker. Heat exposure data. https://ephtracking.cdc.gov/Applications/heatTracker/
the more vulnerable the selected area is compared to the rest of the state and nation. St. Petersburg is close to the 50th percentile in the nation for particulate matter 2.5 (“fine inhalable particles, with diameters that are generally 2.5 micrometers and smaller”; U.S. Environmental Protection Agency, 2023), ozone (a greenhouse gas composed of three atoms of oxygen), diesel particulate matter, air toxics cancer risk, toxic releases to air, traffic proximity, lead paint, proximity to hazardous waste, underground storage tanks, and wastewater discharge.
Notable Recent Disasters Since 2000
St. Petersburg has been affected by five federally declared disasters19 since the year 2000. Table C-2 below lists each of these disasters in reverse
___________________
19 A major disaster declaration is made by the president for any natural event “that the president believes has caused damage of such severity that it is beyond the combined capabilities of state and local governments to respond.” Following a major declaration, FEMA’s Individual, Public, and Hazard Mitigation Assistance programs may be available to the affected state. More information is available at https://www.fema.gov/pdf/media/factsheets/dad_disaster_declaration.pdf
| Storm | Landfall Date | Damage and Impact | Federal Response |
|---|---|---|---|
| Hurricane Iana | September 28, 2022 |
|
|
| Hurricane Irmab,c,d | September 10, 2017 |
|
|
| Storm | Landfall Date | Damage and Impact | Federal Response |
|---|---|---|---|
| Hurricane Jeannei | September 26, 2004 |
|
|
| Hurricane Francese | September 5, 2004 |
|
|
| Storm | Landfall Date | Damage and Impact | Federal Response |
|---|---|---|---|
| Hurricane Charleyf,g,h | August 13, 2004 |
|
|
NOTE: FEMA = Federal Emergency Management Agency, HMGP = Hazard Mitigation Grant Program, NFIP = National Flood Insurance Program, SBA = Small Business Administration.
a https://www.fema.gov/press-release/20230221/fema-assistance-hurricane-ian-survivors-surpasses-1-billion-biden-harris
b https://www.fema.gov/sites/default/files/2020-03/FEMA4337DRFL_Expedited.pdf
c https://www.fema.gov/press-release/20220829/florida-rebuilding-resilience-after-hurricane-irma
d https://www.fema.gov/sites/default/files/2020-07/mat-report_hurricane-irma_florida.pdf standard
e https://www.claimsjournal.com/news/southeast/2005/03/07/52202.htm
f https://georgewbush-whitehouse.archives.gov/news/releases/2004/08/20040827-9.html
g https://georgewbush-whitehouse.archives.gov/news/releases/2004/08/20040827-9.html
h https://www.fema.gov/sites/default/files/2020-08/fema488_mat_report_hurricane_charley_fl.pdf
i https://georgewbush-whitehouse.archives.gov/news/releases/2004/09/20040927-10.html
SOURCES: Beven II, J. L. (2014). Tropical Cyclone Report: Hurricane Frances. National Hurricane Center. https://www.nhc.noaa.gov/data/tcr/AL062004_Frances.pdf
Bucci, L., Alaka, L., Hagen, A., Delgado, S., & Beven, J. (2023). Tropical Cyclone Report: Hurricane Ian (Report No. AL092022). National Hurricane Center. https://www.nhc.noaa.gov/data/tcr/AL092022_Ian.pdf
Cangialosi, J. P., Latto, A. S., & Berg, R. (2018). Tropical Cyclone Report: Hurricane Irma (Report No. AL112017). National Hurricane Center. https://www.nhc.noaa.gov/data/tcr/AL112017_Irma.pdf
Lawrence, M. B., & Cobb, H. D. (2005). Tropical Cyclone Report: Hurricane Jeanne. National Hurricane Center. https://www.nhc.noaa.gov/data/tcr/AL112004_Jeanne.pdf
Razzano, T. (2022, September 29). Hurricane Ian: Scenes from St. Petersburg after the storm. Patch. https://patch.com/florida/stpete/hurricane-ian-scenes-st-petersburg-after-storm
chronological order and briefly describes the damage and impact caused by each, along with the federal response. Additionally, limited data were available on Pinellas County’s evacuation plans and the damage and impact assessed on the city of St. Petersburg. There was also limited information found on FEMA’s response to Hurricane Jeanne.
Throughout the years, the government’s response to hurricanes impacting Florida, from Hurricane Ian in 2022 to Hurricane Jeanne in 2004, has experienced substantial progress in scope, effectiveness, and support offered. As weather events have become increasingly devastating, the government has assigned additional resources, funds, and personnel to facilitate relief and recovery measures. For instance, the federal government’s, and FEMA’s, response to Hurricane Ian was considerably more comprehensive compared to the response for Hurricane Jeanne, with billions of dollars allocated to relief funds and a more comprehensive deployment of resources. In addition, the process approving disaster relief has improved, as seen in the more streamlined public assistance grant approval process after Hurricane Irma. This progress highlights the federal government’s commitment to adapting to the growing challenges posed by climate disasters, with an enhanced emphasis on resilience, reduction, and readiness. FEMA’s aid initiatives have broadened to encompass not only immediate relief and assistance but also long-term recovery and disaster prevention. In addition, federal response efforts have become more comprehensive, encompassing a range of support measures such as emergency shelter, medical assistance, temporary housing, and financial assistance for individuals and businesses. As is outlined throughout this report, primarily in Chapter 9, while several aspects of disaster recovery have seen significant advancements, federal response has yet to fully incorporate the potential for relocation as an integral component of disaster recovery.
COMMUNITY PROFILE: MOBILE COUNTY AND COMMUNITY OF BAYOU LA BATRE, ALABAMA
Social Vulnerability Index
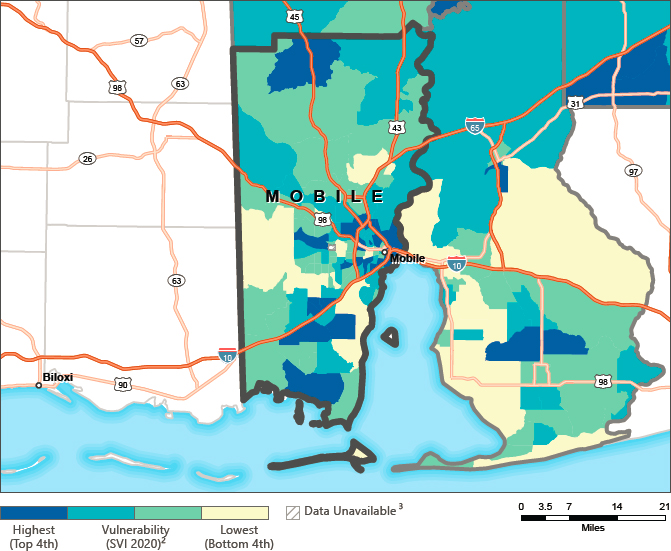
The 2020 national overall SVI score for Mobile County was 0.7947 where possible scores range from 0 (lowest vulnerability) to 1 (highest vulnerability; see Figure C-8). A score of 0.7947 indicates a high level of vulnerability.
SOURCE: CDC/ATSDR. (2023). Social Vulnerability Index Interactive Map 2020. https://www.atsdr.cdc.gov/placeandhealth/svi/interactive_map.html
Health
For Mobile County,20 the estimated age-adjusted21 prevalence of asthma among adults age 18+ was 10.3 percent (CI: 9.8, 10.7) in 2020. This is around the national average22 of 10 percent. The highest incidences of asthma found in the northeastern regions of Mobile County are in Mt. Vernon (11.6%), Prichard (12.5%), Muvico (12.3%), Theodore (11.7%), and Chickasaw City (11.5%).
The estimated age-adjusted prevalence of coronary heart disease among adults age 18+ was 6.8 percent (CI: 6.3, 7.3) in 2020. This is right below the national average of 7.1 percent. Like asthma, there are high rates of heart disease in the northeast regions of Mobile County. One of the areas
___________________
20 See footnote 11.
21 See footnote 12.
22 See footnote 13.
with the highest rate of incidence (8.9%) is seen south of Bayou La Batre in the neighborhoods inclusive of Dauphin Island.
The estimated age-adjusted prevalence of adults aged 18+ who reported their mental health as “not good” for 14 or more days out of the past 30 was 16.9 percent (CI: 15.8, 18.0) in 2020. This is higher than the national average of 15.1 percent. Similar to asthma and heart disease, some of the highest incidence rates of poor mental health in Mobile County, Alabama, can be found northeast of the county, which includes Theodore (18.2%), Prichard (19.0%), Chickasaw (19.5%), Movico (18.3%), and Mt. Vernon (18.3%).
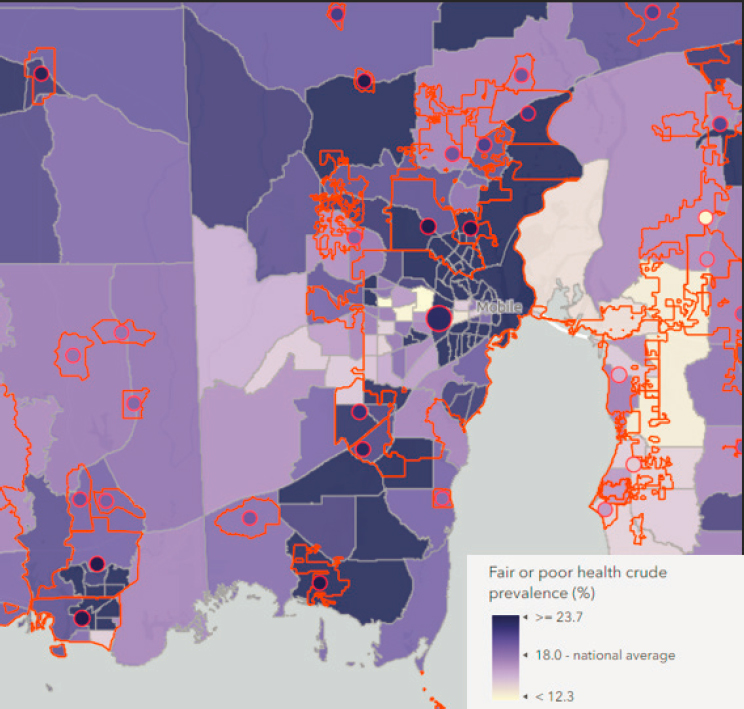
The estimated age-adjusted prevalence of fair or poor health among adults aged 18 years and older was 17.5 percent (CI: 15.7, 19.4) in 2020, which is higher than the national average of 16.3 percent (see Figure C-9).
SOURCE: CDC. (2023). CDC PLACES. https://www.cdc.gov/places
Current Flood Risk
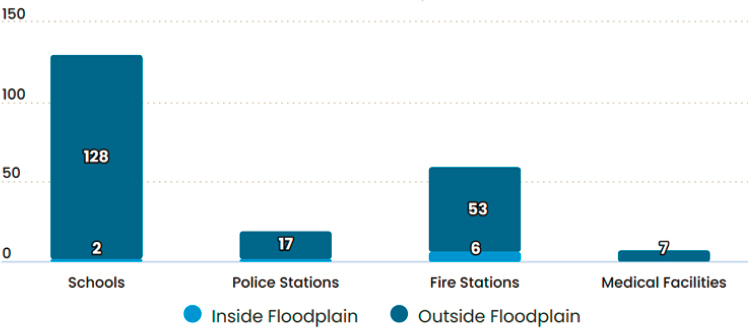
NOAA’s Coastal County Snapshot23 for Special Flood Hazard in Mobile County reports that 21.8 percent of county land falls within the 100-year floodplain where 13.6 percent of the county’s population resides. Of the population residing in the projected floodplain region, 12.9 percent of that population is over the age of 65, and 13.7 percent of the population is in poverty (see Figure C-10). According to FEMA and USGS data, 4.7 percent of critical facilities (schools, police and fire stations, and medical facilities) in Mobile County are located within the 100-year floodplain, including two schools and six fire stations (see Figure C-11), and a little over 10 percent of Mobile County businesses (1,598), meaning that many community services, revenues, and salaries are at risk. Since 1991, over 10,000 flood insurance claims totaling over 315 million dollars have been made in Mobile County, with over 10 million dollars in National Flood Insurance Program payouts between 2016 and 2020. Although 94.4 percent of development inside the 100-year floodplain existed already in 1996, the other 5.6 percent (1.06 square miles) was added between 1996 and 2016.
Projected Flood Risk and Extreme Heat
By 2035, 317 homes (2.93% of the community’s homes), home to 580 people, are projected to be at risk of chronic inundation24 in Bayou La Batre. Together, these homes are valued at a little over 72 million dollars and contribute over $625,000 to the local property tax base. By 2100, 1,797

SOURCE: Office for Coastal Management. (2023). Coastal County Snapshots: Special flood hazard. National Oceanic and Atmospheric Administration. https://coast.noaa.gov/digitalcoast/tools/snapshots.html
___________________
23 See footnote 14.
24 See footnote 15.
SOURCE: Office for Coastal Management. (2023). Coastal County Snapshots: Special flood hazard. National Oceanic and Atmospheric Administration. https://coast.noaa.gov/digitalcoast/tools/snapshots.html
homes (17%) with 3,289 residents will be at risk of chronic inundation. These homes are valued at almost 378 million dollars and contribute over 2.8 million dollars to the local property tax base.25
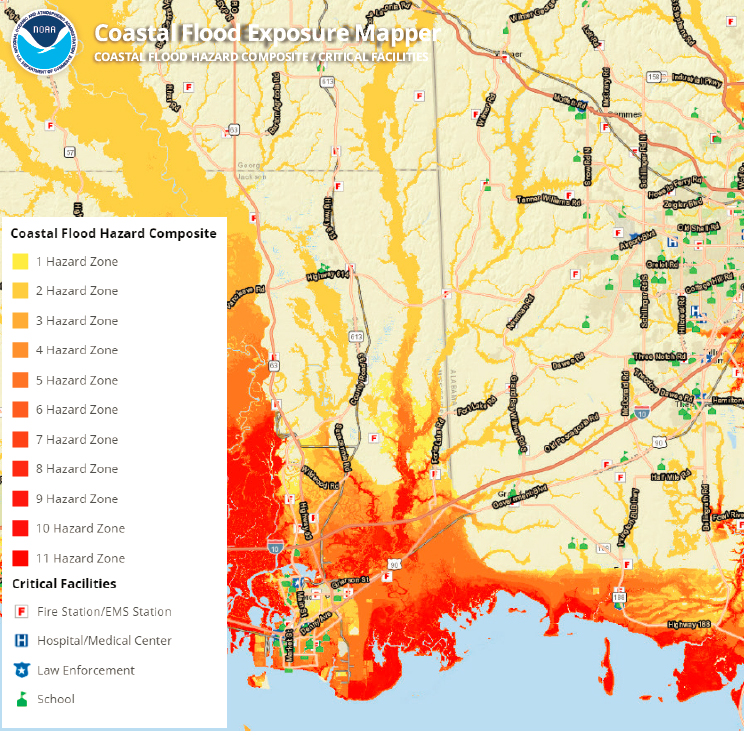
Figure C-12’s map (left) shows critical facilities (hospitals, schools, fire and police stations, etc.) and “areas prone to flooding from one or more of the following hazards: high tide flooding; high risk (1% annual chance for A and V zones) and moderate risk (0.2% annual chance) flooding (designated by Federal Emergency Management Agency); storm surge for category 1 through category 3 hurricanes; sea level rise scenarios of 1, 2, and 3 feet; tsunami run-up zones (for high risk areas). The darker red color on the map indicates more flood hazard zones for that area” (Office for Coastal Management, n.d.b).
Figure C-12’s map (right), based on 2014–2018 ACS five-year estimates, shows the “percentage of people living below the poverty line for census block groups in or near coastal flood-prone areas (e.g., four-person family with annual cash income below $23,283). People in poverty may not have adequate resources to prepare for or respond to hazards. Their limitations may include substandard housing, lack of transportation to evacuate, lack of social support systems, and incomes that limit their ability to afford temporary lodging, relocation, or housing improvements” (Office for Coastal Management, n.d.b).
___________________
25 See footnote 16.
NOTES: NOAA’s Coastal Flood Exposure Mapper allows users to select a hazard layer (options include coastal flood hazard composite, high tide flooding, FEMA flood zones, tsunami, storm surge, SLR), societal exposure (options include population density, poverty, elderly, employees), infrastructure exposure (development, critical facilities, development patterns), and ecosystem exposure (natural areas and open space, potential pollution sources, natural protection, wetland potential). Poverty rates and flood hazard zones are displayed in separate maps because when one is superimposed over the other, it is difficult to see both statistics. When areas with high poverty rates are also flood hazard zones, it indicates that vulnerable populations are also at risk of being impacted by flooding.
SOURCE: Office for Coastal Management. (n.d.c). Coastal Flood Exposure Mapper. National Oceanic and Atmospheric Administration. https://coast.noaa.gov/digitalcoast/tools/flood-exposure.html
National Integrated Heat Health Information System
- Days above 90F: Projected number of days (based on RCP 8.5)26 with temperature over 90F in 2050 = 121 (compared to 71 days per year on average from 1976 to 2005)
- Extreme heat days: Projected number of days per year warmer than the top 1 percent historically in 2050 = 32 (compared to four per year from 1976 to 2005)
Environmental Justice Indexes
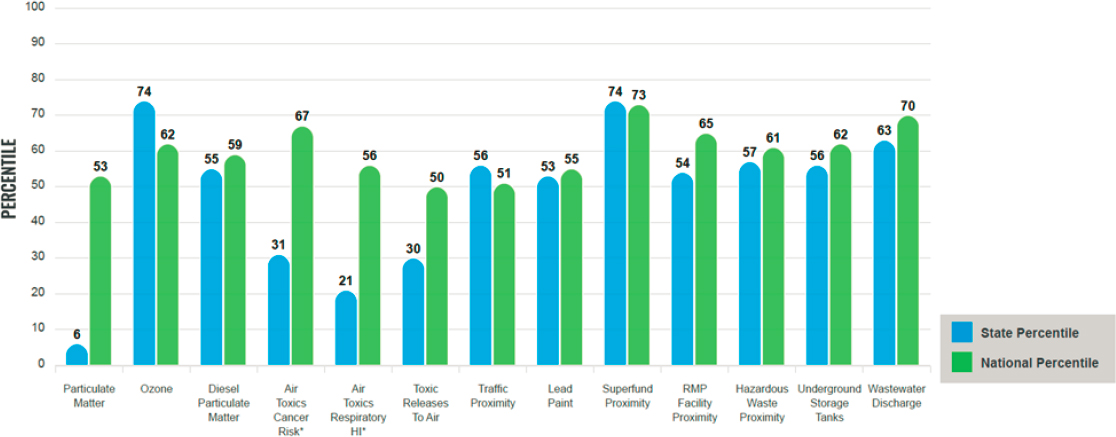
Figure C-1327 shows where Mobile County falls in relation to the rest of the state and nation by using a percentile for various EJIs within state and national contexts (see also Figure C-14). For example, Mobile County’s EJI for hazardous waste proximity is in the 82nd percentile when compared to the rest of the state of Alabama, and in the 73rd percentile for the rest of the country. This means that only about 18 percent of the population of Alabama lives in a block group with a higher EJI for hazardous waste proximity than the average person in Mobile County. Almost 30 percent of the U.S. population lives in a block group with a higher EJI for hazardous waste proximity than the average person in Mobile County. Mobile County is close to the 60th percentile in the nation for particulate matter; ozone; diesel particulate matter; risks associated with air toxins leading to cancer and respiratory issues, as indicated by the hazard index (HI); toxic releases to air; traffic proximity; lead paint; superfund proximity; proximity to facilities with a Risk Management Plan (RMP) for handling hazardous substances; and proximity to hazardous waste, underground storage tanks, and wastewater discharge.
Notable Recent Disasters Since 2000
Table C-3 below provides information for some of the most impactful hurricane disasters (all of which were federally declared major disasters28) since 2000 in Alabama, including the storm’s impact, damage, and federal response. Throughout these disasters FEMA has worked closely with the Alabama Emergency Management Agency (AEMA) to identify local partners to distribute funds and resources from federal programs to affected communities.
The two largest hurricane disasters in Alabama since the year 2000 were Hurricane Katrina and Hurricane Ivan. These two hurricanes had the
___________________
26 See footnote 17.
27 See footnote 18.
28 See footnote 19.
NOTE: The years for which the data are available, and the methods used, vary across these indicators. Important caveats and uncertainties apply to this screening-level information, so it is essential to understand the limitations on appropriate interpretations and applications of these indicators. Please see EJScreen documentation for discussion of these issues before using reports.
SOURCE: EPA. (n.d.). Environmental Justice Screening and Mapping Tool. https://ejscreen.epa.gov/mapper/
SOURCE: CDC. (n.d.). Climate and Health Program Heat and Health Tracker. Heat exposure data. https://ephtracking.cdc.gov/Applications/heatTracker/
highest wind speeds, largest number of power outages to Alabama, and overall highest costs to the state. FEMA played a crucial role in coordinating and providing assistance to affected areas. It worked in partnership with state and local authorities to assess damage, provide emergency resources, and support recovery efforts. However, for some of these disasters there was no information on FEMA aid programs. This is particularly the case for Hurricane Ida, which was the most current hurricane, compounding the damage from the previous year’s hurricanes. Some of the funding provided from FEMA for Hurricane Ida recovery was disbursed in an effort to meet the aid need for Hurricane Zeta and Hurricane Sally recovery, underscoring how much greater the current need is for aid.
There has been an increased focus in disaster preparedness for AEMA and the local government of Alabama. AEMA has worked on enhancing its resource management strategies, including stockpiling necessary supplies, pre-positioning assets and equipment, and ensuring effective coordination
| Storm | Landfall Date | Damage and Impact | Federal Response |
|---|---|---|---|
| Hurricane Ida | August 29, 2021 |
|
|
| Hurricane Zetaa,b,c,d | October 28, 2020 |
|
|
| Storm | Landfall Date | Damage and Impact | Federal Response |
|---|---|---|---|
| Hurricane Sallye,f,g,h | September 16, 2020 |
|
|
| Hurricane Katrinai,j | August 28, 2005 |
|
|
| Hurricane Ivank,l,m | September 16, 2004 |
|
|
NOTE: CDBG = Community Development Block Grant, FEMA = Federal Emergency Management Agency, HMGP = Hazard Mitigation Grant Program, HUD = U.S. Department of Housing and Urban Development, NFIP = National Flood Insurance Program, SBA = Small Business Administration.
a https://www.fema.gov/press-release/20210212/federal-assistance-alabamas-zeta-recovery-tops-31-million
b https://adeca.alabama.gov/cdbg-disaster-recovery/hurricanes-sally-and-zeta/
c https://www.irs.gov/newsroom/irs-announces-tax-relief-for-hurricane-zeta-victims
d https://www.fema.gov/sites/default/files/documents/PDAReport_FEMA4573DR-AL.pdf
e https://www.weather.gov/mob/Sally
f https://www.fema.gov/press-release/20210318/federal-aid-tops-260-million-alabama-recovery-hurricane-sally
g https://www.fema.gov/disaster/4563
h https://www.fema.gov/sites/default/files/documents/PDAReport_expedited_FEMA4563DRAL.pdf
i https://www.disastercenter.com/Katrina%20Alabama.html
j https://georgewbush-whitehouse.archives.gov/reports/katrina-lessons-learned/chapter5.html
k https://www.weather.gov/mob/ivan
l https://www.claimsjournal.com/news/southeast/2005/01/18/49787.htm
m https://georgewbush-whitehouse.archives.gov/news/releases/2004/09/20040916-1.html
SOURCES: Beven II, J. L., Hagen, A., & Berg, R. (2022). Tropical Cyclone Report: Hurricane Ida (Report No. AL092021). National Hurricane Center. https://www.nhc.noaa.gov/data/tcr/AL092021_Ida.pdf
Blake, E., Berg, R., & Hagen, A. (2020). Tropical Cyclone Report: Hurricane Zeta (Report No. AL282020). National Hurricane Center. https://www.nhc.noaa.gov/data/tcr/AL282020_Zeta.pdf
of resources between various response agencies and organizations. This has included the positioning of resources at locations of anticipated highest need. On behalf of the governor of Alabama, there have been preemptive declarations of emergency to help facilitate the distribution of aid throughout the state. Furthermore, AEMA is focused on making improvements to its communication systems and early warning systems to aid in accurate and timely information about approaching hurricanes and evacuation plans.
COMMUNITY PROFILE: HARRISON COUNTY AND COMMUNITY OF TURKEY CREEK, MISSISSIPPI
Social Vulnerability Index
The 2020 national overall SVI score for Harrison County was 0.9217 where possible scores range from 0 (lowest vulnerability) to 1 (highest

SOURCE: CDC/ATSDR. (2023). Social Vulnerability Index Interactive Map 2020. FL. https://www.atsdr.cdc.gov/placeandhealth/svi/interactive_map.html
vulnerability; see Figure C-15). A score of 0.9217 indicates a high level of vulnerability.
Health
For Harrison County,29 the estimated age-adjusted30 prevalence of asthma among adults age 18+ was 9.3 percent (CI: 9.0, 9.7) in 2020. This is just below the national average31 of 10 percent. The highest incidence
___________________
29 See footnote 11.
30 See footnote 12.
31 See footnote 13.
of asthma found in the southwest regions of Harrison County are in tracts near Gulfport (12.7%) and Biloxi (10.9%).
The estimated age-adjusted prevalence of coronary heart disease among adults age 18+ was 6.5 percent (CI: 5.9, 7.0) in 2020. This is right below the national average of 7.1 percent. There are high rates of heart disease in the southeast regions of Harrison County. One of the areas with the highest rate of incidence is Henderson Point (7.3%).
The estimated age-adjusted prevalence of adults aged 18+ who reported their mental health as “not good” for 14 or more days out of the past 30 was 15.2 percent (CI: 14.3, 16.0) in 2020. This is similar to the national average of 15.1 percent. Some of the highest incidence rates of poor mental health in Harrison County can be found around the city of Gulfport.
The estimated age-adjusted prevalence of fair or poor health among adults aged 18 years and older was 18.3 percent (CI: 16.2, 20.7) in 2020, almost 3 percent higher than the national average of 15.8 percent (see Figure C-16).
Current Flood Risk
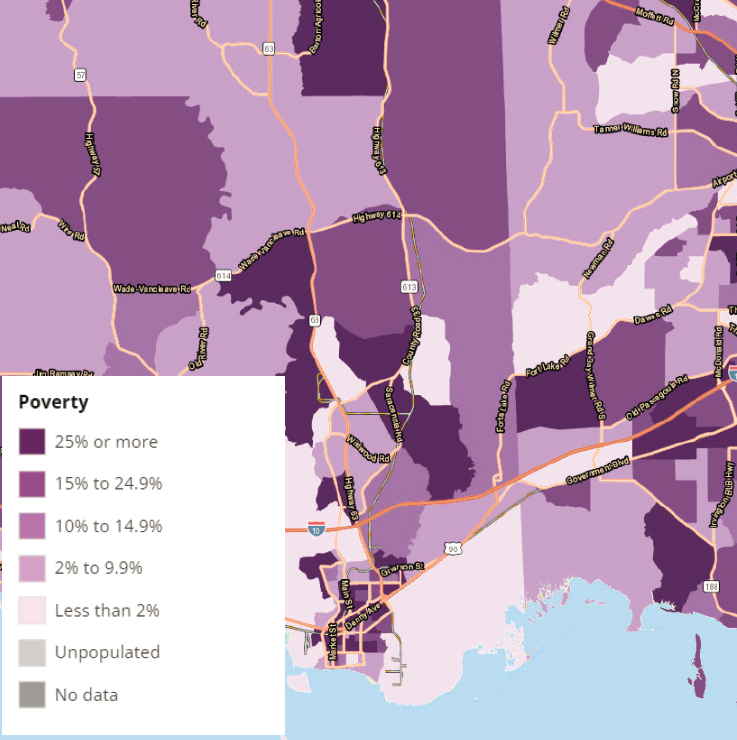
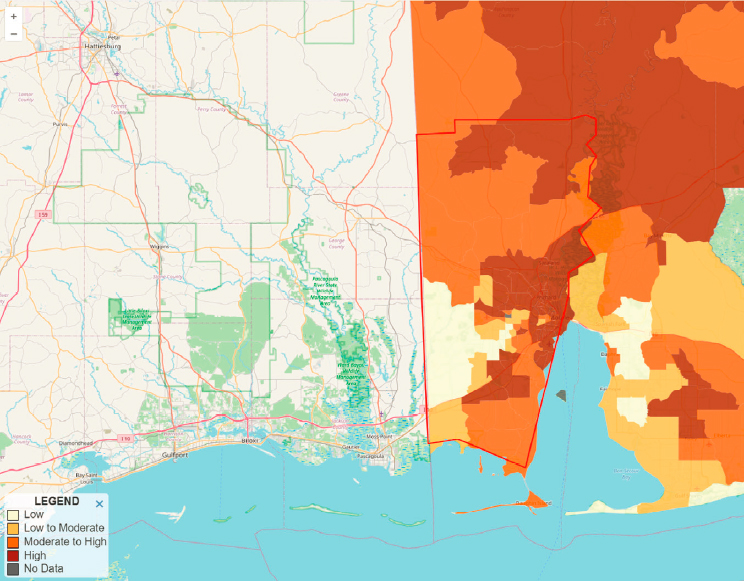
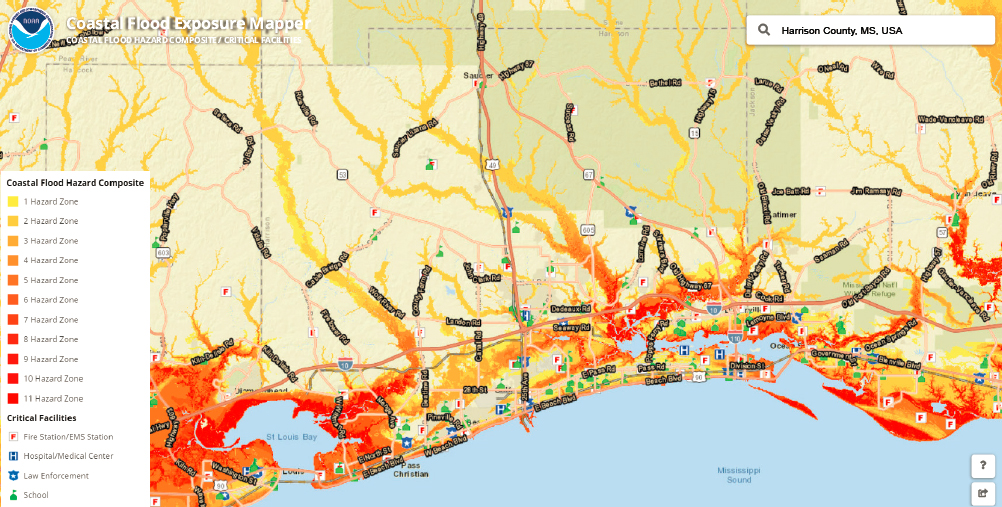
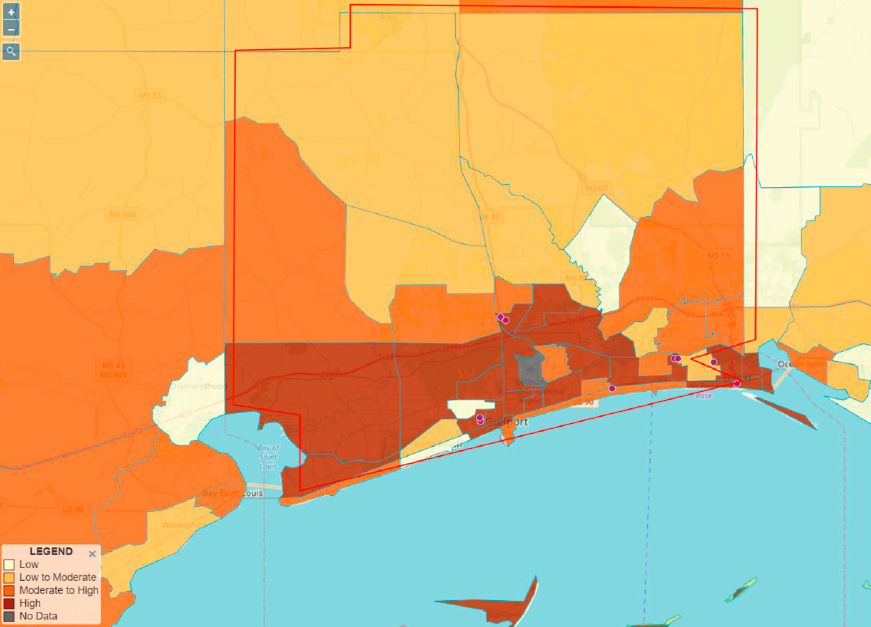
NOAA’s Coastal County Snapshot32 for Special Flood Hazard in Harrison County reports that 19.6 percent of county land falls within the 100-year floodplain where 26 percent of the county’s population resides. Of the population residing in the projected floodplain region, 27.6 percent of that population is over the age of 65, and 28.5 percent of the population is in poverty (see Figure C-17). According to FEMA and USGS data, 9.1 percent of critical facilities (schools, police and fire stations, and medical facilities) in Harrison County are located within the 100-year floodplain, including seven schools and four fire stations (see Figure C-18), and a little over 13 percent of Harrison County businesses (1,148), meaning that many community services, revenues, and salaries are at risk. Since 1991, over 14,287 flood insurance claims totaling 1 billion dollars have been made in Harrison County; all of these National Flood Insurance Program payouts were made between 2001 and 2005. Although 88.4 percent of development inside the 100-year floodplain existed already in 1996, the other 11.6 percent (2.59 square miles) was added between 1996 and 2016.
Projected Flood Risk and Extreme Heat
Under the National Climate Assessment’s moderate SLR scenario,33 by 2035, 17 homes (0.1% of the community’s homes), home to 35 people,
___________________
32 See footnote 14.
33 See footnote 16.


SOURCE: Office for Coastal Management. (n.d.a). Coastal County Snapshots: Special flood hazard. National Oceanic and Atmospheric Administration. https://coast.noaa.gov/digitalcoast/tools/snapshots.html

SOURCE: Office for Coastal Management. (n.d.a). Coastal County Snapshots: Special flood hazard. National Oceanic and Atmospheric Administration. https://coast.noaa.gov/digitalcoast/tools/snapshots.html
are projected to be at risk of chronic inundation34 in Harrison County. Together, these homes are valued at a little over 2 million dollars and contribute over $32,000 to the local property tax base. By 2100, 171 homes (1%) with 349 residents will be at risk of chronic inundation. These homes are valued at over 23 million dollars and contribute over $281,000 to the local property tax base.
Figure C-19’s map shows critical facilities (hospitals, schools, fire and police stations, etc.) and “areas prone to flooding from one or more of the following hazards: high tide flooding; high risk (1% annual chance for A
___________________
34 See footnote 15.
NOTES: NOAA’s Coastal Flood Exposure Mapper allows users to select a hazard layer (options include coastal flood hazard composite, high tide flooding, FEMA flood zones, tsunami, storm surge, SLR), societal exposure (options include population density, poverty, elderly, employees), infrastructure exposure (development, critical facilities, development patterns), and ecosystem exposure (natural areas and open space, potential pollution sources, natural protection, wetland potential). Poverty rates and flood hazard zones are displayed in separate maps because when one is superimposed over the other, it is difficult to see both statistics. When areas with high poverty rates are also flood hazard zones, it indicates that vulnerable populations are also at risk of being impacted by flooding.
SOURCE: Office for Coastal Management. (n.d.c). Coastal Flood Exposure Mapper. National Oceanic and Atmospheric Administration. https://coast.noaa.gov/digitalcoast/tools/flood-exposure.html
and V zones) and moderate risk (0.2% annual chance) flooding (designated by FEMA); storm surge for category 1 through category 3 hurricanes; sea level rise scenarios of 1, 2, and 3 feet; tsunami run-up zones (for high risk areas). The darker red color on the map indicates more flood hazard zones for that area” (Office for Coastal Management, n.d.b).
Figure C-20’s map, based on 2014–2018 ACS five-year estimates, shows the “percentage of people living below the poverty line for census block groups in or near coastal flood-prone areas (e.g., four-person family with annual cash income below $23,283). People in poverty may not have adequate resources to prepare for or respond to hazards. Their limitations may include substandard housing, lack of transportation to evacuate, lack of social support systems, and incomes that limit their ability to afford temporary lodging, relocation, or housing improvements” (Office for Coastal Management, n.d.b).
SOURCE: Office for Coastal Management. (n.d.c). Coastal Flood Exposure Mapper. National Oceanic and Atmospheric Administration. https://coast.noaa.gov/digitalcoast/tools/flood-exposure.html
National Integrated Heat Health Information System
- Days above 90F: Projected number of days (based on RCP 8.5)35 with temperature over 90F in 2050 = 118 (compared to 66 days per year on average from 1976 to 2005)
- Extreme heat days: Projected number of days per year warmer than the top 1 percent historically in 2050 = 33 (compared to four per year from 1976 to 2005)
Environmental Justice Indexes
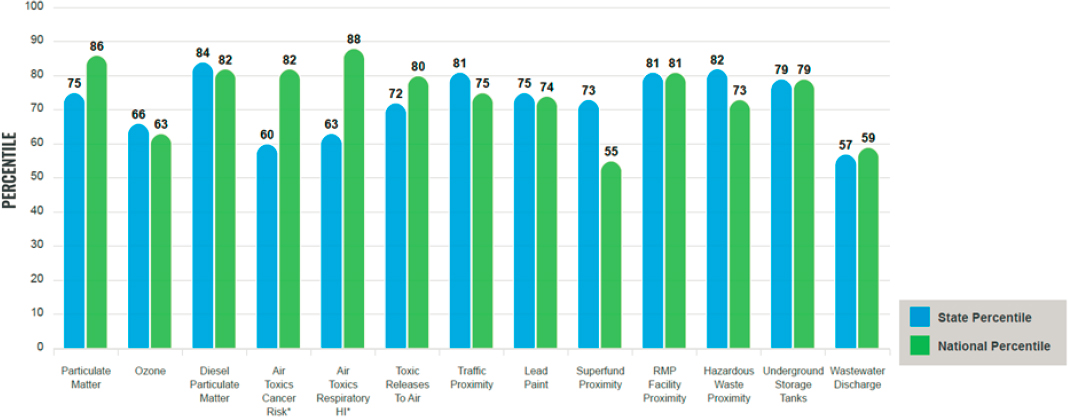
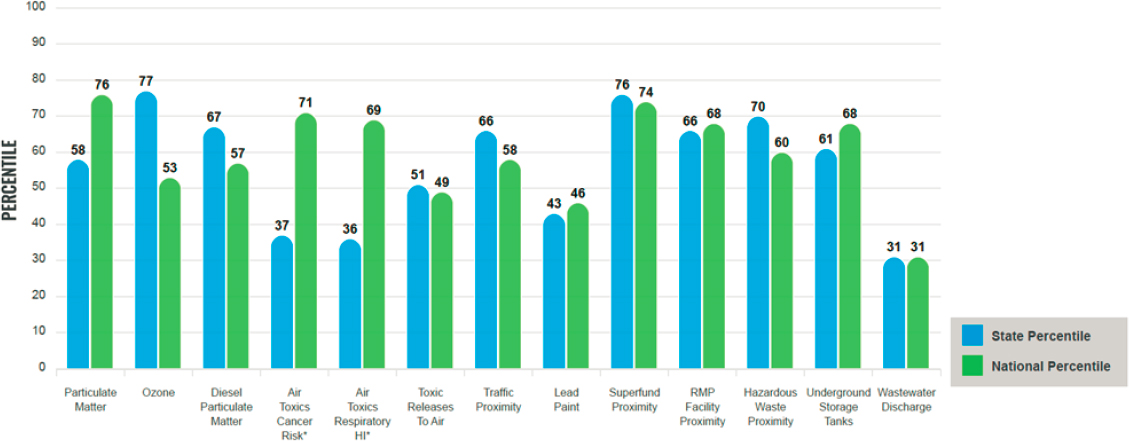
Figure C-2136 shows where Harrison County falls in relation to the rest of the state and nation by using a percentile for various EJIs within state and national contexts (see also Figure C-22). For example, Harrison County’s EJI for proximity to a superfund site is in the 76th percentile for the state of Mississippi and 74th for the nation as a whole. This means that only about 24 percent of the population of Mississippi lives in a block group with a higher EJI for proximity to a superfund site than the average person in Harrison County. Similarly, 26 percent of the U.S. population lives in a block group with a higher EJI for proximity to a superfund site than the average person in Harrison County. In general, the higher the percentile, the more vulnerable the selected area is compared to the rest of the state and nation. Harrison County is approximately at or above the 50th percentile in the nation in particulate matter, ozone, diesel particulate matter, air toxics cancer risk, air toxics respiratory HI, toxic releases to air, traffic proximity, superfund proximity, RMP facility proximity, proximity to hazardous waste, and underground storage tank.
Notable Recent Disasters Since 2000
The hurricane data provided gives a snapshot of each event’s impact, damage, and federal response. However, there was a lack of data on federal hurricane relief efforts beyond the dollars obligated for individual assistance, public assistance, and/or Hazard Mitigation Grant Program (HMGP) assistance. There was also an absence of data on insurance payouts outside the National Flood Insurance Program, and non-monetary federal assistance, such as manpower and resources from federal agencies like FEMA.
Between 2000 and the present day, Mississippi has been struck by several notable hurricanes, including Hurricane Ida (2021), Hurricane Zeta (2020), Hurricane Nate (2017), Hurricane Isaac (2012), and Hurricane
___________________
35 See footnote 17.
36 See footnote 18.
NOTE: The years for which the data are available, and the methods used, vary across these indicators. Important caveats and uncertainties apply to this screening-level information, so it is essential to understand the limitations on appropriate interpretations and applications of these indicators. Please see EJScreen documentation for discussion of these issues before using reports.
SOURCE: EPA. (n.d.). Environmental Justice Screening and Mapping Tool. https://ejscreen.epa.gov/mapper/
SOURCE: CDC. (n.d.). Climate and Health Program Heat and Health Tracker. Heat exposure data. https://ephtracking.cdc.gov/Applications/heatTracker/
Katrina (2005), each of which were federally declared disasters (see Table C-4).37 These storms resulted in varying degrees of damage, with Hurricane Katrina causing the most devastation, including over 238 fatalities and 186.3 billion dollars in total U.S. damages. The federal response to these disasters has varied, with assistance ranging from millions to billions of dollars to support housing, public assistance grants, and other needs. The impact of these storms on Mississippi has been significant, with power outages, storm surges, heavy rainfall, and tornadoes causing widespread destruction and loss of life.
Over the years, the federal government’s response to hurricanes in Mississippi has evolved in several ways, adapting to the severity and impact of each storm. While the amount of aid has generally correlated with the extent of the damage, there has been a growing focus on improving the speed and efficiency of response. Additionally, the federal government has increased its emphasis on preparedness, mitigation, and recovery efforts in order to build resilience against future disasters. Parallel to this, the Mississippi Emergency Management Agency (MEMA) has continually refined its disaster response plans based on experiences from previous hurricanes. It has focused on better pre-disaster planning, including more detailed evacuation plans, and has worked on improving communication with the public during emergencies. The state has also invested in infrastructure upgrades, such as reinforcing levees and improving the resilience of the power grid, to better withstand hurricanes. Additionally, MEMA has worked to ensure more effective coordination with local, federal, and nongovernmental partners for a comprehensive response. It has also focused on improving recovery processes, such as streamlining the application process for disaster assistance, to help residents recover more quickly after a storm.
COMMUNITY PROFILE: SOUTHEAST LOUISIANA (LAFOURCHE AND TERREBONNE PARISHES)
Social Vulnerability Index
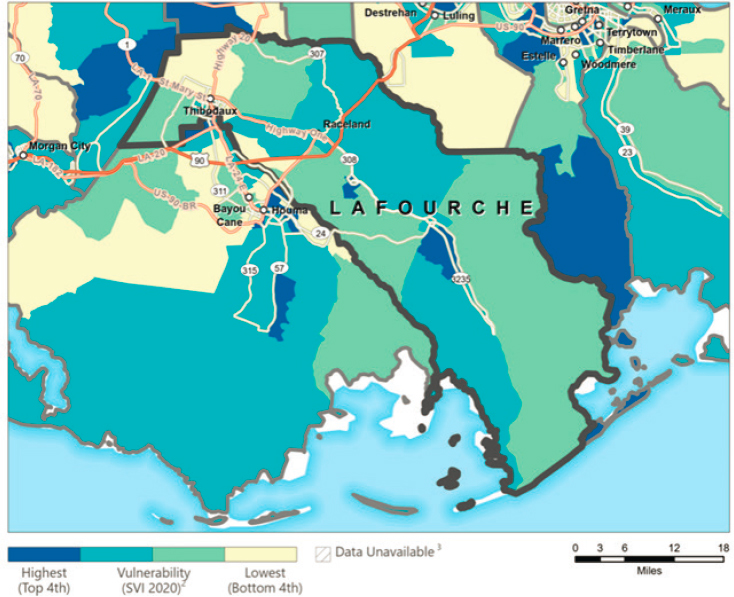
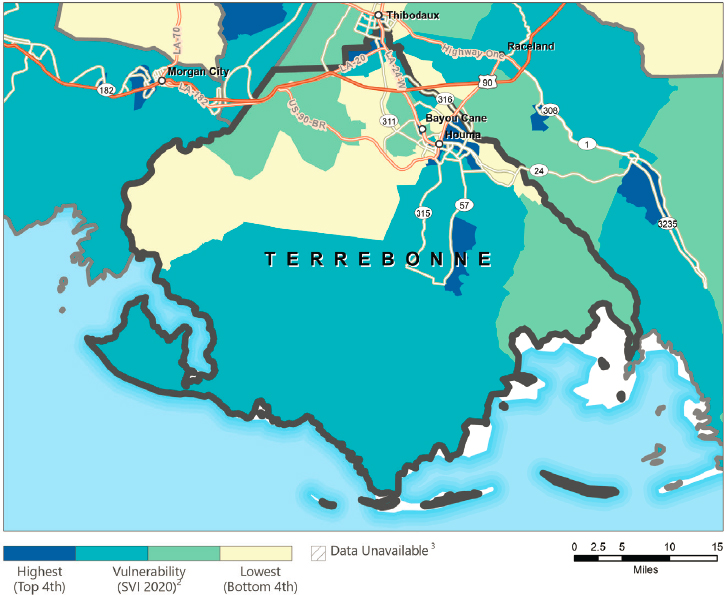
The 2020 national overall SVI score for Lafourche Parish scored 0.8033 and Terrebonne Parish 0.86 where possible scores range from 0 (lowest vulnerability) to 1 (highest vulnerability), indicating high vulnerability (see Figures C-23 and C-24).
___________________
37 See footnote 19.
| Storm | Landfall Date | Damage and Impact | Federal Response |
|---|---|---|---|
| Hurricane Idaa | August 29, 2021 |
|
|
| Hurricane Zetab | October 28, 2020 |
|
|
| Storm | Landfall Date | Damage and Impact | Federal Response |
|---|---|---|---|
| Hurricane Natec | October 8, 2017 |
|
|
| Hurricane Isaacd | August 28, 2012 |
|
|
| Storm | Landfall Date | Damage and Impact | Federal Response |
|---|---|---|---|
| Hurricane Katrinae,f | August 29, 2005 |
|
|
NOTES: FEMA = Federal Emergency Management Agency, HMGP = Hazard Mitigation Grant Program, NFIP = National Flood Insurance Program, SBA = Small Business Administration.
a https://www.fema.gov/disaster/4626
b https://www.fema.gov/fact-sheet/hurricane-zeta-recovery-update-009
c https://www.fema.gov/disaster/4350
d https://www.fema.gov/es/disaster/4081
e https://www.fema.gov/es/disaster/1604
f https://www.fema.gov/disaster-federal-register-notice/initial-notice-301
SOURCES: Berg, R. (2013). Tropical Cyclone Report: Hurricane Isaac. National Hurricane Center. https://www.nhc.noaa.gov/data/tcr/AL092012_Isaac.pdf
Beven II, J. L., & Berg, R. (2018). Tropical Cyclone Report: Hurricane Nate. National Hurricane Center. https://www.nhc.noaa.gov/data/tcr/AL162017_Nate.pdf
Beven II, J. L., Hagen, A., & Berg, R. (2022). Tropical Cyclone Report: Hurricane Ida. National Hurricane Center. https://www.nhc.noaa.gov/data/tcr/AL092021_Ida.pdf
Blake, E., Berg, R., & Hagen, A. (2020). Tropical Cyclone Report: Hurricane Zeta. National Hurricane Center. https://www.nhc.noaa.gov/data/tcr/AL282020_Zeta.pdf
Hartwig, R. P., & Wilkinson, C. (2010). Hurricane Katrina: The five year anniversary. Insurance Information Institute. https://www.iii.org/sites/default/files/1007Katrina5Anniversary.pdf
Nuwer, D. S. (2017, July 11). Hurricane Katrina. Mississippi Encyclopedia. Center for Study of Southern Culture.
Health38
In Lafourche Parish, the estimated age-adjusted39 prevalence of asthma among adults aged 18 and older was slightly lower than the national percentage at 8.3 percent (CI: 7.9, 8.8) in 2020. In Terrebonne Parish, the estimated prevalence of asthma among adults aged 18 and older was 10.0 percent (CI: 9.7, 10.4) in 2020. These compared to a national average40 of 10.0 percent. This indicates that the prevalence of asthma in Lafourche is
___________________
38 See footnote 11.
39 See footnote 12.
40 See footnote 13.
SOURCE: CDC/ATSDR. (2023). Social Vulnerability Index Interactive Map 2020. https://www.atsdr.cdc.gov/placeandhealth/svi/interactive_map.html
lower than the national average while in Terrebonne the prevalence is the equivalent.
The estimated age-adjusted prevalence of coronary heart disease among adults aged 18 and older in Lafourche Parish was 7.6 percent (CI: 7.1, 8.0) in 2020. In Terrebonne Parish, the prevalence was slightly lower at 7.5 percent (CI: 7.0, 7.9). Compared to a national average of 6.2 percent, the prevalence of heart disease in both parishes is slightly higher.
The estimated age-adjusted prevalence of adults aged 18+ who reported their mental health as “not good” for 14 or more days out of the past 30 days in Lafourche Parish was 19.3 percent (CI: 18.4, 20.2) in 2020, while the estimated prevalence in Terrebonne Parish was 18.7 percent (CI: 18.0, 19.4). The prevalence of adults with poor mental health across southeast Louisiana is higher than the national average of 15.1 percent.
SOURCE: CDC/ATSDR. (2023). Social Vulnerability Index Interactive Map 2020. https://www.atsdr.cdc.gov/placeandhealth/svi/interactive_map.html
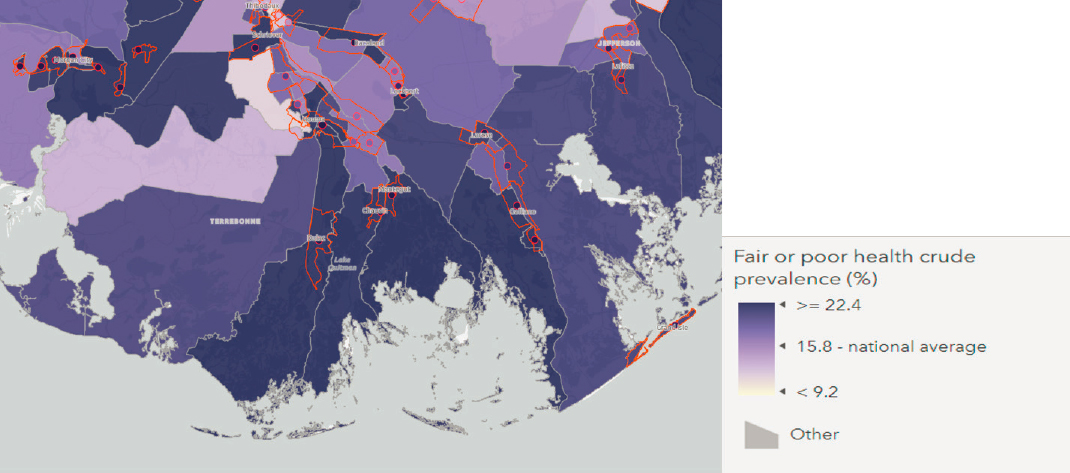
In Lafourche Parish, the estimated age-adjusted prevalence of fair or poor health among adults aged 18 years and older was 21.4 percent (CI: 19.6, 23.2) in 2020, while in Terrebonne Parish, the estimated prevalence was 20.8 percent (CI: 19.3, 22.5) in 2020. Compared to the national average of almost 15.8 percent, both Lafourche and Terrebonne Parishes have higher prevalence of adults with fair or poor health (see Figure C-25).
Current Flood Risk
NOAA’s Coastal County Snapshot41 for Special Flood Hazard for Lafourche Parish reveals Lafourche Parish’s considerable vulnerability to flooding, with 90.1 percent of its land situated within the designated
___________________
41 See footnote 14.
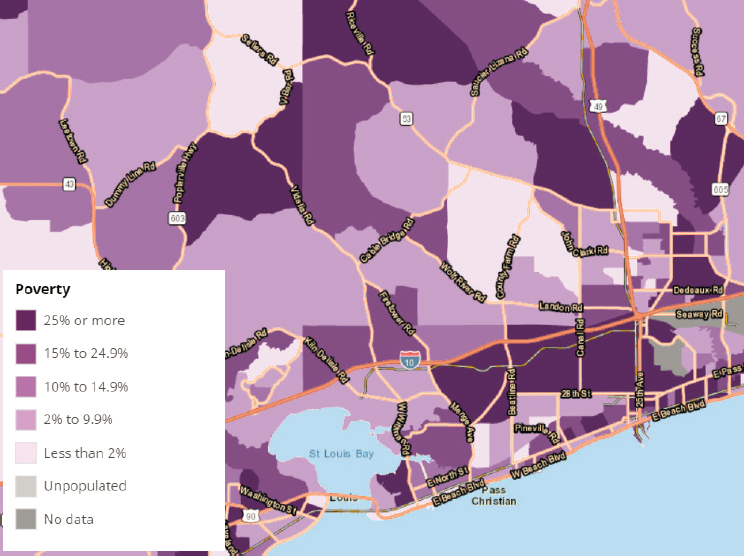
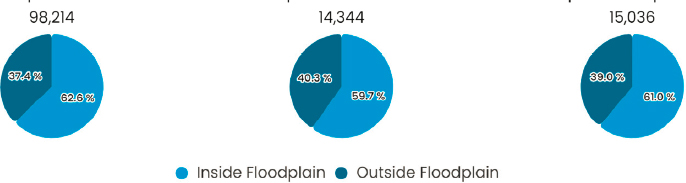
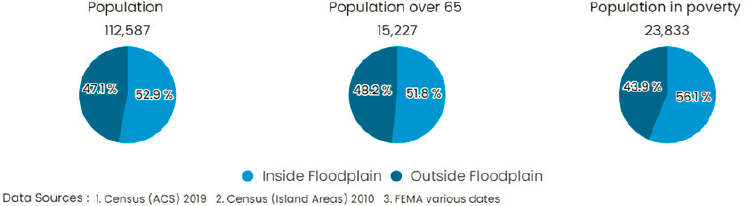
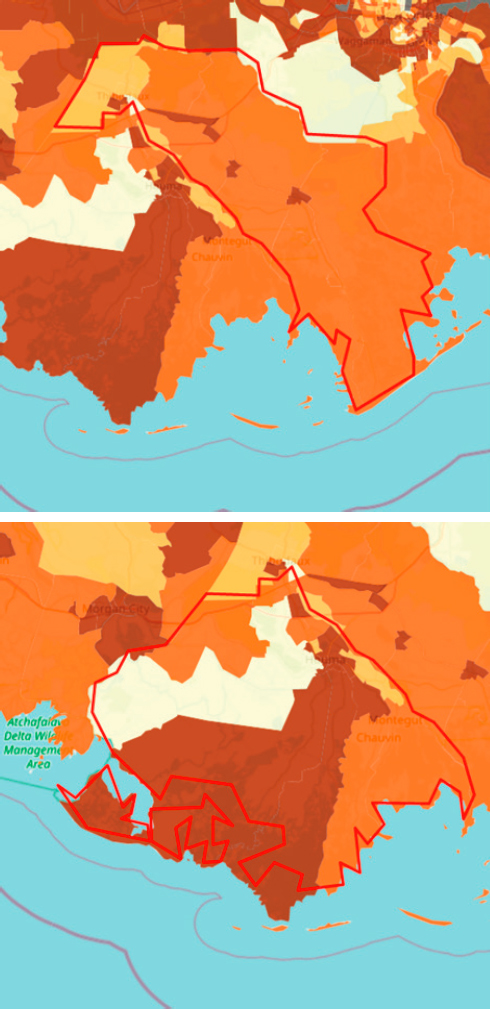
100-year floodplain. Nearly 63 percent of the parish’s population resides in this flood-prone region, including vulnerable segments such as older adults and economically disadvantaged individuals. Specifically, around 60 percent of residents aged 65 and older and approximately 61 percent of those living in poverty are located in the floodplain (see Figure C-26). The flood risk in Lafourche Parish also affects local businesses and critical facilities. Approximately 40 percent of the businesses operating in the parish are located within the 100-year floodplain. The parish experienced an almost 12 percent increase in development between 1996 and 2016, with about 88 percent of the existing development already established in 1996. Moreover, about 41 percent of critical facilities, including 14 schools, three police stations, 12 fire stations, and one medical facility, are situated within the designated 100-year floodplain (see Figure C-27). The financial impact of flooding in Lafourche Parish totals to approximately 51 million dollars in flood insurance claims filed between 1991 and 2020, covering almost 4,000 homes.
NOAA’s Coastal County Snapshot for Special Flood Hazard reveals that Terrebonne Parish is highly susceptible to flooding, with 94.5 percent of its land area located within the designated 100-year floodplain. This flood-prone region is home to almost 53 percent of the parish’s population, including vulnerable groups such as older adults and economically disadvantaged individuals. Specifically, about 52 percent of residents aged 65 and older reside in the floodplain, while nearly 56 percent of the population live
SOURCE: Office for Coastal Management. (2023). Coastal County Snapshots: Special flood hazard. National Oceanic and Atmospheric Administration. https://coast.noaa.gov/digitalcoast/tools/snapshots.html

SOURCE: Office for Coastal Management. (2023). Coastal County Snapshots: Special flood hazard. National Oceanic and Atmospheric Administration. https://coast.noaa.gov/digitalcoast/tools/snapshots.html
in poverty (see Figure C-28). The flood risk also affects the local economy, with about 23 percent of the parish’s businesses situated within the 100-year floodplain. Between 1996 and 2016, Terrebonne Parish experienced almost a 9 percent increase in development, with about 91 percent of the current development already established in 1996. Critical facilities are not exempt from this risk, as almost 30 percent of these infrastructures, including 11 schools and 12 fire stations, are located within the designated 100-year floodplain (see Figure C-29). The financial toll of flooding in Terrebonne Parish is substantial, with a total of 270 million dollars in flood insurance claims filed between 1991 and 2020, covering approximately 11,000 homes.
SOURCE: Office for Coastal Management. (2023). Coastal County Snapshots: Special flood hazard. National Oceanic and Atmospheric Administration. https://coast.noaa.gov/digitalcoast/tools/snapshots.html

SOURCE: Office for Coastal Management. (2023). Coastal County Snapshots: Special flood hazard. National Oceanic and Atmospheric Administration. https://coast.noaa.gov/digitalcoast/tools/snapshots.html
Projected Flood Risk and Extreme Heat
Under the National Climate Assessment’s moderate SLR scenario,42 by 2035, Lafourche Parish will see more than 1,500 (34%) of its existing homes at risk of chronic inundation. These homes hold a total worth of more than 120 million dollars, house more than 4,000 residents, and contribute almost $900,000 to the local property tax revenue. By 2100, the number of homes at risk is expected to rise to more than 3,600 (75%). These homes have a total value of almost 300 million dollars, house 9,195 people, and generate more than 2.2 million dollars for the local property tax base.
Similarly, by 2035, in Terrebonne Parish, almost 1,600 existing homes (23%) face the threat of chronic inundation.43 These homes currently have a combined value of just under 123 million dollars, provide shelter for approximately 4,400 individuals, and generate more than half a million dollars in local property taxes. By 2100, the number of homes at risk increases to almost 4,000 (60%), with a total value of more than 400 million dollars, housing over 11,000 people, and adding more than 2 million dollars to the property tax base.
___________________
42 See footnote 16.
43 See footnote 15.
The maps in Figures C-30 and C-31 come from the NOAA Coastal Flood Exposure Mapper.44 The tool allows you to select a hazard layer (options include coastal flood hazard composite, high tide flooding, FEMA flood zones, tsunami, storm surge, SLR), societal exposure (options include population density, poverty, elderly, employees), infrastructure exposure (development, critical facilities, development patterns), and ecosystem exposure (natural areas and open space, potential pollution sources, natural protection, wetland potential). Poverty rates and flood hazard zones are displayed in separate maps because when one is superimposed over the other, it is hard to see both statistics. When areas with high poverty rates are also flood hazard zones, it indicates that vulnerable populations are also at risk of being impacted by flooding.
Figure C-30’s map shows critical facilities (hospitals, schools, fire and police stations, etc.) and “areas prone to flooding from one or more of the following hazards: high tide flooding; high risk (1% annual chance for A and V zones) and moderate risk (0.2% annual chance) flooding (designated by the Federal Emergency Management Agency); storm surge for category 1 through category 3 hurricanes; sea level rise scenarios of 1, 2, and 3 feet; tsunami run-up zones (for high risk areas). The darker red color on the map indicates more flood hazard zones for that area” (Office for Coastal Management, n.d.b).
Figure C-31’s map, based on 2014–2018 ACS five-year estimates, shows the “percentage of people living below the poverty line for census block groups in or near coastal flood-prone areas (e.g., four-person family with annual cash income below $23,283). People in poverty may not have adequate resources to prepare for or respond to hazards. Their limitations may include substandard housing, lack of transportation to evacuate, lack of social support systems, and incomes that limit their ability to afford temporary lodging, relocation, or housing improvements” (Office for Coastal Management, n.d.b).
National Integrated Heat Health Information System
Lafourche Parish:
- Days above 90F: Projected number of days (based on RCP 8.5)45 with temperature over 90F in 2050 = 120 (compared to 69 days per year on average from 1976 to 2005)
___________________
44 See footnote 6.
45 See footnote 17.
NOTE: NOAA’s Coastal Flood Exposure Mapper allows users to select a hazard layer (options include coastal flood hazard composite, high tide flooding, FEMA flood zones, tsunami, storm surge, SLR), societal exposure (options include population density, poverty, elderly, employees), infrastructure exposure (development, critical facilities, development patterns), and ecosystem
exposure (natural areas and open space, potential pollution sources, natural protection, wetland potential). Poverty rates and flood hazard zones are displayed in separate maps because when one is superimposed over the other, it is difficult to see both statistics. When areas with high poverty rates are also flood hazard zones, it indicates that vulnerable populations are also at risk of being impacted by flooding.
SOURCE: Office for Coastal Management. (n.d.c). Coastal Flood Exposure Mapper. National Oceanic and Atmospheric Administration. https://coast.noaa.gov/digitalcoast/tools/flood-exposure.html
- Extreme heat days: Projected number of days per year warmer than the top 1 percent historically in 2050 = 35 (compared to four per year from 1976 to 2005)
Terrebonne Parish:
- Days above 90F: Projected number of days (based on RCP 8.5)46 with temperature over 90F in 2050 = 122 (compared to 72 days per year on average from 1976 to 2005)
- Extreme heat days: Projected number of days per year warmer than the top 1 percent historically in 2050 = 35 (compared to four per year from 1976 to 2005)
Environmental Justice Indexes
Figures C-32 and C-3347 show where Lafourche and Terrebonne Parishes fall in relation to the rest of the state and nation by using a percentile for various EJIs within state and national contexts (see also Figure C-34). For example, Lafourche Parish’s ozone level is in the 70th percentile for the state of Louisiana and in the 59th percentile for the nation. Meanwhile, Terrebonne Parish’s ozone level is in the 74th percentile for the state of Louisiana and in the 62nd percentile for the nation. This indicates that 41 percent of the U.S. population lives in a block group with a higher EJI for ozone than the average person in Lafourche Parish, and 38 percent of the U.S. population lives in a block group with a higher EJI for ozone than the average person in Terrebonne Parish. Lafourche Parish ranks close to or above the 50th percentile in the nation for particulate matter, ozone, diesel particulate matter, air toxics cancer risk, air toxics respiratory HI, toxic
___________________
46 See footnote 17.
47 See footnote 18.
SOURCE: Office for Coastal Management. (n.d.c). Coastal Flood Exposure Mapper. National Oceanic and Atmospheric Administration. https://coast.noaa.gov/digitalcoast/tools/flood-exposure.html
NOTE: The years for which the data are available, and the methods used, vary across these indicators. Important caveats and uncertainties apply to this screening-level information, so it is essential to understand the limitations on appropriate interpretations and applications of these indicators. Please see EJScreen documentation for discussion of these issues before using reports.
SOURCE: EPA. (n.d.). Environmental Justice Screening and Mapping Tool. https://ejscreen.epa.gov/mapper/
SOURCE: EPA. (n.d.). Environmental Justice Screening and Mapping Tool. https://ejscreen.epa.gov/mapper/
SOURCE: CDC. (n.d.). Climate and Health Program Heat and Health Tracker. Heat exposure data. https://ephtracking.cdc.gov/Applications/heatTracker/
releases to air, lead paint, superfund proximity, RMP facility proximity, hazardous waste proximity, underground storage tanks, and wastewater discharge. Terrebonne Parish is approximately at or above the 50th percentile in the nation for particulate matter, ozone, diesel particulate matter, air toxics cancer risk, air toxics respiratory HI, toxic releases to air, traffic proximity, lead paint, superfund proximity, RMP facility proximity, proximity to hazardous waste, underground storage tanks, and wastewater discharge.
Notable Recent Disasters Since 2000
Table C-5 below provides an overview of the significant impacts of hurricanes on Terrebonne and Lafourche Parishes as well as the state of Louisiana as a whole. However, there are data limitations, which include limited information on the federal government’s responses to Hurricanes Isaac and Gustav. Since the year 2000, Louisiana has experienced five hurricanes deemed federally declared major disasters,48 including Hurricanes Ida (2021), Laura (2020), Delta (2020), Zeta (2020), Isaac (2012), Gustav (2008), and Katrina (2005). These storms caused widespread damage, resulting in billions of dollars in property loss and infrastructure damage across the state. The most severe of these hurricanes was Hurricane Katrina, with a total of 186 billion dollars in damages and 41.1 billion dollars in insured damages in the United States (27.8 billion in 2009 dollars in insured damages in Louisiana; Hartwig & Wilkinson, 2010; Knabb et al., 2023). The federal response to these disasters involved major disaster declarations, financial assistance for affected residents, and funding for public infrastructure projects, emergency protective measures, and hazard mitigation programs. The impact of these hurricanes highlights the vulnerability of Terrebonne and Lafourche Parishes to storm surges, flooding, and extreme weather events.
The response to these events has demonstrated the evolving and multifaceted approach of federal, state, and local governments in addressing natural disasters. Federal agencies have played instrumental roles in providing disaster assistance. Over the years, FEMA’s efforts and initiatives have broadened over time to include financial assistance, repair grants, housing support, and rental assistance. The federal government has become increasingly proactive in providing aid before and after disasters. This is evidenced by the rapid issuance of major disaster declarations and the allocation of funding for various recovery programs following a hurricane event. Additionally, there has been an emphasis on adopting pre-disaster
___________________
48 See footnote 19.
mitigation measures, such as the HMGP, which can help reduce the impact of future disasters. State governments have consistently responded to these disasters by declaring states of emergency and requesting assistance from the federal government. The coordination between Louisiana’s governors and federal authorities has been crucial in securing funding and resources for the affected communities. State-level efforts have also included the allocation of resources to recovery programs and emergency services, such as the National Guard and first responders. At the local level, governments have implemented acquisition initiatives to buy flood-prone properties and encourage homeowners to relocate to safer areas. These programs, along with the development and revision of hazard mitigation plans, demonstrate local governments’ commitment to reducing the impact of future disasters on vulnerable communities.
COMMUNITY PROFILE: PORT ARTHUR, TEXAS
Social Vulnerability Index
The 2020 national overall SVI score for Jefferson County, Texas, was 0.9554 where possible scores range from 0 (lowest vulnerability) to 1 (highest vulnerability). A score of 0.9554 indicates a high level of vulnerability (see Figure C-35).
Health
In Port Arthur,49 the estimated age-adjusted50 prevalence of asthma among adults age 18+ was 10.7 percent (CI: 10.6, 10.8) in 2020. This is above the national average51 of 10 percent. Atreco and Pleasure Island have high incidence just north of Sabine Pass. And areas in close vicinity to the Jack Brooks Regional Airport and Groves report lower rates of asthma.
In this area, the estimated age-adjusted prevalence of coronary heart disease among adults aged 18+ was 7.5 percent (CI: 7.4, 7.6) in 2020. This is above the national average of 6.2 percent of crude prevalence of coronary heart disease. Pleasure Island, Port Arthur Reservoir, and Atreco have higher rates of coronary heart disease, and Nederland, Viterbo, Port Neches, and Central Gardens have lower rates of coronary heart disease.
In this area, the estimated age-adjusted prevalence of adults who reported their mental health as “not good” for 14 days or more among adults
___________________
49 See footnote 11.
50 See footnote 12.
51 See footnote 13.
| Storm | Landfall Date | Damage and Impact | Federal Response |
|---|---|---|---|
| Hurricane Idaa,b,c | August 29, 2021 |
|
|
| Storm | Landfall Date | Damage and Impact | Federal Response |
|---|---|---|---|
| Hurricane Zetah,i | October 28, 2020 |
|
|
| Storm | Landfall Date | Damage and Impact | Federal Response |
|---|---|---|---|
| Hurricane Deltaf,g | October 10, 2020 |
|
|
| Hurricane Laurad,e | August 27, 2020 |
|
|
| Storm | Landfall Date | Damage and Impact | Federal Response |
|---|---|---|---|
| Hurricane Isaacj,k | August 28, 2012 |
|
|
| Storm | Landfall Date | Damage and Impact | Federal Response |
|---|---|---|---|
| Hurricane Gustavm,n,o,p | September 1, 2008 |
|
|
| Storm | Landfall Date | Damage and Impact | Federal Response |
|---|---|---|---|
| Hurricane Katrinaq,r,s | August 29, 2005 |
|
|
NOTE: FEMA = Federal Emergency Management Agency, HMGP = Hazard Mitigation Grant Program, NFIP = National Flood Insurance Program, SBA = Small Business Administration.
a https://ldh.la.gov/news/6308
b https://www.fema.gov/fact-sheet/hurricane-ida-numbers-six-months
c https://gov.louisiana.gov/index.cfm/newsroom/detail/3374
d https://www.fema.gov/disaster/4559
e https://www.fema.gov/disaster/4559/notices
f https://www.fema.gov/disaster/4570
i https://www.fema.gov/disaster/4577
j https://www.fema.gov/sites/default/files/2020-07/craig-fugate_appropriations_testimony_9-25-2012.pdf
k https://www.fema.gov/sites/default/files/2020-10/pda-report_fema-4080-dr_la.pdf
l Federal response includes Hurricanes Gustav and Ike.
m https://www.tpcg.org/files/flooding/GustavIke_Proposed_CDBG_Application_Final.pdf
n https://reliefweb.int/report/united-states-america/usa-president-declares-major-disasterlouisiana
o http://floods.dotd.la.gov/multimodal/public_works/LaFloods/documents/newsletters/fp_2008dec.pdf
p https://www.fema.gov/press-release/20230425/nearly-6-million-mitigation-grants-help-communities-across-la
q https://www.fema.gov/pdf/hazard/hurricane/2005katrina/la_progress_report_0810.pdf
r https://georgewbush-whitehouse.archives.gov/news/releases/2005/09/20050908-8.html
s https://www.datacenterresearch.org/data-resources/katrina/facts-for-impact/
SOURCES: Berg, R. (2013). Tropical Cyclone Report Hurricane Isaac (Report No. Al092012).
National Hurricane Center. https://www.nhc.noaa.gov/data/tcr/AL092012_Isaac.pdf
Beven II, J. L., Hagen, A., & Berg, R. (2022). Tropical Cyclone Report: Hurricane Ida (Report No. AL092021). National Hurricane Center. https://www.nhc.noaa.gov/data/tcr/AL092021_Ida.pdf
Beven II, J. L., & Kimberlain, T. B. (2009). Tropical Cyclone Report: Hurricane Gustav (Report No. AL072008). National Hurricane Center. https://www.nhc.noaa.gov/data/tcr/AL072008_Gustav.pdf
Blake, E., Berg, R., & Hagen, A. (2020). Tropical Cyclone Report: Hurricane Zeta. National Hurricane Center. https://www.nhc.noaa.gov/data/tcr/AL282020_Zeta.pdf
Cangialosi, J. P., & Berg, R. (2020). Tropical Cyclone Report: Hurricane Delta (Report No. AL282020). National Hurricane Center. https://www.nhc.noaa.gov/data/tcr/AL262020_Delta.pdf
Copp, D. (2020, October 29). Zeta leaves wind damage, power outages in Lafourche and Terrebonne. Houma Today. https://www.houmatoday.com/story/news/2020/10/29/zeta-leaveswind-damage-power-outages-lafourche-and-terrebonne/6054941002/
Gisclair, C. (2012, September 5). Darkness lingers locally in Hurricane Isaac. The Houma Times. https://www.houmatimes.com/news/darkness-lingers-locally-in-hurricane-isaac/
Hartwig, R. P., & Wilkinson, C. (2010, July). Hurricane Katrina: The five year anniversary. Insurance Information Institute. https://www.iii.org/sites/default/files/1007Katrina5Anniversary.pdf
Knabb, R. D., Rhome, J. R., & Brown, D. P. (2023). Tropical Cyclone Report: Hurricane Katrina. National Hurricane Center. https://www.nhc.noaa.gov/data/tcr/AL122005_Katrina.pdf
Pasch, R. J., Berg, R., Roberts, D. P., & Papin, P. P. (2020). Tropical Cyclone Report: Hurricane Laura (Report No. AL132020). National Hurricane Center. https://www.nhc.noaa.gov/data/tcr/AL132020_Laura.pdf
Wilson, X. A. (2012, October 1). Flood prevention: Officials say work diminished Isaac’s damage. Houma Today. https://www.houmatoday.com/story/news/2012/10/01/flood-preventionofficials-say-work-diminished-isaacs-damage/27029634007/
Wyatt, M., & Mamone, D. (2021, September 6). Terrebonne, Lafourche residents remain without power, limited cell service after Hurricane Ida. The Acadiana Advocate. https://www.theadvocate.com/acadiana/news/weather_traffic/terrebonne-lafourche-residents-remainwithout-power-limited-cell-service-after-hurricane-ida/article_f08ded78-0f46-11ec-8d363fb648294a3b.html
Zullo, R., & King, N. (2008, September 5). More than four days after Gustav, no shelters in Terrebonne. Houma Today. https://www.houmatoday.com/story/news/2008/09/05/morethan-four-days-after-gustav-no-shelters-in-terrebonne/26486331007/
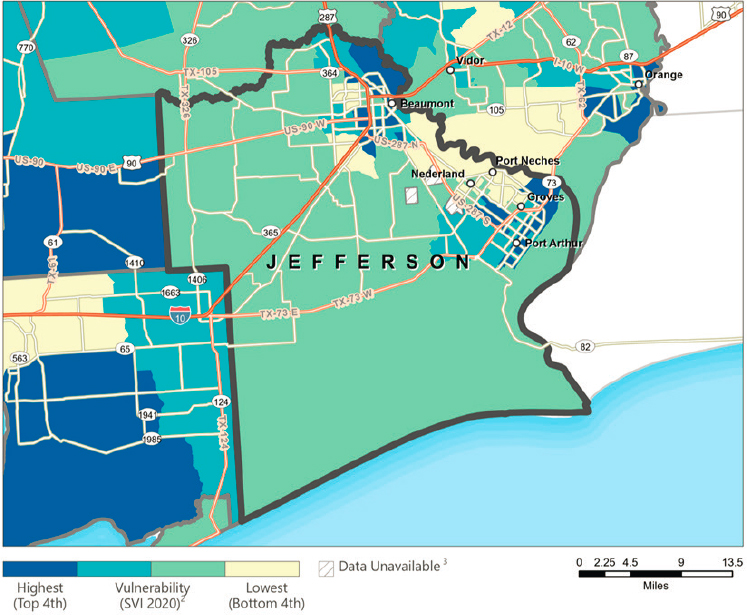
SOURCE: CDC/ATSDR. (2023). Social Vulnerability Index Map. https://www.atsdr.cdc.gov/placeandhealth/svi/interactive_map.html
18+ was 17.4 percent (CI: 17.2, 17.6) in 2020. This is slightly higher than the national average of 15.1 percent. Like asthma and heart disease, some of the highest incidence rates of poor mental health are in Atreco and along the Sabine Neches Canal. One census tract reports an incidence rate of over 19 percent.
In this area, the estimated age-adjusted prevalence of fair or poor health among adults aged 18 years and older was 28.5 percent (CI: 26.7, 30.5) in 2020, almost 13 percent higher than the national average of 15.8 percent (see Figure C-36).
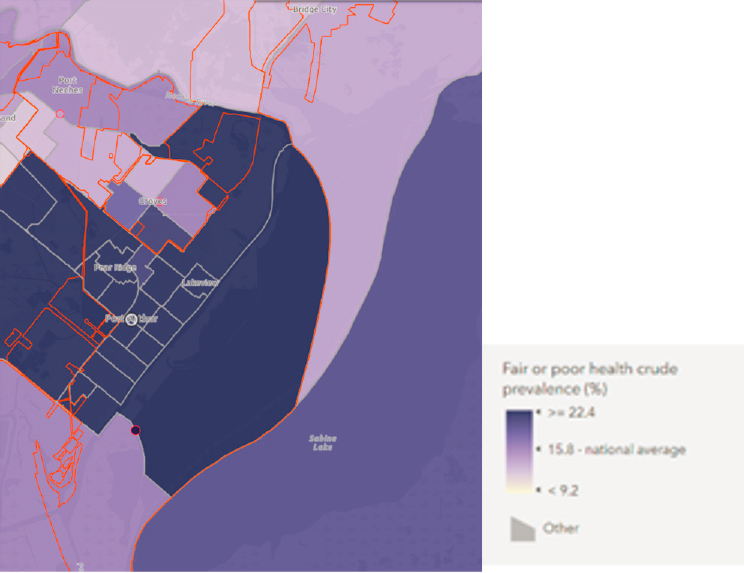
SOURCE: CDC. (n.d.). CDC PLACES. https://www.cdc.gov/places
Current Flood Risk
NOAA’s Coastal County Snapshot52 for SLR53 in Jefferson County reports 1.5 percent of the population resides in low-lying areas (elevation less than 2 feet above sea level). These low-lying areas are prone to flooding and storm surges from severe weather events like hurricanes or heavy rains, making residents vulnerable to property damage and personal injury. Increased population and factors such as age, income, and capabilities can worsen the effects, as not all residents might be adequately prepared (see Figure C-37). Despite these challenges, all of Jefferson County’s critical facilities (schools, police and fire stations, and medical facilities) are situated outside of these low-lying areas. Additionally, 0.2 percent of Jefferson County’s businesses are situated within low-lying areas that are at an
___________________
52 See footnote 14.
53 Special Flood Hazard data were not available for Jefferson County from NOAA’s Coastal County Snapshots, so SLR data were reported instead.
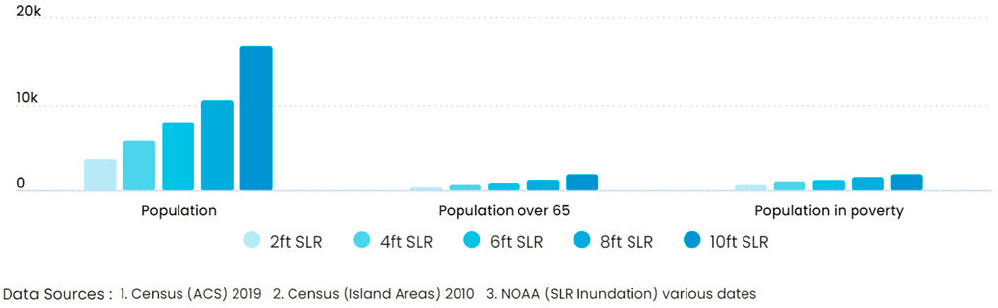
SOURCE: Office for Coastal Management. (n.d.a). Coastal County Snapshots: People at risk. National Oceanic and Atmospheric Administration. https://coast.noaa.gov/digitalcoast/tools/snapshots.html
elevation of less than 2 feet above sea level. Approximately 90 percent of the areas inundated at 2 feet of SLR are natural features (see Figure C-38).
Projected Flood Risk and Extreme Heat
By 2035, eight homes in Port Arthur are at risk of becoming chronically inundated,54 representing less than 1 percent of the community’s homes. Today those homes are worth a collective $689,230, house an estimated 18 people, and contribute $9,219 to the local property tax base. By 2100, 62 homes are at risk of becoming chronically inundated in Port Arthur, this represents less than 1 percent of the community’s homes. Today those homes are worth a collective 4.8 million dollars, house 141 people, and contribute $92,428 to the local property tax base.
Figure C-39’s map shows critical facilities (hospitals, schools, fire and police stations, etc.) and “areas prone to flooding from one or more of the following hazards: high tide flooding; high risk (1% annual chance for A and V zones) and moderate risk (0.2% annual chance) flooding (designated by the Federal Emergency Management Agency); storm surge for category 1 through category 3 hurricanes; sea level rise scenarios of 1, 2, and 3 feet; tsunami run-up zones (for high risk areas). The darker red color on the map indicates more flood hazard zones for that area” (Office for Coastal Management, n.d.a).
Figure C-40’s map, based on 2014–2018 ACS five-year estimates, shows the “percentage of people living below the poverty line for census block groups in or near coastal flood-prone areas (e.g., four-person family with annual cash income below $23,283). People in poverty may not have adequate resources to prepare for or respond to hazards. Their limitations may include substandard housing, lack of transportation to evacuate, lack of social support systems, and incomes that limit their ability to afford temporary lodging, relocation, or housing improvements” (Office for Coastal Management, n.d.a).
National Integrated Heat Health Information System
- Days above 90F: Projected number of days (based on RCP 8.5)55 with temperature over 90F in 2050 = 131 (compared to 86 days above 90F per year on average from 1976 to 2005)
- Extreme heat days: Projected number of days per year warmer than the top 1 percent historically in 2050 = 32 (compared to four extreme heat days per year from 1976 to 2005)
___________________
54 See footnote 15.
55 See footnote 17.
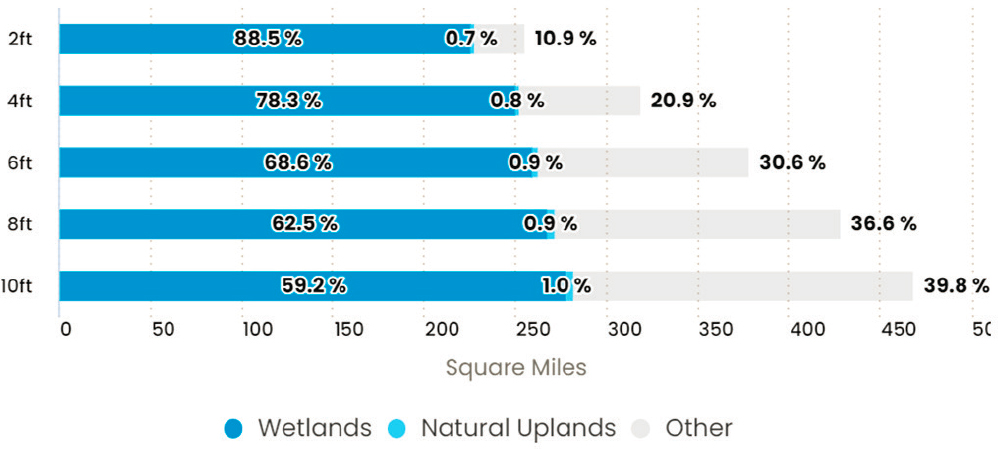
SOURCE: Office for Coastal Management. (n.d.b). Coastal County Snapshots: People at risk. National Oceanic and Atmospheric Administration. https://coast.noaa.gov/digitalcoast/tools/snapshots.html
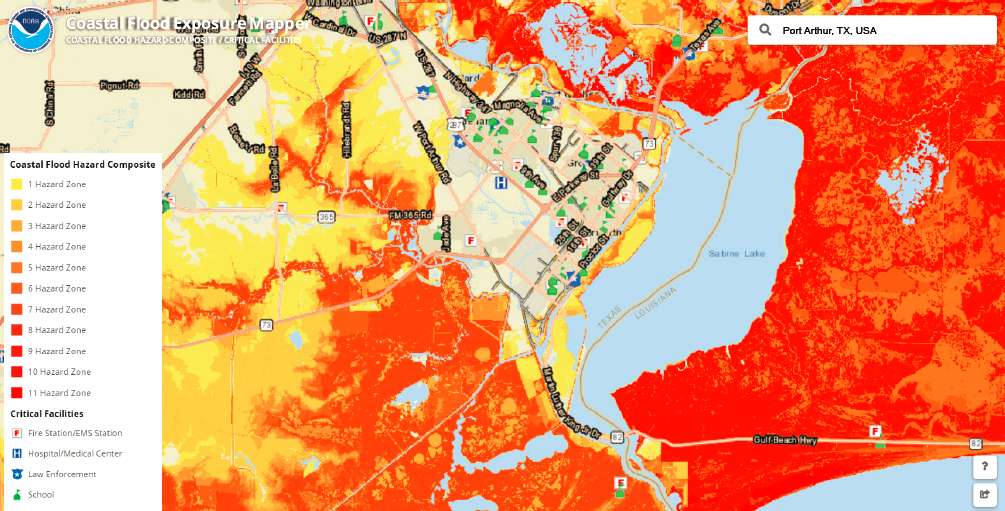
SOURCE: Office for Coastal Management. (n.d.c). Coastal Flood Exposure Mapper. National Oceanic and Atmospheric Administration. https://coast.noaa.gov/digitalcoast/tools/flood-exposure.html
NOTES: NOAA’s Coastal Flood Exposure Mapper allows users to select a hazard layer (options include coastal flood hazard composite, high tide flooding, FEMA flood zones, tsunami, storm surge, SLR), societal exposure (options include population density, poverty, elderly, employees), infrastructure exposure (development, critical facilities, development patterns), and ecosystem exposure (natural areas and open space, potential pollution sources, natural protection, wetland potential). Poverty rates and flood hazard zones are displayed in separate maps because when one is superimposed over the other, it is difficult to see both statistics. When areas with high poverty rates are also flood hazard zones, it indicates that vulnerable populations are also at risk of being impacted by flooding.
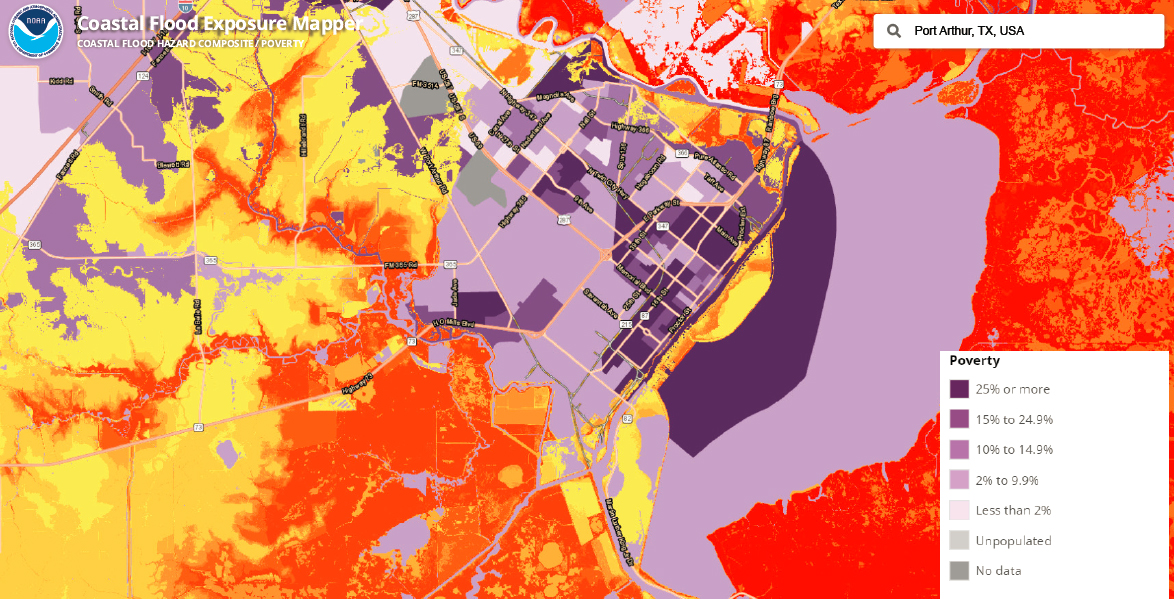
SOURCE: Office for Coastal Management. (n.d.c). Coastal Flood Exposure Mapper. National Oceanic and Atmospheric Administration. https://coast.noaa.gov/digitalcoast/tools/flood-exposure.html
Environmental Justice Indexes
Figure C-4156 shows where Port Arthur falls in relation to the rest of the state and nation by using a percentile for various EJIs within state and national contexts. For example, Port Arthur’s air toxics cancer risk (lifetime cancer risk from the inhalation of air toxics) is in the 96th percentile for the state of Texas and 98th for the nation as a whole. This means that only about 4 percent of the population of Texas and 2 percent of the U.S. population live in a block group with higher air toxics cancer risk than the average person in Port Arthur. Port Arthur is approximately at or above 90th percentile in the nation for particulate matter, ozone, air toxics cancer risk, toxic releases to air, superfund proximity, RMP facility proximity, hazardous waste proximity, underground storage tanks, and wastewater discharge. The only EJIs for which Port Arthur is below 80th percentile in the nation are diesel particulate matter and air toxics respiratory HI. High percentiles on almost all EJIs reflect the scale of environmental hazards Port Arthur is dealing with outside of issues related to natural hazards and SLR.
Figure C-42 displays hazardous waste facilities and infrastructure (e.g., generators, transporters, treaters, storers, and disposers of hazardous waste) and flood risk (due to rainfall, riverine flooding, and coastal surge flooding) in Port Arthur.57 Yellow, orange, and red areas are at 80th percentile or above in the nation for flood risk. The overlap of areas with high flood risk and hazardous waste facilities is another indication of the numerous risks Port Arthur faces (see Figure C-43).
Notable Recent Disasters Since 2000
Port Arthur has been hit by several significant hurricane disasters since 2000, resulting in extensive damage to the city’s infrastructure and impacting the livelihood of residents (see Table C-6). The first major hurricane to hit Port Arthur since 2000 was Hurricane Rita in 2005, which caused widespread power outages and flooding throughout the city. The storm left many residents without power for several days, and recovery efforts were slow due to the extent of the damage. In 2008, Hurricane Ike struck Port Arthur, causing significant damage to homes and businesses, and resulting in extensive power outages and widespread flooding. Many lost their homes and struggled to recover from the widespread damage. Hurricane Harvey hit Port Arthur in 2017 and caused unprecedented flooding throughout
___________________
56 See footnote 18.
57 More information is available at https://www.epa.gov/ejscreen/ejscreen-map-descriptions#sites-reporting-to-epa
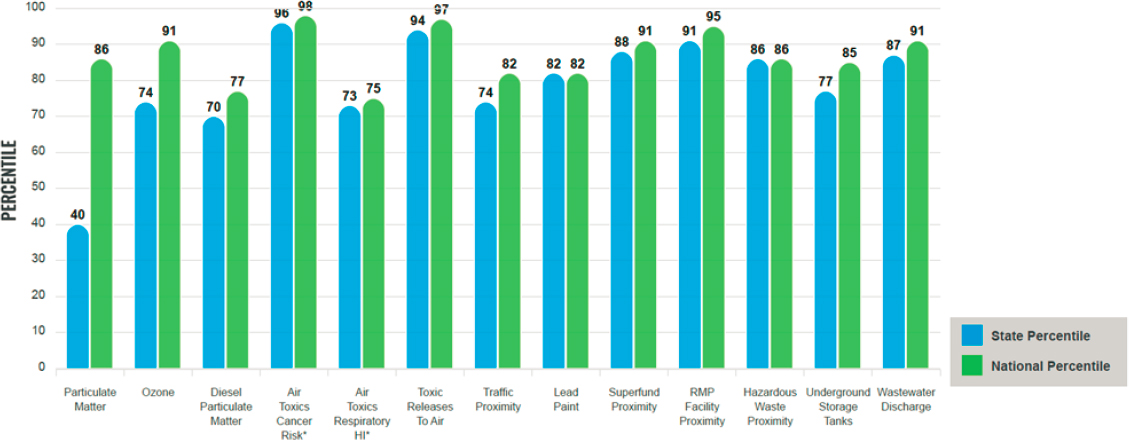
SOURCE: EPA. (n.d.). Environmental Justice Screening and Mapping Tool. https://ejscreen.epa.gov/mapper/
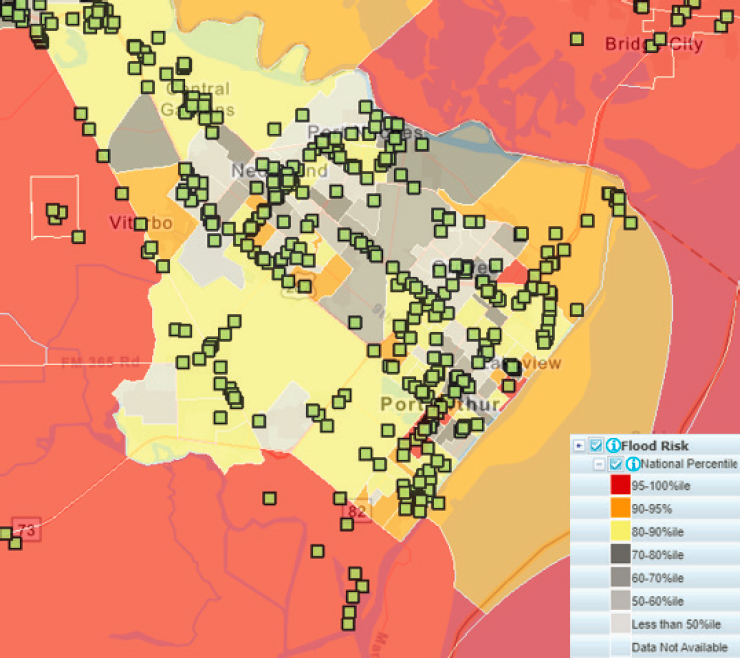
SOURCE: EPA. (n.d.). Environmental Justice Screening and Mapping Tool. https://ejscreen.epa.gov/mapper/
the city, with many residents having to be rescued from their homes by emergency personnel. The hurricane caused significant damage to the city’s infrastructure (i.e., power lines, roads, and bridges), leaving many residents without electricity or access to basic services for several days. Finally, Hurricane Laura impacted Port Arthur in 2020 causing a mandatory evacuation prior to the storm. FEMA and other federal assistance programs supported much of the Gulf region to assuage flooding and storm damages to businesses and infrastructure.
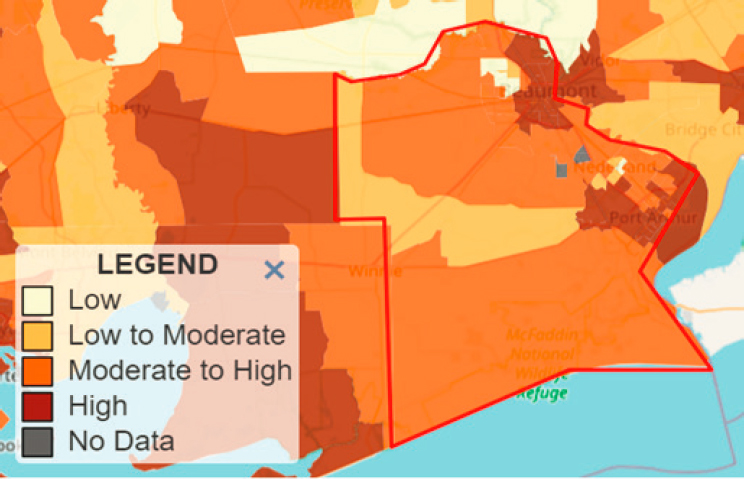
SOURCE: CDC. (n.d.). Climate and Health Program Heat and Health Tracker: Heat exposure data. https://ephtracking.cdc.gov/Applications/heatTracker/
| Storm | Landfall Date | Damage and Impact | Federal Response |
|---|---|---|---|
| Hurricane Lauraa,b,c,d | August 20, 2020 |
|
|
| Hurricane Harveye,f,g,h,i | August 29, 2017 |
|
|
| Storm | Landfall Date | Damage and Impact | Federal Response |
|---|---|---|---|
| Hurricane Ikej,k,l,m | September 13, 2008 |
|
|
| Hurricane Ritan,o,p,q,r | September 23, 2005 |
|
|
NOTE: FEMA = Federal Emergency Management Agency, HMGP = Hazard Mitigation Grant Program, NFIP = National Flood Insurance Program, SBA = Small Business Administration.
a https://abc13.com/port-arthur-hurricane-laura-beaumont-east-texas/6388711/
b https://www.fema.gov/sites/default/files/documents/PDAReport_FEMA4572DR-TX.pdf
c https://www.fema.gov/press-release/20210825/hurricane-laura-recovery-efforts-through-one-year
d https://www.fema.gov/disaster/4572
e https://www.lbb.texas.gov/documents/publications/staff_report/2019/5097_hurricane_harvey.pdf
f https://www.wikiwand.com/en/Port_Arthur,_Texas
g https://www.fema.gov/sites/default/files/2020-03/FEMA4332DRTX_Expedited.pdf
h https://www.fema.gov/press-release/20230425/president-donald-j-trump-approves-major-disaster-declaration-texas
i https://www.fema.gov/press-release/20230425/historic-disaster-response-hurricane-harvey-texas
j https://incidentnews.noaa.gov/incident/7893
k https://incidentnews.noaa.gov/incident/7893
l https://www.hsdl.org/?view&did=35507
m https://www.fema.gov/sites/default/files/2020-09/PDAReport_FEMA-1791-DR-TX.pdf
n https://www.panews.com/tag/hurricane-rita-anniversary/
o https://www.weather.gov/lch/rita_main
p https://reliefweb.int/report/united-states-america/usa-six-months-after-hurricane-rita
q https://georgewbush-whitehouse.archives.gov/news/releases/2005/09/20050923-3.html
r https://georgewbush-whitehouse.archives.gov/news/releases/2005/09/20050924-7.html
SOURCES: Berg, R. (2009). Tropical Cyclone Report: Hurricane Ike (Report No. AL092008). National Hurricane Center. https://www.nhc.noaa.gov/data/tcr/AL092008_Ike.pdf
Blake, E. S., & Zelinsky, D. A. (2018). National Hurricane Center Tropical Cyclone Report: Hurricane Harvey (Report No. AL092017). National Hurricane Center. https://www.nhc.noaa.gov/data/tcr/AL092017_Harvey.pdf
Garcia-Buckalew, B. (2022, August 25). The Backstory: Five years ago this week, Hurricane Harvey brought catastrophic flooding to Texas. KVUE ABC. https://www.kvue.com/article/news/local/texas/hurricane-harvey-catastrophic-flooding-texas-five-years-ago/269-0a738956-e-387-4b81-aaa2-1ed6115caef4
Garnham, J. P. (2020). Still recovering from Harvey, Texans in Beaumont and Port Arthur are now preparing for a new hurricane during the pandemic. Texas Tribune. https://www.texastribune.org/2020/08/26/hurricane-laura-beaumont-port-arthur-texas/
Pasch, R. J., Berg, R., Roberts, D. P., & Papin, P. P. (2020). National Hurricane Center Tropical Cyclone Report: Hurricane Laura (Report No. AL132020). National Hurricane Center. https://www.nhc.noaa.gov/data/tcr/AL132020_Laura.pdf
Wallach, D. (2016, September 13). 8 years ago, Hurricane Ike powered through Southeast Texas. Beaumont Enterprise. https://www.beaumontenterprise.com/news/weather/article/8years-ago-Hurricane-Ike-powered-through-9219448.php
Yan, H., & Chavez, N. (2017, August 31). Harvey aftermath: Death toll rises; so do the floodwaters. CNN. https://www.cnn.com/2017/08/30/us/harvey-texas-louisiana/index.html


