Mitigation Strategies for Deterring Transit Assaults (2025)
Chapter: Temporal Patterns

CHAPTER 2
Assaults on Passengers and Transit Workers—What the Data Show
The NTD contains two forms for reporting incidents related to transit security: the Major (S&S-40) and Nonmajor (S&S-50) Summary Report Forms (27). Reportable incidents must occur on transit right-of-way or infrastructure, at a transit revenue facility or maintenance facility, during a transit-related maintenance activity, or involve a transit revenue vehicle. As noted earlier, agencies can exclude incidents occurring at bus stops or shelters that are not located on transit-owned property, unless the incident involves boarding or exiting a transit vehicle; or the event occurs off transit property but results in individuals coming to rest on transit property afterward. Thus, the analysis results presented here do not consider assaults occurring at bus stops or shelters.
As shown in Table 4, the NTD reporting requirements have changed over time (28). In 2002, security events were no longer reported via the S&S-50. In 2023, the NTD expanded reporting requirements for assaults on transit workers; the new requirements apply to full, reduced, tribal, and rural transit workers. Since April 2023, all assaults on transit workers—major or nonmajor—are reported to the NTD. Thus, the NTD data from April 2023 to present provides a basic understanding of assaults on riders and workers separately. This analysis capitalized on that distinction, showing information about assaults on riders and workers separately.
Overview
Between April 2023 and June 2024, 106 transit agencies reported 2,959 major security events on transit-owned property (Table 5). Among those incidents, 66 percent involved riders, 17 percent involved transit operators, and 12 percent involved other transit workers. Additionally, 5 percent of the incidents were classified as Not Applicable with victims not specified. The majority of assaults occurred in or on transit vehicles (55 percent) and transit stations (43 percent), with a smaller proportion occurring in other areas (2 percent).
Table 6 compares the number of assaults across different transit modes and lists their frequency relative to UPTs. Bus services (in or on vehicles) experienced 1,049 assaults, equating to a low 0.31 assaults per 1 million UPTs. Heavy rail (transit revenue facilities) experienced 1,300 assaults, equating to a slightly higher 0.40 assaults per 1 million UPTs. Light rail/bus rapid transit (BRT) had fewer assaults (527) but the highest assault rate, equating to 1.15 assaults per 1 million UPTs. Other modes reported 83 assaults, equating to 0.51 assaults per 1 million UPTs. Overall, light rail/BRT experienced the highest assault rate relative to passenger volume.
Temporal Patterns
The number of assaults on riders has fluctuated since April 2023, ranging from a high of more than 160 assaults per month in early 2023 to a low of less than 120 assaults per month in October 2023. Figure 2 shows the number of transit assaults by month. After the dip in late 2023,
Long Description.
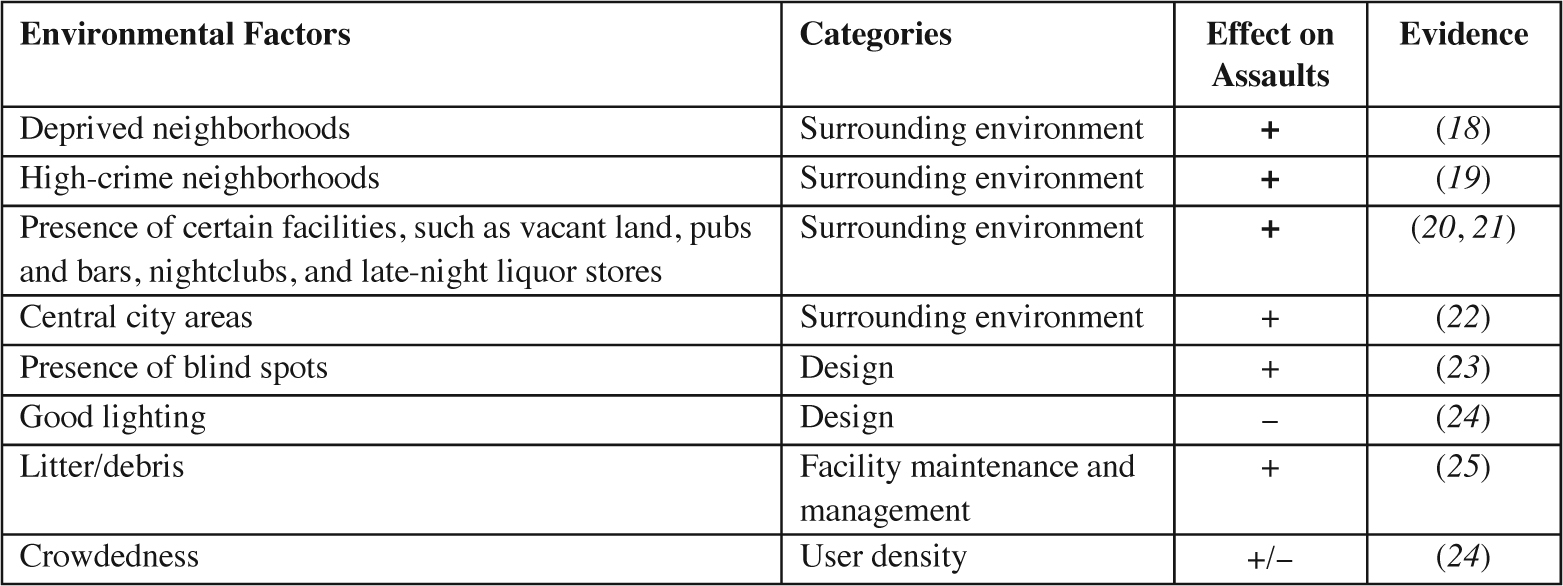
The table lists environmental factors associated with transit assault and security perceptions. It has four columns titled environmental factors, categories, effect on assaults, and evidence. Deprived neighborhoods; high‐ crime neighborhoods; the presence of certain facilities like vacant land, pubs, bars, nightclubs, and late‐night liquor stores; and central city areas fall under the category of the surrounding environment and show a positive effect on assaults. The presence of blind spots under the category of design also shows a positive effect. Good lighting under design shows a negative effect. Litter and debris under the category of facility maintenance and management also show a positive effect. Crowdedness under the category of user density shows both positive and negative effects. Each factor has a reference number listed in the evidence column to support the finding.
operators were published in TCRP Research Report 193: Tools and Strategies for Eliminating Assaults Against Transit Operators, Volume 2: User Guide, which addresses transit operator assaults (26).
Organization of the Guide
This guide is organized into the following chapters:
- Chapter 1: Background and Introduction, which provides an overview and the scope of the document;
- Chapter 2: Assaults on Passengers and Transit Workers—What the Data Show, which presents the characteristics of assaults experienced on U.S. bus and rail transit systems;
- Chapter 3: Decision-Making Guidance, which summarizes existing decision-making procedures from federal agencies, industry organizations, and other trespass prevention collaborations;
- Chapter 4: Causes, Risks, and Consequences of Assaults on Passengers and Transit Workers, which identifies the root causes, location-based risks, and consequences of assaults while also providing methods to identify risks associated with assaults;
- Chapter 5: Mitigation Strategies to Reduce Assaults on Passengers and Transit Workers, which discusses the mitigation countermeasures to deter assault on bus/rail transit property and each strategy discussion includes a description of the countermeasure and its applications, implementation, and benefits and costs, as well as best practices and lessons learned based on information gathered through a literature review, survey, focus groups, and interviews;
- Chapter 6: Post-Assault Activities, which describes steps to take following an assault, such as collecting and analyzing data, filing a charge with police authorities, providing post-assault counseling, retraining transit workers, and considering countermeasures;
- Chapter 7: Interactive Matrix of Countermeasures, which categorizes potential countermeasures by ease of implementation and describes the matrix and spreadsheet tools that agencies can use to narrow the menu of countermeasure options for a given assault concern; and
- Chapter 8: Conclusion, which provides a summary of the guide.
Appendix A provides the topics to discuss and questions to ask focus group participants and interviewees. Appendix B summarizes the mitigation strategies in a tabular format with information about appropriate application(s), location(s) for use, cost, ease of implementation, whether it is a common strategy, and effectiveness.
- Hispanics—the subject of more recent studies—report feeling more afraid of crime than Whites or African Americans. This fact is due, in part, to their social circumstances, but also due to language obstacles and/or immigration status, which may create a lack of faith in the police or the system as a whole (11).
Transit Workers
Assaults on transit workers pose serious threats to their physical and mental health. The emotional impact from an assault can deter transit employees from returning to work, impacting both schedule and revenue.
In 2015, the Transit Advisory Committee for Safety identified the following risk factors for transit workers (16):
- Direct interaction with the public, including individuals who may be intoxicated, have mental illness, and so forth;
- High-risk contextual environments (e.g., working in high-crime areas or during late night or early morning periods);
- High-risk individual-related interactions (e.g., perpetrators of violence using alcohol or drugs or fare evaders);
- A lack of adequate escape routes;
- Increased sexual harassment and gender-based violence against women transit workers; and
- Increased racially targeted assaults and abuse against transit workers who are ethnic minorities (17).
Transit Environment
Transit environments are composed of both physical (built environment) characteristics (e.g., surrounding land uses, station/stop design features, and so forth) and social characteristics (e.g., the level of crowdedness, and so forth). The location of transit stops matters for the safety and security of transit riders. Transit stops in high-crime neighborhoods or near risky facilities, such as bars, vacant land, and parking lots, tend to experience elevated crime risks. Conversely, stops located in mixed land-use areas improve safety perceptions, particularly at night.
Environmental design features that enhance visibility, such as transparent shelters, large windows, and natural surveillance, contribute to safety by reducing opportunities for crime. Additionally, well-maintained environments deter criminal activity, aligning with “the broken windows theory,” which suggests signs of neglect may encourage further crime. Adequate lighting also fosters a sense of security.
Crowdedness, however, presents a dual dynamic—while it may increase risks of pickpocketing or inappropriate sexual touching, it enables informal social control through natural surveillance, which can deter more severe crimes like aggravated assault. Overall, transit environments that prioritize good visibility, are well maintained, and have adequate lighting can significantly reduce the risk of assault, although challenges such as overcrowding and specific crime types like sexual assault must still be addressed. Table 3 summarizes the environmental factors associated with transit assault and security perceptions.
Scope of the Guide
This guide applies to assaults on passengers and transit workers who are not vehicle operators/drivers that occur on transit property, including vehicles, stations, stops, and park-and-ride facilities. Researchers did not focus on transit operators; the results of the research on transit
Long Description.
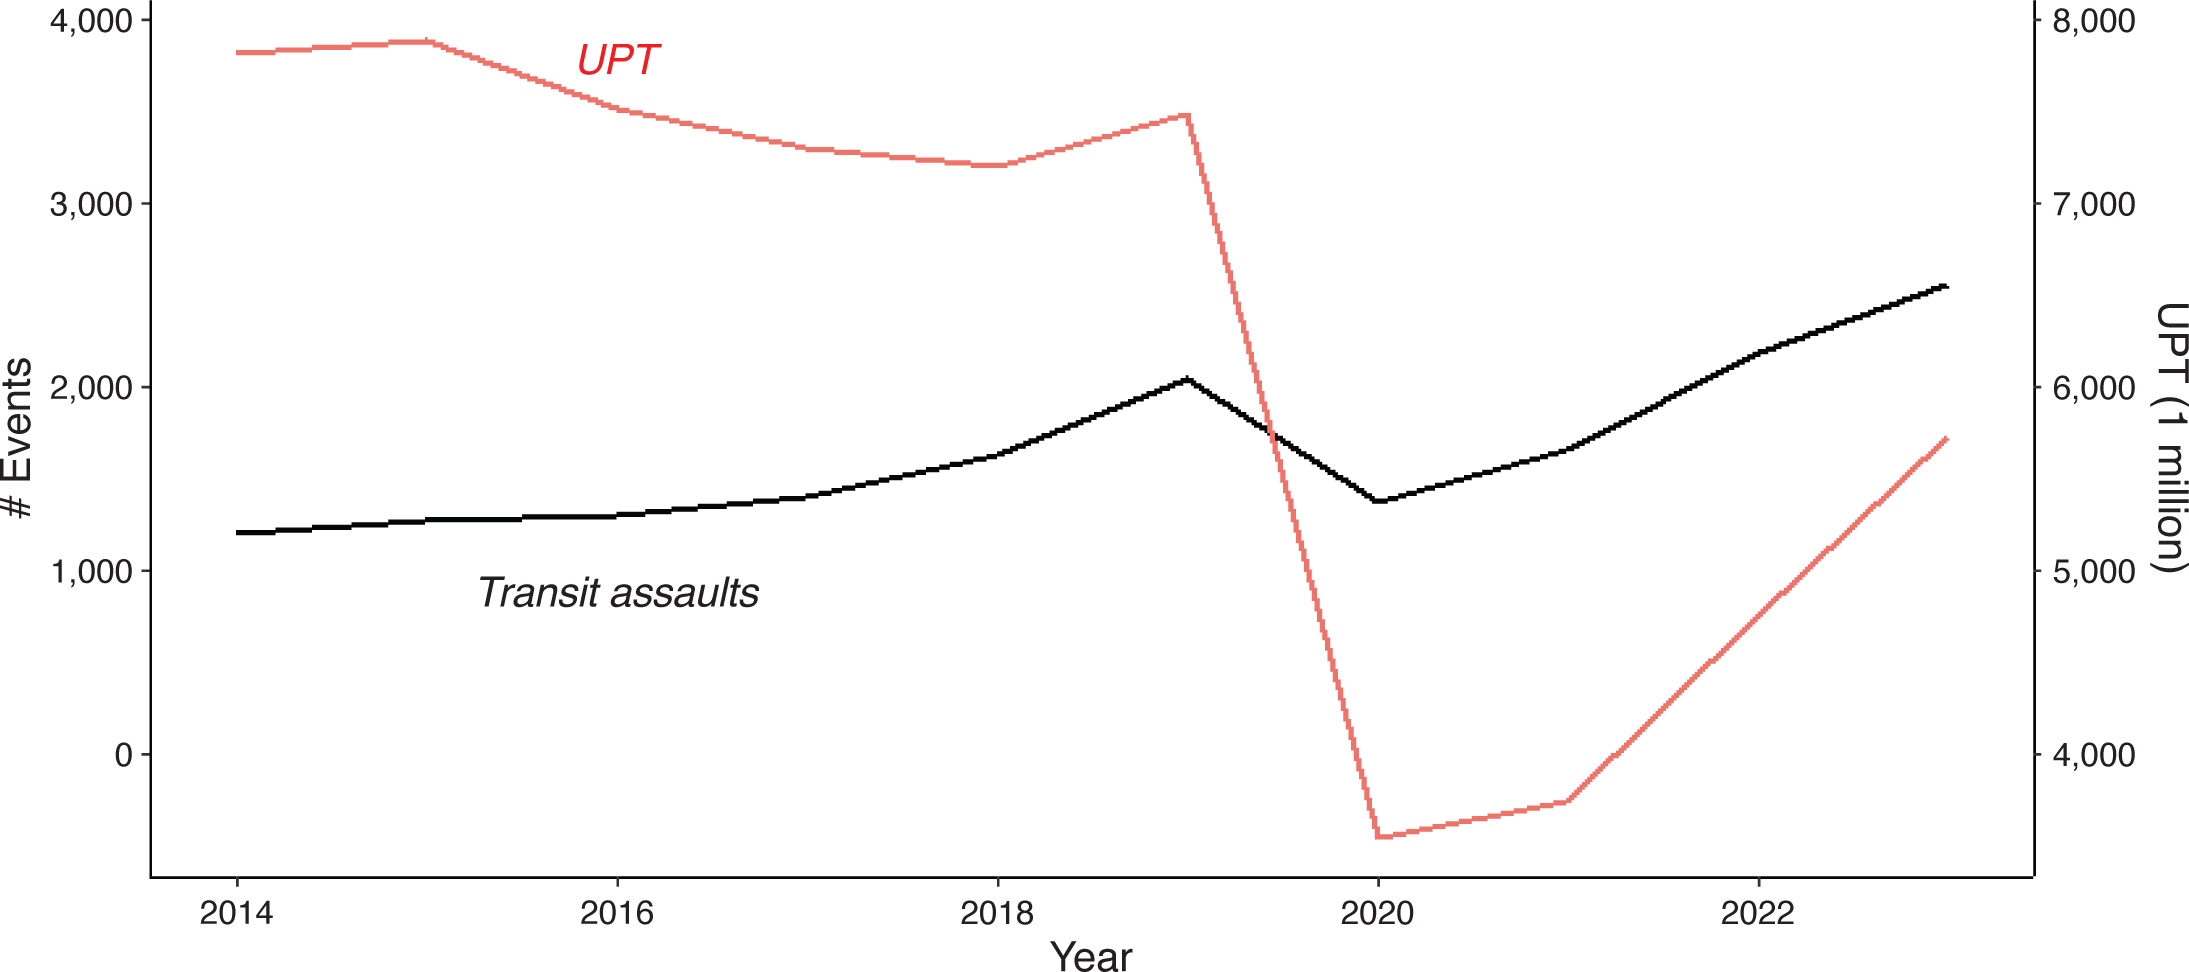
The chart shows trends from 2014 to 2023 for transit assaults and unlinked passenger trips. The left vertical axis shows the number of events. The right vertical axis shows unlinked passenger trips in millions. The horizontal axis shows years from 2014 to 2023. A solid line shows transit assaults, which rise gradually from about 1,200 events in 2014 to around 2000 in 2019, then dip in 2020 before rising again through 2023. Another line shows unlinked passenger trips. It remains high from 2014 to 2019 at around 7,000 to 8,000 million, drops steeply in 2020, and begins to rise again in 2021 through 2023.
Transit assaults also fluctuate depending on the time of day. Crimes such as pickpocketing, public disorder, and some types of sexual harassment are more likely to occur during crowded periods, such as peak hours, when greater anonymity exists among passengers. Conversely, crimes requiring privacy, such as robberies, are more common in empty stations or bus stops with little-to-no surveillance. Robberies are particularly prevalent after 6:00 p.m., and the fear of assaults is heightened during nighttime hours, especially when riders are waiting for public transportation in poorly lit or isolated areas. These temporal patterns highlight the importance of targeted safety measures to address risks during specific times and days.
Types of Users and Transit Assaults/Perceived Security
Passengers
The demographic and socioeconomic characteristics of transit riders can impact their perception of safety and their likelihood of experiencing assault while using transit. Studies have found a disproportionate risk for women (5, 6, 7, 8). Research has shown that
- Women are more likely to experience fear and crime while using public transit. They experience a higher frequency of verbal harassment and unwanted physical contact.
- Younger women are more likely to be harassed than older women (9).
- Non-White women often experience higher levels of fear than White women (10, 11).
- Income is also a factor that might affect feelings of fear. Low-income women are more fearful of crime than high-income women. The reason for this is partly because they often live in high-crime and unsafe neighborhoods (12).
- Women with disabilities are more likely to be harassed in public transit environments (13).
Sociodemographic factors such as age, race/ethnicity, and socioeconomic status can impact the fear of crime and victimization rates in public spaces. Research has shown that
Long Description.
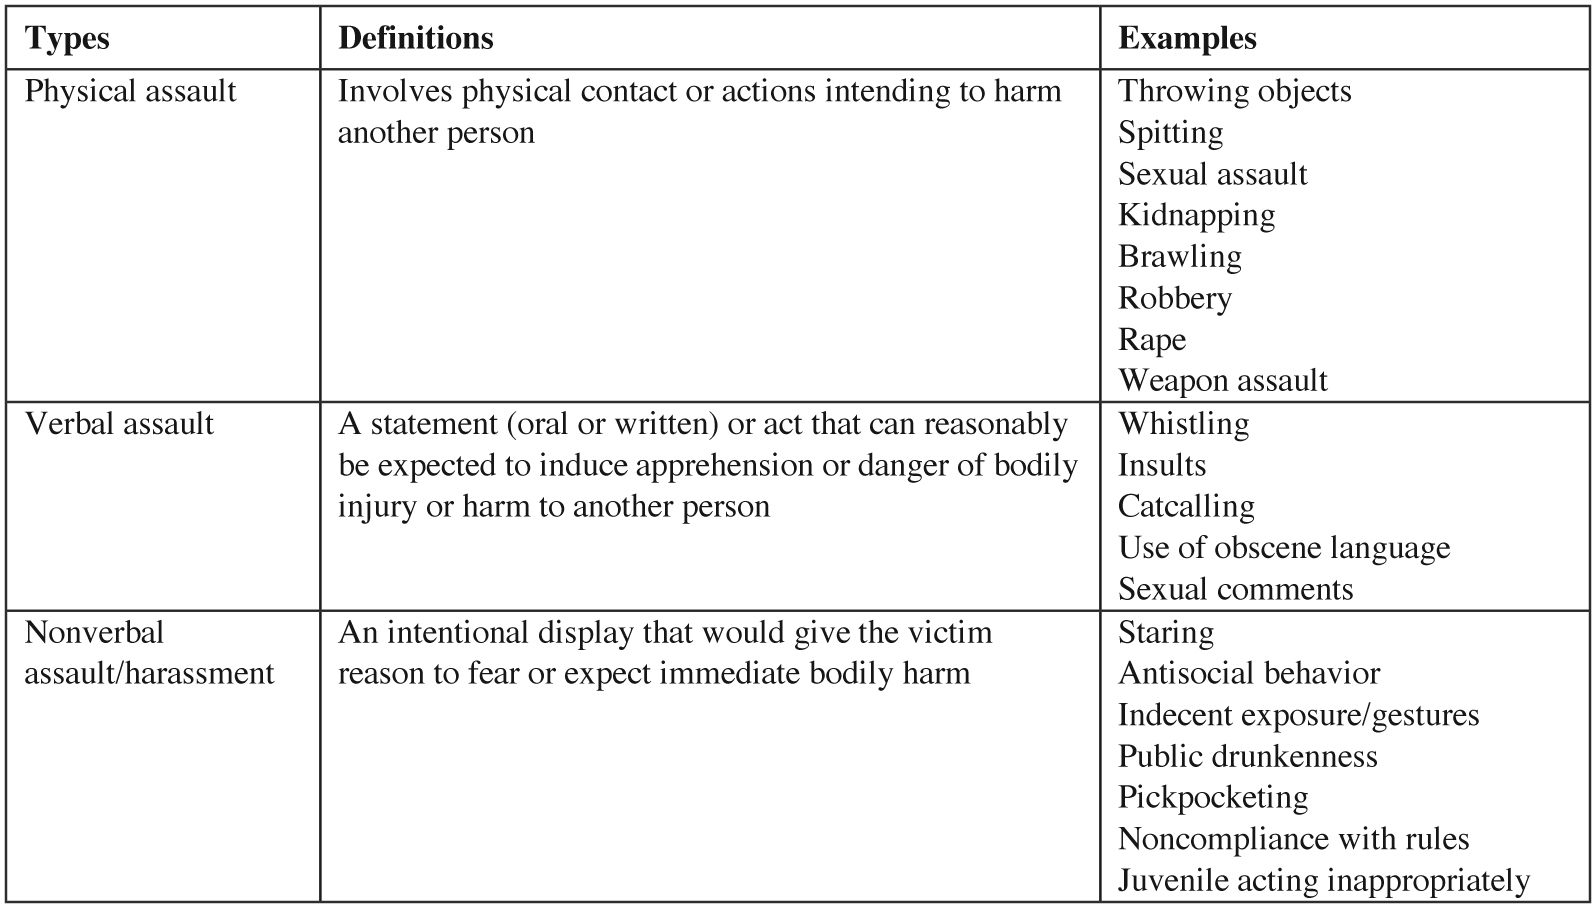
The table shows three types of transit assault in the first column from top to bottom: physical assault, verbal assault, and nonverbal assault or harassment. Each type is defined in the second column from top to bottom and includes a list of examples. Physical assault involves physical contact or actions intending to harm another person. Examples include throwing objects, spitting, sexual assault, kidnapping, brawling, robbery, rape, and weapon assault. Verbal assault is a statement, either oral or written, that can reasonably be expected to cause fear or danger of bodily injury or harm to another person. Examples are whistling, insults, catcalling, use of obscene language, and sexual comments. Nonverbal assault or harassment is an intentional display that would give the victim reason to fear or expect immediate bodily harm. Examples include staring, antisocial behavior, indecent exposure or gestures, public drunkenness, pickpocketing, noncompliance with rules, and juvenile acting inappropriately.
Long Description.
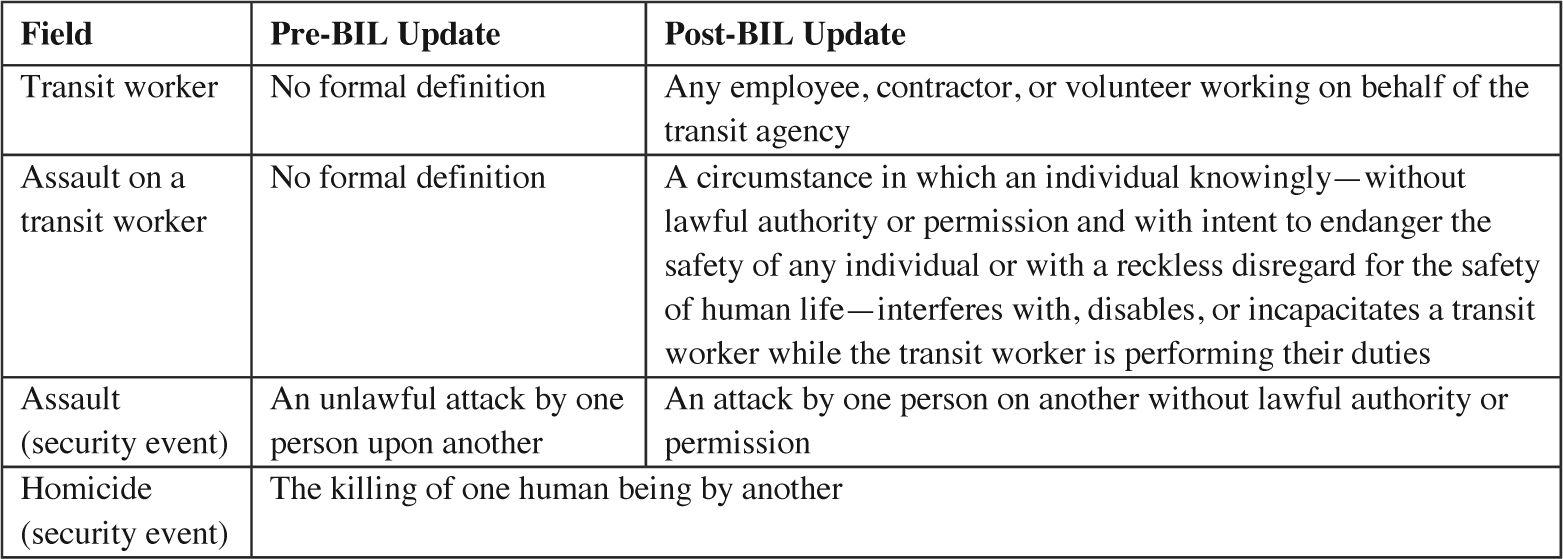
The table compares definitions of selected fields before and after the BIL update. The first field is a transit worker. Before the update, there was no formal definition. After the update, it includes any employee, contractor, or volunteer working on behalf of the transit agency. The second field is assault on a transit worker. Before the update, it had no formal definition. After the update, it is defined as a circumstance in which an individual knowingly, without lawful authority or permission and with intent to endanger the safety of any individual or with a reckless disregard for the safety of human life, interferes with, disables, or incapacitates a transit worker while the transit worker is performing their duties. The third field is assault, listed as a security event. Before the update, it was defined as an unlawful attack by one person upon another. After the update, it is defined as an attack by one person on another without lawful authority or permission. The fourth field is homicide, also listed as a security event. It is defined as the killing of one human being by another. There is no change shown in the definition before and after the update.
Temporal Patterns
Figure 1 reflects the total number of transit assault events and associated unlinked passenger trips (UPTs) reported to the NTD from 2014 to 2023 (4). A UPT refers to the number of times a passenger boards a public transportation vehicle. Overall, an upward trend in the absolute number of transit assault events was observed, peaking in 2019. The absolute number of transit assault events decreased in 2020 during the COVID-19 outbreak, which resulted in a significant drop in transit ridership. The number of assault events increased again in 2021. Notably, the number of assault events peaked in 2023, although the corresponding UPTs reported by those same agencies did not reach pre-pandemic levels.
Transit assaults and safety perceptions vary based on the day of the week and the time of day. Transit assaults are more frequent on weekends, and this is likely due to reduced surveillance, fewer patrols, and less frequent transit service. Similarly, customers perceive transit environments as less safe on weekends because of lower rider density, increased wait times, and reduced transit activity. With the lower number of riders, the assault rate on a per rider basis is even more concerning.
CHAPTER 1
Background and Introduction
Transit security is a complex issue that threatens the sustainability of public transportation. Concerns about transit assaults and perceived safety play an important role in transit use and ridership. Research shows that if people felt more secure when traveling and waiting at railway stations the ridership could increase by 10 percent (1). Transit security also poses challenges for transit workers, exposing them to risks of physical and psychological harm and contributing to elevated job-related stress (2). Addressing these issues is essential to fostering a secure and sustainable transit environment for both users and employees.
Definition of Key Terms
The term transit assault refers to unlawful and harmful behaviors directed at individuals, such as transit riders or workers, within transit environments. These behaviors may include physical attacks; verbal threats or harassment; and nonverbal acts intended to cause harm, fear, or distress. Table 1 defines these three types of transit assaults and provides example behaviors. Transit assaults can disrupt the safety and security of transit systems, impacting both individuals and the operation of public transportation.
The Bipartisan Infrastructure Law (BIL), enacted in November 2021, updated several key terms related to assault in the transit environment. Table 2 summarizes the key terms and definitions before and after this law was enacted (3).
Facts About Transit Assault
Transit assault data were obtained from the National Transit Database (NTD). During the past several years, the FTA has changed the requirements for reporting assaults. More assault and victim categories have been added, making the data more robust. With these additional categories, the FTA and others can take a more targeted approach to address assaults depending on the concerns or patterns that exist. This project focused on other transit workers (not transit operators). In select instances, however, the mention of transit workers includes all categories of workers, including operators and nonoperators.
One NTD limitation is that it does not include assaults that occurred at bus stops because bus stops are typically not owned by the transit agency. Instead, bus stops are owned by the roadway authority (i.e., the city, county, or state roadway agency that owns and maintains the roadway right-of-way). A customer using transit likely views the bus stop as an integral part of their complete journey; thus, a customerʼs perceptions about security or fear of assault likely includes the bus stop and the route taken to reach it (first mile/last mile).
The guide also addresses actions to be taken following an assault, including incident reporting, support for victims, documentation, and the use of data-driven approaches to improve response and prevention.
In addition to the guide, the research team developed an interactive matrix of countermeasures and a social media toolkit. The interactive matrix of countermeasures enables agencies to select mitigation strategies tailored to their specific operational contexts and challenges. The social media toolkit provides templates, images, and messaging strategies to help agencies raise public awareness and promote transit safety. Both items can be found on the National Academies Press catalog page for TCRP Research Report 258: Mitigation Strategies for Deterring Transit Assaults (https://doi.org/10.17226/29204) under “Resources at a Glance.”
By consolidating best practices, data insights, and the perspectives of interested parties, this guide serves as a practical resource for transit agencies of all sizes. It empowers agencies to adopt proactive and tailored strategies, implement effective security measures, and foster a safer and more secure transit environment for all users.


