Mitigation Strategies for Deterring Transit Assaults (2025)
Chapter: 2 Assaults on Passengers and Transit Workers - What the Data Show

CHAPTER 2
Assaults on Passengers and Transit Workers—What the Data Show
The NTD contains two forms for reporting incidents related to transit security: the Major (S&S-40) and Nonmajor (S&S-50) Summary Report Forms (27). Reportable incidents must occur on transit right-of-way or infrastructure, at a transit revenue facility or maintenance facility, during a transit-related maintenance activity, or involve a transit revenue vehicle. As noted earlier, agencies can exclude incidents occurring at bus stops or shelters that are not located on transit-owned property, unless the incident involves boarding or exiting a transit vehicle; or the event occurs off transit property but results in individuals coming to rest on transit property afterward. Thus, the analysis results presented here do not consider assaults occurring at bus stops or shelters.
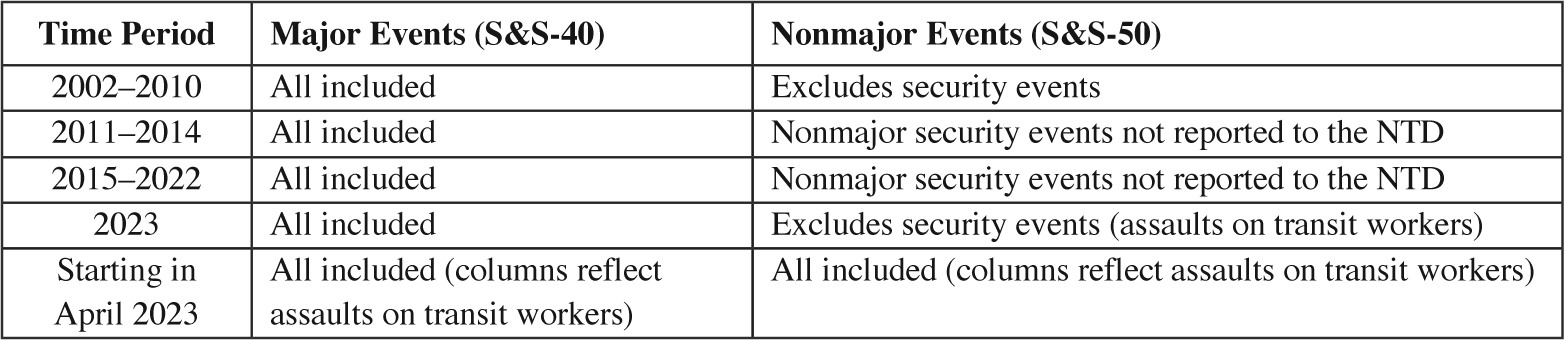
As shown in Table 4, the NTD reporting requirements have changed over time (28). In 2002, security events were no longer reported via the S&S-50. In 2023, the NTD expanded reporting requirements for assaults on transit workers; the new requirements apply to full, reduced, tribal, and rural transit workers. Since April 2023, all assaults on transit workers—major or nonmajor—are reported to the NTD. Thus, the NTD data from April 2023 to present provides a basic understanding of assaults on riders and workers separately. This analysis capitalized on that distinction, showing information about assaults on riders and workers separately.
Overview
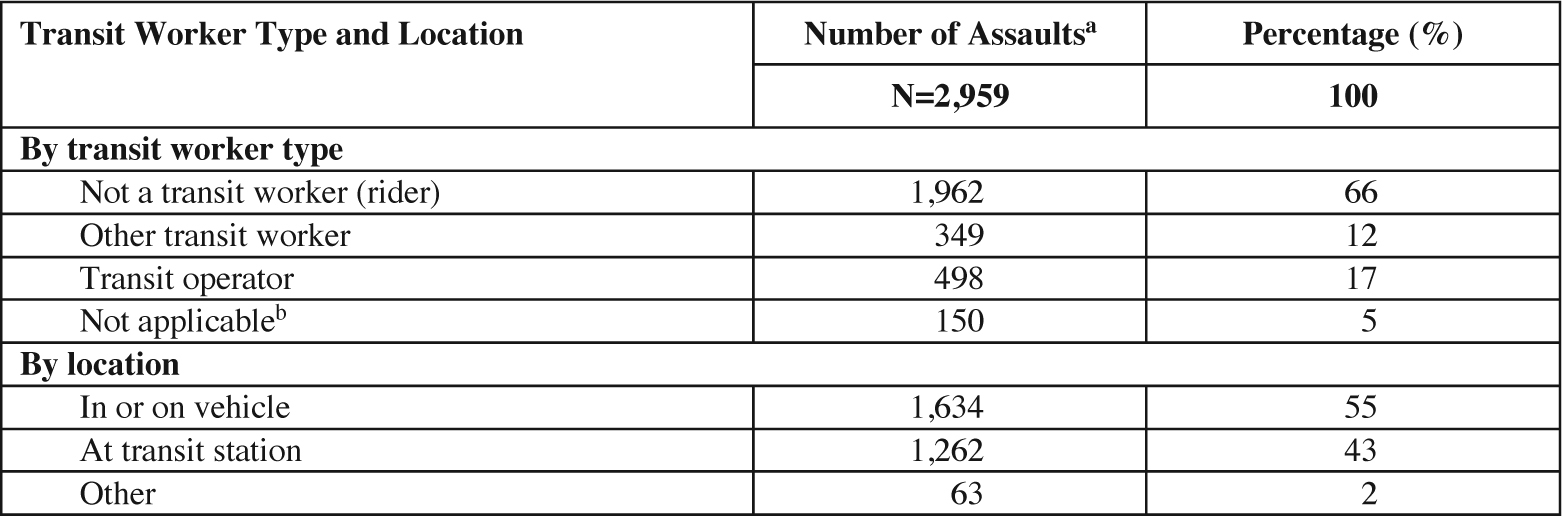
Between April 2023 and June 2024, 106 transit agencies reported 2,959 major security events on transit-owned property (Table 5). Among those incidents, 66 percent involved riders, 17 percent involved transit operators, and 12 percent involved other transit workers. Additionally, 5 percent of the incidents were classified as Not Applicable with victims not specified. The majority of assaults occurred in or on transit vehicles (55 percent) and transit stations (43 percent), with a smaller proportion occurring in other areas (2 percent).
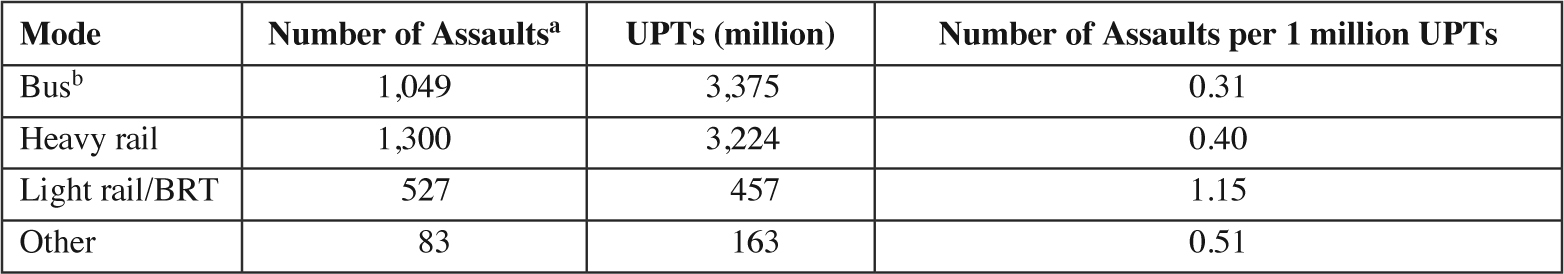
Table 6 compares the number of assaults across different transit modes and lists their frequency relative to UPTs. Bus services (in or on vehicles) experienced 1,049 assaults, equating to a low 0.31 assaults per 1 million UPTs. Heavy rail (transit revenue facilities) experienced 1,300 assaults, equating to a slightly higher 0.40 assaults per 1 million UPTs. Light rail/bus rapid transit (BRT) had fewer assaults (527) but the highest assault rate, equating to 1.15 assaults per 1 million UPTs. Other modes reported 83 assaults, equating to 0.51 assaults per 1 million UPTs. Overall, light rail/BRT experienced the highest assault rate relative to passenger volume.
Temporal Patterns
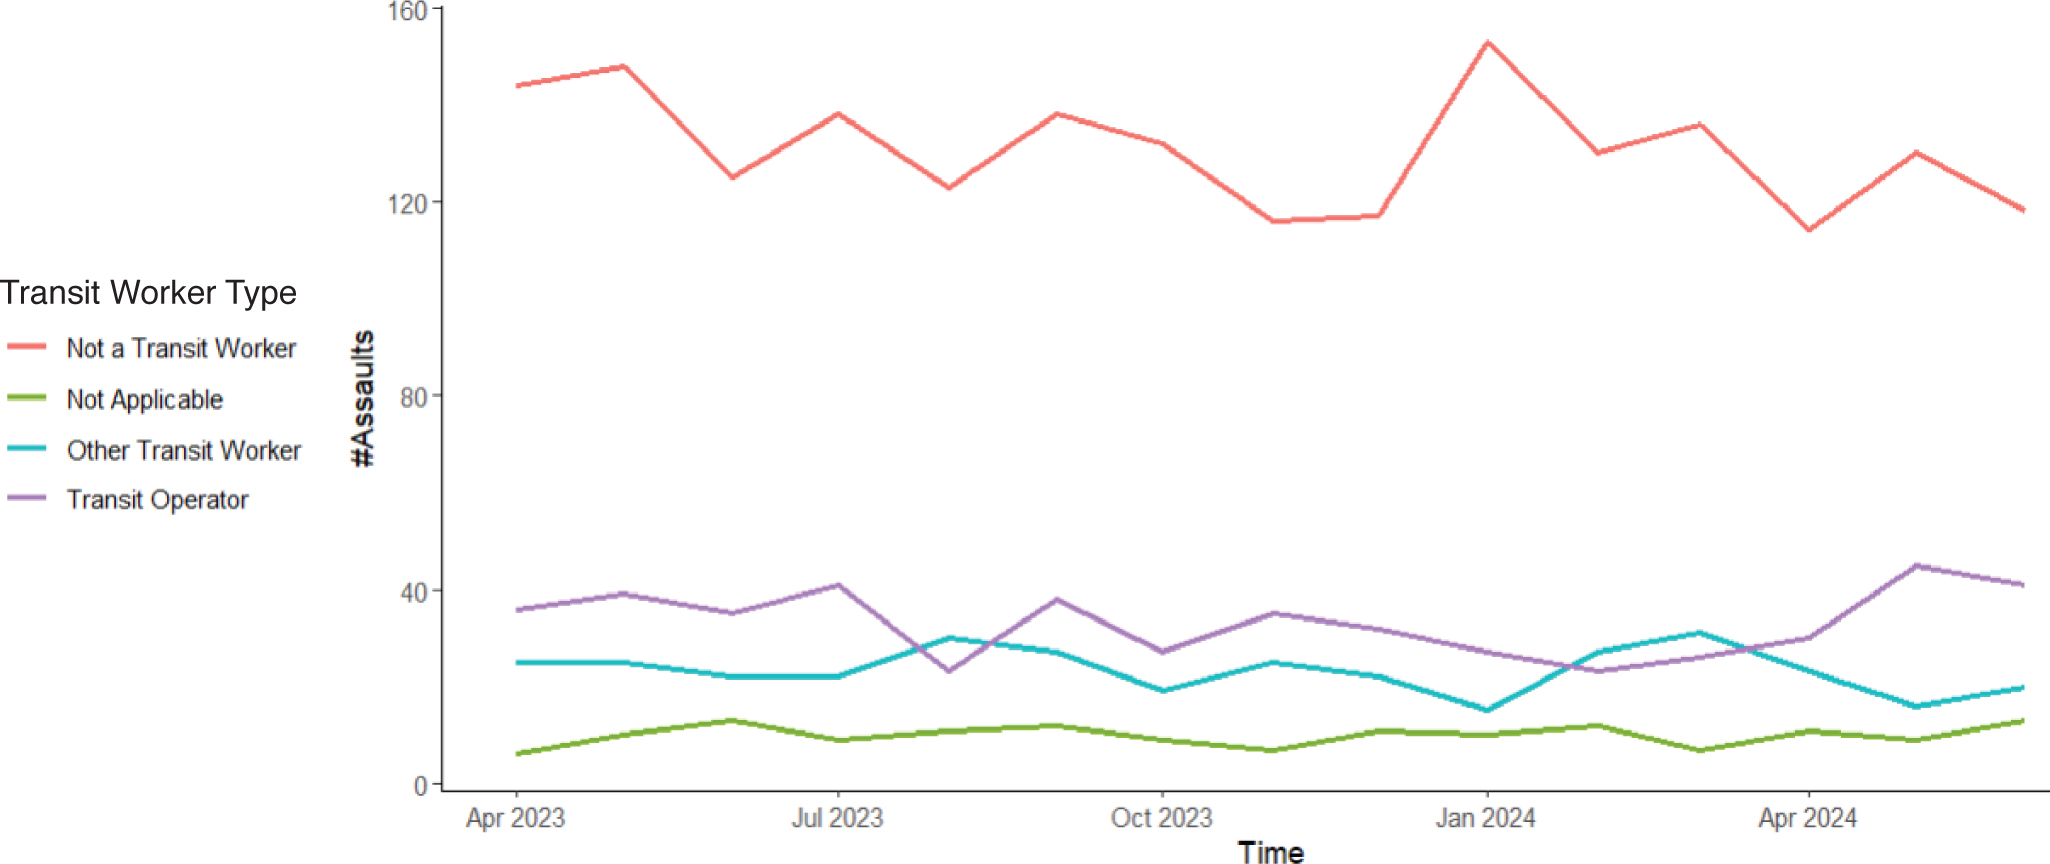
The number of assaults on riders has fluctuated since April 2023, ranging from a high of more than 160 assaults per month in early 2023 to a low of less than 120 assaults per month in October 2023. Figure 2 shows the number of transit assaults by month. After the dip in late 2023,
Long Description.
The table shows time periods and how major events and nonmajor events were handled in reporting from 2002 to April 2023. From 2002 to 2010, all major events were included and nonmajor events were excluded security events. From 2011 to 2014 and from 2015 to 2022, all major events were included but nonmajor security events not reported to the NTD were excluded. In 2023, all major events were included and nonmajor events excluded security events, including assaults on transit workers. Starting in April 2023, all major and all nonmajor events were included, and both columns reflected assaults on transit workers.
aMajor security event data (S&S-40) from April 2023 to June 2024 (27).
bVictims are not specified.
Long Description.
The table shows data for 2,959 assaults categorized by transit worker type and location. By transit worker type, 1962 assaults involved individuals who were not transit workers or were riders, accounting for 66 percent. There were 349 assaults on other transit workers, which is 12 percent. Transit operators experienced 498 assaults, making up 17 percent. There were 150 cases marked not applicable, which is 5 percent. By location, 1,634 assaults happened in or on a vehicle, which is 55 percent. At transit stations, there were 1,262 assaults, representing 43 percent. Other locations had 63 assaults, which is 2 percent. Each row lists the number of assaults and the corresponding percentage.
aMajor security event data (S&S-40) from April 2023 to June 2024 (27).
bAssaults at bus stops or shelters are not included.
Long Description.
The table shows the number of transit assaults by mode of transportation, along with unlinked passenger trips in millions and the rate of assaults per 1 million unlinked passenger trips. For buses, there are 1,049 assaults, 3,375 million unlinked passenger trips, and 0.31 assaults per million trips. Heavy rail has 1,300 assaults, 3,224 million unlinked passenger trips, and 0.40 assaults per million trips. Light rail or bus rapid transit has 527 assaults, 457 million unlinked passenger trips, and 1.15 assaults per million trips. Other modes report 83 assaults, 163 million unlinked passenger trips, and 0.51 assaults per million trips. The highest assault rate per million trips is seen in light rail or bus rapid transit.
Source: Major security event data (S&S-40) from April 2023 to June 2024 (27).
Long Description.
The chart shows the number of transit assaults by month for four types of people from April 2023 to May 2024. The vertical axis shows the number of assaults, and the horizontal axis shows time by month. The category of non-transit workers has the highest number of assaults each month, ranging from around 120 to 160. The category of other transit workers stays below 50 assaults each month, with small changes. The category of transit operator also remains below 50 and has fewer ups and downs. The category of not applicable has the lowest number of assaults each month, mostly between 10 and 20. Each line represents one type and shows monthly changes in the number of reported assaults.
assaults increased and then fluctuated in early 2024, with values stabilizing at around 120 to 140 assaults per month. Transit assaults experienced by transit operators and other workers were relatively stable during this period with occasional small increases.
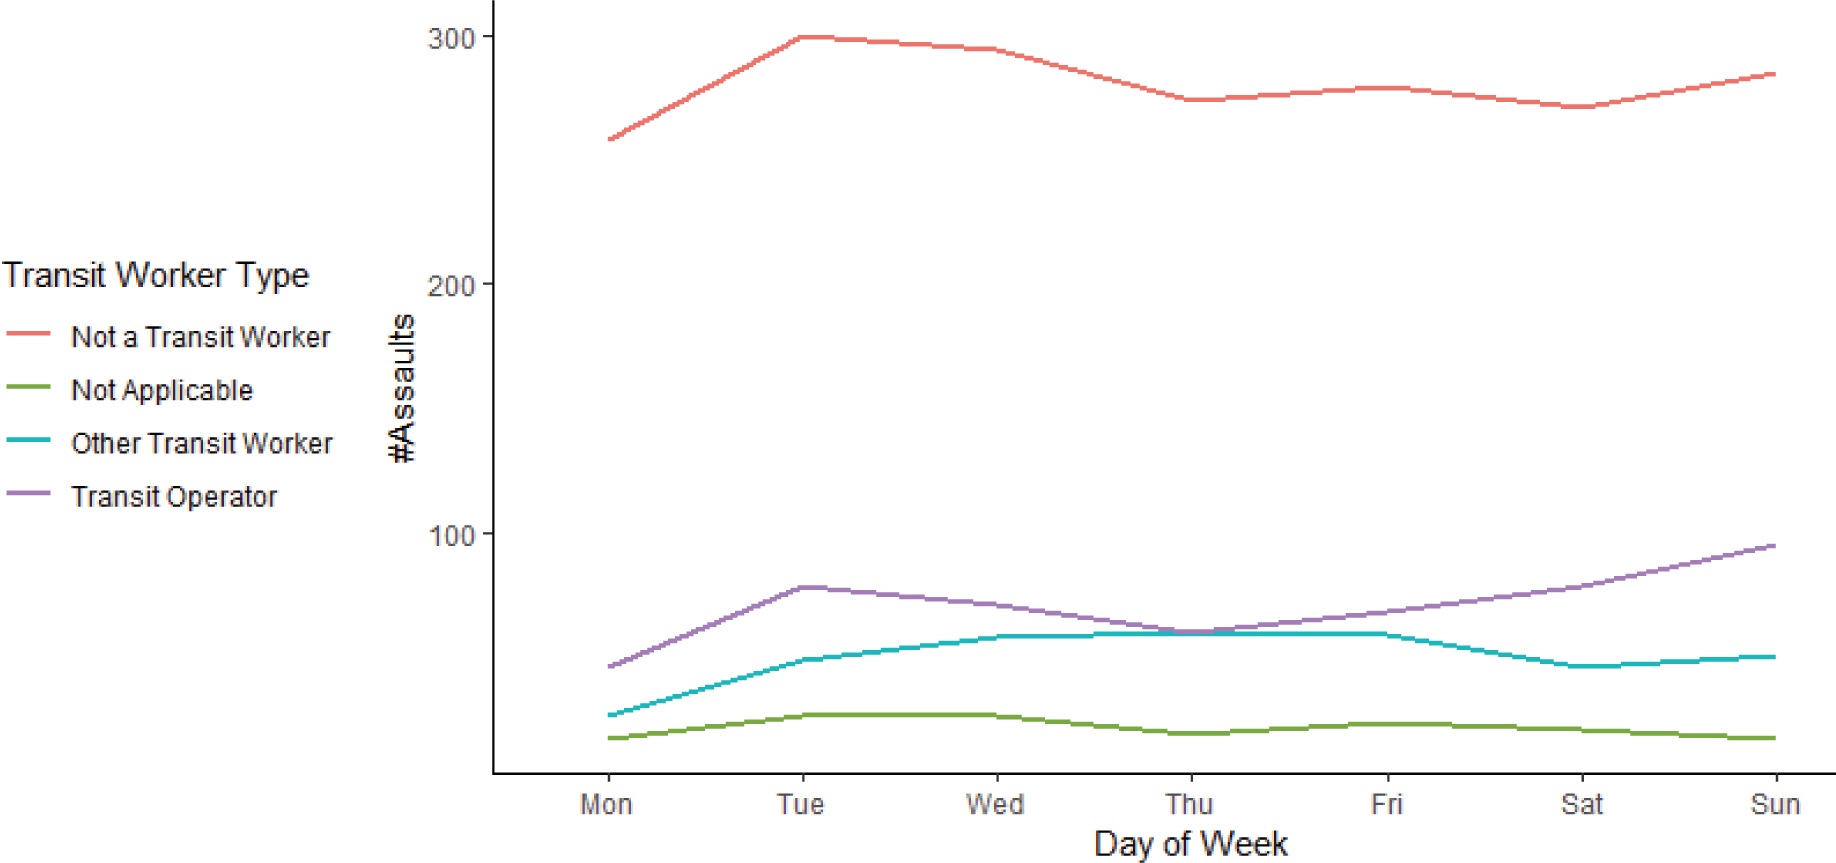
Figure 3 shows the number of transit assaults by day of the week. Assaults on riders were the most frequent, consistently remaining above 250 assaults per day and peaking close to 300 assaults per day during the middle of the week. Assaults on transit operators fluctuated between 80 to 100 incidents per day, showing a slight increase toward the end of the week. Assaults on other transit workers remained relatively stable, ranging from 50 to 60 assaults per day.
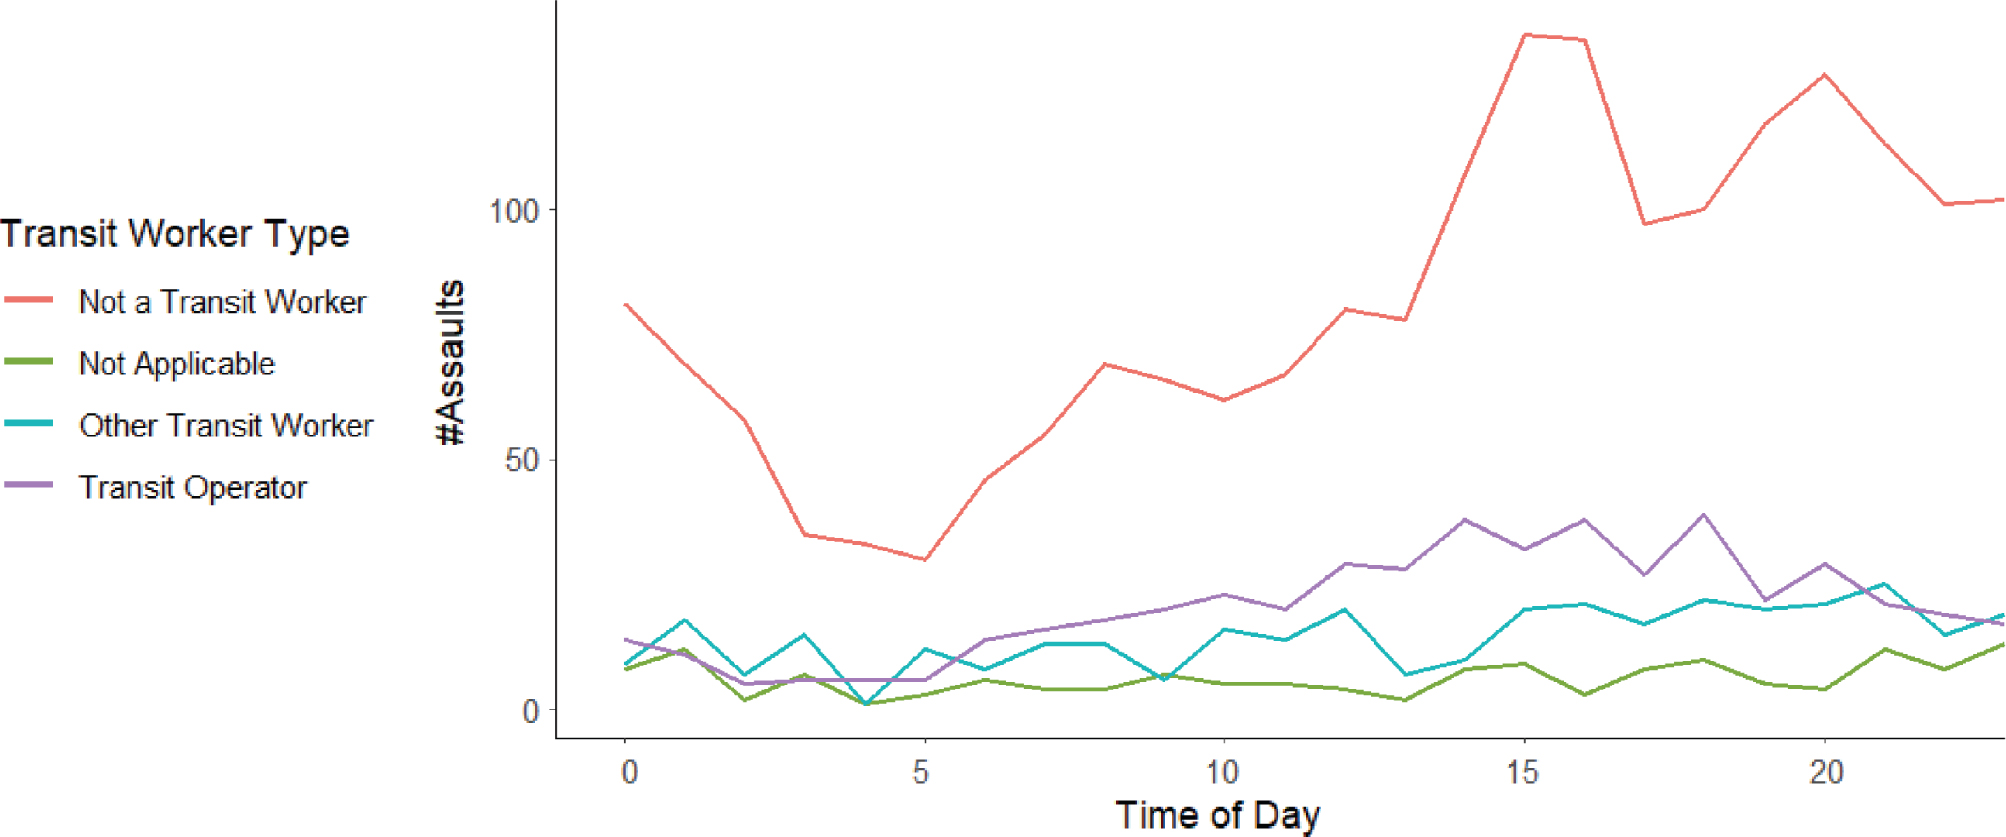
Figure 4 shows the time-of-day pattern. Assaults on riders followed a distinct pattern, peaking initially at midnight with over 100 incidents per hour, decreasing in the early morning, increasing
Source: Major security event data (S&S-40) from April 2023 to June 2024 (27).
Long Description.
The chart shows the number of transit assaults by day of the week for four categories of people. The vertical axis shows the number of assaults. The horizontal axis lists days from Monday to Sunday. The type of not a transit worker shows the highest number of assaults across all days, with a peak near 300 on Tuesday and slight dips midweek. The type of transit operator shows the next highest levels, increasing from Monday and peaking on Sunday. The type of other transit worker stays below 100 throughout the week, with a small rise around Wednesday and Friday. The type of not applicable has the fewest assaults across all days, staying lowest and showing a gentle curve with a small midweek drop. Each type shows different patterns in assault frequency based on the day.
Source: Major security event data (S&S-40) from April 2023 to June 2024 (27).
Long Description.
The chart shows the number of transit assaults by time of day for four types of people. The vertical axis shows the number of assaults. The horizontal axis shows hours from 0 to 23. The type of not a transit worker shows the highest number of assaults throughout the day, with a low point around 5 and peaks between 15 and 21 hours. The type of transit operator shows a steady rise from early morning and maintains a middle range with small fluctuations between 10 and 20 assaults per hour. The type of other transit worker stays below 25 and has more variation between hours, with no clear peak. The type of not applicable shows the lowest number of assaults each hour, mostly under 15, with small increases after 15 hours. Each line traces how assault counts change hour by hour for each group.
sharply in the late afternoon with a secondary peak around 3 p.m., and fluctuating in the evening with between 75 and 125 assaults per hour. Assaults on transit operators fluctuated between 25 and 50 assaults per hour, steadily rising throughout the day and peaking in the late afternoon and evening. Assaults on other transit workers followed a similar time-of-day pattern as the assaults on transit operators, with assaults fluctuating between 25 and 40 incidents per hour.
Variations by Location, Mode, and Agency Size
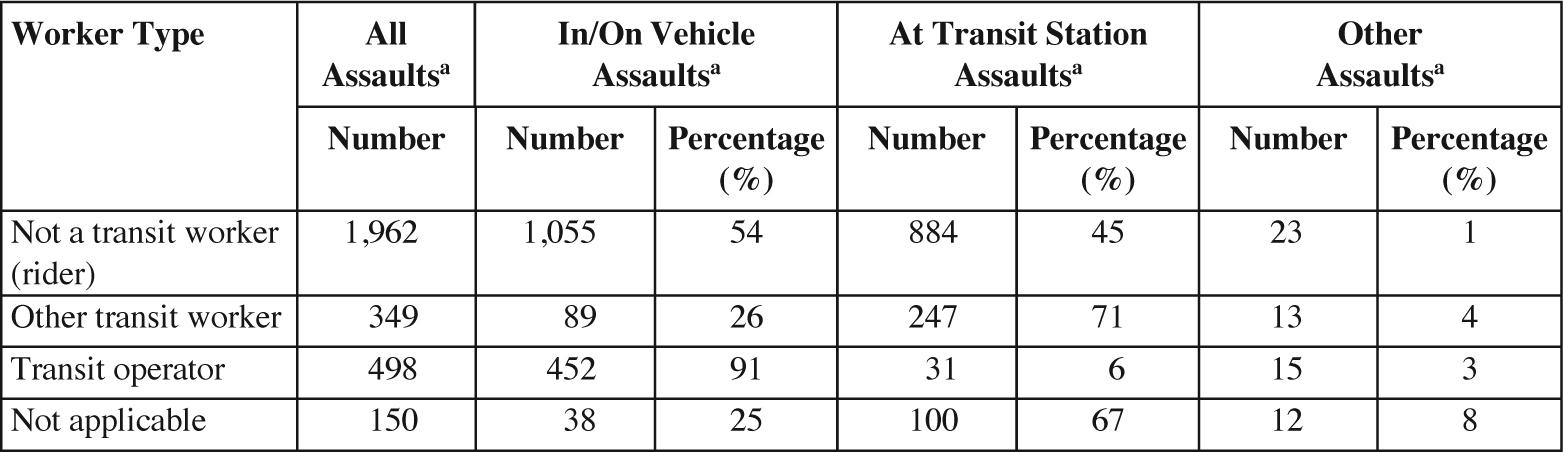
Table 7 highlights the distribution of assaults across different transit worker types and locations. Among riders, the majority of assaults (54 percent) occurred in or on vehicles, with 45 percent of assaults happening at transit stations and 1 percent of assaults occurring in other locations. For other transit workers, most assaults (71 percent) were concentrated in transit stations, with fewer incidents occurring in vehicles (26 percent) and in other areas (4 percent). Not surprisingly, transit operators were predominantly assaulted in or on their vehicles, accounting for 91 percent of incidents, while only 6 percent of assaults occurred at transit stations and 3 percent of assaults occurred at other locations. These findings suggest that transit stations are particularly risky for nonoperator workers and riders, while operators are more vulnerable in vehicles.
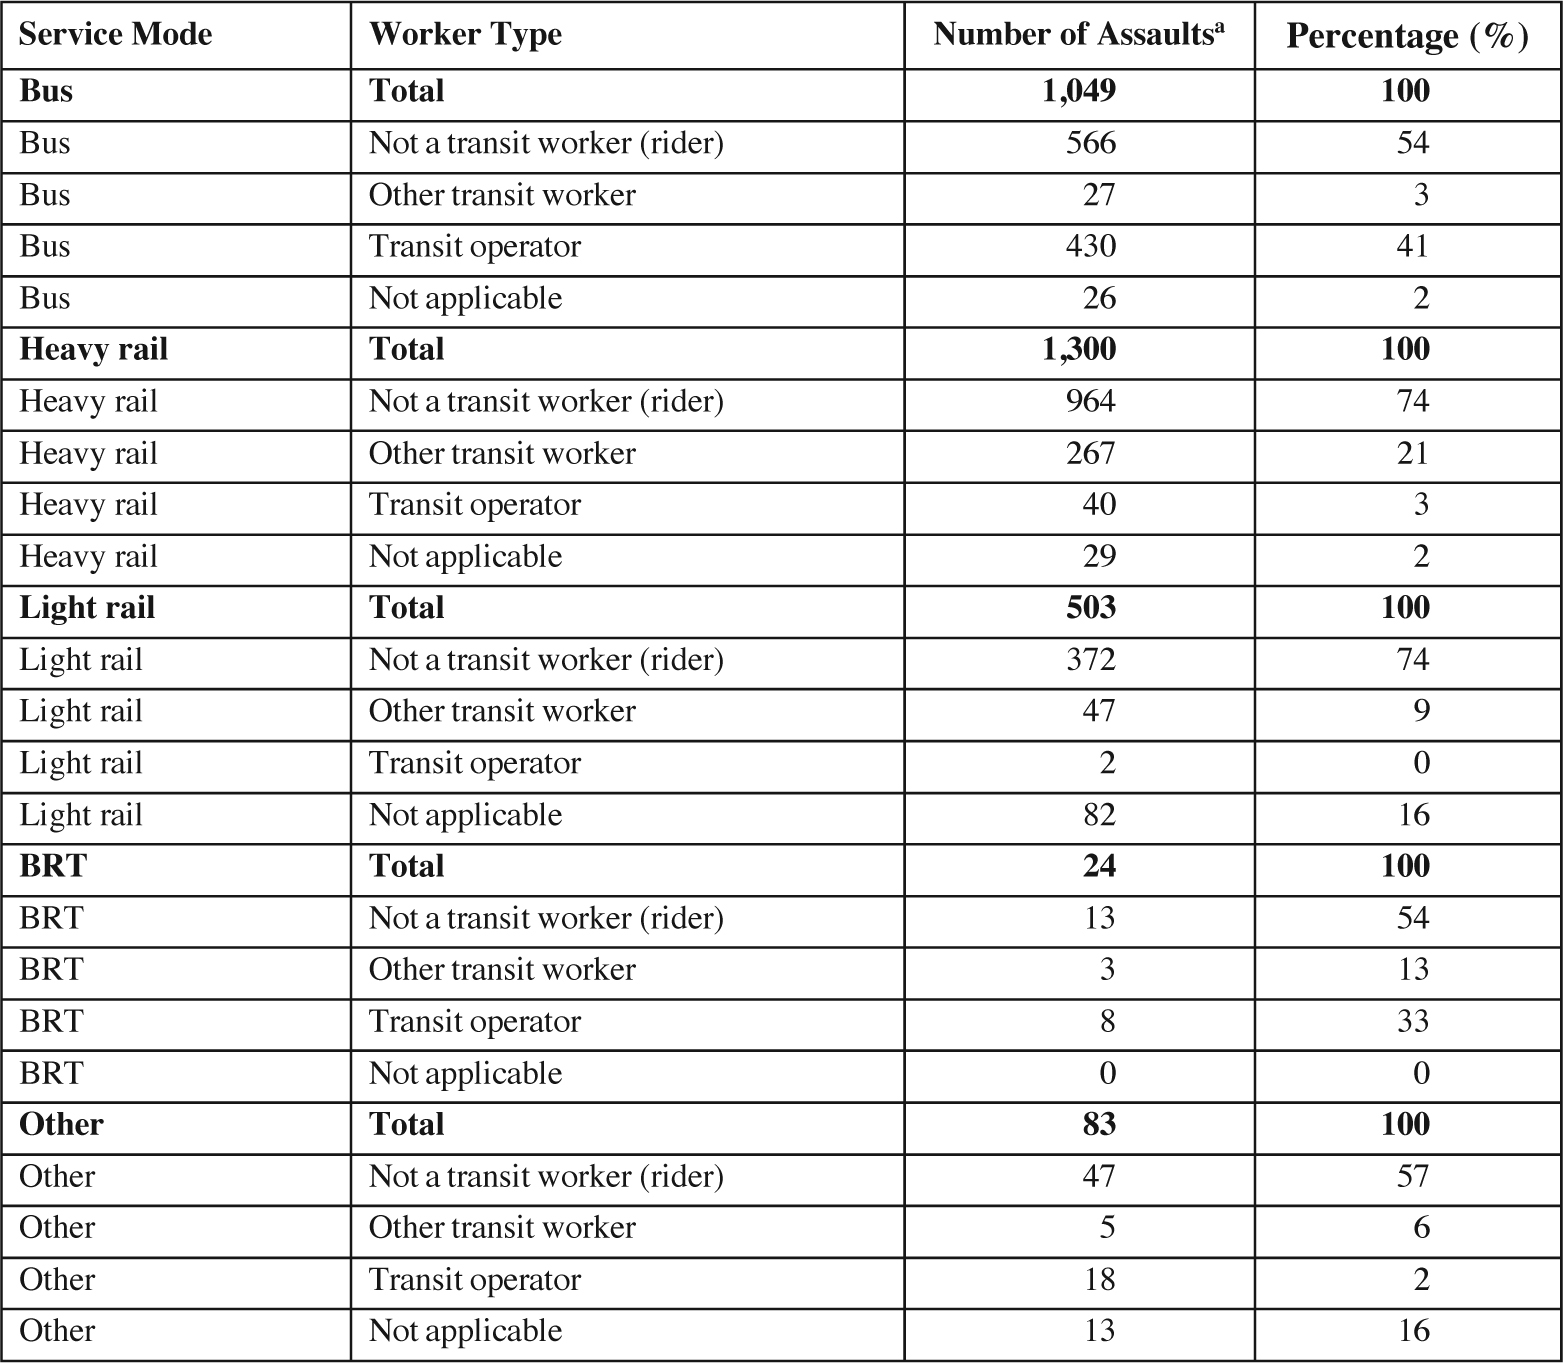
Table 8 highlights the distribution of assaults across person types and modes. Riders were most frequently involved in assaults across all transit modes but especially on rail services (both heavy and light). Riders were involved in 74 percent of assaults occurring on heavy rail and 74 percent of assaults occurring on light rail. Of the 1,049 total assaults that occurred on buses, 54 percent involved riders, and 41 percent involved transit operators. Other transit workers (not operators) were mostly involved in assaults on heavy rail systems.
Safety and Security Nonmajor Data
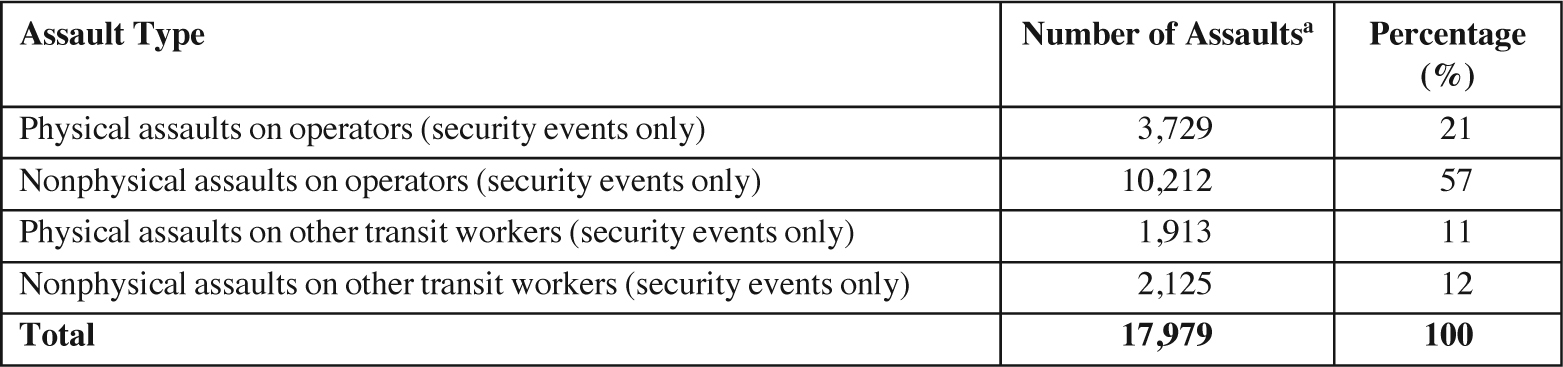
Nonmajor security incidents are aggregated by month when each agency reports them to the NTD. Table 9 summarizes the types of nonmajor assaults on transit workers reported by 285 agencies between April 2023 and June 2024. During this period, 17,979 security-related assault events were reported, with nonphysical assaults on operators being the most common type of incident.
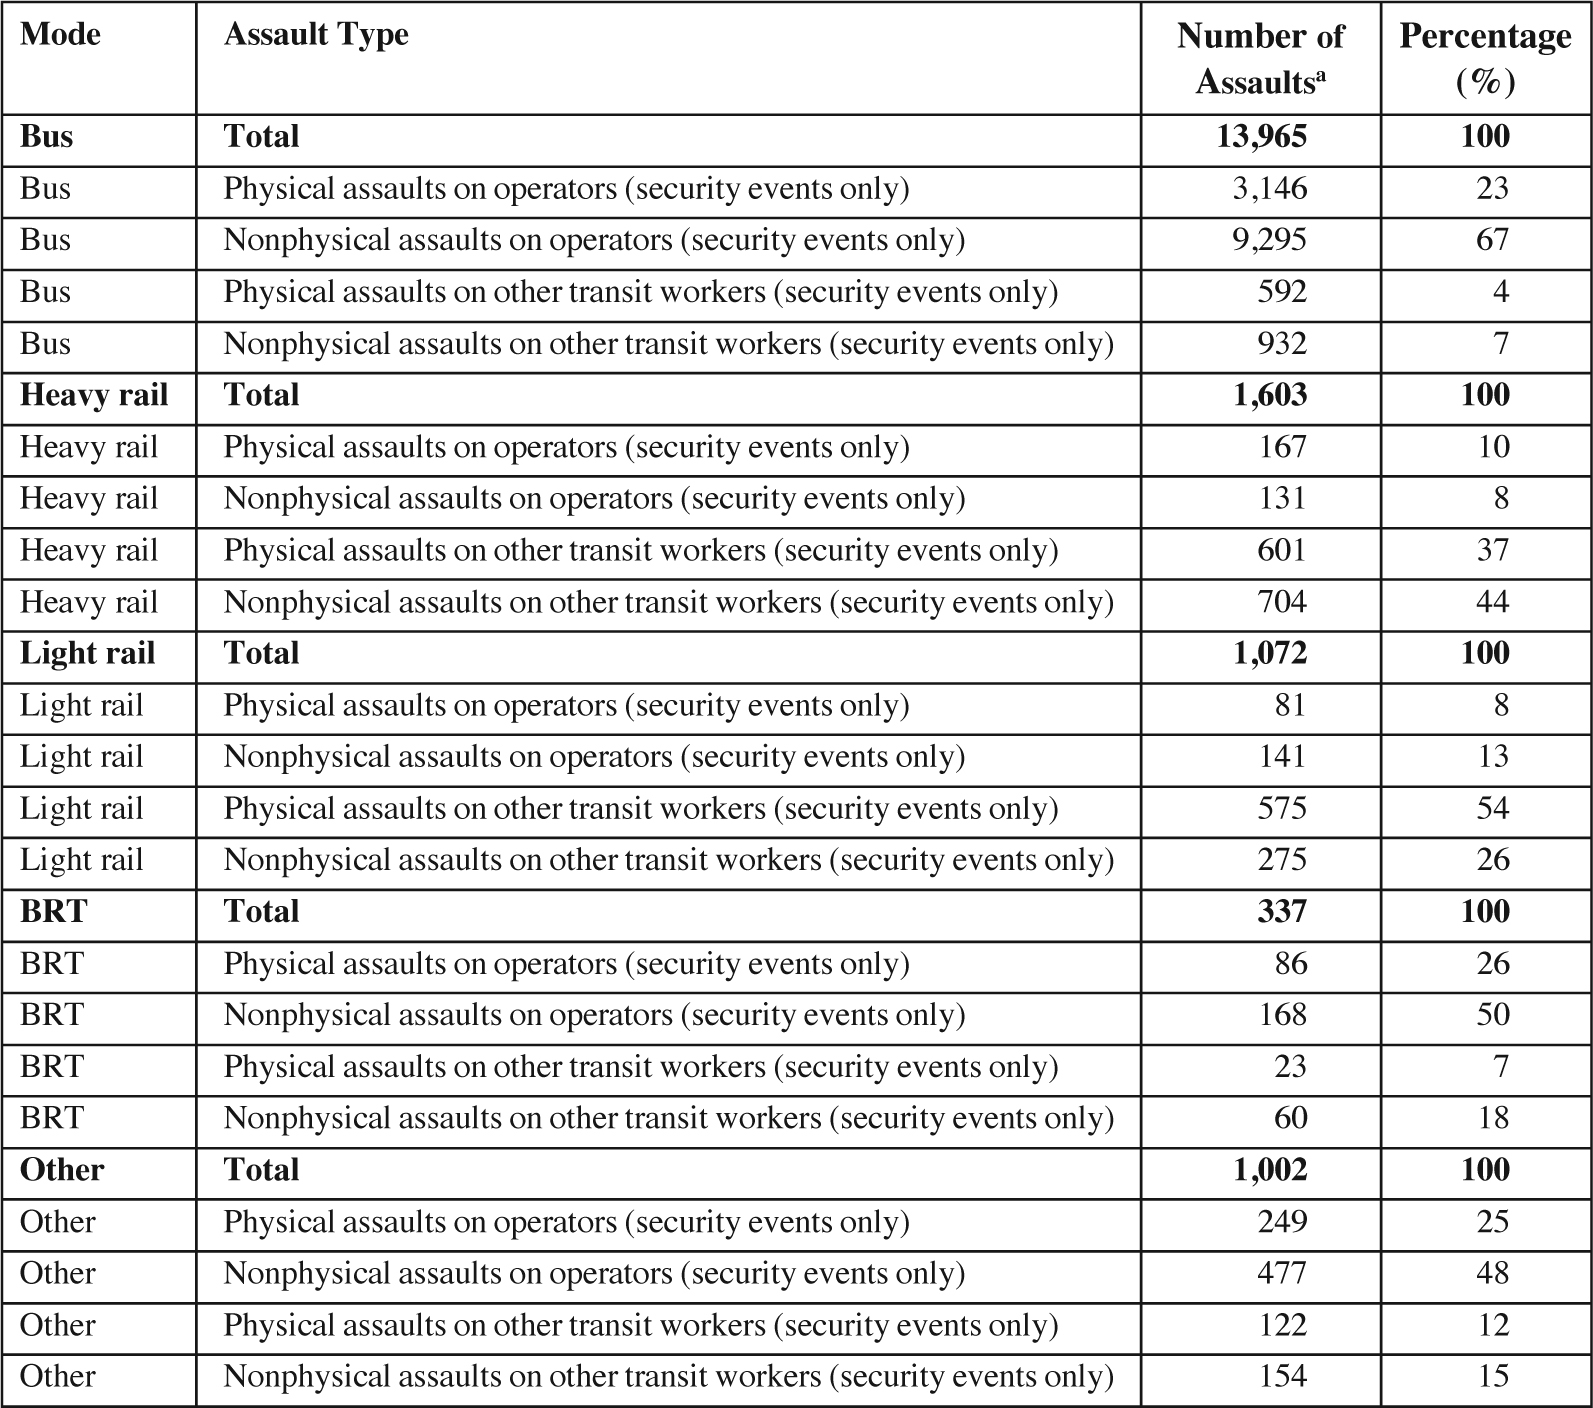
Table 10 summarizes the number of nonmajor transit assaults by mode. Bus services experienced the highest percentage of both physical (23 percent) and nonphysical (67 percent) assaults on operators, while heavy rail and light rail showed higher proportions of assaults on other transit workers. Of the 1,603 total events that occurred on heavy rail, 10 percent involved physical assaults
aMajor security event data (S&S-40) from April 2023 to June 2024 (27).
Long Description.
The table shows transit assaults for passengers and different worker types by total number and by location. It has columns for total assaults, assaults in or on a vehicle, assaults at a transit station, and other assaults, each with number and percentage. For people not identified as transit workers, there are 1,962 total assaults. Of these, 1,055 occurred in or on a vehicle, 884 at a transit station, and 23 in other locations. The percentages are 54, 45, and 1. For other transit workers, there are 349 total assaults. Of these, 89 occurred in or on a vehicle, 247 at a transit station, and 13 in other locations, with percentages of 26, 71, and 4. For transit operators, there are 498 total assaults. Of these, 452 occurred in or on a vehicle, 31 at a transit station, and 15 in other locations, with percentages 91, 6, and 3. For cases marked not applicable, there are 150 assaults. Of these, 38 occurred in or on a vehicle, 100 at a transit station, and 12 in other locations, with percentages 25, 67, and 8. Each row compares assault frequency and location for the listed worker type.
NOTE: Total is rounded.
aMajor security event data (S&S-40) from April 2023 to June 2024 (27).
Long Description.
The table lists the number and percentage of transit assaults by transit worker type across five service modes: bus, heavy rail, light rail, bus rapid transit, and other. Each mode includes a total followed by breakdowns for not a transit worker, other transit worker, transit operator, and not applicable. For buses, there are 1,049 assaults in total. Most involved riders with 566 assaults, followed by 430 on transit operators, 47 on other transit workers, and 13 not applicable. For heavy rail, total assaults are 1300, with 964 involving riders, 267 other transit workers, 40 transit operators, and 29 not applicable. Light rail has 527 assaults in total, with 372 on riders, 47 other transit workers, 2 on operators, and 82 not applicable. Bus rapid transit has 24 total assaults, with 13 on riders, 3 on other workers, 8 on operators, and none marked not applicable. For the other category, total assaults are 83, with 47 involving riders, 5 other transit workers, 18 operators, and 13 not applicable. Each entry includes the number of incidents and the corresponding percentage within that mode.
NOTE: Total is rounded.
aNonmajor security event data from April 2023 to June 2024 (27).
Long Description.
The table presents nonmajor transit assaults by assault type, showing the number and percentage for each category. The total number of assaults is 17,979. Physical assaults on operators account for 3,729 incidents, which is 20.7 percent. Nonphysical assaults on operators make up the largest category with 10,212 incidents, representing 56.8 percent. Physical assaults on other transit workers account for 1,913 incidents, which is 10.6 percent. Nonphysical assaults on other transit workers total 2,125, making up 11.8 percent. Each row gives the count and share of one assault type among all reported security events.
NOTE: Total is rounded.
aNonmajor security event data from April 2023 to June 2024 (27).
Long Description.
The table shows nonmajor transit assaults by mode of transport and assault type, including the number of incidents and percentage within each mode. For buses, there are 13,965 total assaults. Of these, 3,146 are physical assaults on operators, 9,295 nonphysical on operators, 592 are physical assaults on other workers, and 932 are nonphysical assaults on other workers. Heavy rail reports 1,603 assaults total, with 167 physical assaults on operators, 131 nonphysical assaults on operators, 601 physical assaults on other workers, and 704 nonphysical assaults on other workers. Light rail has 1072 assaults. with 81 physical on operators, 141 nonphysical on operators, 575 physical on other workers, and 275 nonphysical on other workers. Bus rapid transit has 337 total assaults, including 86 physical assaults on operators, 168 nonphysical assaults on operators, 23 physical assaults on other workers, and 60 nonphysical assaults on other workers. The other category shows 1,002 total assaults with 249 physical assaults on operators, 477 nonphysical assaults on operators, 122 physical assaults on other workers, and 154 nonphysical assaults on other workers. Each row includes the exact number and percentage for each assault type within its corresponding transport mode.
on operators, while 8 percent involved nonphysical assaults on operators. A significant percentage involved assaults on other transit workers, with 37 percent being physical and 44 percent being nonphysical. Of the 1,072 total events that occurred on light rail, 8 percent involved physical assaults on operators, while 13 percent involved nonphysical assaults on operators. Physical assaults on other transit workers accounted for 54 percent, while 26 percent were nonphysical assaults. Of the 337 total events that occurred on BRT, 26 percent involved physical assaults on operators, while 50 percent involved nonphysical assaults on operators. Physical assaults on other transit workers accounted for 7 percent, while 18 percent were nonphysical assaults.
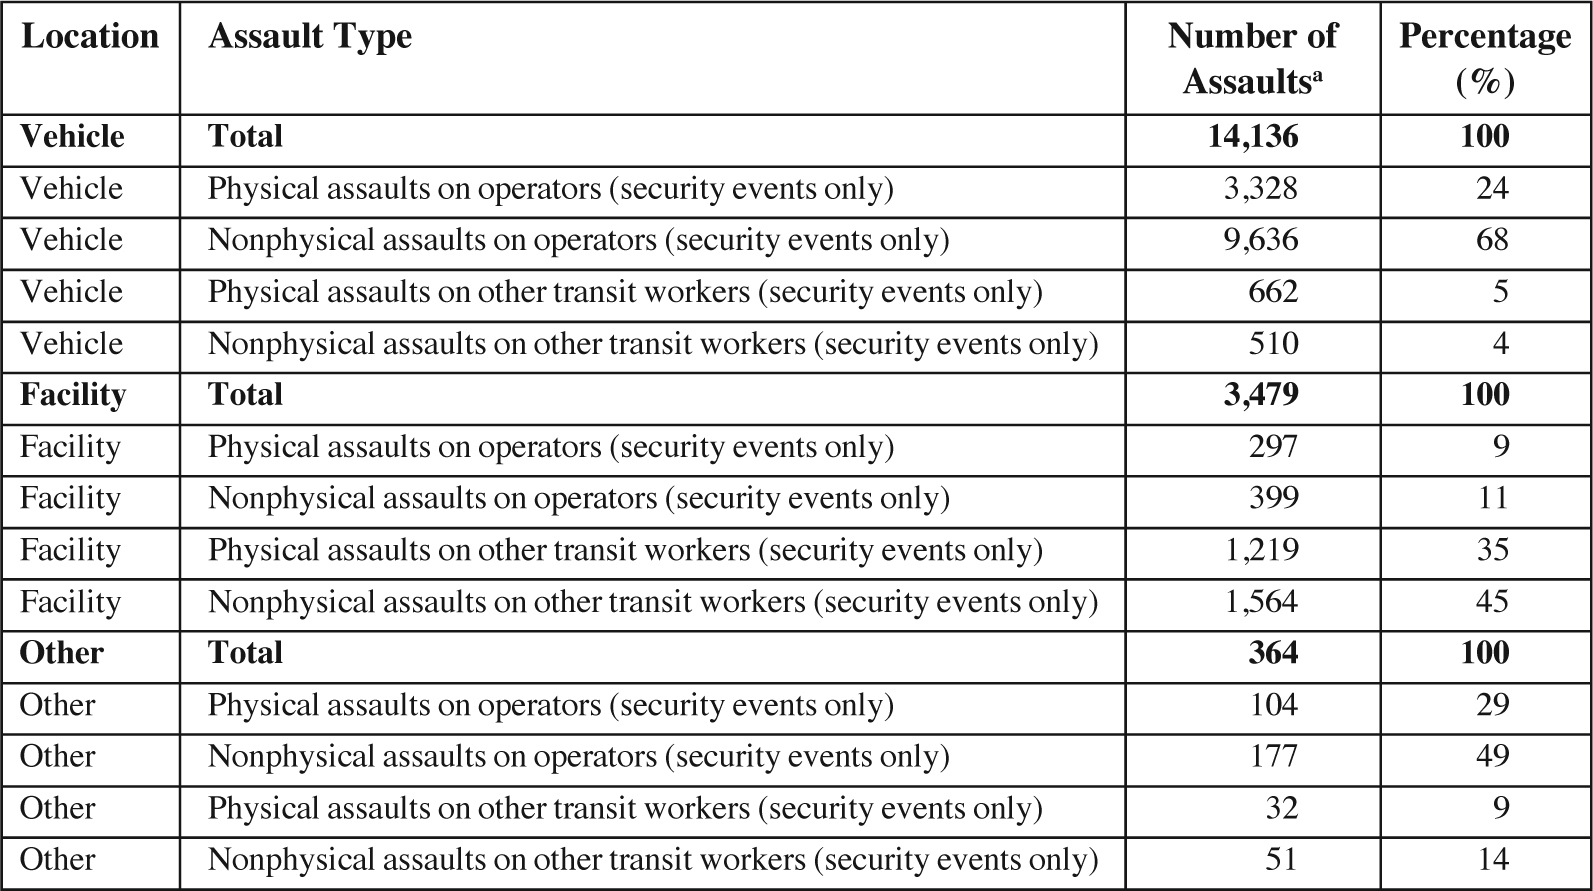
Table 11 summarizes the number of nonmajor transit assaults by location. Most assaults occurred in or on vehicles (assaults at bus stops or shelters were not reported in the data), with 68 percent of the 14,136 total incidents involving nonphysical assaults on operators and 24 percent involving physical assaults on operators. Of the 3,479 assaults occurring in facilities, the majority targeted other transit workers, with 35 percent being physical and 45 percent being nonphysical. Operators experienced fewer assaults in facilities, with only 9 percent being physical and 11 percent being nonphysical. In other locations accounting for 364 events, physical assaults on operators made up a significant proportion (29 percent), with 49 percent being nonphysical. Overall, the data suggest that operators are more likely to face assaults in vehicles, while transit workers are more frequently targeted in facilities, particularly with nonphysical assaults.
NOTE: Total is rounded.
aNonmajor security event data from April 2023 to June 2024 (27).
Long Description.
The table presents nonmajor transit assaults by location and assault type, showing the number of incidents and the percentage for each. There are three locations: vehicle, facility, and other. For vehicles, there are 14,136 total assaults. Of these, 3,328 are physical assaults on operators, 9,636 are nonphysical on operators, 662 are physical on other workers, and 510 are nonphysical on other workers. For facility, total assaults are 3,479, including 297 physical assaults on operators, 399 nonphysical assaults on operators, 1,219 physical assaults on other workers, and 1,564 nonphysical assaults on other workers. In the other category, there are 364 total assaults, including 104 physical assaults on operators, 177 nonphysical assaults on operators, 32 physical assaults on other workers, and 51 nonphysical assaults on other workers. Each row provides the assault type, number, and percentage within the specific location group.


