Measuring Impacts and Performance of State DOT Resilience Efforts: A Guide (2025)
Chapter: 1 Presenting the Big Picture

CHAPTER 1
Presenting the Big Picture
This chapter describes the need for transportation agencies and state departments of transportation (DOTs) to develop resilience performance measures (RPMs) and introduces a strategic implementation model (SIM) for selecting, measuring, and implementing the RPMs that form the foundation for this guide.
1.1 What Is the Purpose of This Guide?
Transportation agencies, including state DOTs, are responsible for maintaining and enhancing the functionality and preservation of transportation assets and mobility services. Disruptions to infrastructure due to extreme weather, including those related to natural hazard variability, have led to changes in how these agencies invest in resilience to reduce the cost of these disruptions.
The need to enhance the resilience of transportation infrastructure is both broad and specific. It is specific in the sense that each agency serves a unique community that faces their own set of asset-threat/hazard pairs. But it is broad because resilience is a crosscutting issue that spans multiple functional areas from planning to maintenance and operations, across the transportation industry. Therefore, DOTs have approached the topic in multifaceted and versatile ways, while there is ample scope for the transferability of lessons learned from one to the other.
Billions of dollars have been allocated to system and community resilience improvements under the Infrastructure Investment and Jobs Act (IIJA), with dedicated funds like the Promoting Resilient Operations for Transformative, Efficient, and Cost-saving Transportation (PROTECT) program intended for resilience planning activities and infrastructure improvements. Increased investment in resilience puts additional focus on state DOTs to evaluate their efforts and demonstrate progress toward improving the resilience of the transportation system.
This guide seeks to assist transportation practitioners in evaluating the effectiveness of policies, programs, projects, and other resilience strategies that agencies invest in or create. It does this through the selection, development, and implementation of resilience performance measures (RPMs).
Long Description.
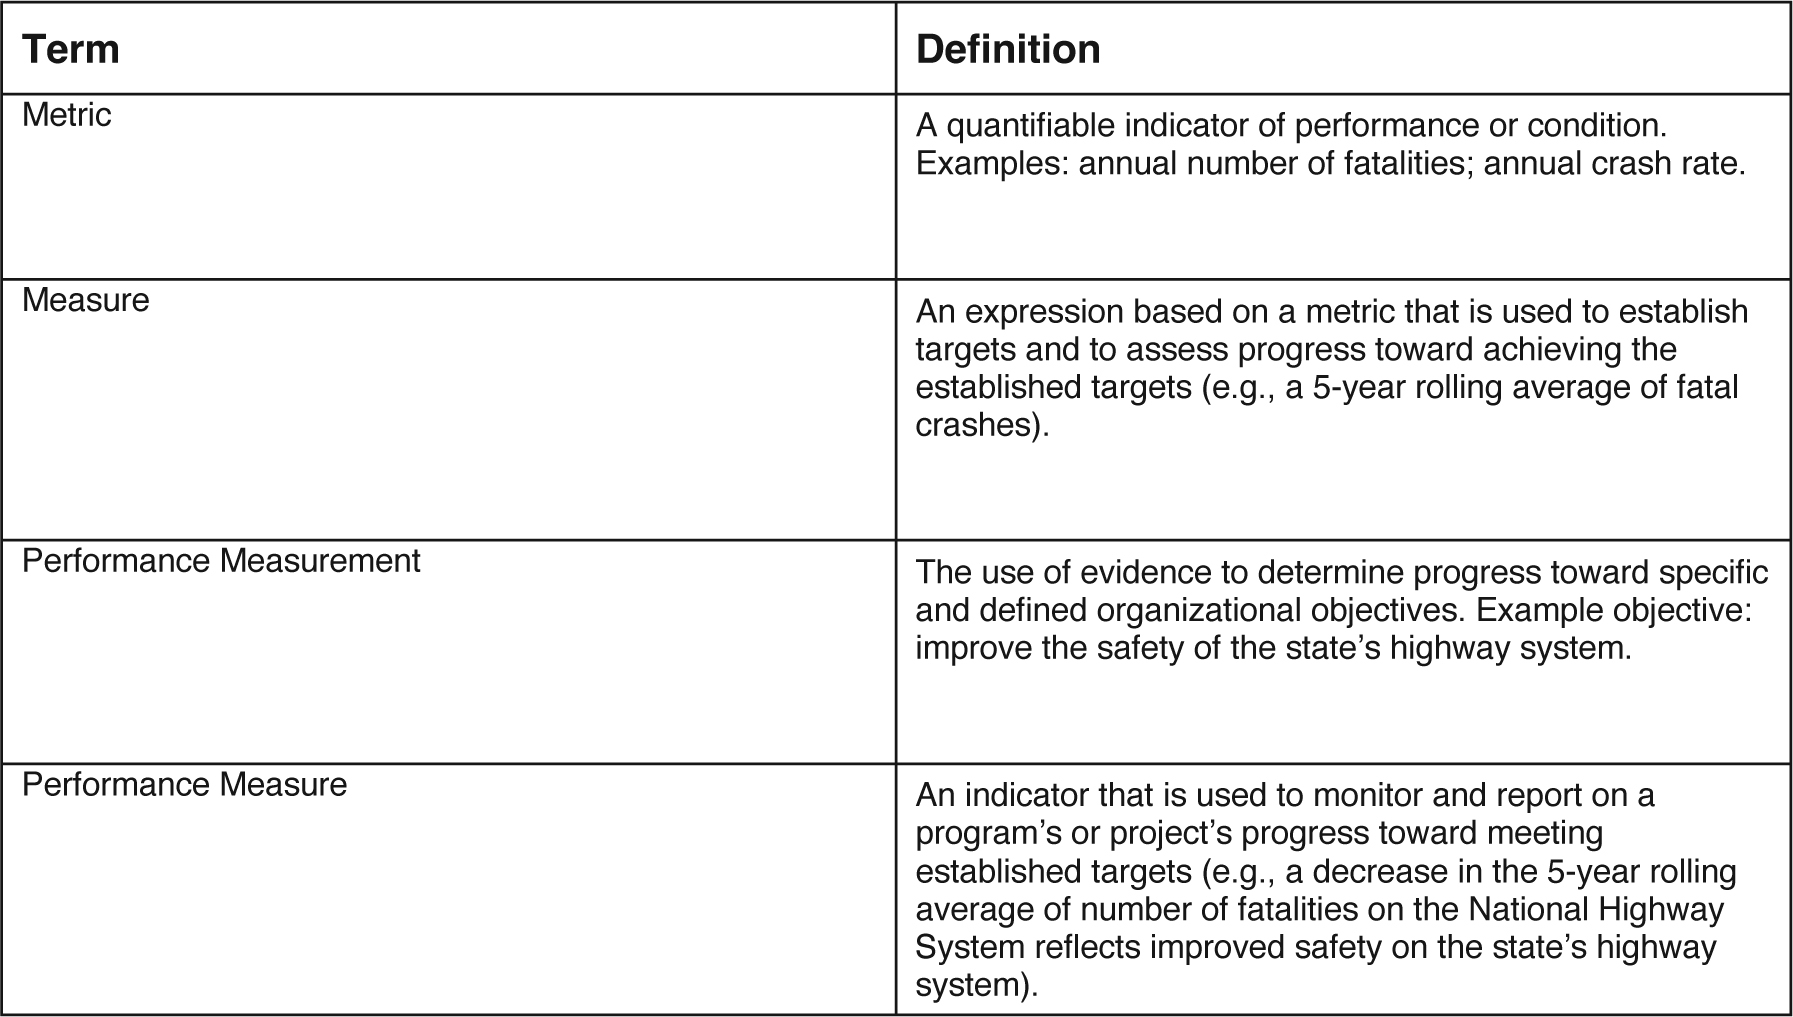
The column headers are Term and Definition. The data given in the table row-wise are as follows: 1, Metric: A quantifiable indicator of performance or condition. Examples: annual number of fatalities; annual crash rate. 2, Measure: An expression based on a metric that is used to establish targets and to assess progress toward achieving the established targets (e.g., a 5-year rolling average of fatal crashes). 3, Performance Measurement: The use of evidence to determine progress toward specific and defined organizational objectives. Example objective: improve the safety of the state’s highway system. 4, Performance Measure: An indicator that is used to monitor and report on a program’s or project’s progress toward meeting established targets (e.g., a decrease in the 5-year rolling average of number of fatalities on the National Highway System reflects improved safety on the state’s highway system).
In addition, the research team concluded that a critical detail was to ensure terminology and definitions were made clear at the onset, especially given the confusion surrounding commonly used terms like “metric” and “measure.” Table 1.1 provides a visual of the four key terms, their definitions, and accompanying examples of each. These definitions are intended to illustrate how performance management components roll up from individual data points that practitioners can measure into an evidence-based decision-making process that tracks progress toward defined goals and objectives.
At the core of this guide are two elements:
- The strategic implementation model (SIM) provides step-by-step guidance for how to integrate resilience into agency performance management programs.
- Appendix A contains the compendium of RPMs, a set of 13 RPMs that agencies can select to measure the resilience of their transportation assets and systems and compare the effectiveness of resilience measures. Additionally, seven of the 13 RPMs have been expanded into examples that follow each step of the SIM are provided in Appendix B, which can be found on the National Academies Press website (nap.nationalacademies.org) by searching for NCHRP Research Report 1159: Measuring Impacts and Performance of State DOT Resilience Efforts: A Guide.
This guide acknowledges that transportation agencies are at various stages of capability and development in their resilience initiatives. It attempts to be inclusive and provide guidance to help at various levels along the development and adoption pathways.
1.2 Strategic Implementation Model
This guide steers transportation agencies through the process of identifying and deploying RPMs from end to end. Figure 1.1 provides a step-by-step process for incorporating RPMs into the existing performance management process:
- It starts with developing goals and objectives for what the agency wants to accomplish based on their understanding of resilience.

Long Description.
The implementation model consists of nine steps. They are as follows: 1, Understanding: Understand resilience within the context of the agency. 2, Goals: Set agency resilience goals and objectives. 3, Select measures: Select RPMs tied to agency goals and objectives. 4, Baseline assessment: Conduct a Risk and Resilience Assessment of the asset, corridor, or system to set baselines based on historical data capture. 5, Future assessment: Extend baseline assessment forecast OR incorporate future projections and climate change. 6, Select actions: Set targets and select resilience strategies. 7, Implement: Monitor and evaluate strategy implementation through performance-based planning and programming. 8, Measure impact: Compare RPMs with asset, corridor, or system baseline. 9, Report progress: Communicate trends to internal and external stakeholders. Steps 4 to 9 form a cyclic process.
- Then, agencies select RPMs tied to their goals and objectives that best measure the resilience of their assets and systems.
- Next, agencies will conduct a baseline assessment of the resilience of their assets, corridors, and systems based on historical data.
- Agencies will then set targets based on a future assessment that, depending on the RPM, either extends the baseline assessment forecast or incorporates future projections, including natural hazard variability.
- Then, agencies will select actions to achieve those targets and implement those actions, evaluating their progress as they go.
- Finally, agencies will measure the impact of their actions by assessing the change in the RPMs and reporting progress to their internal and external stakeholders.
Figure 1.1 is intended to be a framework to support agencies in adapting resilience to their unique context to enhance, standardize, and implement the performance management of resilience-related activities. The chapters and subsections of this guide (see Table 1.2) follow the step-by-step process of this SIM and provide necessary details on each step.
1.3 Compendium of RPMs
This guide is accompanied by a compendium of RPMs to help them achieve a standardized approach to measuring the impact that resilience efforts and investments have on improving the resilience of the transportation system. This compendium is available in two formats.
- First, in Appendix A, there is a table of 13 RPMs that have been sourced from various agencies and additional research as part of NCHRP Project 23-26. These 13 RPMs are intended to create a performance management standard that incorporates resilience into standard practices and programming, enabling agencies to track the resilience of their systems and evaluate the impact of their investments. This table is also available as a separate filterable Excel

Long Description.
The table has two sections. The left section is titled 'Chapter or Subsection' and lists the following: Chapter 1; Chapter 2, Section 2.1; Chapter 2, Section 2.2; Chapter 2, Section 2.3; Chapter 3, Section 3.1; Chapter 3, Section 3.2; Chapter 4; Chapter 5, Section 5.1; Chapter 5, Section 5.2; Chapter 6. The right section is titled 'Corresponding SIM Step' and lists the following: Overview; Step One: Understanding; Step Two: Goals; Step Three: Select Measures; Steps Four: Baseline Assessment Step Five: Future Assessment; Step Six: Select Actions; Step Seven: Implement; Step Eight: Measure Impact; Step Nine: Report Progress; Next Steps and Conclusion.
- spreadsheet tool so practitioners can select and query RPMs based on the hazards and asset types they are most interested in, the area of the DOT that may be best equipped to employ the RPM (e.g., operations versus planning), or the different characteristics of resilience (i.e., the four Rs of resilience) the agency wants to explore. Note: This guide uses Kathleen Tierneyʼs and Michael Bruneauʼs concept of the four Rs of resilience framework, which employs robustness, redundancy, resourcefulness, and rapidity (Tierney and Bruneau 2007).
- Second, seven of the 13 RPMs are expanded in greater depth in the RPMs template examples in Appendix B. These examples illustrate the life cycle of an RPM along each step of the SIM, from goals and objectives to reporting and communication. Figure 1.2 shows an example RPM template with the SIM elements emphasized within the template. These examples provide a more detailed sample methodology for calculating each measure as well as selecting actions to achieve the desired outcomes.
Additional detail about what is included in the compendium of RPMs is included in subsequent chapters of this guide.
1.4 Foundational Elements of Performance Management
Finally, in addition to the main sections, this guide also includes callout boxes to highlight foundational and critical elements of effective performance management that apply the guide to real-life examples or situations. These callout boxes include the following:
- Organization and Culture. What elements of organizational culture, such as leadership support and buy-in, are important when implementing RPMs?
- External Collaboration. How can transportation agencies effectively collaborate with outside stakeholders and subject matter experts?
- Data Management. How can agencies best manage the variety of data sources that are needed to measure resilience?
- Data Usability and Analysis. How do practical considerations concerning the use of data impact the selection and implementation of RPMs?
- Community Resilience. How can resilience practice in general ensure it meets the needs of the community and considers affected populations?
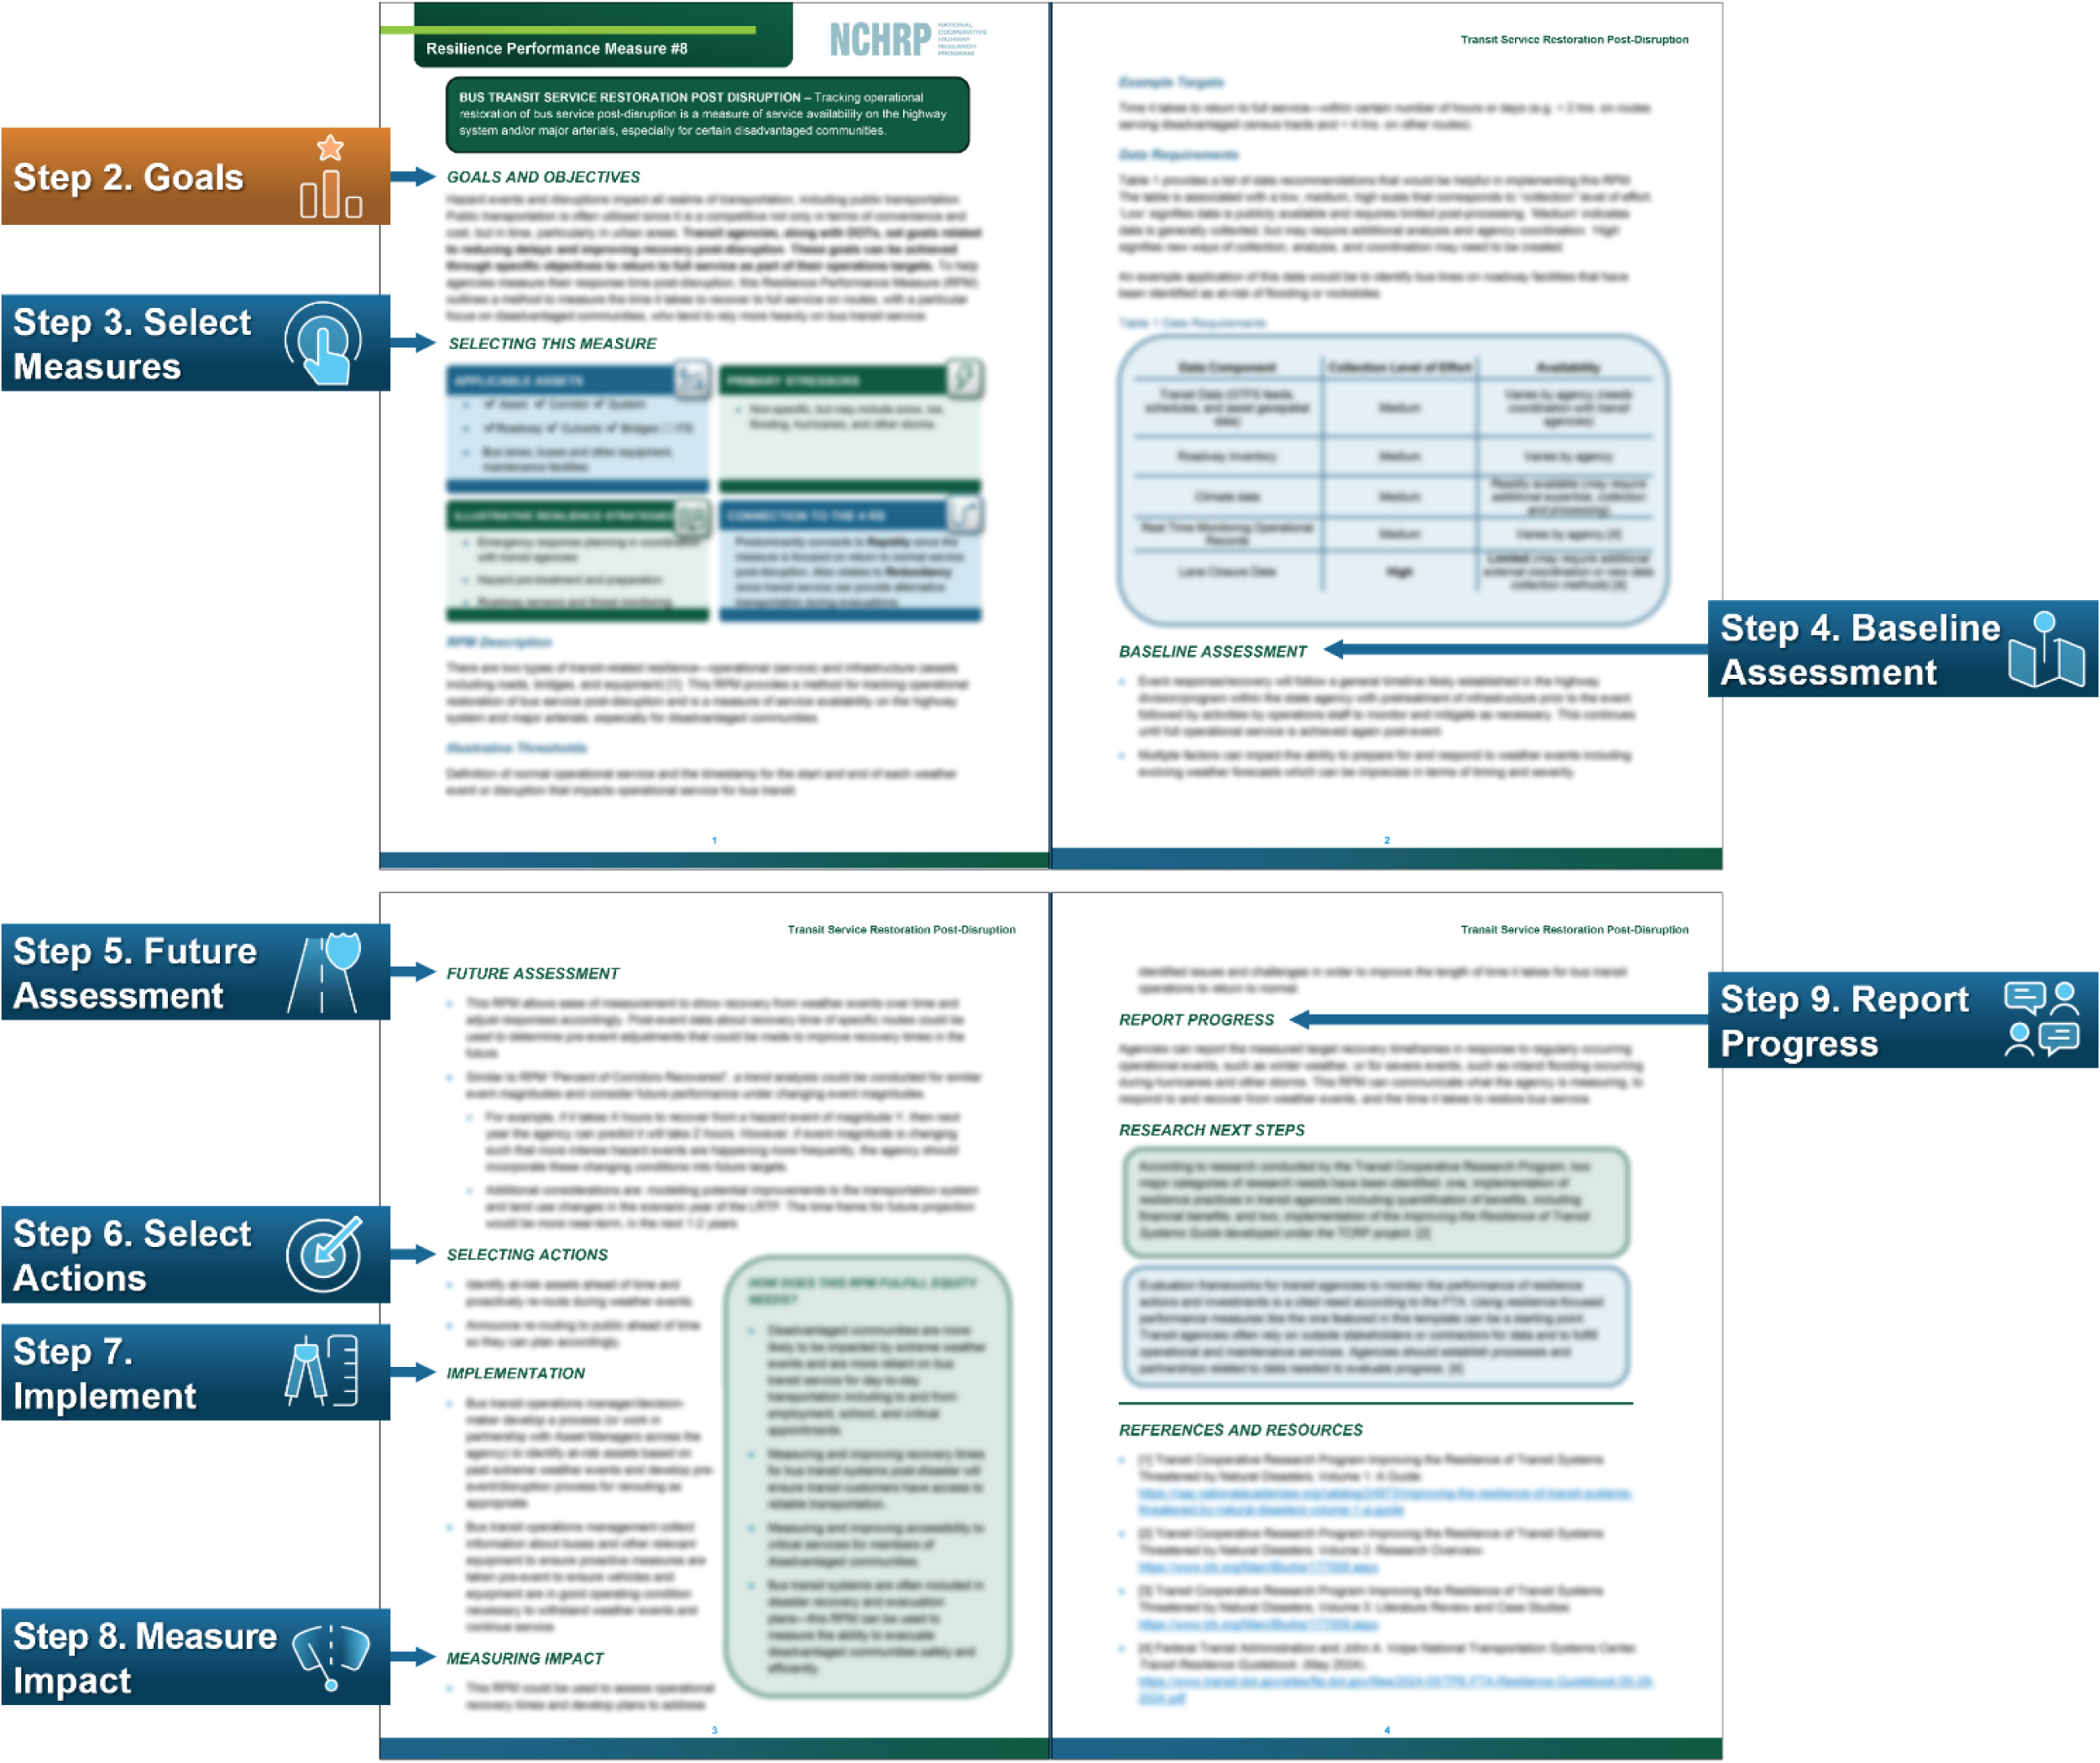
Long Description.
The chart shows a collage of four pages arranged in a 2 by 2 manner. The top left page is titled NCHRP Resilience Performance Measure number 8.' The page consists of two headers labeled Goals and Objectives, and Selecting this measure. They are labeled 'Step 2, Goals' and 'Step 3, Select Measures' with an arrow, respectively. The top right page shows the header Baseline Assessment which is labeled 'Step 4, Baseline Assessment.' The bottom left page shows headers Future Assessment, Selecting Actions, Implementation, and Measuring Impact. These headers are labeled 'Step 5, Future Assessment,' 'Step 6, Select Actions,' 'Step 7, Implement,' and 'Step 8, Measure Impact.' The bottom right page shows the header Report Progress which is labeled 'Step 9, Report Progress.'
Four of these five callout boxes are taken directly from the Transportation Performance Management Framework (TPM Framework) and are used throughout this guide as holistic elements of performance management (FHWA 2024b). The fifth callout box, Community Resilience, is included because of its importance in ensuring that the results of this process are centered on community resilience and affected users of the transportation system.
Two of the RPMs (RPMs 4 and 7) are focused on promoting access and service to affected populations. These RPMs focus on bus transit service and increasing redundant access to stranded zones, bolstering community and transportation resilience. These two RPMs are further detailed in RPM templates in Appendix B.
This research was primarily focused on roadway assets and operations under state DOT purview, but in consultation with the NCHRP Project 23-26 panel, the research team included considerations for community resilience within the limitation of applying it to roadway asset classes that may serve multimodal purposes and transit operations.


