Measuring Impacts and Performance of State DOT Resilience Efforts: A Guide (2025)
Chapter: 3 Developing RPMs and Incorporating Projections

CHAPTER 3
Developing RPMs and Incorporating Projections
Once agencies have an understanding of resilience, have defined goals and objectives, and have selected RPMs that can be used to track progress toward achieving those goals and objectives, they next need to apply those RPMs to measure the baseline resilience of their system and set targets based on future projections. Setting targets for the selected RPMs will help agencies assess the progress toward the goals and objectives established by the agencyʼs strategic direction and to support the decision-making process toward the selection of resilience initiatives. As defined by the TPM Toolbox (FHWA 2024b):
- Target setting is the use of baseline data, information on potential strategies, resource constraints, and forecasting tools to collaboratively establish a quantifiable level of performance that the agency wants to achieve within a specific timeframe.
This section provides direction to transportation agencies on how to set targets for the selected RPMs to be implemented. It reviews the technical methodology for how to measure the baseline of RPMs and incorporate future projections. It then discusses how to select actions toward achieving those targets based on the business processes of the agency, with a focus on roles, purpose, and collaboration. It is important to highlight that the target-setting process should be focused on improving performance over time (e.g., resilience improvements) based on better decision-making and not just on achieving a particular target.
3.1 Target Setting: Technical Methodology
This section covers the technical process required for setting targets for the selected RPMs through Steps 4 and 5 of the SIM. This includes conducting a baseline assessment of the resilience of a transportation system and incorporating future projections, including natural hazard variability, into those RPMs before defining and documenting the target that agencies hope to achieve.
The development of the technical methodology to set targets, particularly related to RPMs, is based on the collection of historical, current, and future/projected data related to risk, resilience, and system performance. This data will help establish a baseline and estimate trends based on future scenarios.
The SIM summarizes the implementation of the technical methodology for target setting in two key steps (Step 4: Baseline Assessment and Step 5: Future Assessment) (see Figures 3.1 and 3.2, respectively). Important aspects of these two key steps include the following:
- Establishing a baseline.
- Analyzing historical trends.
- Identifying influential factors and conducting the assessment.
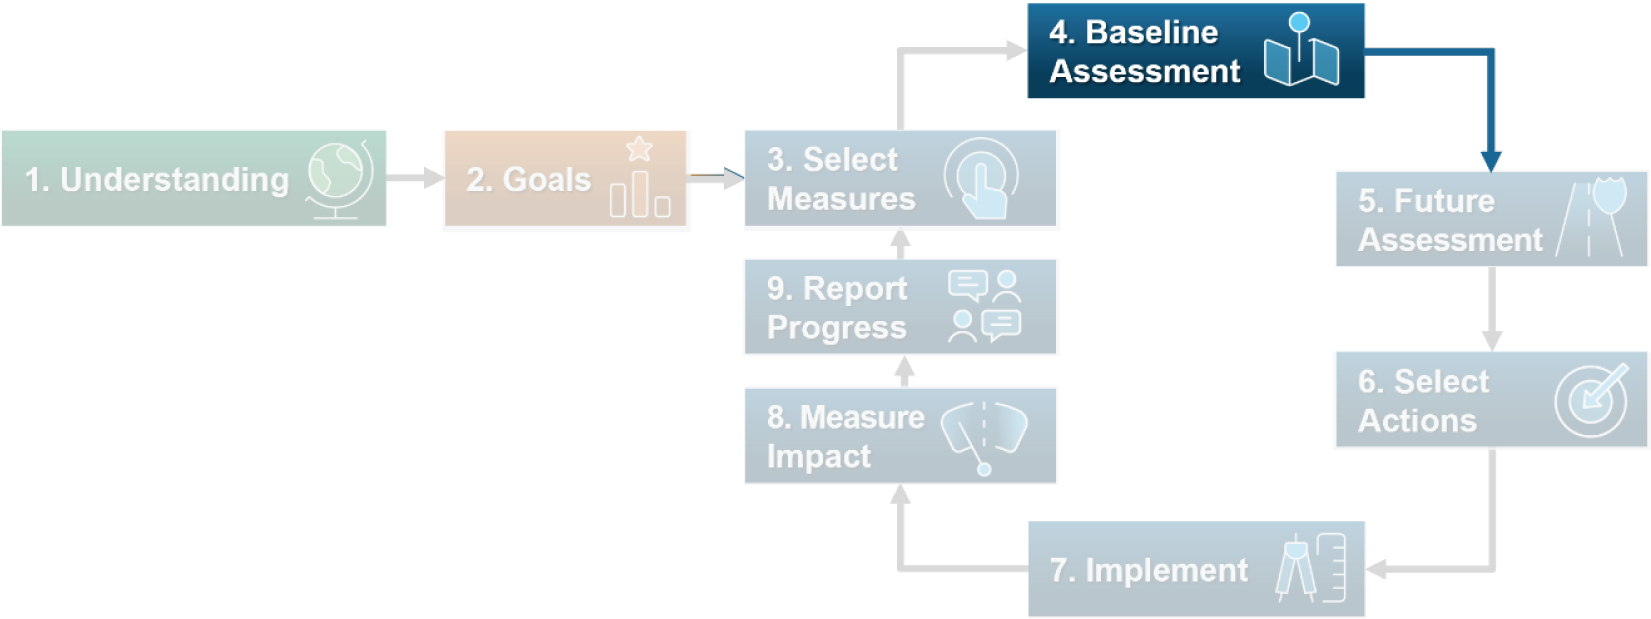
Long Description.
The implementation model consists of nine steps. They are: 1, Understanding. 2, Goals. 3, Select measures. 4, Baseline assessment. 5, Future assessment. 6, Select actions. 7, Implement. 8, Measure impact. 9, Report progress. Step 4 'Baseline Assessment' is highlighted.
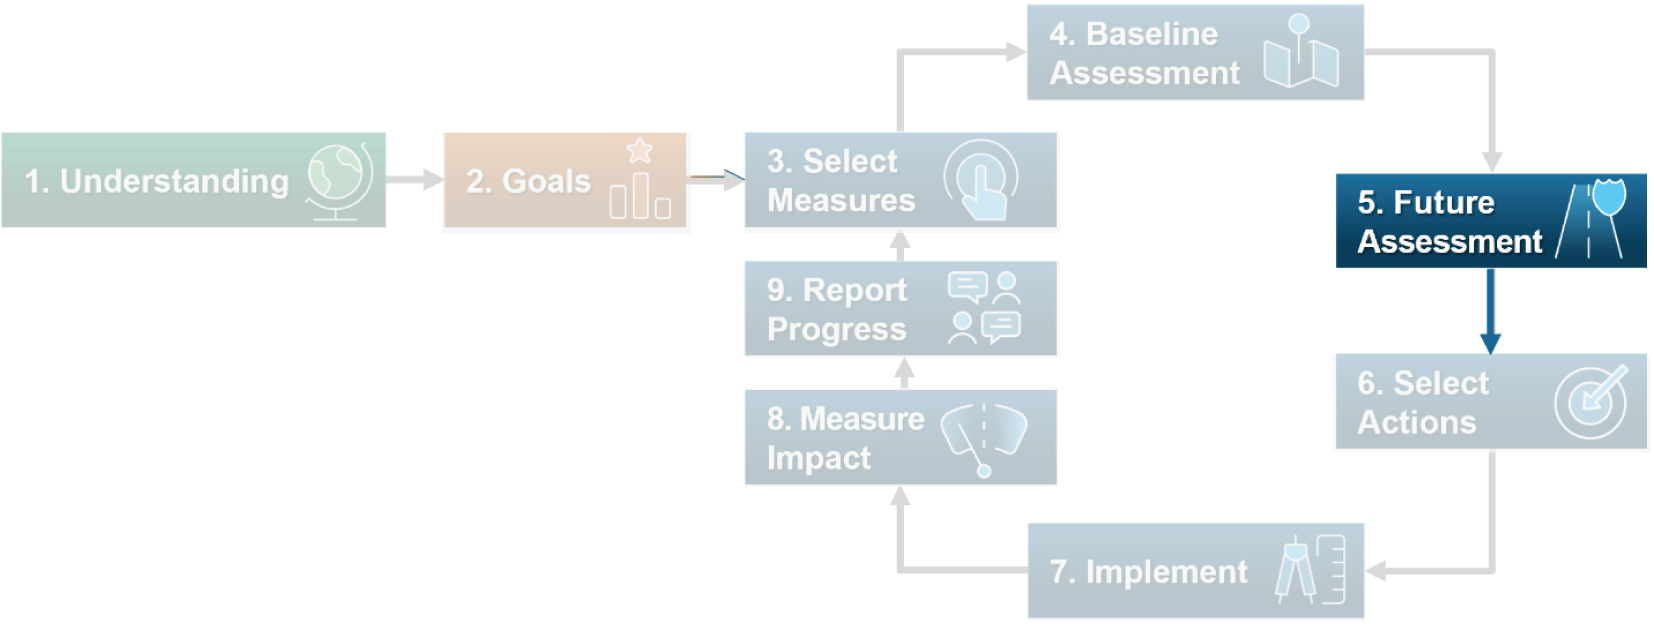
Long Description.
The implementation model consists of nine steps. They are: 1, Understanding. 2, Goals. 3, Select measures. 4, Baseline assessment. 5, Future assessment. 6, Select actions. 7, Implement. 8, Measure impact. 9, Report progress. Step 5 'Future Assessment' is highlighted.
- Defining target parameters.
- Forecasting future performance.
- Documenting the technical methodology.
The implementation of these steps provides an opportunity to encourage communication and collaboration among the different stakeholders involved in the target-setting process and provides an opportunity for monitoring and continued improvement and refinement of the methodology and data used to estimate both baseline and future conditions. Target setting can differ by agencies based on their particular goals and objectives, as well as maturity and capabilities in terms of resource availability (e.g., data, tools, funding, etc.). In addition, the initial baseline also plays a role in the level of effort needed to achieve a particular target and needs to be assessed to set achievable and realistic targets.
Methodology for Target Setting
Different RPMs require different methodologies to estimate the baseline and future conditions to be used for setting particular targets. Some of the RPMs in the compendium of RPMs require the implementation of a methodology to estimate risk, while other RPMs are based on the estimation of a resilience index and the quantification of different parameters to help identify and measure resilience performance. Table 3.1 lists the RPMs from the compendium of RPMs that need an advanced technical methodology to estimate the baseline and future assessments. Further explanation on these RPMs can be found within Appendices A and B.
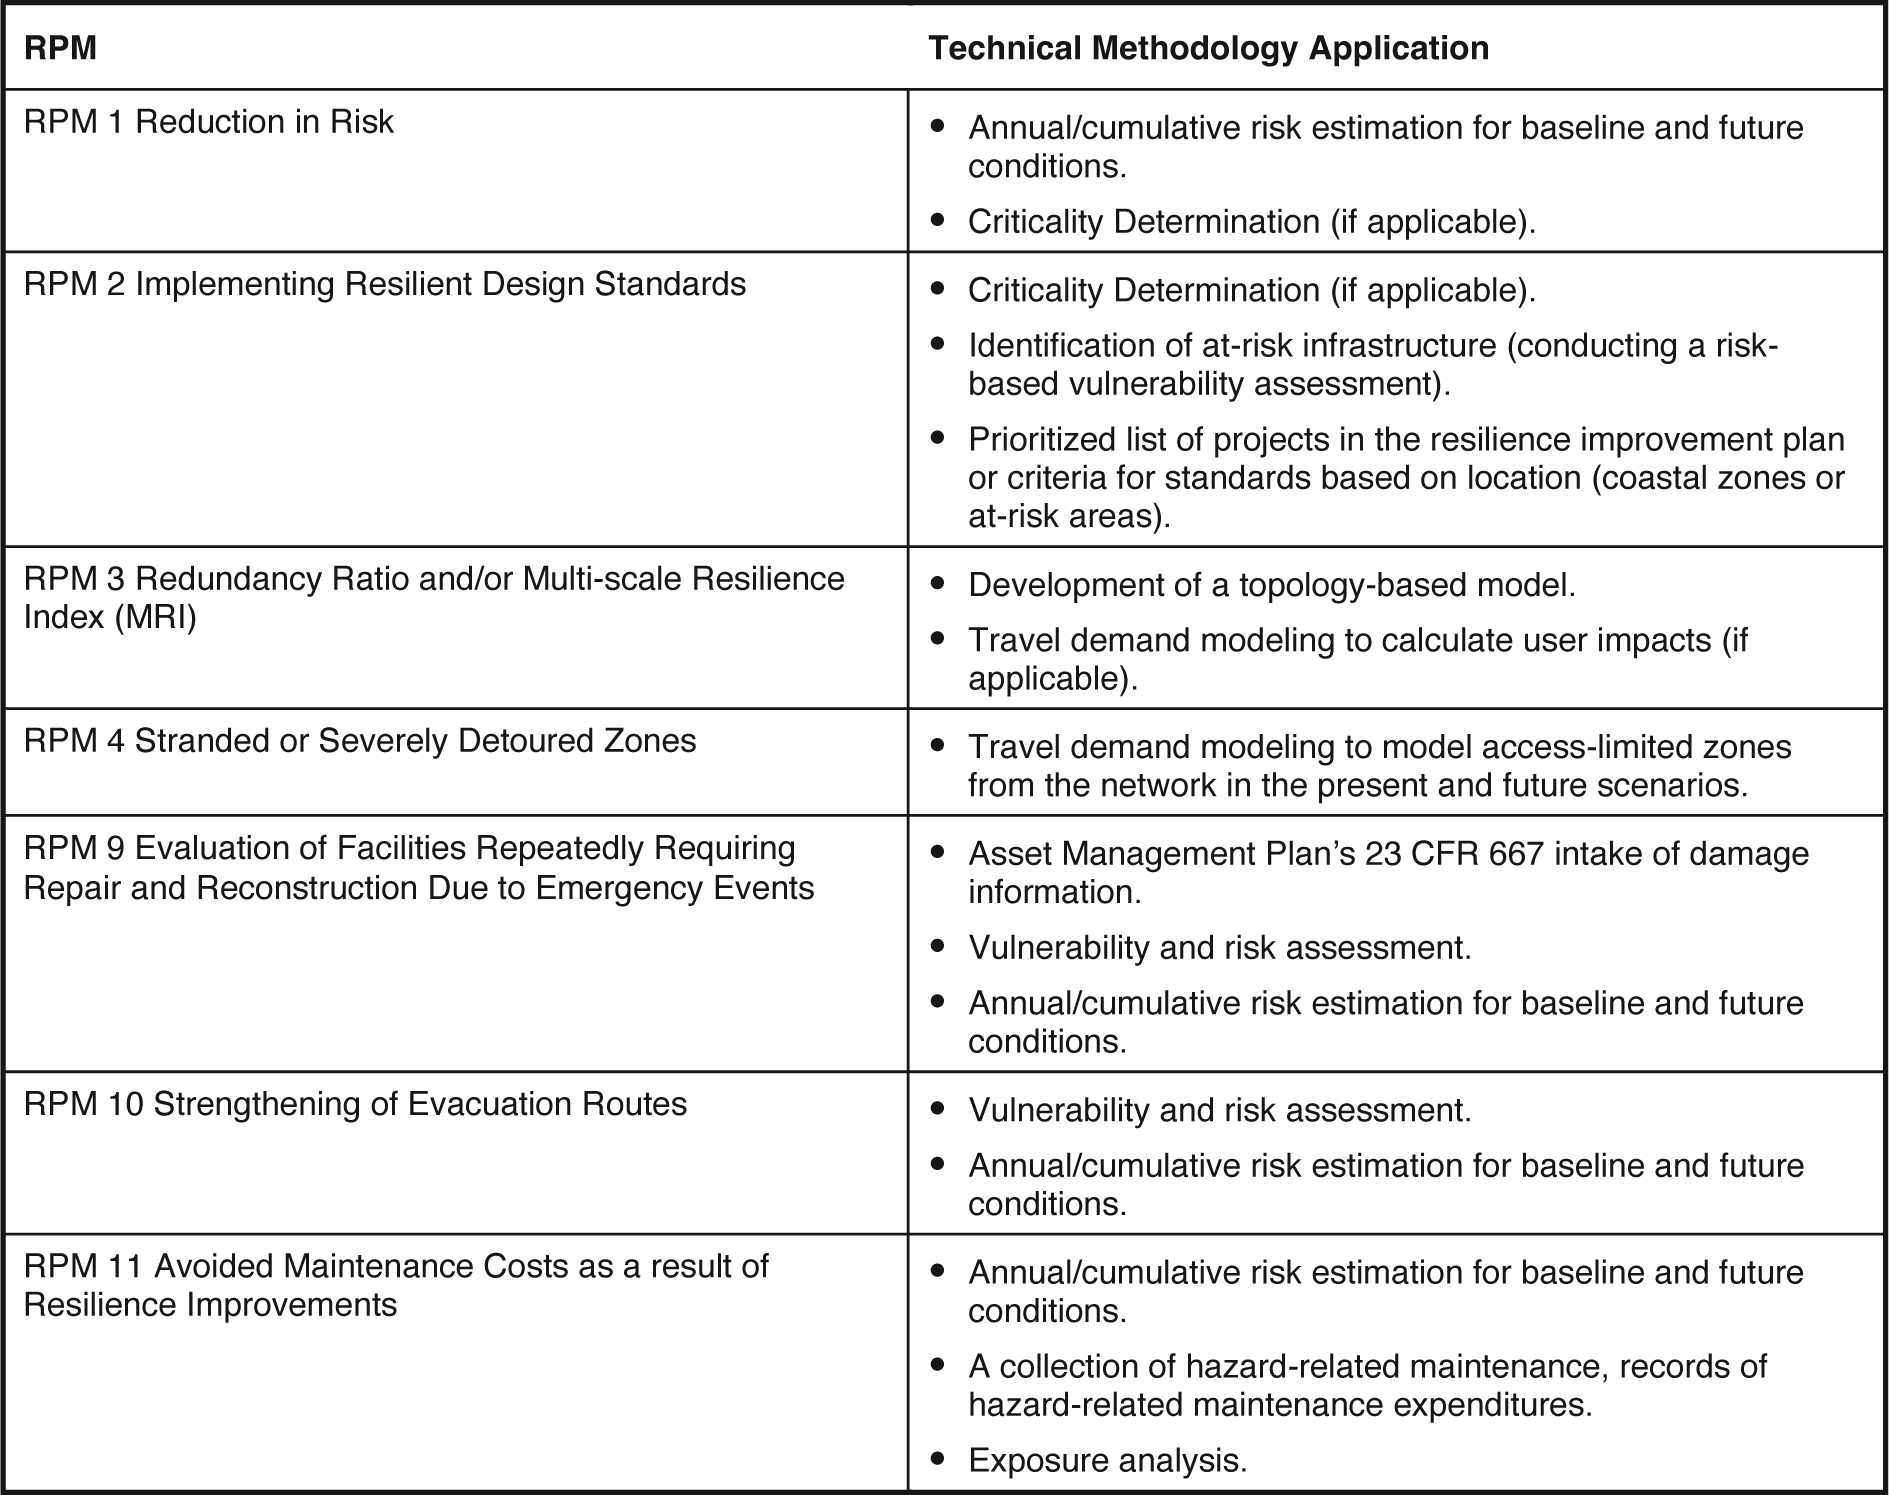
Long Description.
The column headers of the table are RPM and Technical Methodology Application. The data given in the table are as follows: Row 1: Reduction in Risk: Annual or cumulative risk estimation for baseline and future conditions; Criticality Determination (if applicable). Row 2: Implementing Resilient Design Standards: Criticality Determination (if applicable); Identification of at-risk infrastructure (conducting a risk-based vulnerability assessment); Prioritized list of projects in Resilience Improvement Plan or criteria for standards based on location (coastal zones or at-risk areas). Row 3: Redundancy Ratio and or Multi-scale Resilience Index (MRI): Development of a topology-based model; Travel demand modeling to calculate user impacts (if applicable). Row 4: Stranded or Severely Detoured Zones: Travel demand modeling to model access-limited zones from the network in present and future scenarios. Row 5: Evaluation of Facilities Repeatedly Requiring Repair and Reconstruction Due to Emergency Events: Asset Management Plan’s 23 CFR 667 intake of damage information; Vulnerability and risk assessment; Annual or cumulative risk estimation for baseline and future conditions. Row 6: Strengthening of Evacuation Routes: Vulnerability and risk assessment; Annual or cumulative risk estimation for baseline and future conditions. Row 7: Avoided Maintenance Costs as a result of Resilience Improvements: Annual or cumulative risk estimation for baseline and future conditions; Collection of hazard-related maintenance; Exposure analysis.
Baseline Assessment: Vulnerability and Risk Assessments in Addition to Other Methodologies
The baseline assessment establishes an understanding of the current state of the system based on an observed level of performance for a specified performance period from which implementation begins, improvement is judged, or a comparison is made (FHWA 2024c). The baseline of performance measures in many other transportation disciplines is established based on extending historic trends and incorporating possible future factors. This process can apply to many RPMs, such as RPM 5, Training and Education of DOT Staff (Appendix A). However, for other RPMs, this typical process is complicated by the difficulty in measuring the different dimensions of resilience as well as the uncertainty of disruptive events and differences in the magnitude of those event impacts. To see an example methodology in action, please refer to the RPM templates in Appendix B.
Vulnerability and Risk Assessment
One of the primary baseline assessment methodologies used in many RPMs is the evaluation of vulnerability and risk that the agency faces from a variety of hazards. Different methodologies (qualitative, semi-quantitative, and quantitative) have been developed to estimate risk at the asset and project levels from different natural hazards or human-induced threats.
Two examples of methodologies for vulnerability and risk estimation used by transportation agencies include the FHWAʼs Vulnerability Assessment and Adaptation Framework (VAAF) and associated Vulnerability Assessment Scoring Tool (VAST) and the American Society of Mechanical Engineers (ASME) Risk Analysis and Management for Critical Asset Protection (RAMCAP) framework (FHWA 2017; FHWA 2015; American Society of Mechanical Engineers (ASME) Innovative Technology Institute, LLC 2010).
The FHWA methodology is an indicator-based approach based on scores used to estimate the vulnerability of assets from different hazards, while the RAMCAP approach provides a methodology to estimate risk as a monetary value. The state of practice is moving toward the implementation of probabilistic and monetary approaches to estimate risk and resilience that also provide an opportunity to estimate the reduction in risk as well as conduct an economic analysis of risk mitigation initiatives.
The RAMCAP methodology estimates risks based on threat likelihood, vulnerability, and consequences, allowing for the estimation of annual risk as a monetary value as presented in the following equation:

Where:
- Risk ($): The annual potential for loss or harm due to the likelihood of an unwanted event and its adverse consequences.
- Threat (T) (%): The likelihood that an adverse event will occur within a specified period, usually 1 year. The event could be anything with the potential to cause the loss of or damage to an asset or population.
- Vulnerability (V) (%): The probability that, given an adverse event, the estimated consequences will ensue.
- Consequence (C) ($): The outcomes of an event occurrence, including immediate, short- and long-term, direct and indirect losses and effects. Loss may include human fatalities and injuries, economic damages, environmental impacts, and other considerations, which can generally be estimated in quantitative terms.
Once the baseline of existing risks is estimated, further discussion about the agencyʼs risk tolerance is encouraged for reasonable target setting and prioritization of risk reduction efforts. Risk tolerance involves the level of risk an agency can accept to meet their goals and objectives.
Data Availability
An important factor to consider when selecting the appropriate methodology to implement any RPM includes the availability of data and the level of effort and resources needed to support the implementation of the selected methodology.
Many of the RPMs suggest methodologies (Table 3.1) that incorporate additional datasets or other resources that transportation agency practitioners may or may not be familiar with. Some of these datasets may be unfamiliar (e.g., climate projection data and transit data), while others may already be highly used by DOT staff (e.g., roadway inventory and traffic volume data).
Each RPM template has a checklist of ingredients necessary for RPM implementation. The templates also describe the steps needed to conduct baseline and future assessments as well as post-implementation activities like measuring impacts and communicating progress. For each of these steps, practitioners may need to explore new ways of data collection, found new partnerships, establish new roles for data management, and provide technical training. This is particularly relevant for the analysis and interpretation of datasets that may be critical to incorporating uncertainties and future projections into DOT performance management and performance-based planning efforts.
Several RPMs necessitate similar elements such as threat maps, climate projection data, historical hazard data, and hazard severity data. Some of this data may involve outreach to subject matter experts to acquire and understand the context in which to apply the data. However, internal improvements may also be needed. For example, a few RPMs require operations and maintenance data, which, depending on the agency, can be adequately collected or inconsistent. Obtaining data quality and consistency is a critical step in resilience performance management since much of this data requires post-processing and is used in overlapping resilience assessments like criticality, vulnerability, and risk.
Transportation agency practitioners also use historical data to understand when and where disruptions have occurred and may potentially occur again. This understanding supports emergency response and management efforts and can extend to predictive economic impact analyses as well. However, given the non-stationarity of weather-related risks, it is clear that historical data can only provide so much.
As technology continues to advance, climate modeling and forecasting are integral to identifying the range of potential climate outcomes that a region or system may face. Ensuring practitioners recognize the utility of historical data while also incorporating future climate models will create more accurate targets and more comprehensive ways to measure the effectiveness of resilience investments. Yet, it is understood that practitioners must be aware of data limitations and the assumptions that underlie this data.
Future Assessment: Consideration of Probable Events and Climate Projection Data
Setting targets for selected RPMs will require an understanding of what is feasible under future conditions. Forecasting future performance should address the following two variables to support target setting:
- Projecting Natural Hazard Variability. Projecting the changes in frequency and magnitude of natural hazards.
- Forecasting Future Asset Performance. Forecasting the performance of assets and transportation systems under these projected physical conditions. This should include incorporating policy/programmatic/fiscal changes that will have an impact on infrastructure conditions due to preservation and maintenance variability in the future.
These represent factors—both internal and external—that have the potential to affect how transportation infrastructure will continue to perform under changing conditions and thereby affect the actual results of infrastructure performance under these conditions.
Projecting Natural Hazard Variability
Transportation agencies have access to various data and tools to project changes in precipitation, temperature, and coastal and inland flooding. Resources like the National Climate Assessment (NCA) provide broad projections for geographic regions and sectors of the economy (U.S. Global Change Research Program n.d.-c). There are also tools such as Climate Mapping for Resilience & Adaptation (CMRA), which provide decision-relevant data for climate resilience (U.S. Global Change Research Program n.d.-a). Downscaled data from global climate models (GCMs) are available through various tools to develop regional statistics for precipitation and temperature projections. For example, localized constructed analogs (LOCA) datasets are available at a 1⁄16th degree spatial resolution for temperature and precipitation projections, reflecting the scenarios used in the NCA and contain relevant statistics and thresholds that can be used by transportation practitioners (U.S. Global Change Research Program n.d.-b). Example statistics for use in target setting and future performance include change in the annual number of days with maximum temperature greater than 95°F, or annual number of days with precipitation greater than 3 in., which is evaluated as a departure or change from the baseline. Figure 3.3 shows the number of days with a maximum temperature greater than 95°F for the Chicago Metropolitan Area for two climate scenarios.
Additionally, the U.S. DOTʼs Coupled Model Intercomparison Project (CMIP) Climate Data Processing Tool 2.1 (FHWA n.d.-b) has been developed to process project-level downscaled climate projections. The upcoming National Oceanic and Atmospheric Administration (NOAA) Atlas 15 is expected to incorporate non-stationarity in developing precipitation frequency estimates and will provide natural hazard variability adjustment factors (National Oceanic and Atmospheric Administration n.d.). For riverine flooding, FHWAʼs Hydraulic Engineering Circular No. 17, 2nd Edition (HEC 17), provides five levels of analysis that can be used to assess the vulnerability of transportation infrastructure (FHWA 2016).
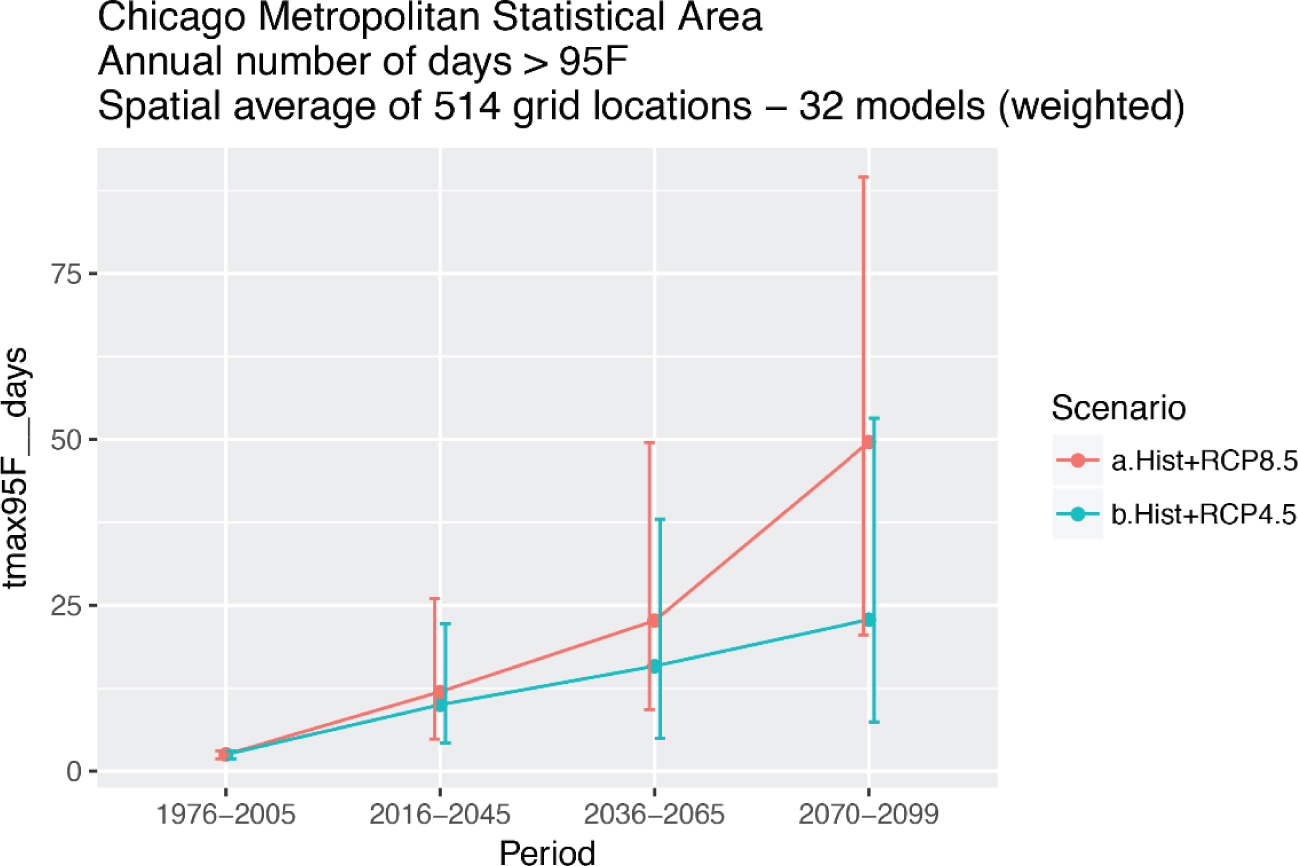
Source: Scenarios for the NCA LOCA Viewer (U.S. Global Change Research Program n.d.-b).
Long Description.
The graph is titled 'Chicago Metropolitan Statistical Area – Annual number of days greater than 95 degrees Fahrenheit. Spatial average of 514 grid locations - 32 models (weighted).' The x-axis shows four time periods: 1976 to 2005, 2016 to 2045, 2036 to 2065, and 2070 to 2099. The y-axis represents tmax95F_days ranging from 0 to 75 in increments of 25. The graph consists of two climate projection scenarios representing a.Hist+RCP8.5 (red) and b.Hist+RCP4.5 (blue). The red line shows a steep upward trend, starting near zero and rising to nearly 60 days from 2070 to 2099. The blue line shows a gradual increase, peaking around 30 days in the same final period. Both lines include error bars indicating model uncertainty. The red scenario projects significantly more hot days compared with the blue scenario in the future.
For coastal flooding, there are several sources of projection information available through NOAA for sea level rise projections (National Oceanic and Atmospheric Administration 2022) and storm surge modeling [Sea Lake and Overland Surges from Hurricanes (SLOSH) Storm Surge Modeling] (Zachry 2015). FHWAʼs Highways in the Coastal Environment, Hydraulic Engineering Circular No. 25—Volume 2 (HEC 25) provides guidance on methodology and approaches to calculate future projected sea level rise at a project level (FHWA 2014). For hazards where information on threat probability and projections is not available through models, other qualitative means, including relying on expert judgment, are recommended.
These climate projections will provide scenarios for alternatives from the baseline informed by the potential changes in intensity and frequency of natural hazards and thereby a changing environment in the future. Decision Making under Deep Uncertainty: From Theory to Practice presents various approaches to dealing with uncertainty with climate modeling, including the decision scaling (DS) method, which is a decision-analysis framework to use a plausible range of climate projections to inform the level of interest for identified climate vulnerabilities (Marchau et al. 2019).
Forecasting Future Asset Performance
Once the future natural hazard projections are developed, their impact on transportation infrastructure needs to be assessed. There are qualitative and quantitative assessments at system and asset levels that have been developed for this purpose, including FHWAʼs VAAF (3rd Edition) and RAMCAP. Risk and resilience assessment frameworks and approaches have been developed through NCHRP Research Report 1014: Developing a Highway Framework to Conduct an All-Hazards Risk and Resilience Analysis (Pena et al. 2023) and are ongoing in NCHRP Project 23-32, “Transportation Asset Risk and Resilience.”
The performance of transportation infrastructure in the future should include assessing their performance under those conditions. While there may be events and occurrences in the past that may be used to ascertain infrastructure performance from actual data for individual events, a life-cycle assessment should leverage modeling approaches that can model vulnerabilities and failures under changing conditions. Deterioration modeling involves the development of curves that are graphs representative of an assetʼs condition over its service life plotted over time. They have been used in asset management to predict asset performance based on historic performance trends, expected funding levels, and expert judgment. Continued research is needed to incorporate the impact of extreme weather events and natural hazard variability to model risk assessment, life-cycle cost analysis, and the impact of adaptation strategies using these models (as shown in Figure 3.4).
As part of these efforts to model future risk, impact-damage functions are being developed for various threat-asset pairs. Also known as vulnerability functions (or curves), impact-damage functions relate physical damage to an event or stressor magnitude. It is typically presented on a 0 to 1 scale, where 0 indicates no damage and 1 indicates total loss of the asset. These functions provide a quantitative basis for assessing vulnerability, which can be used to denote the disruption in the performance of the asset at various levels—both partial and complete.
Hypothetical Agency Example
To illustrate how this might work in practice, imagine an agency in a coastal state whose highway assets are affected by coastal and inland flooding. Their goal is to prepare for the impacts
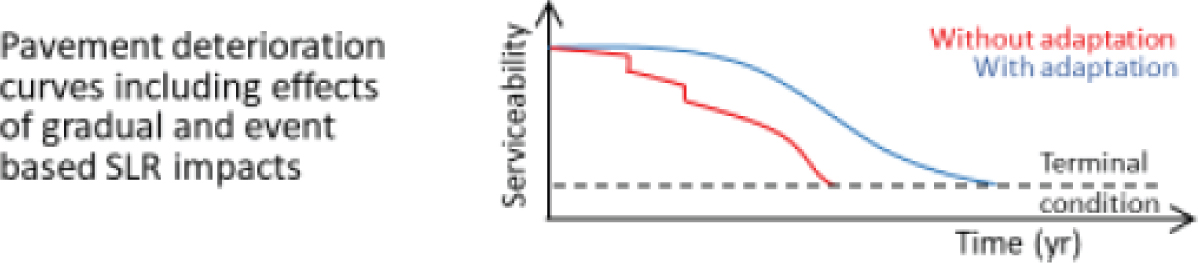
Source: Sias 2021.
Long Description.
The horizontal axis represents time and the vertical axis represents serviceability with no scale or unit. The graph compares two scenarios: "Without adaptation" (red line) and "With adaptation" (blue line). The red line declines steeply in a stepped pattern, indicating rapid deterioration due to both gradual and event-based impacts, reaching the terminal condition sooner. The blue line declines more gradually and smoothly, maintaining higher serviceability for a longer period before reaching the terminal condition. A horizontal dashed line across the bottom marks the terminal condition threshold.
of sea level rise and more severe and frequent storm events, and they select RPM 1, Reduction in Risk, as their main measure to track progress toward that goal. As part of the baseline assessment, they conduct a risk and resilience assessment of their assets to inland and coastal flooding, including calculating asset criticality and vulnerability. To incorporate future projections, they develop a hydrologic and hydraulic (H&H) model using the best data they have available. The result of this analysis is a cumulative monetized risk value that incorporates user and owner consequences. They then use this analysis in the remaining steps of the SIM, starting with selecting actions to address the highest-risk assets.
As they implement resilience strategies, the agency periodically recalculates the monetized risk value for their assets (Step 8 of the SIM). There are three possible ways that this risk value can change:
- Better data sources can become available to the agency, such as more granular climate projections. This leads to adjustments in the inputs of the analysis framework and refinement of the baseline and future assessment methodology.
- The agency collects better data on asset performance in response to actual hazard events over time, leading to improved forecasting of asset performance under different hazard events.
- The agency invests in resilience strategies that reduce their assetsʼ vulnerability to and consequences from hazard events, reducing the overall risk.
Over time, the agency keeps track of how each of these three changes is affecting the cumulative monetized risk value that their assets face. They pay particular attention to the third factor so they can track and communicate about the impact that their resilience investments and strategies are having on the transportation system.
Finalizing Targets
Once the baseline methodology is defined and future projections have been incorporated to understand future trends, agencies can finalize their targets by selecting an ambitious yet achievable change in the RPM that agencies can achieve through their actions. When defining this target, practitioners should also set the target parameters such as target format, scope, and time horizon.
Targets can be communicated in different formats, such as the following:
- Number (e.g., achieve a $500K in annual risk reduction from flood events for all critical bridges on Interstates).
- Percentage or Rate (e.g., achieve a 10% annual reduction in risk from flood events to Interstate bridges).
- Tiered Targets (e.g., reduce 20% annual risk from flood events to Interstate bridges with high criticality and 10% reduction in annual risk to interstate bridges with low criticality).
In addition, the target scope can also be adjusted to different extents, such as geography, roadway functionality, asset type, and threat/hazard type. It is important to pay attention to the extent of the scope so performance targets can be managed, achieved, and more easily monitored by the different stakeholders involved.
Moreover, resilience improvement investment timelines may take different horizons to show actual improvements to the system. In addition, when risk reduction improvements are designed based on future projections (e.g., sea level rise), the performance improvements from these investments cannot be estimated in the short term (e.g., 5-year versus 50-year horizon).
There are other considerations that agencies should incorporate when making their targets effective, and NCHRP Research Report 1035: Guide to Effective Methods for Setting Transportation Performance Targets provides additional guidance, including examples from other transportation practice areas (Grant et al. 2022).
3.2 Selecting Actions and Incorporating Business Processes
This section describes how to select actions to achieve the targets that have been defined (Step 6), including considering business processes that the agency can use to impact the RPMs and achieve their goals and objectives.
Once the baseline and future assessments have been completed and targets have been defined, the next step in the SIM is to select actions to achieve the targets and make progress toward their goals and objectives (Figure 3.5). This includes applying the results of the analyses and prioritizing actions to take that will have the greatest impact. It also includes considering the business practices within the agency that will play a key role in the implementation of the selected actions. Finally, it includes considering the feasibility of implementation of the selected actions, which is covered in greater detail in Chapter 4.
The baseline and future assessments help agencies understand the problem, and the selecting actions step requires making choices to address that problem. For example, in flooding, many agencies will evaluate their culverts to see which are at the greatest risk for flooding under different storm return periods. The agency may then diagnose the problem that many culverts are undersized and prioritize different culverts to be expanded based on designing them to handle more intense storms. The selecting action step is thus diagnosing the issue of the culverts being at risk due to intense flooding.
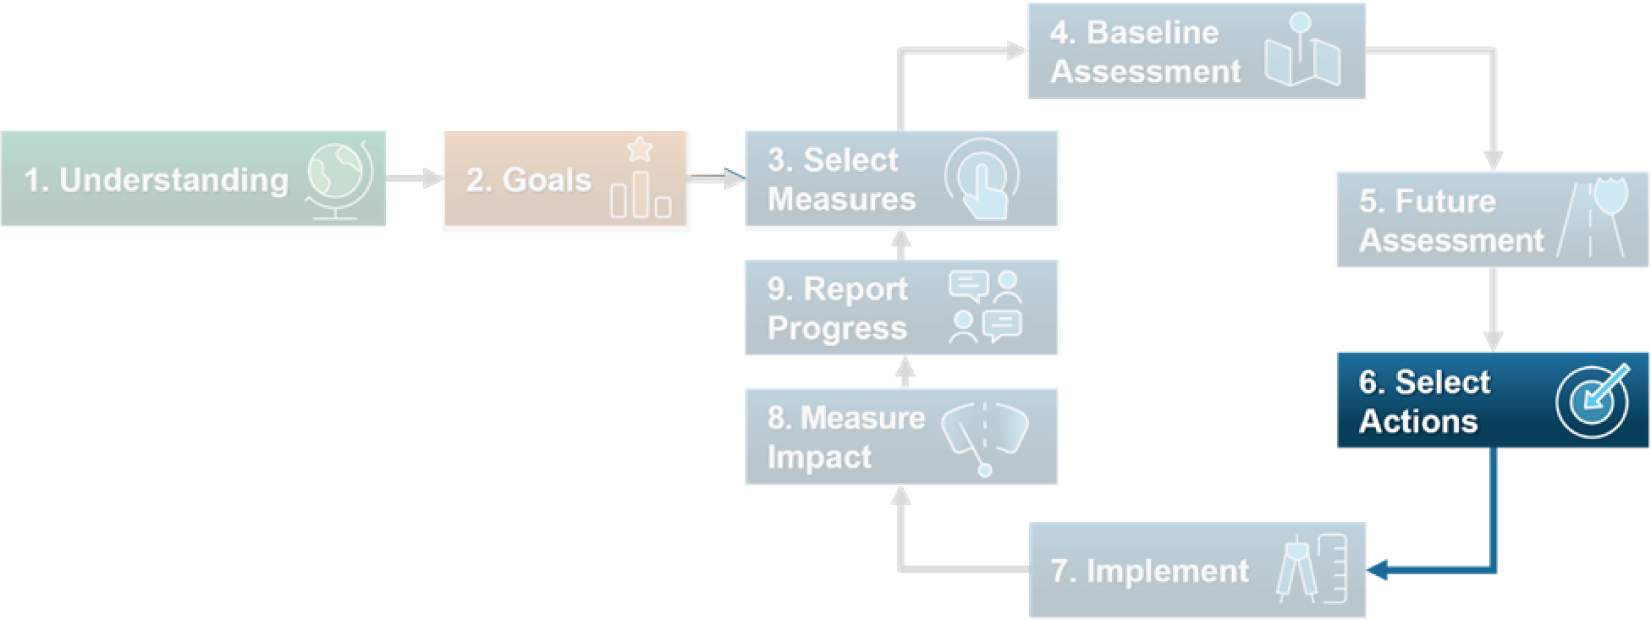
Long Description.
The implementation model consists of nine steps. They are: 1, Understanding. 2, Goals. 3, Select measures. 4, Baseline assessment. 5, Future assessment. 6, Select actions. 7, Implement. 8, Measure impact. 9, Report progress. Step 6 'Select Actions' is highlighted.
Developing Adaptation and Mitigation Strategies
The baseline and future assessments conducted are likely to reveal a variety of different root causes that lead to vulnerability and risk for a variety of assets to a variety of hazards. To accommodate the diversity of circumstances that agencies may face, many agencies are developing adaptation and mitigation toolboxes that contain a variety of possible strategies that the agency could implement for assets that face hazard impacts.
These toolboxes are developed from a review of the latest advances in addressing impacts as well as incorporating expertise from within and outside the agency. There are a variety of sources that agencies can review to evaluate the options for strategies to include in these toolboxes, including the following:
- U.S. Climate Resilience Toolkit. This toolkit provides the latest tools and information to support adaptation and resilience decision-making efforts. For instance, the Investigate Options web page provides case studies and toolkits for hazards commonly faced (U.S. Global Change Research Program 2017).
- FHWAʼs Adaptation Decision-Making Assessment Process (ADAP). This risk-based tool offers practitioners a framework to incorporate extreme weather into the planning stage of project development by evaluating preferred approaches based on costs and benefits (U.S. DOT National Transportation Library 2016).
Illustrative Resilience Strategies
To assist agencies in categorizing the types of actions that can be pursued to improve the resilience of their transportation system, the compendium of RPMs lists illustrative resilience
strategies for each of the RPMs (see Appendix A). These strategies describe general categories of actions that agencies can take and incorporate into their performance-based planning and programming processes (covered in more detail in Chapter 4). These categories of actions include the following:
- Asset Protection/Counter Measures. These strategies implement specific interventions to protect assets from known threats and hazards, such as installing sea walls to protect from sea level rise.
- Hardening Infrastructure. These strategies expand the ability of assets to withstand hazard impacts, such as improving their condition to a state of good repair or strengthening critical corridors like evacuation routes.
- Organizational Readiness. These strategies help the organization prepare for hazard impacts and respond more rapidly to emergency events.
- Increase Capacity. These strategies increase the capacity of the transportation system so that the system as a whole can provide greater levels of service.
- Threat Identification, Monitoring, and Response. These strategies focus on being prepared for imminent threats, such as extreme weather events, and mobilizing resources to quickly recover from those threats.
Considering Business Practices
Complementing the technical methodology side of target setting, it is important to consider the business processes within the agencies before implementing resilience strategies. There are several business processes agencies should consider, including clarifying the purpose of targets, benchmarking targets (including external stakeholder interests), and assigning clear roles and responsibilities when documenting the target.
First, clarifying the purpose of the target generally involves both consideration of the audience for the target and the degree to which the target is evidence- or investment-based. The target can be geared toward different end users, such as internal staff, customers, or regulatory bodies, which affects the motivations for the targets. And because a few cycles may be needed to better forecast future trends, targets may be set less aggressively initially to build confidence in the forecasting process.
Second, agencies should benchmark targets with comparisons of the agencyʼs own historical patterns, peer agency targets, and industry-wide best practices. The process of benchmarking targets to agency historical trends is covered in the baseline methodology section of the target-setting methodology. When comparing to peer agencies, it is important to identify peer agencies based on similar attributes relevant to the target (economy size and makeup, climate). Similarly, best practices for targets should also be considered, but the local context of the agency can impact the target setting as well.
Target setting must also reflect external stakeholder interests. External stakeholders should include the general public, elected officials, agency partners and local jurisdictions, advocacy groups, and other third-party organizations. There is variation in the level of involvement across these stakeholders, but these varied perspectives should all have an impact on target setting.
Finally, the process of documenting the targets confirms the selected approach and justifies the final target implementation. Additionally, within the documentation, agencies should assign clear roles and responsibilities for who will be tasked with carrying out the selected actions. This should cover the on-the-ground staff who will be in charge of the relevant day-to-day operations of the agency, the program managers who are coordinating among multiple functional areas, the decision-makers who are empowered with the ability to provide resources for initiatives, and the leadership who is setting the strategic direction of the agency.


