Measuring Impacts and Performance of State DOT Resilience Efforts: A Guide (2025)
Chapter: 2 Developing Resilience Goals and Objectives and Selecting Performance Measures

CHAPTER 2
Developing Resilience Goals and Objectives and Selecting Performance Measures
The first phase of performance management involves setting a vision of what the agency hopes to accomplish by defining goals and objectives and then selecting performance measures that will be used to measure progress toward achieving those goals and objectives. Within the context of resilience planning, it is important for the agency to understand and define resilience within their unique physical and geographic context of assets, hazards, and changing future conditions. This chapter covers these foundational steps.
The chapter begins with key considerations for agencies to review when solidifying their understanding of resilience, including what hazard-threat pairs they face, the four Rs of resilience framework for how to think of resilience actions, the challenges of quantifying resilience, and the differences between when there is an internal and external impetus to address resilience. Then, with this understanding in mind, it describes how to set goals and objectives to accomplish the agencyʼs vision for resilience. Finally, it concludes with how to select performance measures to track progress toward achieving the goals and objectives.
At the end of this chapter, there are two pieces of illustrative content to help make tangible the guidance presented in this chapter. This includes an example table summarizing goals, objectives, and measures using the 13 RPMs from the compendium of RPMs. Next, there is an illustrative example drawing on a real-world long-range transportation plan (LRTP) from Illinois Department of Transportation (IDOT) showing how the guidance of this chapter may support agency processes.
2.1 Understanding Resilience Within an Agency Context
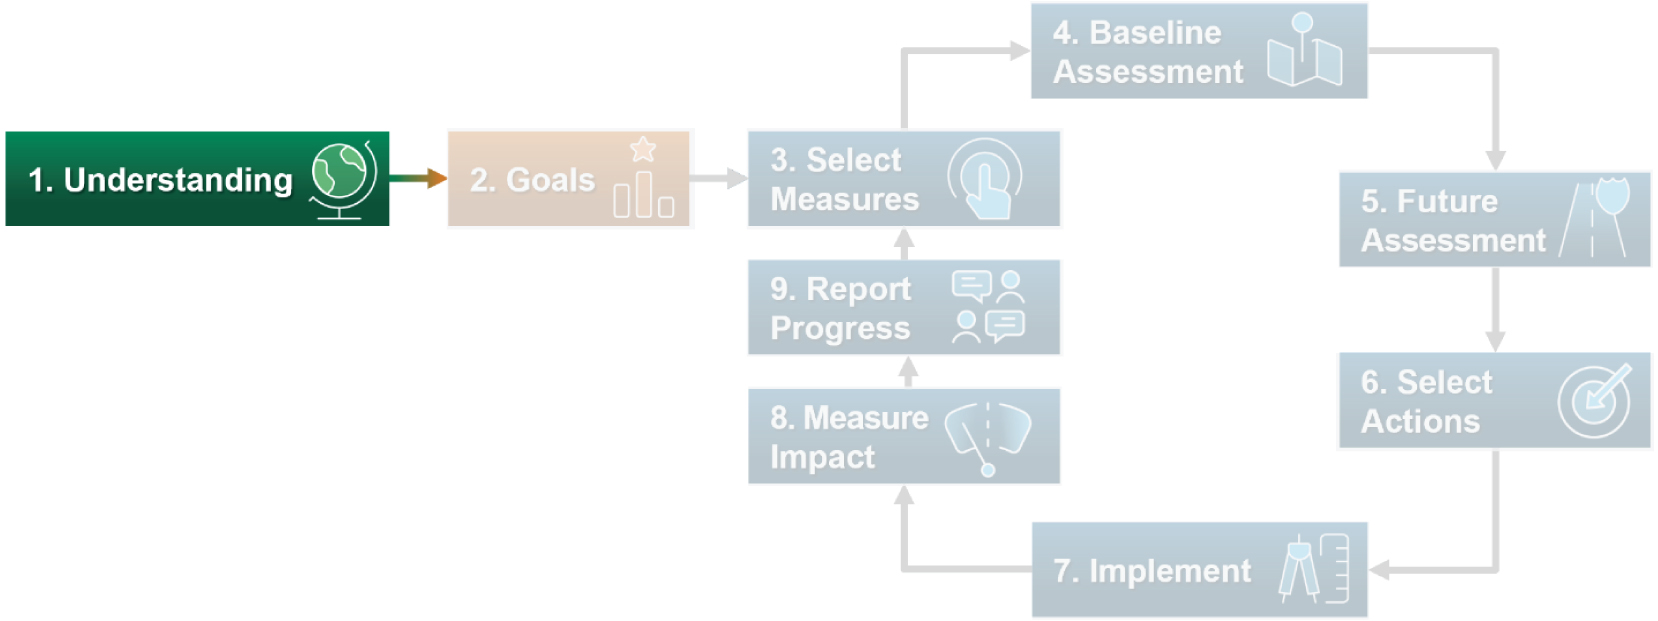
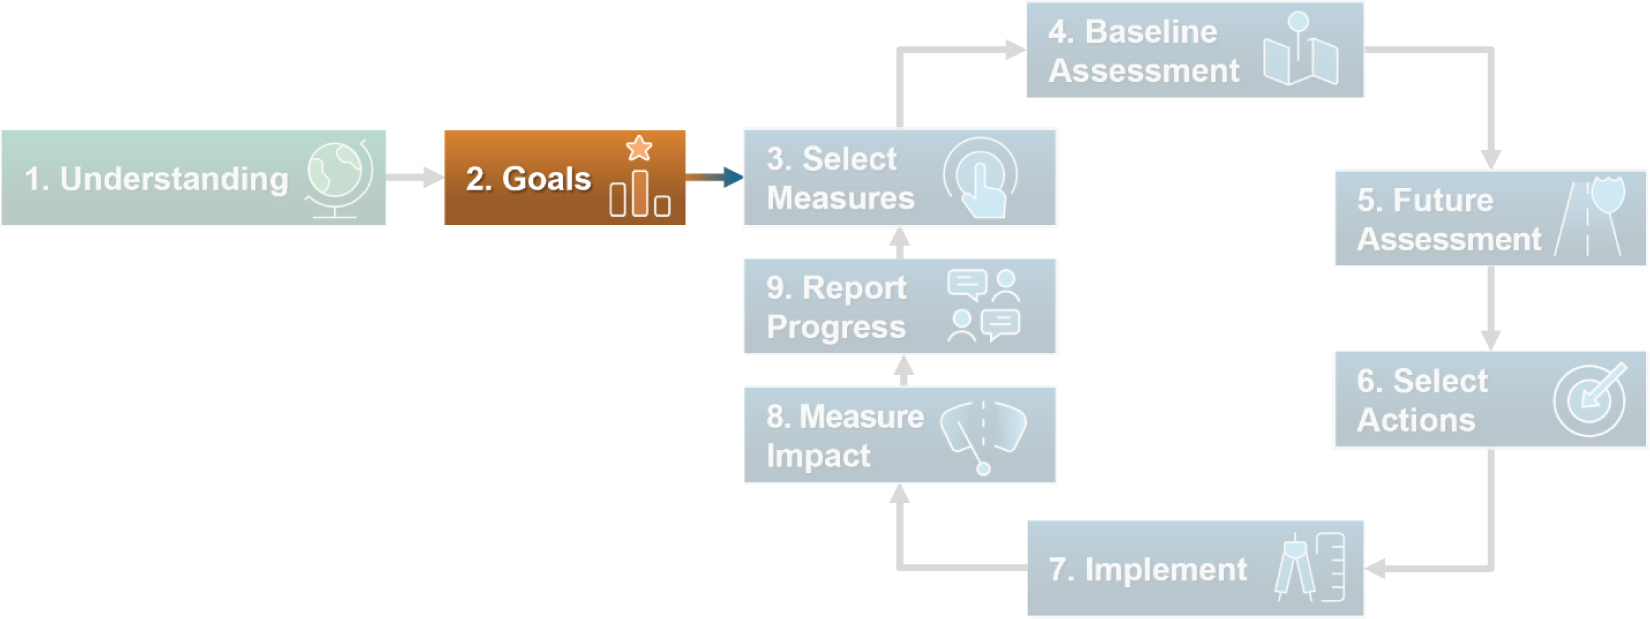
This section covers Step 1 of the SIM, where practitioners understand how defining resilience informs an agencyʼs function and mission (Figure 2.1).
The first step of measuring resilience is understanding resilience within the context of the agency. As a framework, resilience is most successful when it is a primary goal and mindset of an agency as well as a key factor in how projects are evaluated. But before resilience can be integrated into daily staff functions, job descriptions, DOT policy, and multiyear strategies, the DOT and their staff first need to understand what resilience means to their agency and how it manifests in their unique context.
A DOT may understand and define resilience as events that unfold around them; for example, a recurring hazard event like extreme heat or flooding or unpredictable events like severe storms and resultant storm surges. Alternatively, it could be the general acknowledgment that there are disruptions to the system due to changing climatic conditions. Because of diverse climates, geographies, topographies, politics, and so forth, the way resilience is understood and acted on varies across the country and, consequently, across agencies.
Long Description.
The implementation model consists of nine steps. They are: 1, Understanding. 2, Goals. 3, Select measures. 4, Baseline assessment. 5, Future assessment. 6, Select actions. 7, Implement. 8, Measure impact. 9, Report progress. The Step 1 'Understanding' is highlighted.
Assets and Hazards
If an agency has not shaped or established their unique understanding of resilience, transportation agency practitioners should begin by investigating the following:
- Which assets or elements of the system is your agency most concerned about?
- Which hazards or stressors are most likely to affect the agencyʼs assets and overall system?
The following definitions are from the U.S. Climate Resilience Toolkit:
- Assets are the people, infrastructure, and resources that your community wants to protect.
- Hazards are events or conditions that could injure people or damage assets.
- Stressors are conditions that make hazards more frequent or severe. There are climate stressors (e.g., rising sea levels or increasing frequency and intensity of droughts) and non-climate stressors (e.g., urbanization and imperviousness) (U.S. Climate Resilience Toolkit 2024).
To answer these questions, it may be helpful to map out the answers. The U.S. Climate Resilience Toolkit (2024) recommends filling out a matrix (like Table 2.1) to identify which transportation assets are exposed to specific hazards.
Using tools like the matrix and collaborating as an agency to answer the questions outlined previously can support staff and leadership in answering a fundamental question: Where do we (the agency) want to go, and how do we (practitioners) want to get there?
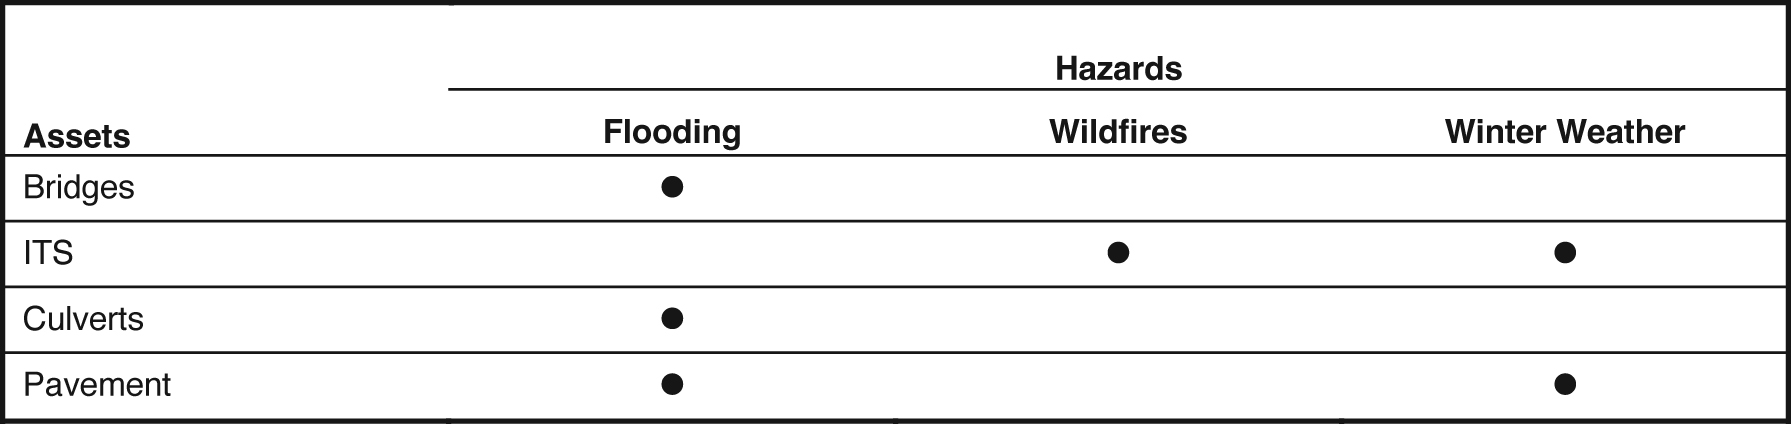
Source: Adapted from U.S. Climate Resilience Toolkit 2024.
Note: This table is illustrative and the assets (e.g., bridges, intelligent transportation systems (ITS), pavement, and culverts) chosen represent the ones considered in NCHRP Project 23-26.
Long Description.
The column headers are Assets and Hazards. The second column has three sub-columns of Flooding, Wildfires, and Winter Weather. The data given in the table row-wise are as follows: Row 1: Bridges: Dot; Blank; Blank. Row 2: ITS: Blank; Dot; Dot. Row 3: Culverts: Dot; Blank; Blank. Row 4: Pavement: Dot; Blank; Dot.
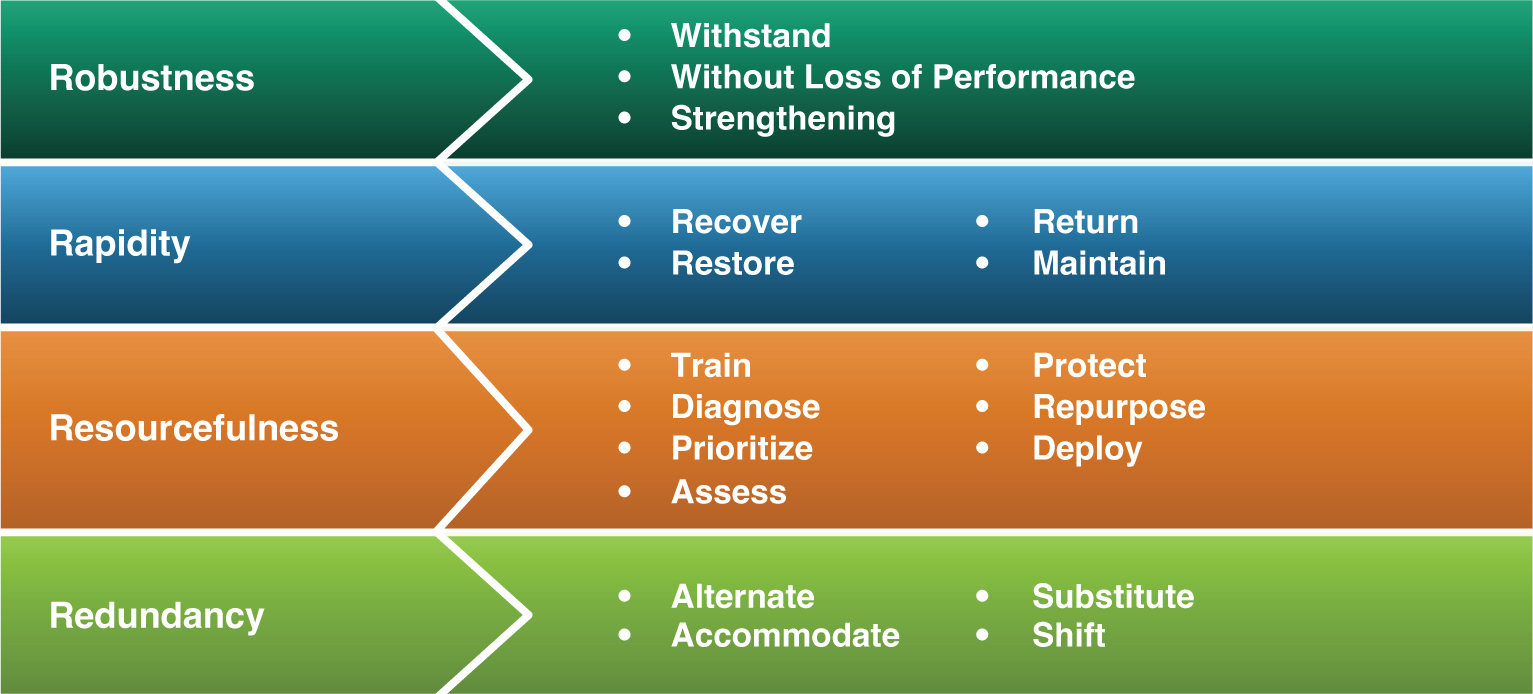
The Four Rs of Resilience
After developing an understanding of the assets, the hazards and stressors facing those assets, and the direction the agency wants to go, the next step is to categorize that direction according to the different components of resilience. There are multiple ways to conceptualize resilience, and this guide relies on Kathleen Tierneyʼs and Michael Bruneauʼs concept of the four Rs of resilience framework (Tierney and Bruneau 2007). This framework separates four distinct aspects of resilience:
- Robustness. The ability of systems, system elements, and other units of analysis to withstand disaster forces without significant degradation or loss of performance.
- Redundancy. The extent to which systems, system elements, or other units are substitutable, that is, capable of satisfying functional requirements, if significant degradation or loss of functionality occurs.
- Resourcefulness. The ability to diagnose and prioritize problems and to initiate solutions by identifying and mobilizing material, monetary, informational, technological, and human resources.
- Rapidity. The capacity to restore functionality in a timely way, containing losses and avoiding disruptions.
The four Rs framework is useful because it can help agencies better understand where their efforts are focused as well as help agencies standardize the measurement of resilience. Additionally, each of the four Rs corresponds to a different part of the resilience curve (see orange line) known as the resilience triangle (Figure 2.2). For example, how quickly an agency recovers functionality (fr) after a hazard is connected to the agencyʼs resourcefulness and ability to implement solutions.
The four Rs framework has grown in popularity. For FHWA public noticed proposed performance measures in 2024 for projects funded under the PROTECT Discretionary Grant Program, the four Rs framework is used within their resilience grants subsection (FHWA 2024c). This enables agencies to align their resilience project objectives under part(s) of the resilience curve. For example, projects that involve strengthening evacuation routes enhance robustness, while operational strategies that improve their recoverability address rapidity.
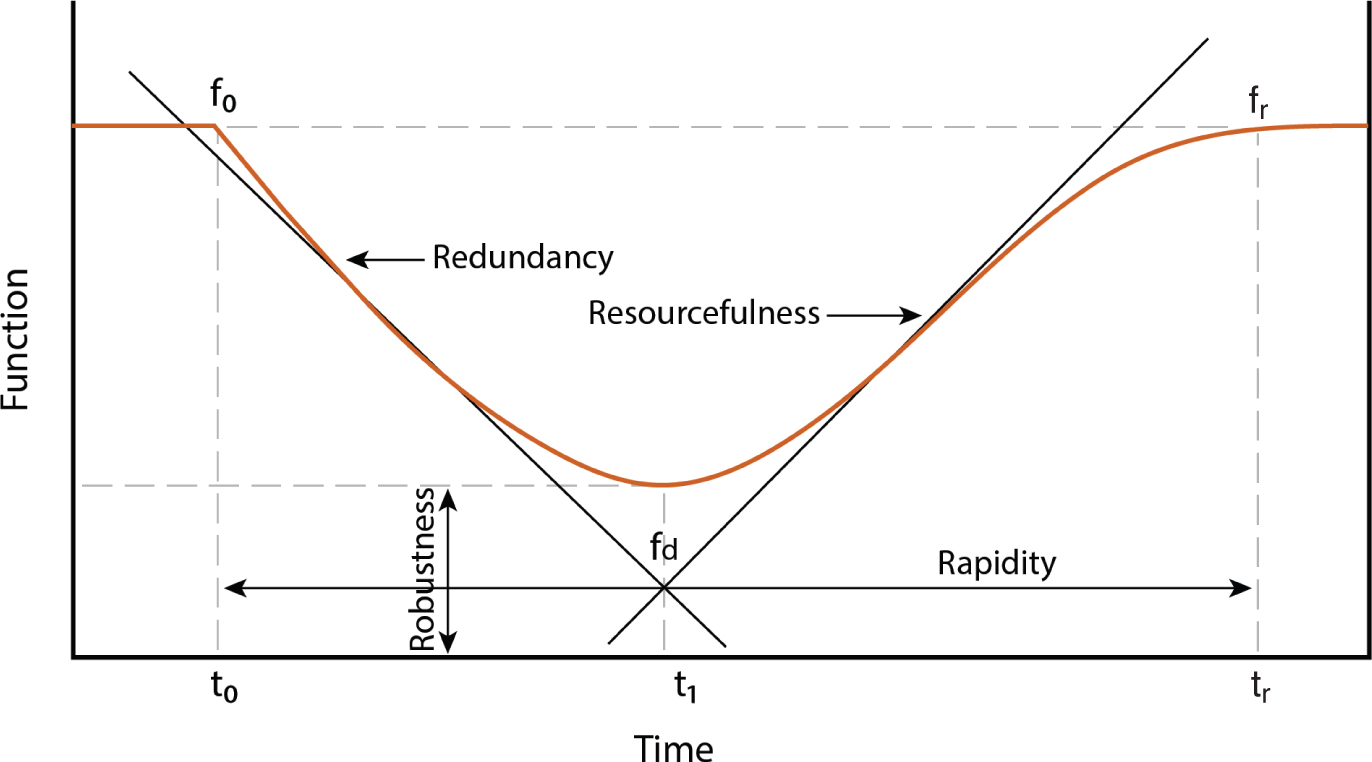
Source: Adapted from Simonovic and Arunkumar 2016.
Long Description.
The horizontal axis shows time with a scale of t sub 0, t sub 1, and t sub r. The vertical axis shows a function with no scale or unit. The graph shows three dotted vertical lines extending from t sub 0, t sub 1, and t sub r with endpoints of f sub 0, f sub d, and f sub r, respectively. The vertical line extending until f sub d is significantly shorter when compared to the lines of f sub 0 and f sub r. The graph consists of a curve and four lines. The curve begins as a steady line until f sub 0, then decreases to reach f sub d, and ends at f sub r. This forms a U-shaped dip. Two dotted horizontal lines are drawn along the lowest and highest points of the curve. The first line is a decreasing diagonal line labeled 'Redundancy' that passes through the vertical line extending from t sub 0, crosses f sub d, and ends before the x-axis. The second line is an increasing diagonal line labeled 'Resourcefulness' that passes through f sub d, extends further to cross the connecting line of f sub 0 and f sub r, and ends. These two diagonal lines intersect along the vertical line from t sub 1. The third line is a horizontal line drawn parallel to the x-axis along this intersection point. This line is labeled Rapidity. The fourth line is a vertical line that is drawn between the x-axis and the line drawn along the lowest point of the curve.
Quantifying Resilience
Quantifying resilience and resilience investments has been a key challenge in measuring resilience. Unlike other transportation disciplines (like safety and congestion), there is no single metric (e.g., crash rates or travel time reliability) that is directly related to the resilience of an asset, corridor, or system. This guide attempts to advance the ability to quantitatively measure resilience through the options presented in the compendium of RPMs. The purpose of quantifying resilience is to have an objective benchmark that can be used for an apples-to-apples comparison among different scopes of application (i.e., comparing assets to assets, or agency to agency). Given the limitations of relying on a single metric, agencies have developed different models that allow them to make such an apples-to-apples comparison across different resilience contexts.
For example, the European Commission developed a model to measure resilience using the resilience triangle (Figure 2.2) also called the resilience impact score (Garcia-Sanchez et al. 2023). This score is calculated based on the time of the event plus the time of the recovery (the x-axis on the resilience triangle), and the loss of functionality due to the impact on service and scale of damage (the y-axis of the resilience triangle), multiplied by a relative scale of impact. Table 2.2 provides an example of three asset-threat pairs used to illustrate the relative resilience impact.
This model provides the ability to assess the resilience of transportation infrastructure and helps determine where impacts are most felt to support comparison and prioritization. As seen
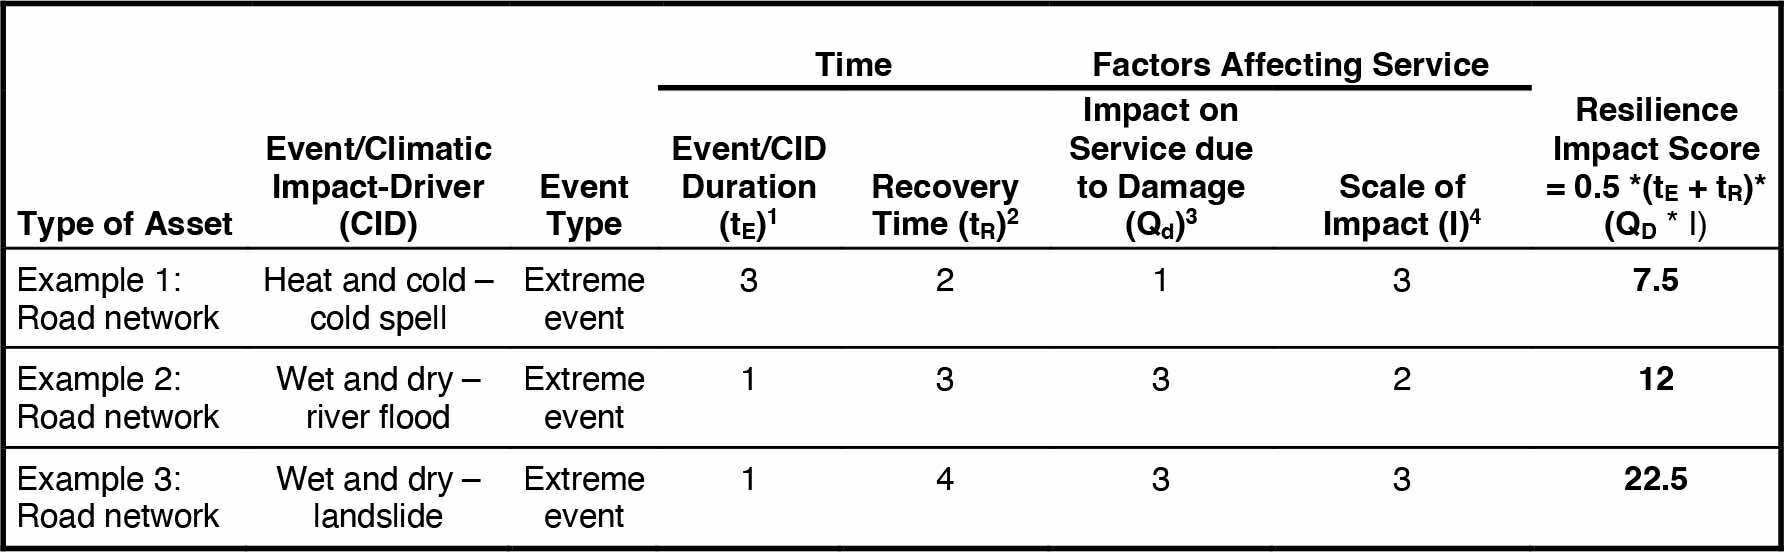
10: Instant; 1: < 6 hours; 2: < 1 day; 3: > 1 day.
20: no disruption; 1: < 1 day disruption; 2: < 1 week disruption; 3: < 1 month; 4: > 1 month.
30: No impact; 1: Small impact; 2: Medium impact; 3: Large impact.
41: Object; 2: Connection; 3: Network.
Source: Garcia-Sanchez 2023.
Long Description.
The table consists of six columns, with columns 4 and 5 having sub-columns. The column headers of the table are Type of Asset, Event or Climatic Impact-Driver (CID); Event Type; Time: Event or CID Duration (Duration of the event) superscript 1, Recovery time (Time taken to recover from the event) superscript 2, Factors Affecting Service: Impact on Service due to Damage (Quantitative damage to service) superscript 3, Scale of Impact (Scale or severity of the impact) superscript 4, Resilience Impact Score equals 0.5 asterisk (t subscript E plus t subscript R) asterisk (Q subscript D times I). The data given in the table row-wise are as follows: Row 1: Example 1: Road network; Heat and cold – cold spell; Extreme event; 3; 2; 1; 3; 7.5. Row 2: Example 2: Road network; Wet and dry – river flood; Extreme event; 1; 3; 3; 2; 12. Row 3: Example 3: Road network; Wet and dry – landslide; Extreme event; 1; 4; 3; 3; 22.5.
in Table 2.2, example asset-threat scenarios of roadway disruptions are compared by event duration, recovery time, service impacts from damage, and the scale of the impact. It illustrates that events like landslides with longer recovery periods and systemwide impacts have a greater impact than events with longer durations like cold spells. In this case, the agency may want to invest more resources in rapidity (ability to recover faster) and redundancy (ability for alternative routes/asset/modal substitution) in the face of certain climatic or hazard events.
Internal versus External Impetus
A key element of an agencyʼs resilience context is the impetus behind resilience investments. Whether the motivation comes from within the agency or outside the agency has a significant impact on the organization and culture around measuring resilience.
Some agencies, such as the Colorado DOT (CDOT), invested in developing quantitative risk assessment and reduction methodologies based on internal, leadership-led initiatives. These initiatives started in the context of rockfall and severe winter weather events that had significant impacts on their transportation system. CDOT invested considerably in staff capacity building and internal resilience initiatives, including a resilience program (Colorado Department of Transportation n.d.), a resiliency working group, and an executive oversight committee to help implement resilience across all aspects of agency operations (Colorado Department of Transportation 2021).
Other agencies, like the Minnesota DOT (MnDOT), are responding to external prompting via a legislative mandate (Minnesota State Statutes 174.01 and 174.03 Subd. 12). MnDOT developed measures related to culverts and the trunk highway system that measure condition, maintenance expenditures, and deployment of nature-based solutions. These measures were influenced by data they could easily collect and measure over time as well as staff capacity. Additionally, multiple functional areas were involved in the resilience performance management framework. For example, culvert condition data is often in the asset management group, while maintenance expenditure data is collected by operations and maintenance groups.
For agencies investing in resilience based on an internal impetus, practitioners should consider the extent to which their resilience context overlaps with external partners, such as the legislature and sister agencies. Practitioners may seek collaboration from both internal and external circles to compare mutually relevant goals and performance measures currently in place.
For agencies responding to an external request or requirement, certain elements of understanding resilience, goal setting, and objectives may be included in those requests. The practitioner can take that context and work internally to connect that overarching goal to the performance management efforts already happening and leverage ongoing efforts and data availability. At this point, the practitioner should also initiate channels for internal and external collaboration to determine what gaps are present and what is required to fill them.
2.2 Goals and Objectives
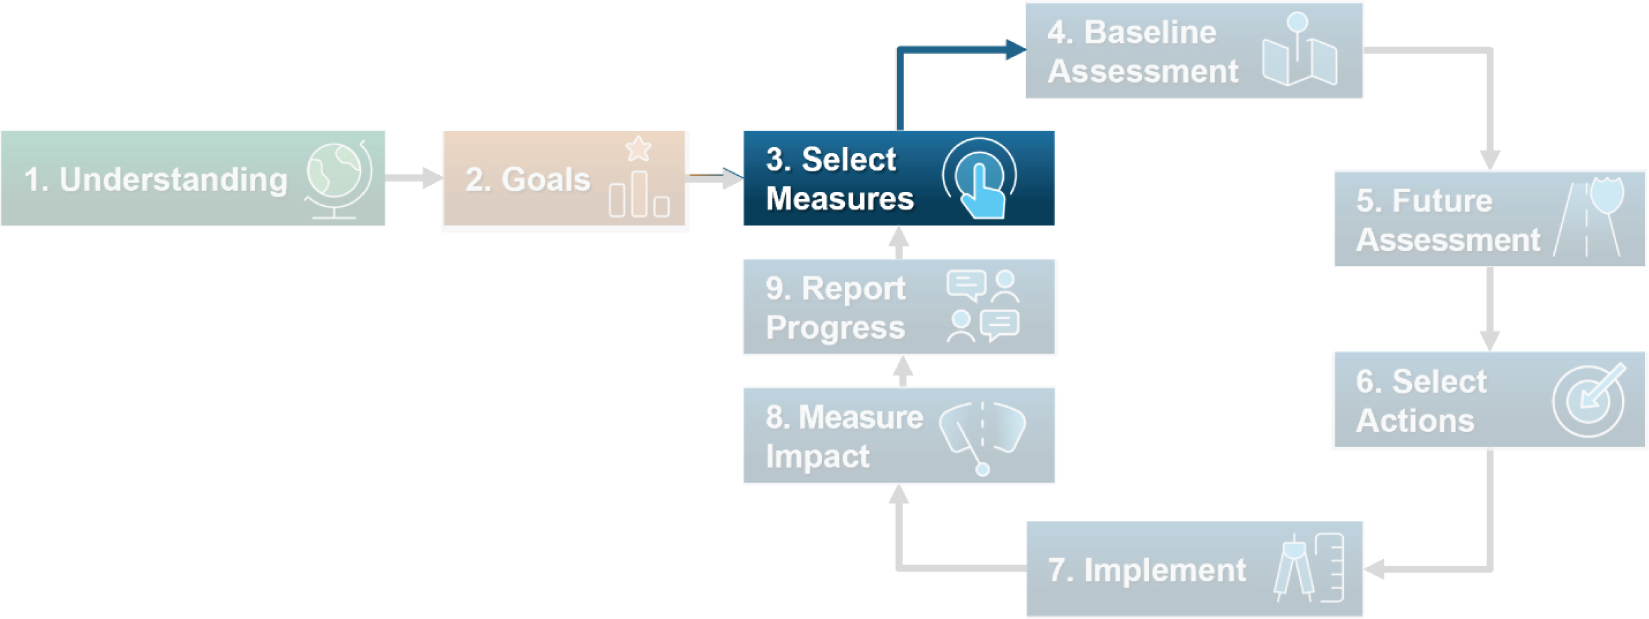
This section explains Step 2 of the SIM, where practitioners understand how goals and objectives provide a bedrock for developing and selecting performance measures (Figure 2.3).
Once agencies grasp the resilience context in which they operate, Step 2 of the SIM prompts practitioners to establish goals and objectives that envision where agencies want to be from a resilience perspective. These goals and objectives articulate their systemʼs needs along with desired outcomes, essentially to form a DOTʼs resilience goals and objectives. Through the creation of goals and objectives, agencies can set a foundation for future implementation actions that feasibly meet agency needs and enable performance measurement toward statewide goals.
Long Description.
The implementation model consists of nine steps. They are: 1, Understanding. 2, Goals. 3, Select measures. 4, Baseline assessment. 5, Future assessment. 6, Select actions. 7, Implement. 8, Measure impact. 9, Report progress. Step 2 'Goals' is highlighted.
Goals and objectives are defined by the FHWA in their Transportation Performance Management (TPM) Toolbox as follows (FHWA 2024b):
- Goals are broad statements of a desired end condition or outcome; a unique piece of the agencyʼs vision.
- Objectives are the specific, measurable statements that support the achievement of a goal.
Some of the foundational elements that these goals and objectives consider include the following:
- What is driving resilience efforts? Is it internal or external?
- What is being measured related to resilience thus far?
- How is resilience connected to the agencyʼs systemwide goals and objectives?
The answers to these questions can set a baseline or provide an access point to develop goals and objectives.
Integration with Other Agency Initiatives
Transportation agencies are complex organizations with several overlapping initiatives competing for staff time and resources. Many agencies have experience setting goals and objectives through the development of their long-range transportation plans (LRTPs) or other long-term planning initiatives, some agencies have been summoned by legislative authority (see Minnesota State Statutes 174.01 and 174.03 Subd. 12), while other agencies have been motivated through interagency or internal working groups.
State DOTs should ensure that their resilience goals and objectives align with the broader short- and long-term goals of the agency. This responsibility typically falls to organizational leadership, who should consider how resilience intersects with various functional areas and departments, fostering an environment that embraces change to achieve resilience objectives.
For individual practitioners, understanding how resilience aligns with short-term goals offers guidance for incorporating resilience into everyday project work and advancing the agencyʼs strategic vision. Internally, staff must recognize their role in meeting these goals and objectives and contributing to the agencyʼs mission.
Externally, goals and objectives must reflect regional priorities and the needs and desires of external stakeholders. The ability to communicate and set long-term goals supports progress evaluation and validates the investments that an agency chooses to make to both internal and external stakeholders.
(continued on next page)
Connecting Agency Goals and Objectives with the Four Rs
The language used in goals and objectives can also reflect which of the four Rs (associated with their primary connection) the agency is seeking to invest in. For example, if an agency is concerned with asset deterioration and is directing resources on planning studies and data purchases, their efforts may fall under resourcefulness. Whereas, if an agency was focused on relocating assets or raising roadway profiles, that would fall under robustness. As well, each R is often associated with key terms, as shown in Figure 2.4.
Long Description.
The key resilience goals are Robustness, Rapidity, Resourcefulness, and Redundancy. Each goal consists of the following objective terms. 1, Robustness: Withstand, Without loss of performance, and Strengthening. 2, Rapidity: Recover, Return, Restore, and Maintain. 3, Resourcefulness: Train, Protect, Diagnose, Repurpose, Prioritize, Deploy, and Assess. 4, Redundancy: Alternate, Substitute, Accommodate, and Shift.
In October 2023, as part of NCHRP Project 23-26, the research team conducted a stakeholder engagement workshop. At the workshop, practitioners were asked to tie their agencyʼs resilience goals and objectives into a Venn diagram of the four Rs (Figure 2.5). Most agencies placed their answers in the robustness category, followed by rapidity, resourcefulness, and redundancy, respectively. Notably, this exercise was conducted in part to show how intersectional the four Rs—and thus resiliency—can be. Many participants noted that they felt their agencyʼs goals and objectives overlapped with multiple Rs.
Community Resilience into Goals and Objectives
Similar to how resilience is an agency mindset, the integration of community resilience crosscuts agency processes and is a goal in and of itself. Akin to infrastructure resilience, community resilience is another lens through which practitioners can reflect on how their actions and
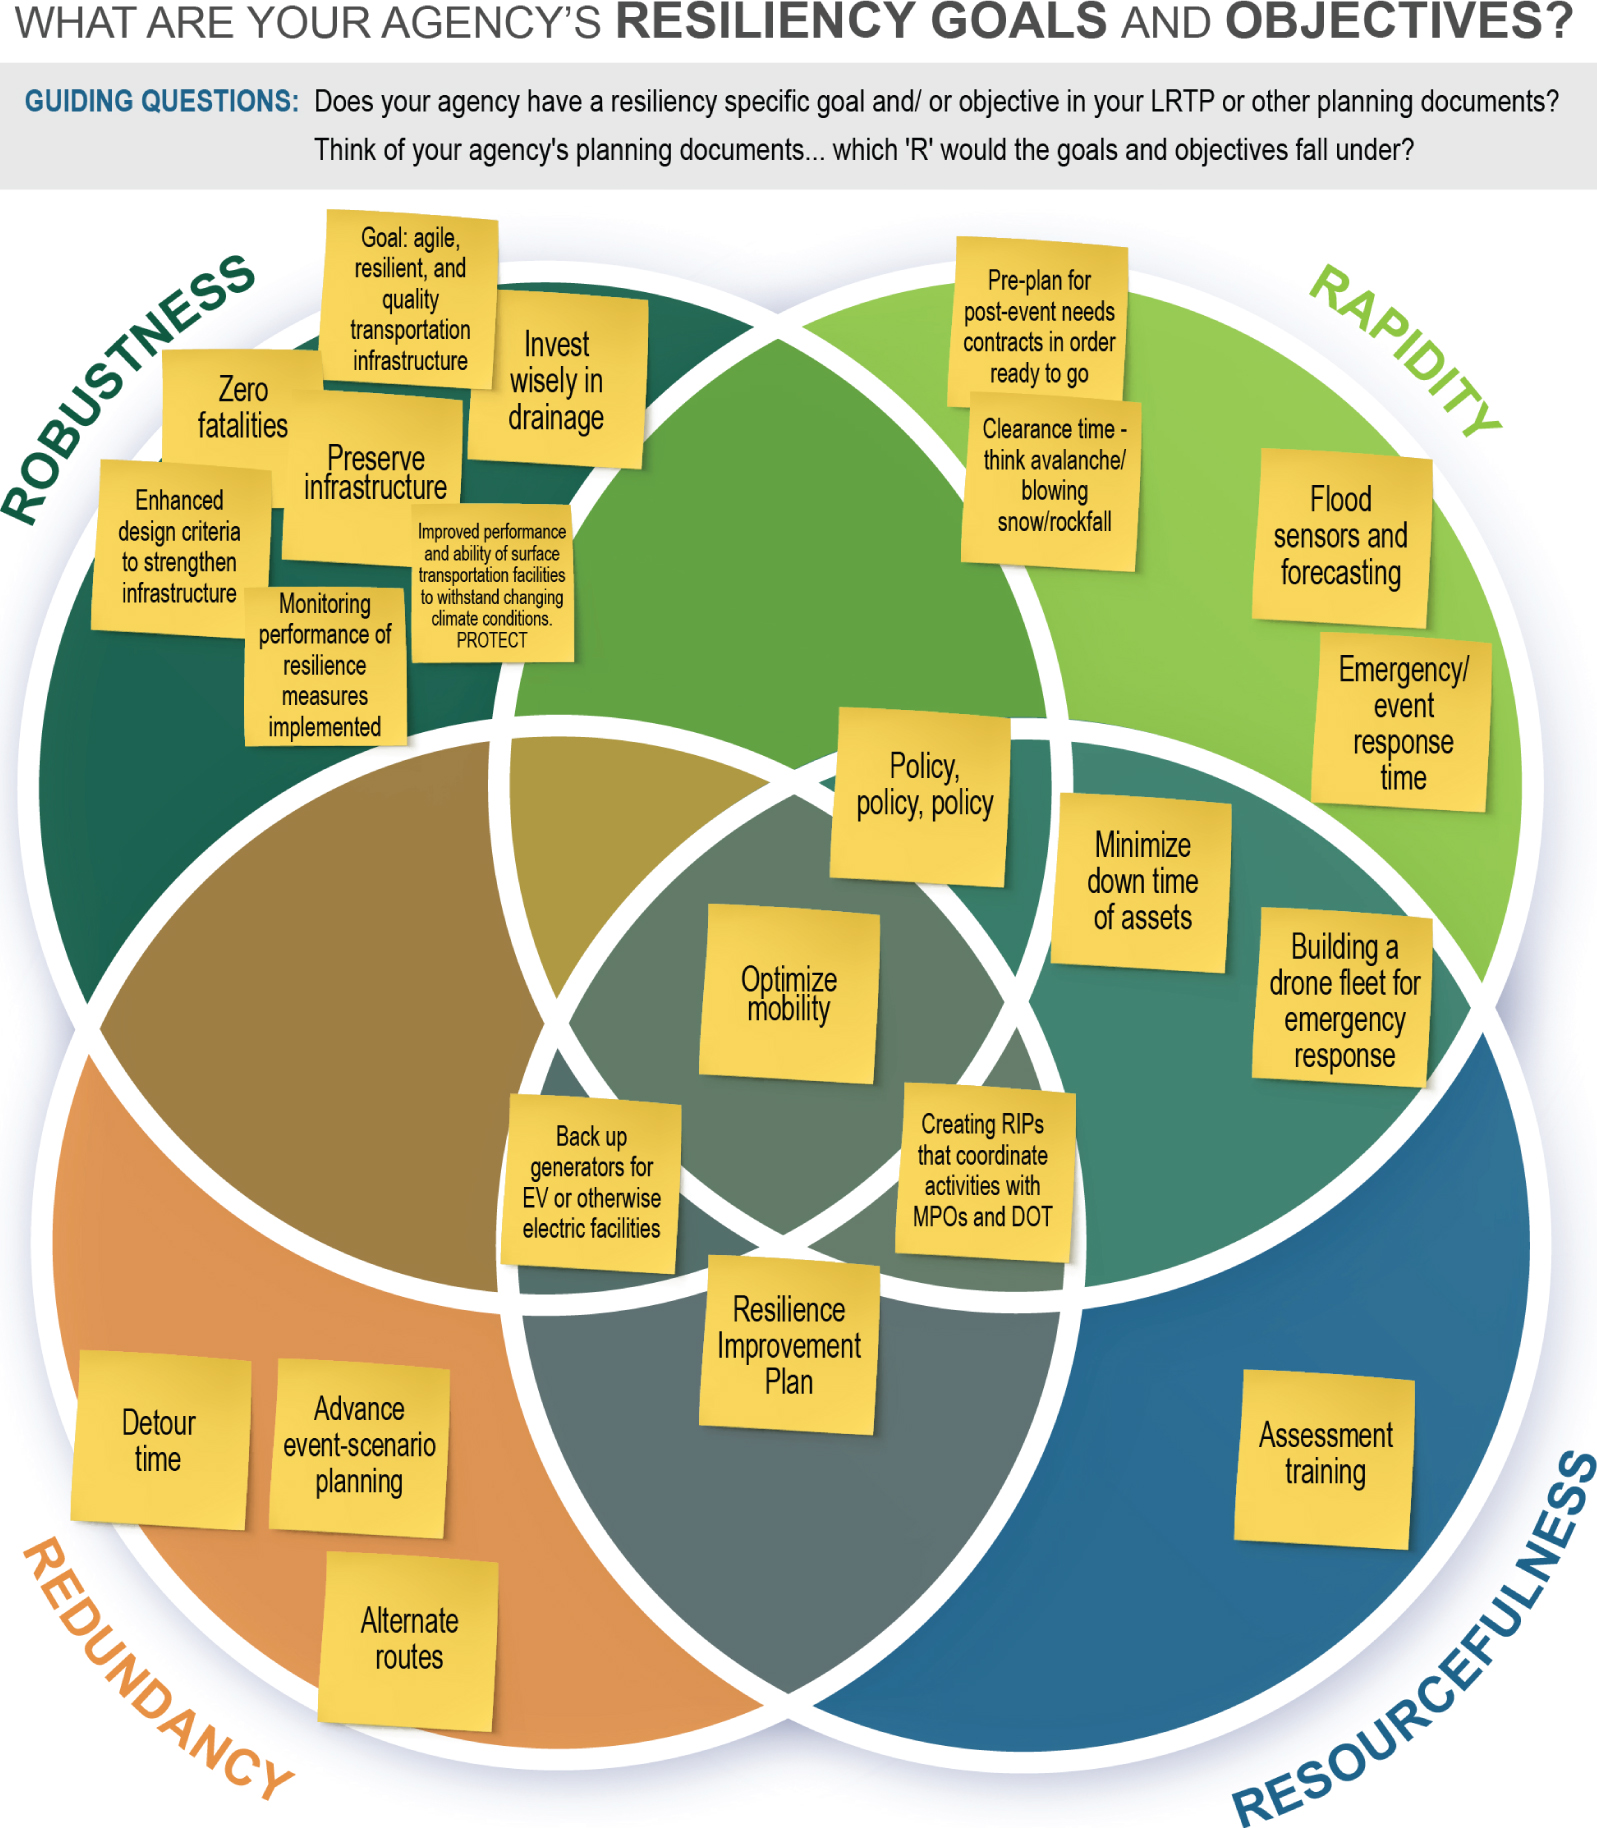
Source: NCHRP Project 23-26 Stakeholder Engagement Workshop, October 2023.
Long Description.
The Venn diagram consists of four circles intersecting with one another. The circles are titled Robustness, Redundancy, Rapidity, and Resourcefulness. Each circle consists of goals and objectives. They are as follows: 1, Robustness: Enhanced design criteria to strengthen infrastructure; Zero fatalities; Preserve infrastructure; Goal: agile, resilient, and quality transportation infrastructure; Invest wisely in drainage; Improved performance and ability of surface transportation facilities to withstand changing climate conditions, PROTECT; Monitoring the performance of resilience measures implemented. 2, Redundancy: Detour time; Advance event-scenario planning; Alternate routes. 3, Rapidity: Flood sensors and forecasting; Emergency or event response time; Pre-plan for post-event needs contracts in order to be ready to go; Clearance time - think avalanche or blowing snow or rockfall. 4, Resourcefulness: Assessment training. Intersections: 1, Robustness, Redundancy, and Resourcefulness: Back-up generators for EV or otherwise electric facilities. 2, Robustness, Rapidity, and Resourcefulness: Policy, Policy, Policy. 3, Rapidity and Resourcefulness: Minimize downtime of assets; Building a drone fleet for emergency response. 4, Rapidity, Redundancy, and Resourcefulness: Creating RIPs that coordinate activities with MPOs and DOT. 5, Redundancy and Resourcefulness: Resilience Improvement Plan. 6, Center Intersection (All Four Rs): Optimize mobility.
investments affect the system, its users, and internal decision-making. Because of this, practitioners have an opportunity to incorporate community resilience into their agencyʼs broader goals.
Articulating community resilience components within agency goals and defining them in ways that incorporate local context reaffirms the importance of the factors that are important to those communities. This includes community costs, multimodal services (e.g., transit), and additional socioeconomic factors that should be considered in resilience analyses like criticality assessments. Criticality refers to the overall importance of assets as components of a multimodal transportation system. Criticality assessments form an important foundation of vulnerability and risk-based assessments and support the prioritization of potential risks and investments based on their importance. Current examples of resilience goals often concentrate on ensuring resilience investments are uniformly distributed, affected communities are engaged, socioeconomic differences are addressed, and adaptation strategies are tailored to protect the most affected [American Planning Association (APA) n.d.]. In Appendix B, certain RPM templates include callouts of how the RPM fulfills community resilience needs. Many discuss analysis efforts where affected populations are engaged or identified to ensure planning efforts and investment are focused on at-risk areas and communities.
2.3 Selecting Performance Measures
The following sections discuss the transition from goals and objectives to selecting measures (Step 3) and describes influencing factors, like data availability, that may affect resilience performance management (Figure 2.6). These sections also describe in greater detail the compendium of RPMs (Appendix A).
Once goals and objectives have been defined, agencies can move to Step 3 of the SIM: selecting RPMs to track and evaluate progress toward their goals and objectives (Figure 2.6).
The outcomes and effectiveness of resilience improvements can be measured in several ways, such as level of service, improvements in mobility or travel time, and expanding agency resources
Long Description.
The implementation model consists of nine steps. They are: 1, Understanding. 2, Goals. 3, Select measures. 4, Baseline assessment. 5, Future assessment. 6, Select actions. 7, Implement. 8, Measure impact. 9, Report progress. Step 3 'Select Measures' is highlighted.
or process improvements. For example, MnDOT has a goal to “develop performance measures that describe if the trunk highway system is becoming more or less resilient.” To quantify their resilience improvements, MnDOT created RPMs that assess asset condition, deployment of nature-based solutions, and maintenance expenditures. One of the performance measures MnDOT proposed was “zero scour critical bridges on the trunk highway system.” This measure implies that fewer scour critical bridges means the system is more resilient. MnDOT is using bridge asset condition to extrapolate the level of asset and cumulative system resiliency.
Compendium of RPMs
To assist agencies in selecting which measures are tied to their goals and objectives, this guide presents a selection of measures in the compendium of RPMs (Table 2.3). These RPMs were compiled as part of NCHRP Project 23-26 based on a review of existing agency resilience initiatives, key assets that agencies are responsible for, including bridges, intelligent transportation systems (ITS), pavement, and culverts, and the hazards and threats that agencies are currently facing.
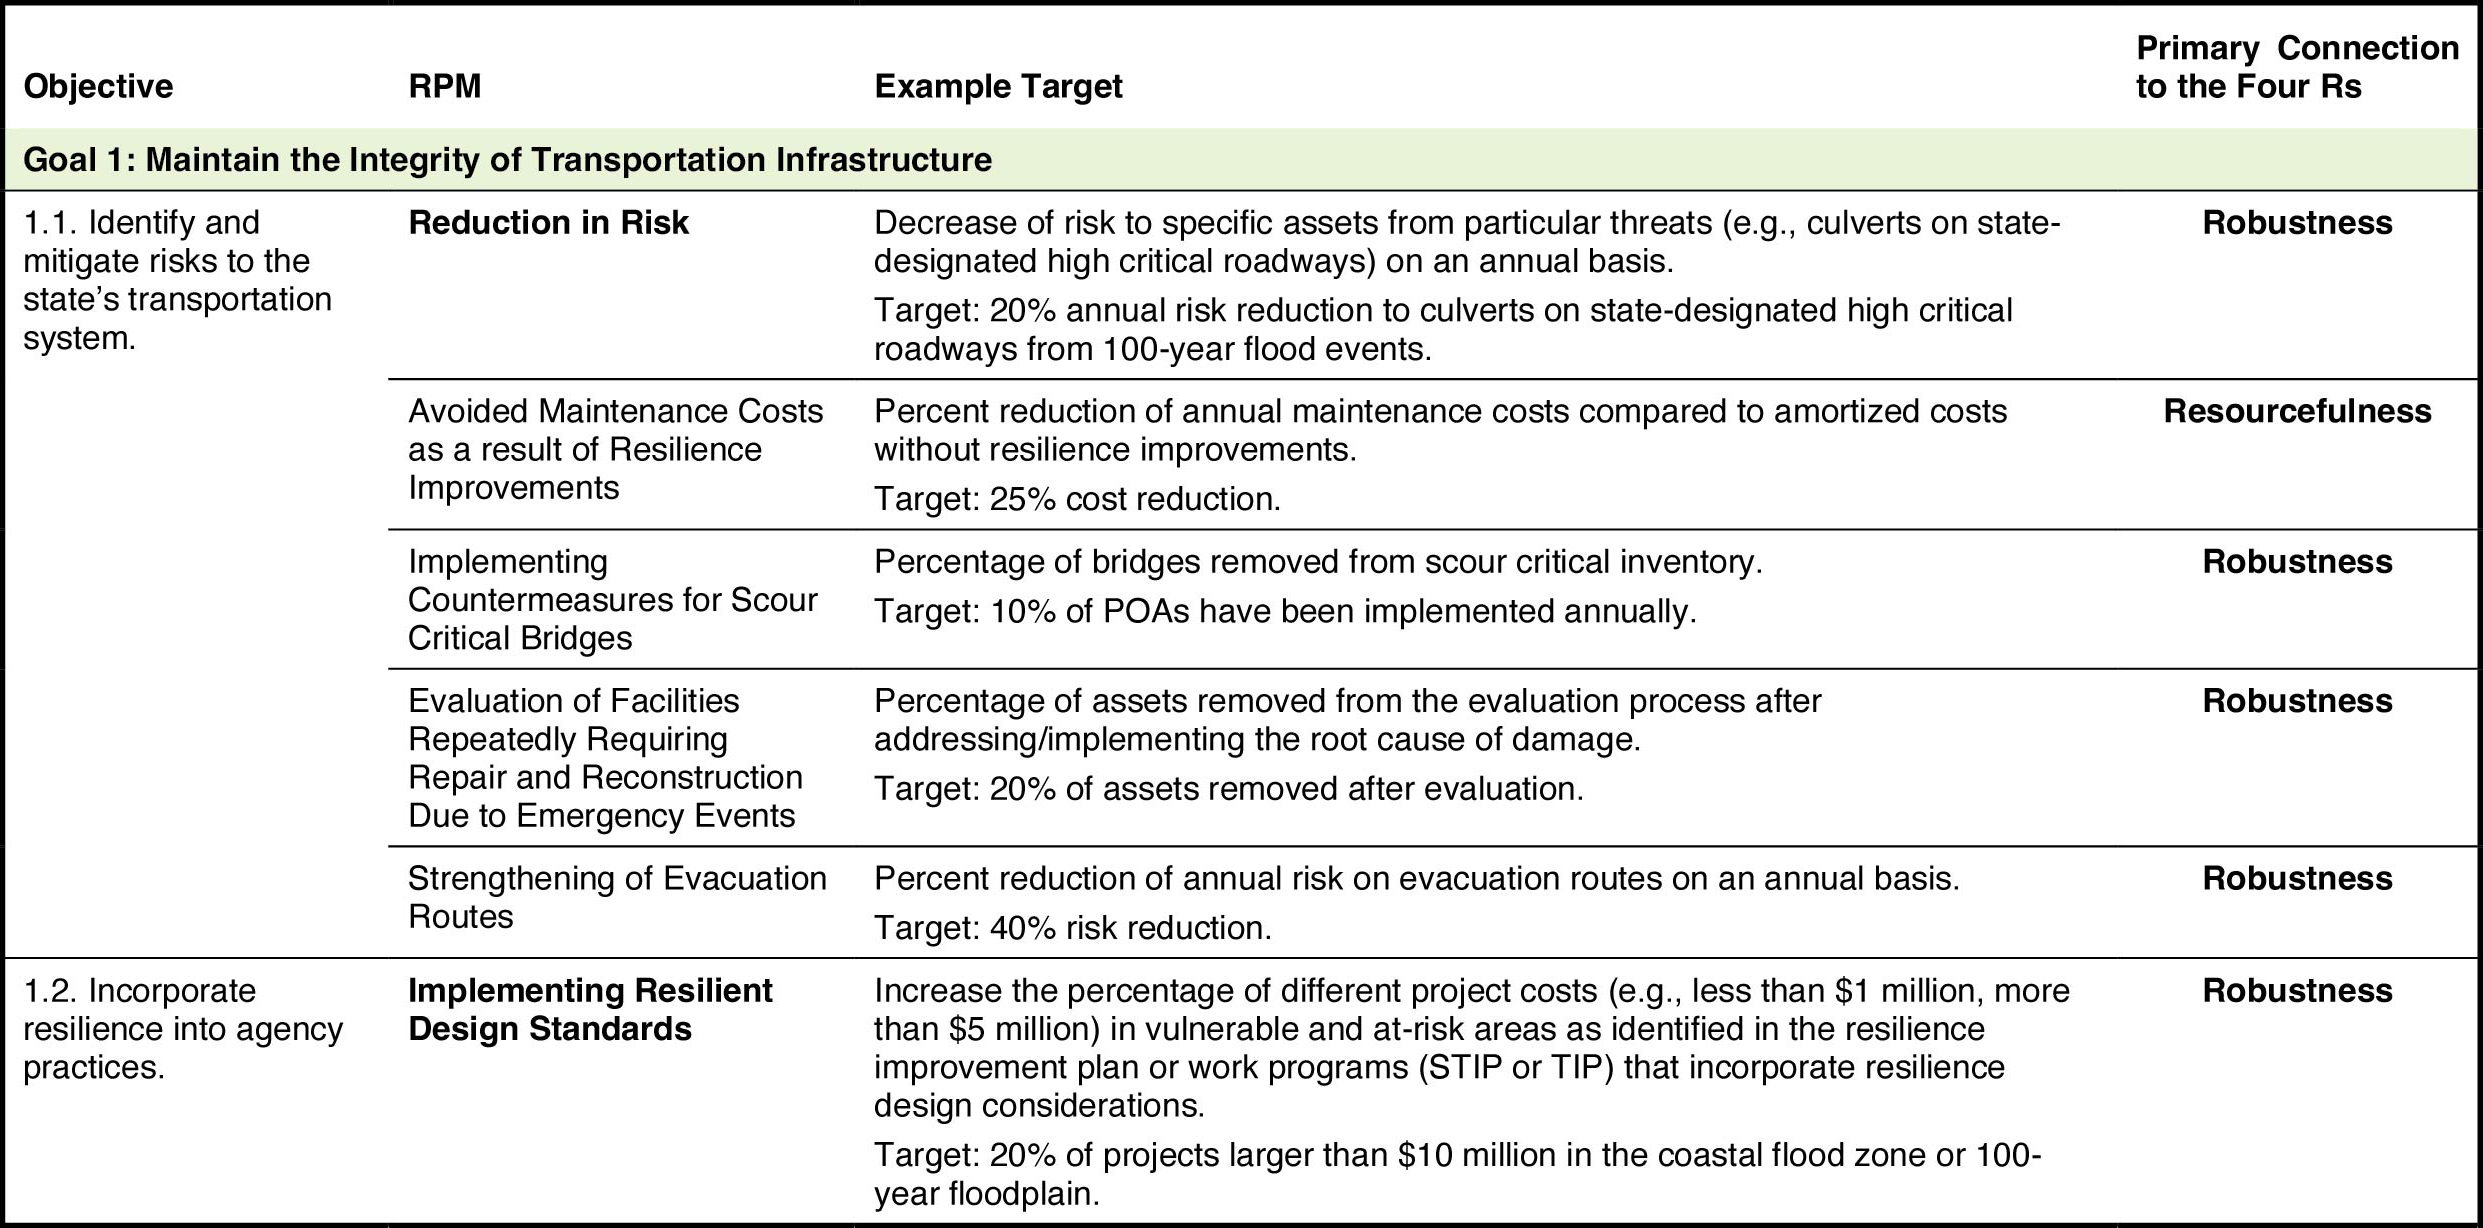
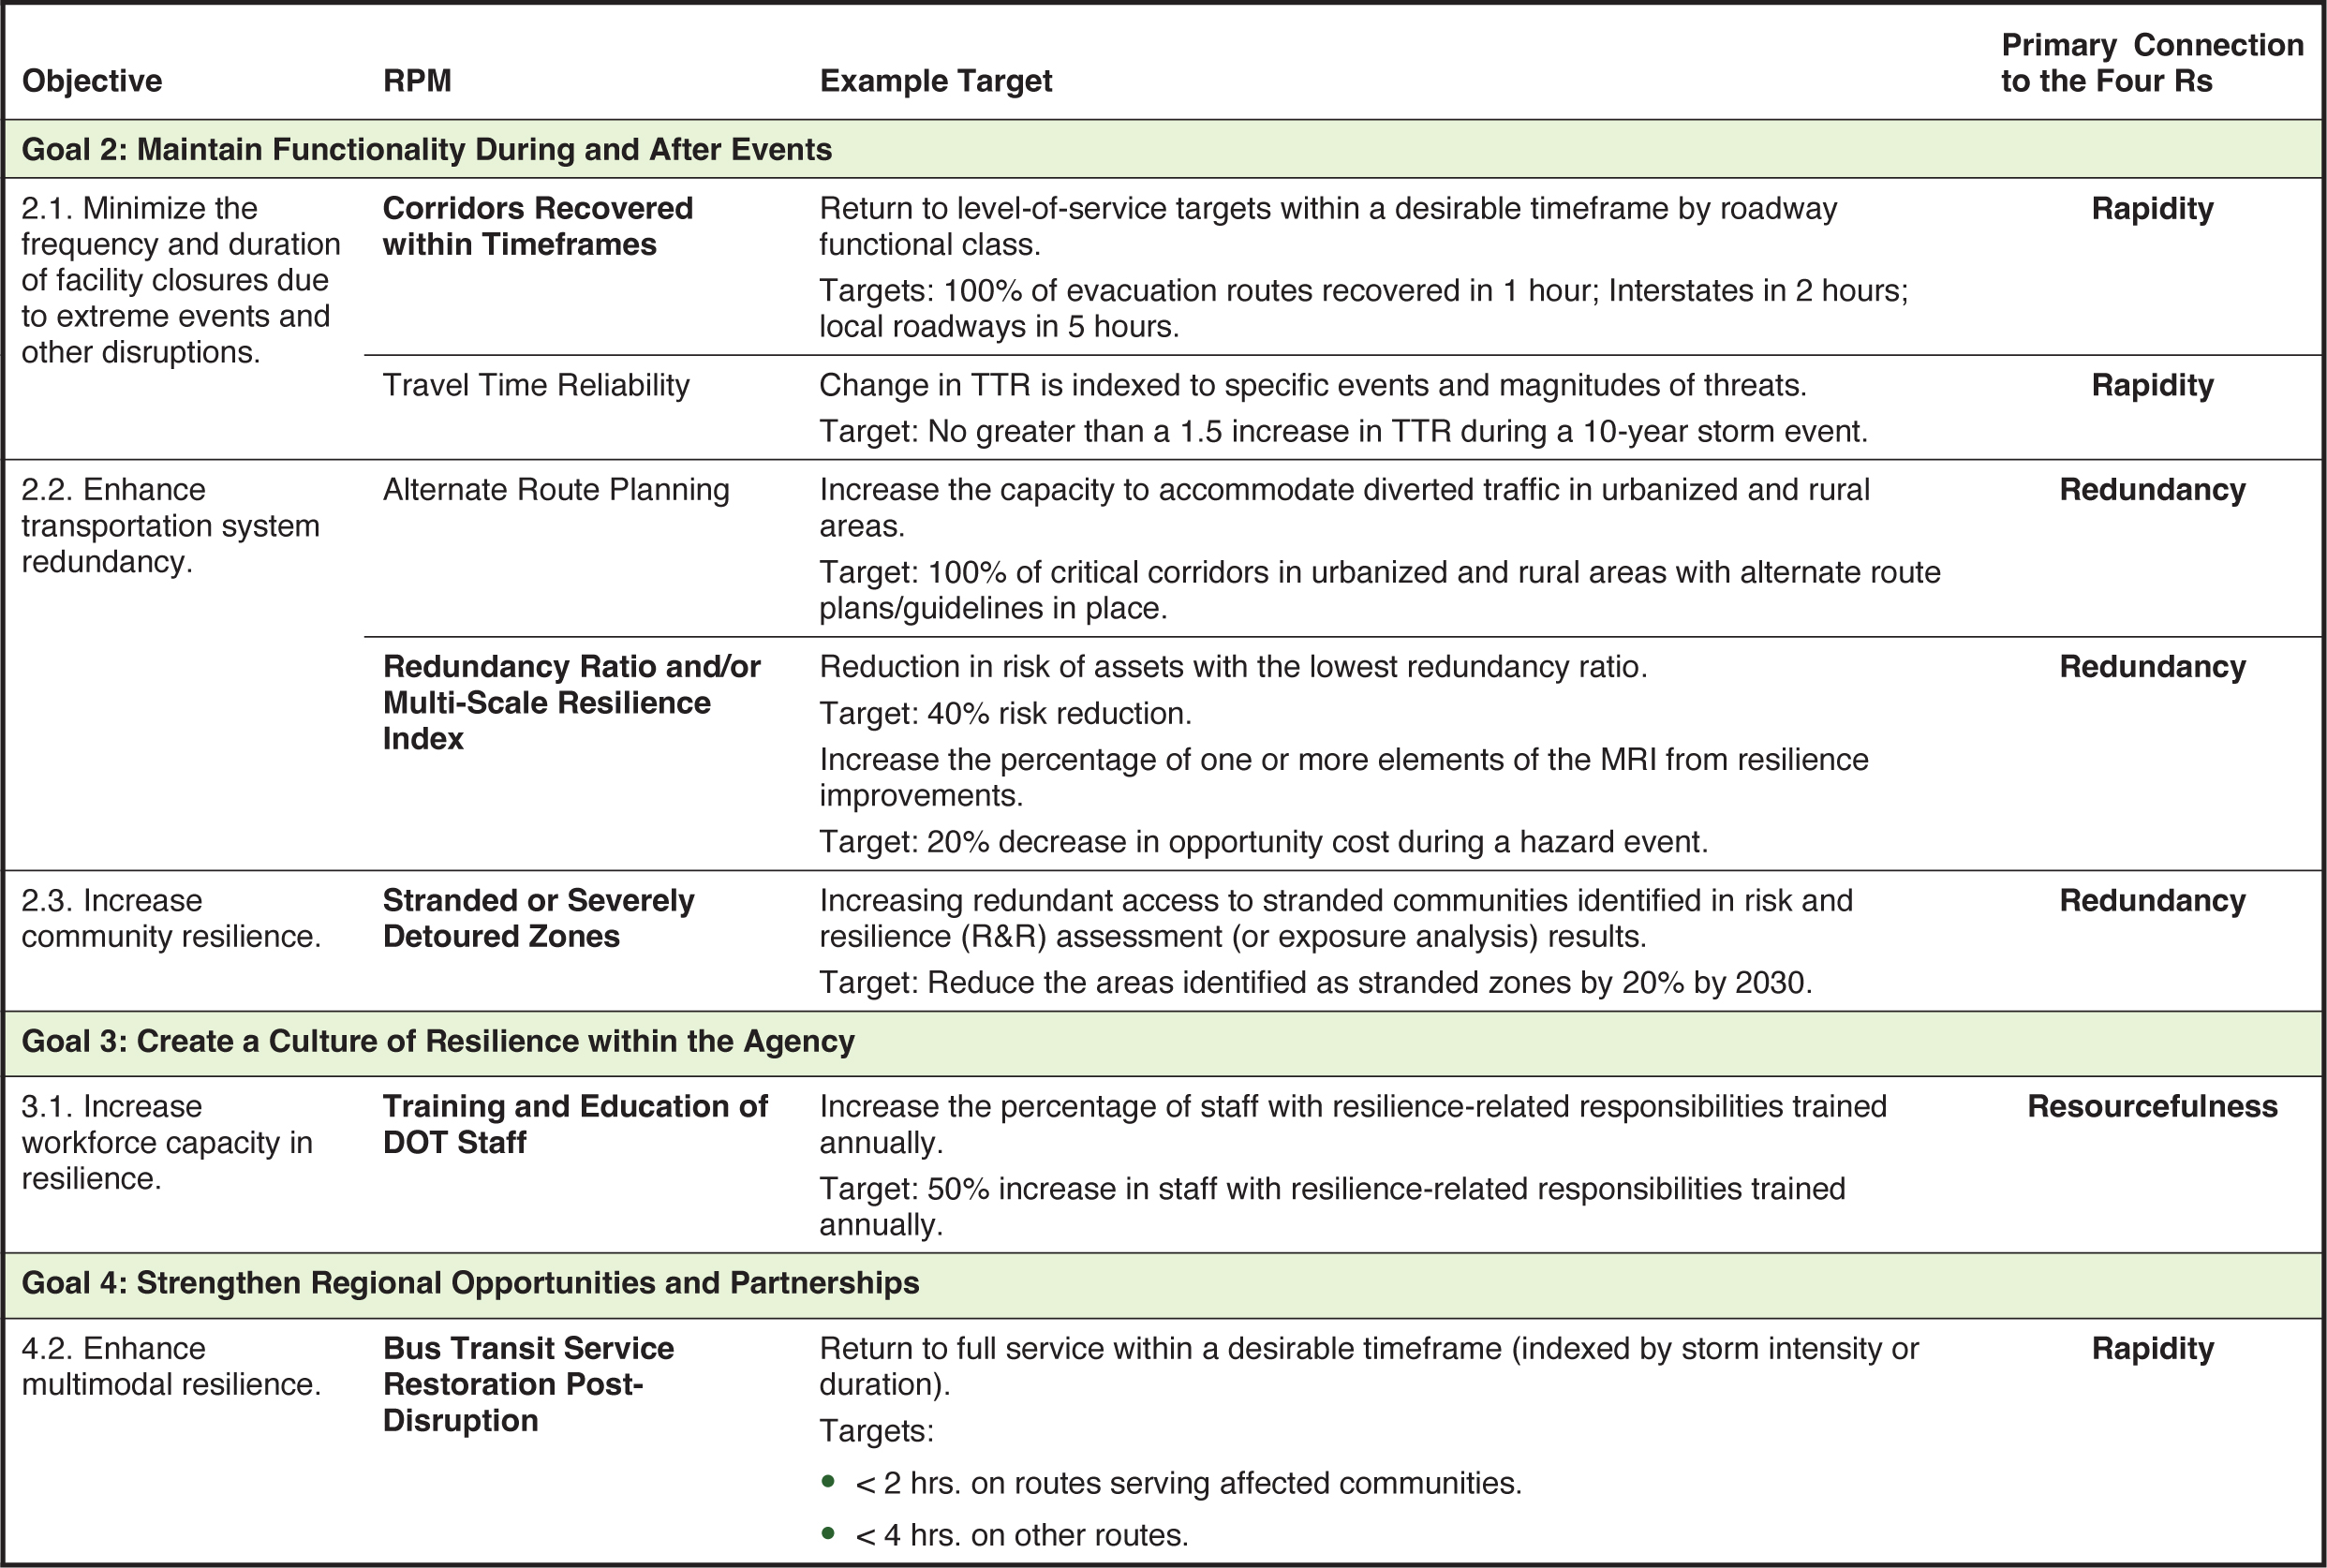
Chapter 2 includes two tables: Table 2.3 introduces the RPMs while Table 2.4 builds on Table 2.3, drawing the connection between RPMs, targets, and goals and objectives.
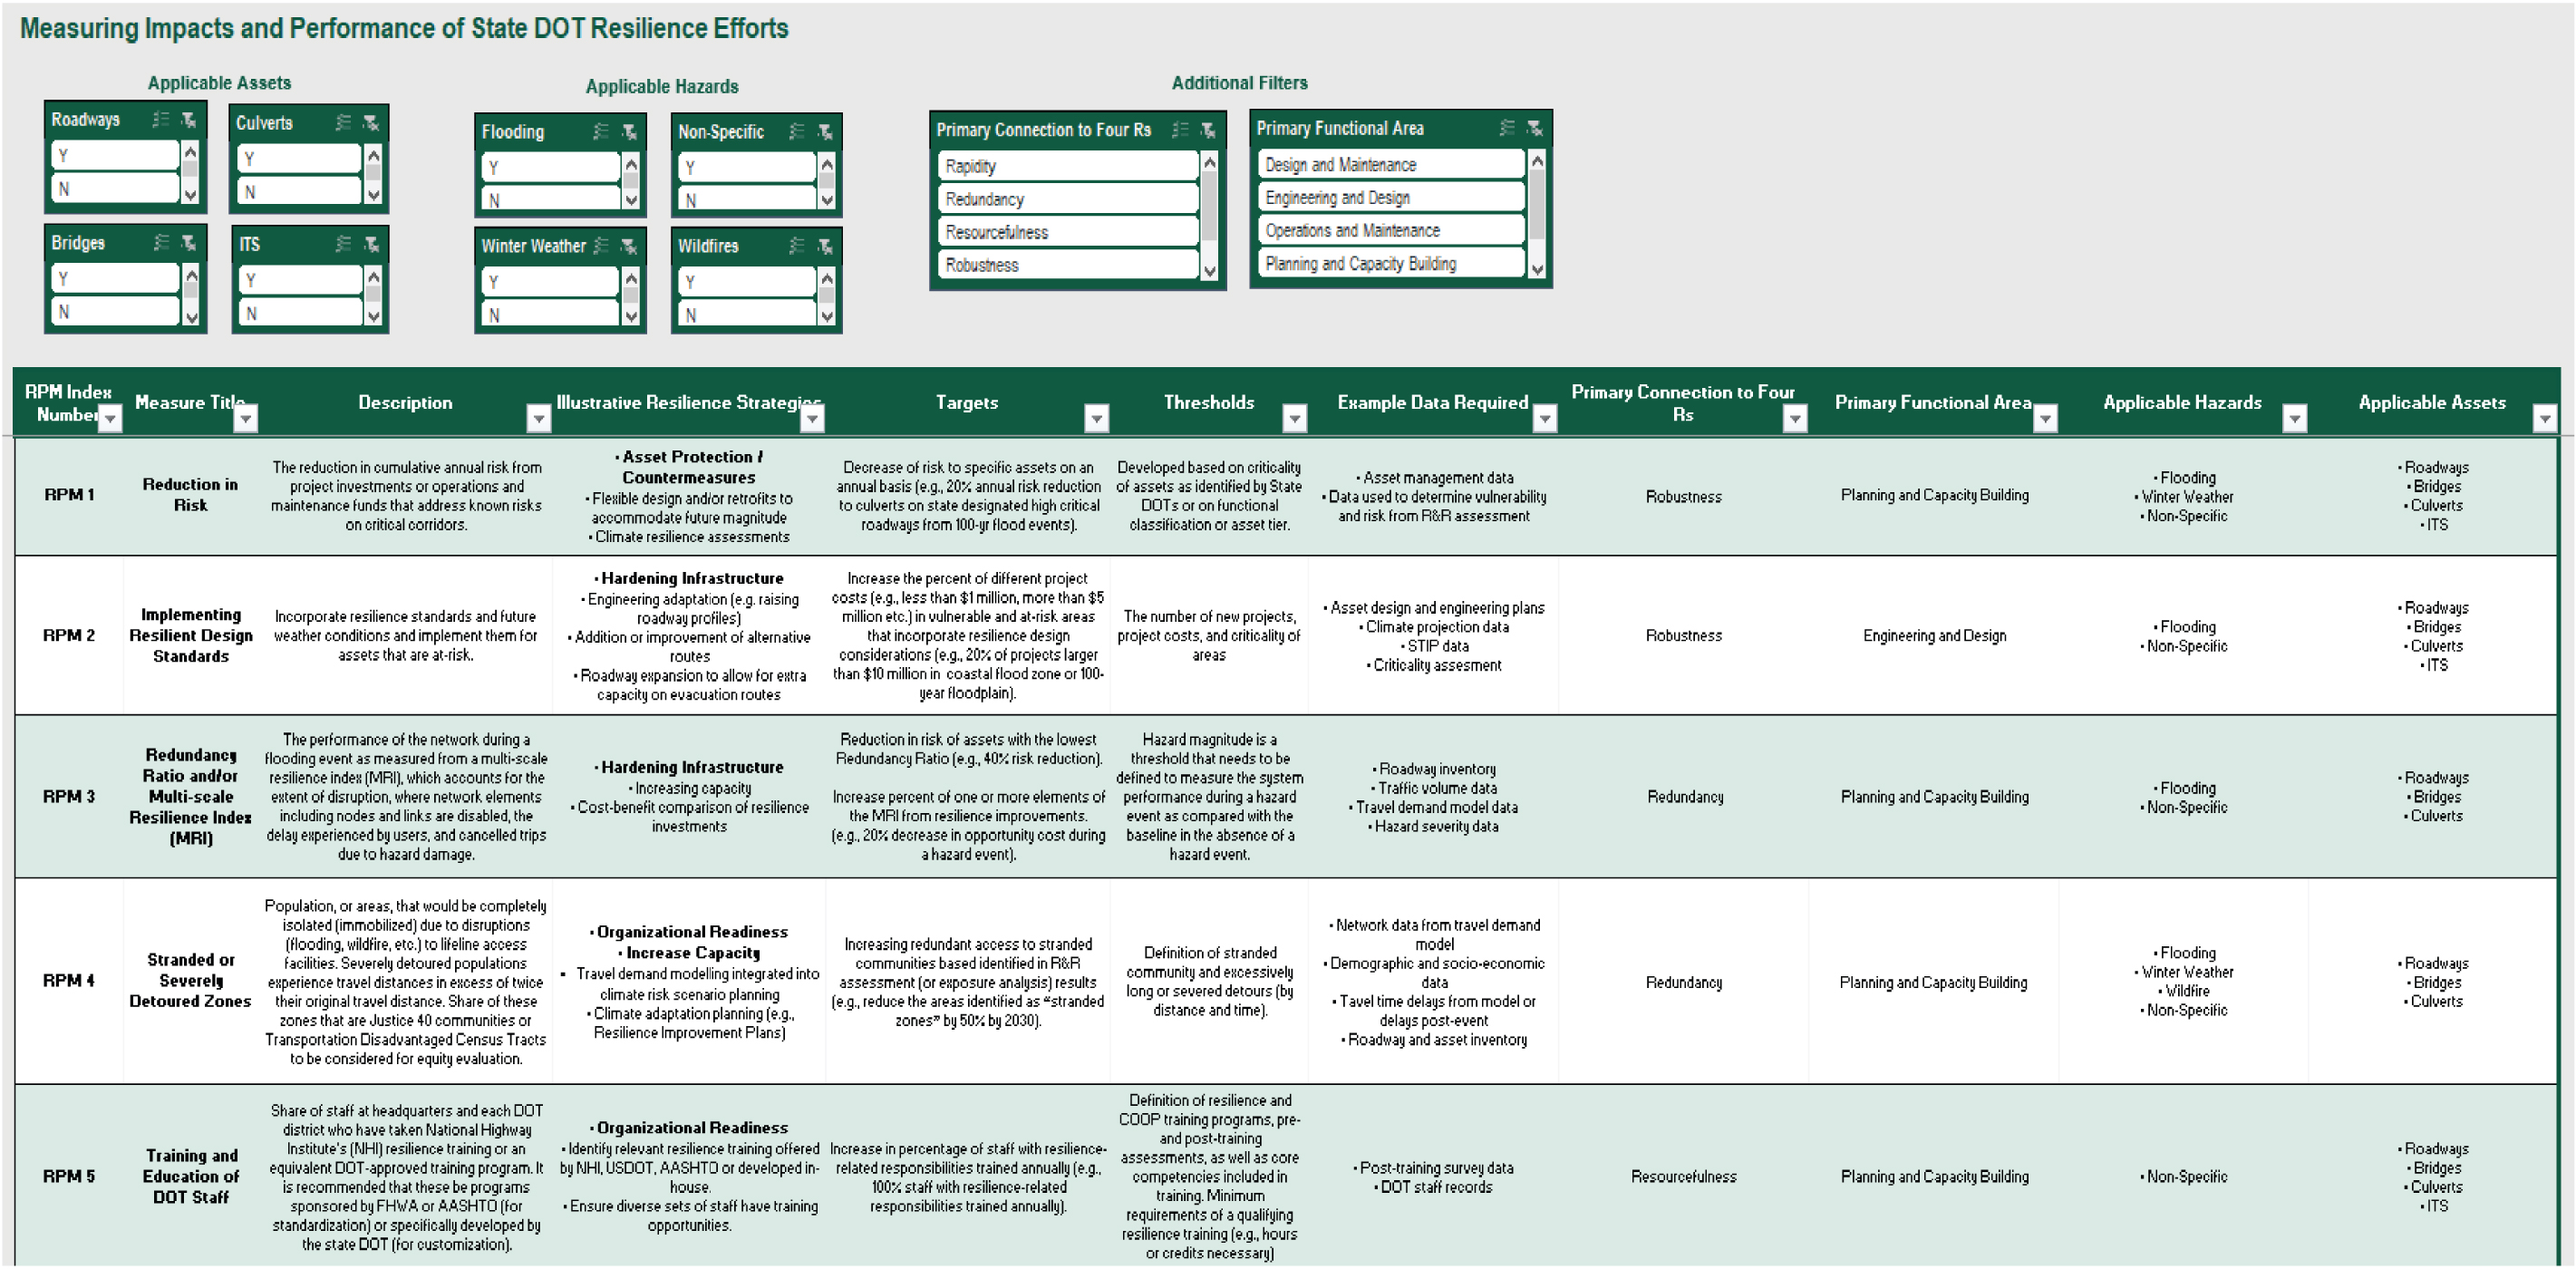
Additionally, the compendium of RPMs is expanded in a Microsoft Excel workbook that accompanies this guide. Figure 2.7 shows the Excel workbook layout. The workbook can be found on the National Academies Press website (nap.nationalacademies.org) by searching for NCHRP Research Report 1159: Measuring Impacts and Performance of State DOT Resilience Efforts: A Guide. The workbook has several features to help agencies select the appropriate RPMs:
- These RPMs are linked to a primary connection with the four Rs of resilience, though many RPMs can influence and be associated with more than one R.
- Each RPM is linked to one primary functional area of a DOT, including planning and capacity building, operations and maintenance, and engineering and design.
- Each RPM is also accompanied by the applicable hazards and threats that it can be used to measure. The majority of the RPMs can be applied to an array of climate hazards that affect system resilience to ensure that agencies are not limited in their application, while certain RPMs prioritize high-priority hazards such as inland and coastal flooding.
- Each RPM also lists the applicable assets to which the measure can be applied. The compendium includes many RPMs for roadway assets since DOTs manage the bulk of highway infrastructure.
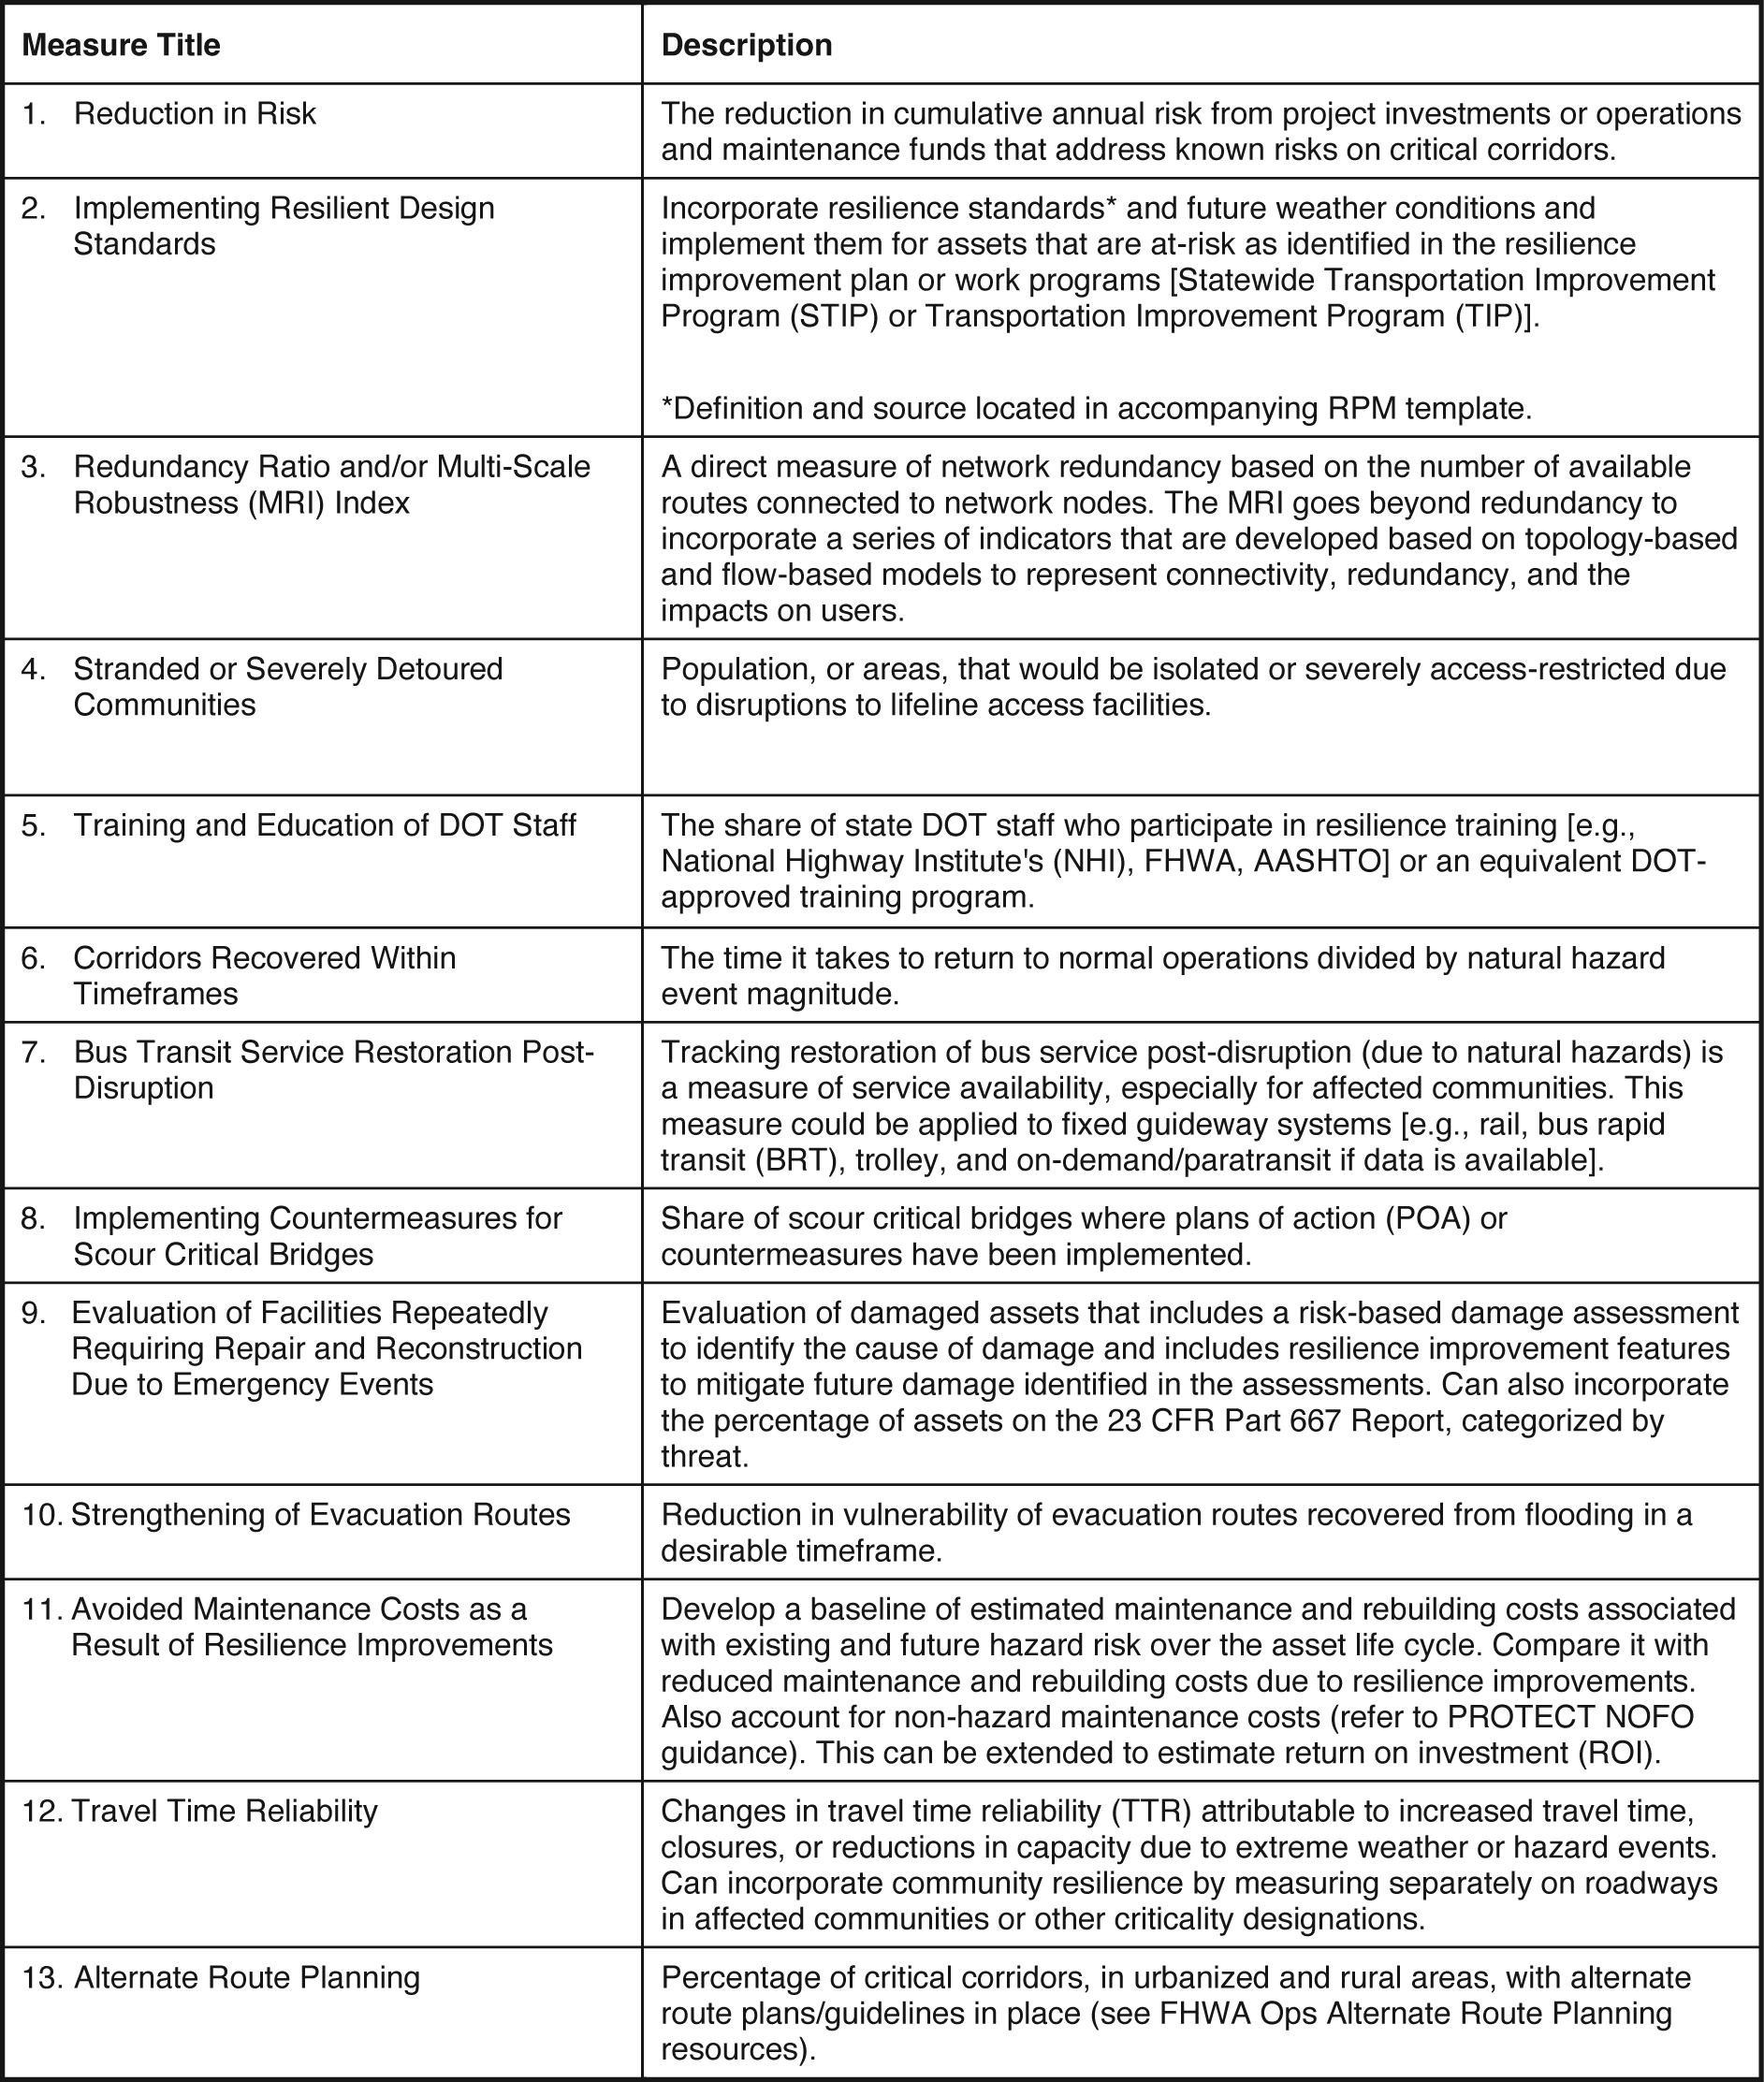
Long Description.
The column headers of the table are Measure Title and Description. The data given in the table row-wise are as follows: Row 1: Reduction in Risk: The reduction in cumulative annual risk from project investments or operations and maintenance funds that address known risks on critical corridors. Row 2: Implementing Resilient Design Standards: Incorporate resilience standards asterisk and future weather conditions and implement them for assets that are at-risk as identified in the Resilience Improvement Plan or work programs (STIP or TIP). Asterisk definition and source located in accompanying RPM template. Row 3: Redundancy Ratio and or Multi-Scale Robustness (MRI) Index: A direct measure of network redundancy based on the number of available routes connected to network nodes. The MRI goes beyond redundancy to incorporate a series of indicators that are developed based on topology-based and flow-based models to represent connectivity, redundancy, and the impacts on users. Row 4: Stranded or Severely Detoured Communities: Population, or areas, that would be isolated or severely access-restricted due to disruptions to lifeline access facilities. Row 5: Training and Education of DOT Staff: The share of state DOT staff who participate in resilience training (e.g., National Highway Institute's (NHI), FHWA, AASHTO) or an equivalent DOT-approved training program. Row 6: Corridors Recovered Within Timeframes: The time it takes to return to normal operations divided by natural hazard event magnitude. Row 7: Bus Transit Service Restoration Post-Disruption: Tracking restoration of bus service post-disruption (due to the result of natural hazards) is a measure of service availability, especially for affected communities. This measure could be applied to fixed guideway systems, e.g., rail, BRT, trolley, and on-demand or paratransit if data is available. Row 8: Implementing Countermeasures for Scour Critical Bridges: Share of scour critical bridges where plans of action (POA) or countermeasures have been implemented. Row 9: Evaluation of Facilities Repeatedly Requiring Repair and Reconstruction Due to Emergency Events: Evaluation of damaged assets that include a risk-based damage assessment to identify the cause of damage and include included resilience improvement features to mitigate future damage identified in the assessments. Can also incorporate percent of assets on Part 667 Report, categorized by threat. Row 10: Strengthening of Evacuation Routes: Reduction in vulnerability of evacuation routes recovered from flooding in a desirable timeframe. Row 11: Avoided Maintenance Costs as a Result of Resilience Improvements: Develop a baseline of estimated maintenance and rebuilding costs associated with existing and future hazard risk over the asset lifecycle. Compare it with reduced maintenance and rebuilding costs due to resilience improvements. Also account for non-hazard maintenance costs (refer to PROTECT NOFO guidance). This can be extended to estimate return on investment (ROI). Row 12: Travel Time Reliability Changes in Travel Time Reliability (TTR) attributable to increased travel time, closures, or reductions in capacity due to extreme weather or hazard events. Can incorporate community resilience by measuring separately on roadways in affected communities or other criticality designations. Row 13: Alternate Route Planning: Percent of critical corridors, in urbanized and rural areas, with alternate route plans or guidelines in place (see FHWA Ops Alternate Route Planning resources).
(continued on next page)
Source: Adapted from Chapter 3 of the North Carolina Department of Transportation 2023–2025 Strategic Plan (North Carolina Department of Transportation 2022).
Note: RPMs in bolded type indicate that an RPM is also featured as an RPM example in Appendix B.
Long Description.
The column headers of the table are Objective, RPM, Example Target, and Primary Connection to Four Rs. The rows have sub-rows. The data given in the table row-wise are as follows: Row 1: Goal 1: Maintain Integrity of Transportation Infrastructure: Sub-row 1: 1. Identify and mitigate risks to the State’s transportation system: Reduction in Risk: Decrease of risk to specific assets from particular threats (e.g., culverts on state designated high critical roadways) on an annual basis; Target: 20 percent annual risk reduction to culverts on state designated high critical roadways from 100-year flood events; Robustness; Avoided Maintenance Costs as a result of Resilience Improvements; Percent reduction of annual maintenance costs compared to amortized costs without resilience improvements; Target: 25 percent cost reduction; Resourcefulness; Implementing Countermeasures for Scour Critical Bridges; Percentage of bridges removed from scour critical inventory; Target: 10 percent of Plans of Action (POAs) have been implemented annually; Robustness; Evaluation of Facilities Repeatedly Requiring Repair and Reconstruction due to Emergency Events; Percentage of assets removed from the evaluation process after addressing or implementing the root cause of damage; Target: 20 percent of assets removed after evaluation; Robustness; Strengthening of Evacuation Routes; Percent reduction of annual risk on evacuation routes on an annual basis; Target: 40 percent risk reduction; Robustness. Sub-row 2: 1.2. Incorporate resilience into agency practices: Implementing Resilient Design Standards; Increase the percent of different project costs (e.g., less than 1 million dollars, more than 5 million dollars etc.) in vulnerable and at-risk areas as identified in the Resilience Improvement Plan or work programs (STIP or TIP) that incorporate resilience design considerations; Target: 20 percent of projects larger than 10 million dollars in coastal flood zone or 100-year floodplain); Robustness. Row 2: Goal 2: Maintain Functionality During and After Events: Sub-row 1: 2.1. Minimize the frequency and duration of facility closures due to extreme events and other disruptions: Corridors Recovered within Timeframes; Return to level of service targets within a desirable timeframe by roadway functional class; Targets: 100 percent of evacuation routes recovered in 1 hour; Interstates in 2 hours; local roadways in 5 hours; Rapidity Travel Time; Reliability; Change in T T R indexed to specific events and magnitudes of threats; Target: No greater than a 1.5 increase in T T R during a 10-year storm event; Rapidity. Sub-row 2: 2. Enhance transportation system redundancy: Alternate Route Planning; Increase the capacity to accommodate diverted traffic in urbanized areas and in rural areas; Target: 100 percent of critical corridors in urbanized and rural areas with alternate route plans or guidelines in place; Redundancy. Redundancy Ratio and or Multi-Scale Resilience Index; Reduction in risk of assets with the lowest Redundancy Ratio; Target: 40 percent risk reduction; Increase percent of one or more elements of the M R I from resilience improvements; Target: 20 percent decrease in opportunity cost during a hazard event; Redundancy. Sub-row 3: 2.3. Increase community resilience Stranded or Severely Detoured Zones; Increasing redundant access to stranded communities identified in R and R assessment (or exposure analysis) results; Target: Reduce the areas identified as “stranded zones” by 20 percent by 2030; Redundancy. Row 3: Goal 3: Create a Culture of Resilience within the Agency: Sub-row 1: 3.1. Increase workforce capacity in resilience: Training and Education of DOT Staff; Increase in percentage of staff with resilience-related responsibilities trained annually; Target: 50 percent increase in staff with resilience-related responsibilities trained annually; Resourcefulness. Row 4: Goal 4: Strengthen Regional Opportunity and Partnerships: Sub-row 1: 4.2. Enhance multimodal resilience: Bus Transit Service Restoration Post-Disruption; Return to full service within a desirable timeframe (indexed by storm intensity or duration); Targets: less than 2 hours on routes serving affected communities; less than 4 hours on other routes; Rapidity.
Long Description.
The screenshot is titled “Measuring Impacts and Performance of State DOT Resilience Efforts.” The layout contains filters and dropdowns at the top for selecting "Applicable Events," "Applicable Hazards," and "Additional Filters." Below the filters, the main table is displayed with multiple columns. The column headers are RPMID, Measure Title, Description, Illustrative Resilience Strategy, Targets, Thresholds, Example Data Required, Primary Connection to Four Rs, Primary Functional Area, Applicable Hazards, and Applicable Assets. Five rows of sample RPM (Resilience Performance Measure) data from RPM-1 to RPM-5 are shown. Each entry spans the width of the table, providing information like RPMID (Example: RPM-1, RPM-2), descriptions of the measure, associated strategies, and types of data used. The table uses alternating white and green shading to differentiate rows. The layout is structured for use in analyzing and selecting resilience metrics for transportation systems.
The compendium can therefore be used by agencies to select measures that are tied to their goals and objectives, which Rs the agency is focusing on, which assets the agency is measuring, and the applicable hazards and threats. For example, if a practitioner knows that their system often deals with overtopping roadways, then they could filter for flooding, robustness, or rapidity. Users can also filter by functional area to ensure the right staff are involved. Consideration of multiple strategies (e.g., asset protection, nature-based solutions, maintenance, alert signs) was also included to ensure that practitioners had diverse options that matched their resilience efforts.
SMART Evaluation
As seen within the four Rs framework, resilience can be assessed and understood by different outcomes. The RPMs in the compendium of RPMs focus on the following:
- Travel time-based measures, that is, travel time reliability and recovery (rapidity).
- Improved levels of service, functionality, and strengthening measures, that is, risk reduction and resilience countermeasures (robustness).
- Planning and process improvements, that is, avoiding maintenance costs and staff development (resourcefulness).
- Mobility improvements pre-, during, and post-event, and alternative route planning (redundancy).
Thus, if an agency is focused on ensuring that the system can rebound quickly post-disruption, the rapidity RPMs may be the most suitable for that agency. However, how can an agency know which RPMs may be the most effective for them, given their technical capacity or data inventory?
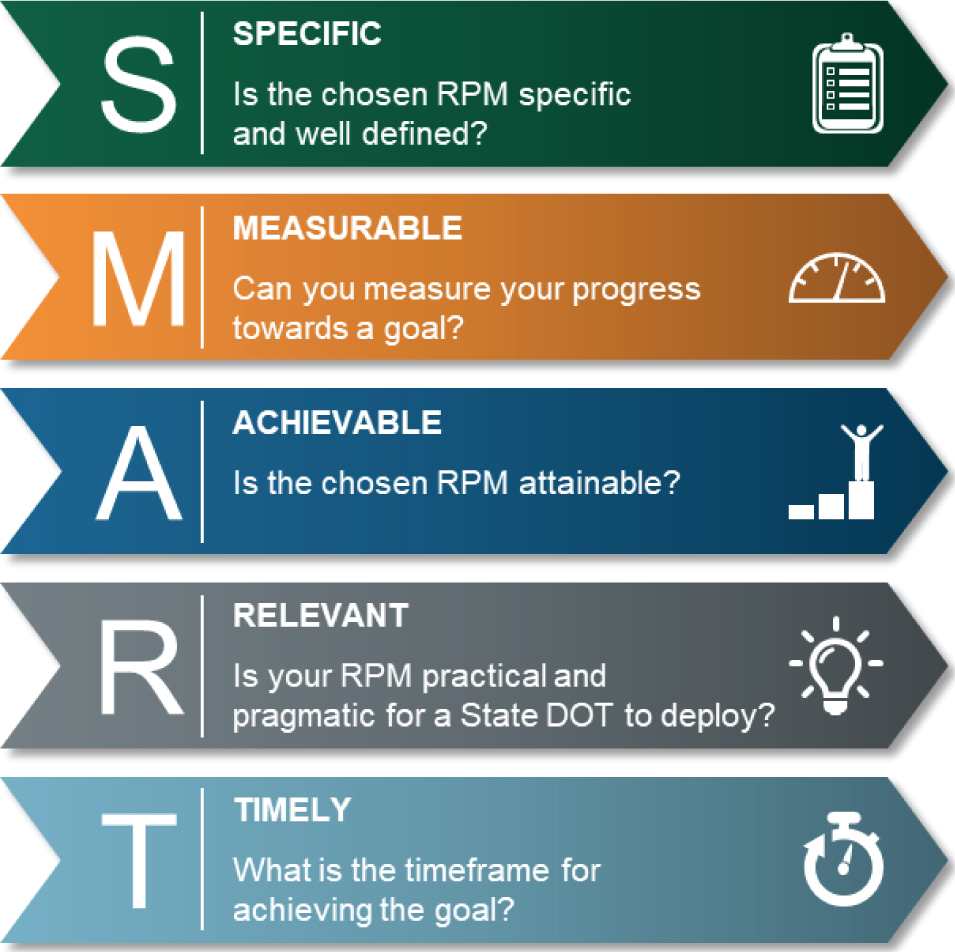
Given the multitude of ways in which resilience manifests, frameworks like SMART (Specific, Measurable, Achievable, Relevant, Timely) evaluation can support practitioners in selecting the measures most suitable to them based on current resources and needs. As seen in Figure 2.8, SMART represents multiple components that determine whether an RPM is ready for implementation. RPMs should aspire to fare well on each component.
If an agency wants to build their own performance measures outside of the RPMs presented in the compendium, assembling stakeholders (e.g., data owners, data users, technical experts, and senior management) must occur to ensure that all elements and specificity included in the RPM examples (Appendix B), for example, are accounted for. Using the RPM examples as guidance, along with the SMART framework as an evaluation tool, can assure practitioners that their measures are feasible and meet their needs.
Additional Factors
Moving from goals to measures is often contingent on various factors, including data availability, ease of implementation, and technical capacity. Practitioners first need to strategize and ask the following questions:
- What current performance data is available?
- What performance management gaps exist and may arise?
- How do we (the agency) want to measure future performance (e.g., incorporating future projections)?
- What is the level of effort needed to measure the impacts of our (the agencyʼs) investments?
These questions can influence the ability of an agency to adopt an RPM. For example, an agency may want to measure recovery times after a hazard event. For this RPM to be implemented,
Source: Adapted from (Cambridge Systematics, Inc. (2000) and Figure 1-2 from the TPM Toolbox (FHWA 2024b).
Long Description.
The five objectives given in the illustration are as follows: S, Specific: Is the chosen RPM specific and well-defined? M, Measurable: Can you measure your progress toward a goal? A, Achievable: Is the chosen RPM attainable? R, Relevant: Is your RPM practical and pragmatic for a State DOT to deploy? T, Timely: What is the timeframe for achieving the goal?
the agency would need to have access to data that includes real-time operational records. If the agency does not have that data or the data is of low quality, practitioners cannot accurately measure the time it takes to return to normal operations. Alternatively, the data may be available but not in the ownership of the DOT, and a data partnership would need to be established with the owner of the data. Data availability is a foundational step and should be investigated as early as possible, including within scoping.
2.4 Going from Goals and Objectives to Measures
Table 2.4 presents the 13 RPMs from the compendium with corresponding goals and objectives adapted from Illinois DOT (IDOT), Florida DOT (FDOT), and content provided from the stakeholder engagement workshop that occurred as part of the NCHRP Project 23-26 in October 2023. The RPMs in bold type signify that they are expanded in greater depth in the templates featured in Appendix B.
This table illustrates how existing transportation agency goals and objectives relate to RPMs. Goals and objectives to RPMs demonstrate a one-to-many relationship (i.e., often a single goal and objective can connect to many RPMs), once again highlighting the intersectionality of resilience. Alternatively, if an agency is focused on improving one of the four characteristics of resilience, for example, robustness (the ability of systems or assets to withstand without significant degradation or loss of performance), practitioners can glean language from these examples that they can then use to describe the actions their agency may want to take.
Illustrative Agency Example
Chapter 2 of the guide has taken practitioners through the first three steps of the SIM. To help practitioners envision how the guidance in this chapter may be applied, this section provides an illustrative example of agencies that have successfully walked from goals and objectives to develop their own performance measures related to resilience. This example draws on a real-world example from the IDOTʼs 2019 LRTP and applies the guidance from this chapter to their goals and objectives to select measures that can be used to track progress for those goals and objectives.
The first step of the process, as illustrated in the SIM, is to develop an understanding of resilience given the agencyʼs context:
- The IDOT system experiences a range of impacts from multiple types of hazards. Significant disruptions include widespread flooding of the Mississippi River, snowstorm shutdowns, and flooding of urbanized suburbs. In response, the IDOT recognized the need for a better understanding of its system and completed their first All-Hazards Transportation System Vulnerability Assessment in October 2017 (Illinois Department of Transportation 2019). This assessment enhanced DOT knowledge and underscored the importance of resiliency. Now, IDOT uses the scores from the assessment to prioritize resiliency activities.
IDOT does this by defining their understanding of resilience in their LRTP:
- “Resiliency involves understanding how changing environmental conditions and human threats could impact IDOT assets and then taking action to address identified issues. Impacts to understand include present-day concerns – like how land development and the loss of impervious surfaces has impacted localized flooding – as well as likely conditions in the future when changing weather patterns, due to climate change, will increase the frequency of system disruptions from flooding and other hazards. . . . A long-term perspective on resiliency is critical for transportation infrastructure as decisions made today have implications for decades to come, given the long lifecycles of transportation assets” (Illinois Department of Transportation 2019, pg. 64).
Then, building on this understanding, IDOT defines their resilience goal:
- Goal: “Proactively assess, plan, and invest in the stateʼs transportation system to ensure that our infrastructure is prepared to sustain and recover from extreme events and other disruptions” (Illinois Department of Transportation 2019, pg. 64).
It then defines two objectives within that goal:
- Objective 1: “Minimize the frequency and duration of facility closures due to extreme events and other disruptions” (Illinois Department of Transportation 2019, pg. 69).
- Objective 2: “Enhance transportation system redundancy” (Illinois Department of Transportation 2019, pg. 71).
This understanding informs the agencyʼs priorities and provides context for the content and strategies identified in the LRTP. The objectives seek to lay out specific resilience actions to achieve their goal. Additionally, the objectives are linked to rapidity (Objective 1) and redundancy (Objective 2).
These practitioners, using the compendium of RPMs, can then select possible RPMs to track to achieve their targets. For Objective 1, the agency selects the Corridors Recovered within Timeframes RPM, which measures the time it takes to return to normal operations divided by the event magnitude. For Objective 2, the agency selects the Redundancy Ratio and/or Multi-Scale Resilience (MRI) Index (RPM 3). They will start with measuring the redundancy ratio, which provides a direct measure of network redundancy based on the number of available routes connected to network nodes. They plan to initially identify vulnerable assets in low-redundancy areas, and the agency hopes to expand this RPM to the full multi-scale resilience index over time.
With these RPMs chosen, the agency can continue along the SIM to implement these measures. The next step in this process is determining what targets they hope to achieve by conducting a baseline assessment, followed by a future assessment. These steps are described in greater detail in Chapter 3.


