Measuring Impacts and Performance of State DOT Resilience Efforts: A Guide (2025)
Chapter: 5 Monitoring, Evaluation, and Communication

CHAPTER 5
Monitoring, Evaluation, and Communication
Once agencies begin to implement their selected actions, they must monitor progress to ensure they are meeting their stated goals and objectives. Key to this step is to periodically reevaluate their RPMs to demonstrate quantitative progress on achieving their goals and objectives and measure the impact that their strategies and investments are having on the resilience of their system and assets. They must also communicate their progress internally and externally and continue the cycle in the SIM to improve the resilience of the transportation system.
This chapter first covers the monitoring and evaluation of the implementation of agency resilience strategies and investments. This includes determining a monitoring framework and reviewing RPMs to demonstrate progress as well as incorporating what they have learned into the realignment of agency goals and objectives and the framework they are using to measure resilience.
Next, this chapter covers reporting progress and lessons learned for how to communicate with stakeholders. How agencies communicate their progress will differ for internal and external audiences, with internal communications focused on the technical details and improving performance, and external communications focused on conveying the story of resilience and what the agency is doing to improve the transportation system.
5.1 Monitoring and Adjustment
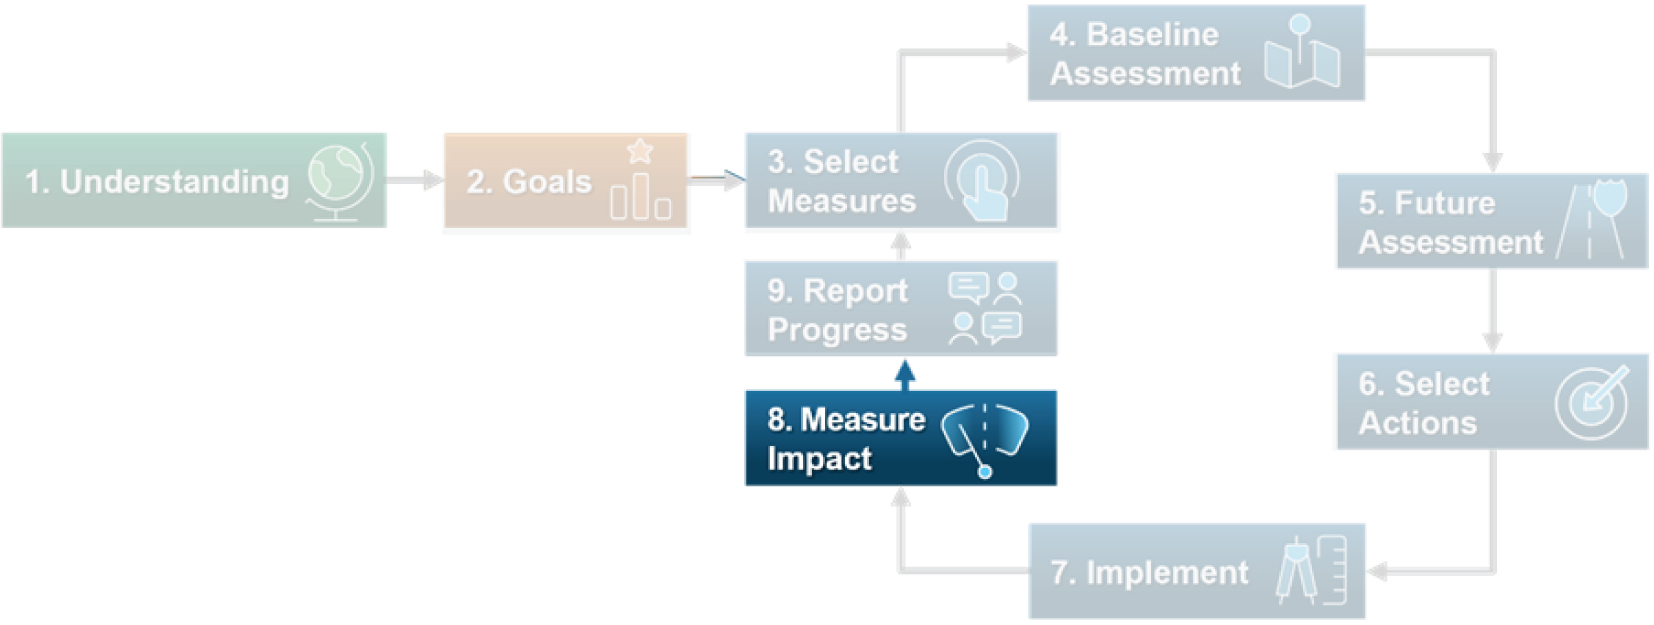
This section will cover the process of setting up and implementing a monitoring framework to track the process of the agencyʼs RPMs (Step 8), including periodic evaluation to quantify progress and demonstrate the value of resilience strategies and investments (Figure 5.1).
The second to last step of the SIM is to systematically and periodically review the RPMs and measure the impact of the resilience investments and strategies (Figure 5.1). Selected actions that have been implemented into performance management programs and processes should link resilience investments with performance outputs and outcomes. So, the effectiveness of the resilience strategies through their performance metrics is monitored, and investments need to be adjusted, if applicable. It is this combination of both gaining information from performance metrics and identifying where adjustments may need to be made that contributes to successful performance management.
The four main steps of measuring the impact of resilience strategies using RPMs involve the following:
- Determining the monitoring framework, including what metrics are tracked, at what frequency, and what data source will be used for tracking.
- Periodically reviewing RPMs and monitoring their results.
Long Description.
The implementation model consists of nine steps. They are: 1, Understanding. 2, Goals. 3, Select measures. 4, Baseline assessment. 5, Future assessment. 6, Select actions. 7, Implement. 8, Measure impact. 9, Report progress. Step 8 'Measure Impact' is highlighted.
- Using results to constantly evolve resilience investments to agency goals and objectives, and establish a feedback loop.
- Framework reevaluation, revisiting the monitoring process, and making any adjustments to ensure the process remains relevant and current.
Determine the Monitoring Framework
Establishing a monitoring framework is the first step to measuring impact. This includes setting up an agencyʼs monitoring and reporting frequency. The monitoring efforts should take place regularly, with exact cadence that balances delivering value through frequent information updates while acknowledging data noise and accounting for resource and capacity limitations. The cadence should also complement other efforts such as annual reports, plan updates, and legislative or budgetary milestones to maximize efficiency.
The framework should take into consideration several factors:
- Metrics should be linked to the goals, objectives, and performance targets of the agency.
- Monitoring capabilities can be expanded through data sharing across the agency and with external partners.
- Gaps in data should be identified early in the process, then documented, and ideally solved in the near future.
- Establishing staff roles in the performance management process should be synergistic to alleviate the monitoring burden for the agency.
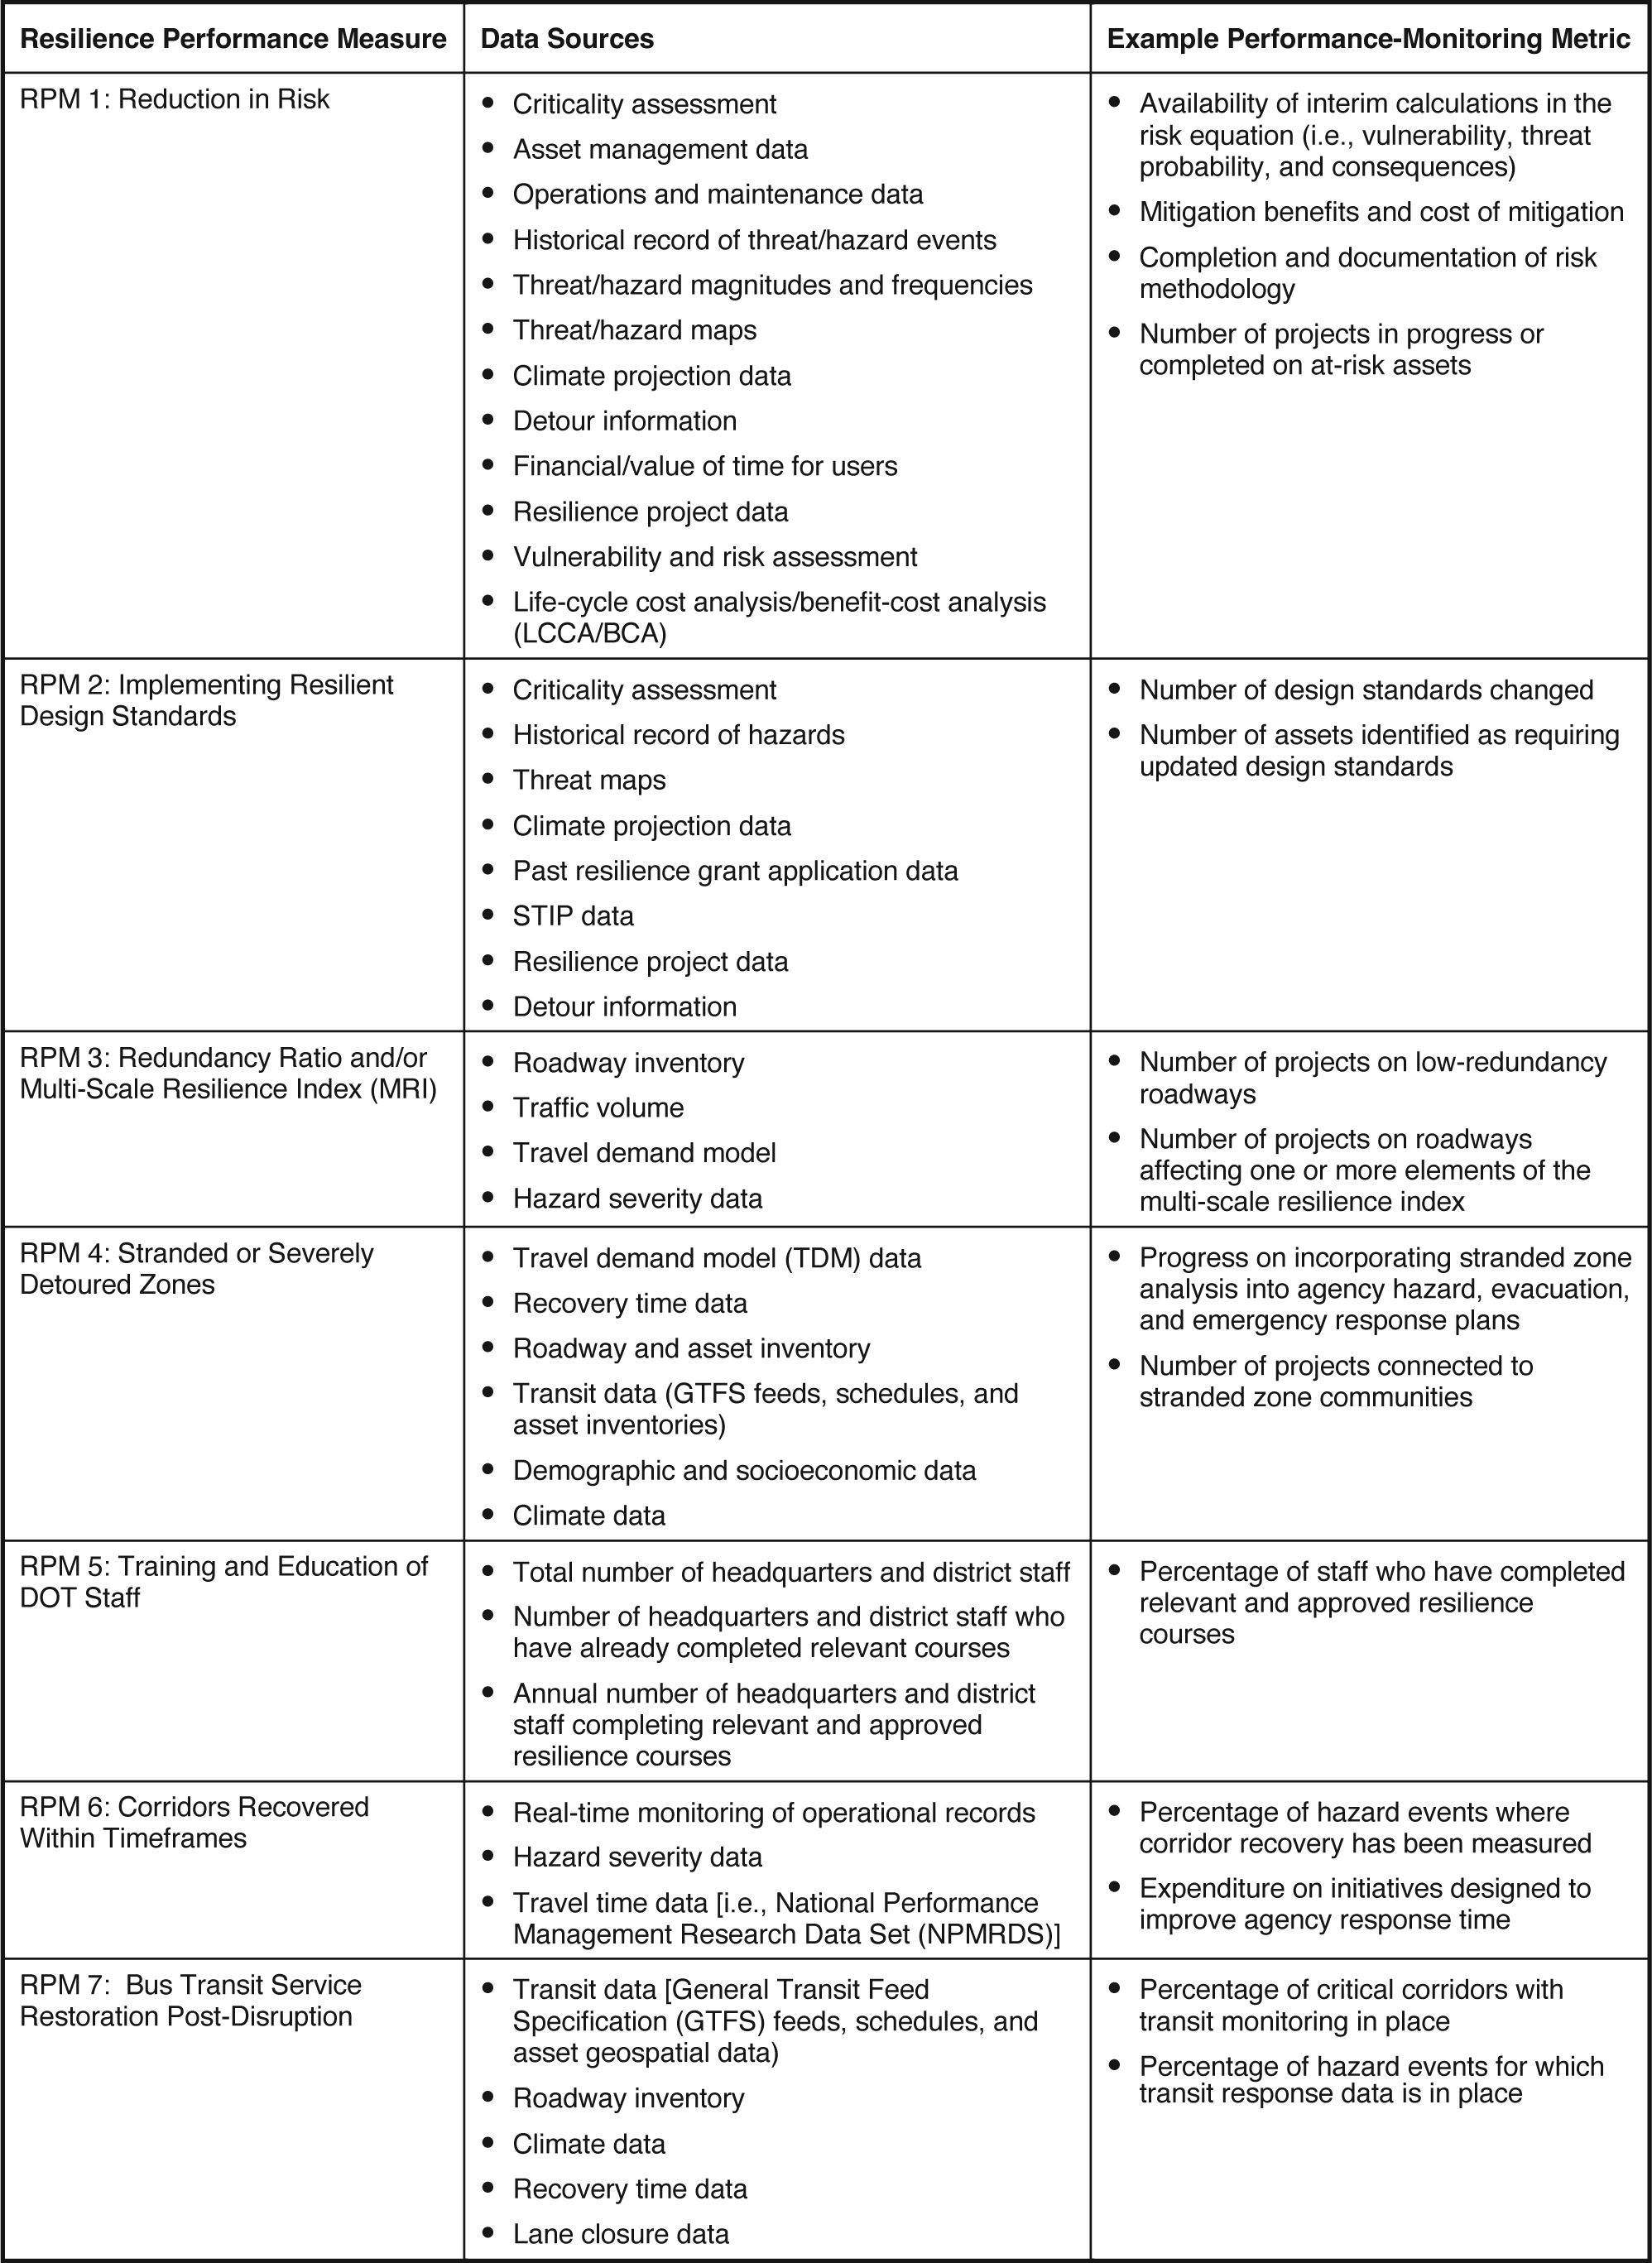
Additionally, the framework can include performance-monitoring metrics to track interim progress on the RPMs. Table 5.1 lists example performance metrics for each of the seven RPMs in Appendix B.
Additionally, as an example from the federal level, the FHWA is establishing metrics to evaluate the effectiveness and impacts of projects under the PROTECT Discretionary Grant Program (FHWA 2024c). The FHWA will select a representative sample of projects to evaluate using these metrics. There are 17 performance metrics across the goals of community resilience, robustness, redundancy, rapidity, and resourcefulness that the FHWA is using to measure projects. These metrics may use data sources such as the following:
- The National Performance Management Research Data Set (NPMRDS) data or equivalent.
- Life-cycle cost analysis (LCCA) comparisons of replacement in kind versus adaptive (resilient) design.
Long Description.
The column headers of the table are Resilience Performance Measure, Data Sources, and Example Performance Monitoring Metric. The data given in the table row-wise are as follows: Row 1: RPM1- Reduction in Risk: Criticality assessment; Asset management data; Operations and maintenance data; Historical record of threat or hazard events; Threat or hazard magnitudes and frequencies; Threat or hazard maps; Climate projection data; Detour information; Financial or value of time for users; Resilience project data; Vulnerability and risk assessment; LCCA or BCA; Availability of interim calculations in risk equation, i.e., vulnerability, threat probability, and consequences; Mitigation benefits and cost of mitigations; Completion and documentation of risk methodology; Number of projects in progress or completed on at-risk assets. Row 2: RPM2 - Implementing Resilient Design Standards: Criticality assessment; Historical record of hazards; Threat maps; Climate projection data; Past resilience grant application data; STIP data; Resilience project data; Detour information; Number of design standards changed; Number of assets identified as requiring updated design standards. Row 3: RPM3 - Redundancy Ratio and or Multi-Scale Resilience Index (MRI): Roadway inventory; Traffic volume; Travel demand model; Hazard severity data; Number of projects on low-redundancy roadways; Number of projects on roadways affecting one or more elements of the Multi-Scale Resilience Index. Row 4: RPM4 - Stranded or Severely Detoured Zones: Travel demand model (TDM) data; Recovery time data; Roadway and asset inventory; Transit data (GTFS feed, schedules, and asset inventories); Demographic and socioeconomic data; Climate data; Progress on incorporating stranded zone analysis into agency hazard, evacuation, and emergency response plans; Number of projects connected to stranded zone communities. Row 5: RPM5 - Training and Education of DOT Staff: Total number of headquarters and district staff; Number of headquarters and district staff who have already completed relevant courses; Annual number of headquarters and district staff completing relevant and approved resilience courses; Percent of staff who have completed relevant and approved resilience courses. Row 6: RPM6 - Corridors Recovered within Timeframes: Real-time monitoring operational records; Hazard severity data; Travel time data (i.e., NPRMDS); Percent of hazard events where corridor recovery has been measured; Expenditure on initiatives designed to improve agency response time. Row 7: RPM7 -Bus Transit Service Restoration Post-Disruption: Transit data (GTFS feeds, schedules, and asset geospatial data); Roadway inventory; Climate data; Recovery time data; Lane closure data; Percentage of critical corridors with transit monitoring in place; Percent of hazard events for which transit response data is in place.
- Reviews of project design documentation submitted by the grant recipient.
- Seismic vulnerability rating analysis studies.
- Coordination with the grant recipient to obtain local/self-reported data, with possible fieldwork and interviews of grant recipients.
With a monitoring framework in place, the next step is to conduct a periodic review of RPMs and measure the impact of resilience investments and strategies. This process entails updating the analysis of the RPM and comparing it with the baseline calculation to establish the impact that resilience investments and strategies are having on the resilience of the transportation system. Instituting a well-defined performance-monitoring process should include a review of the trends for each performance measure.
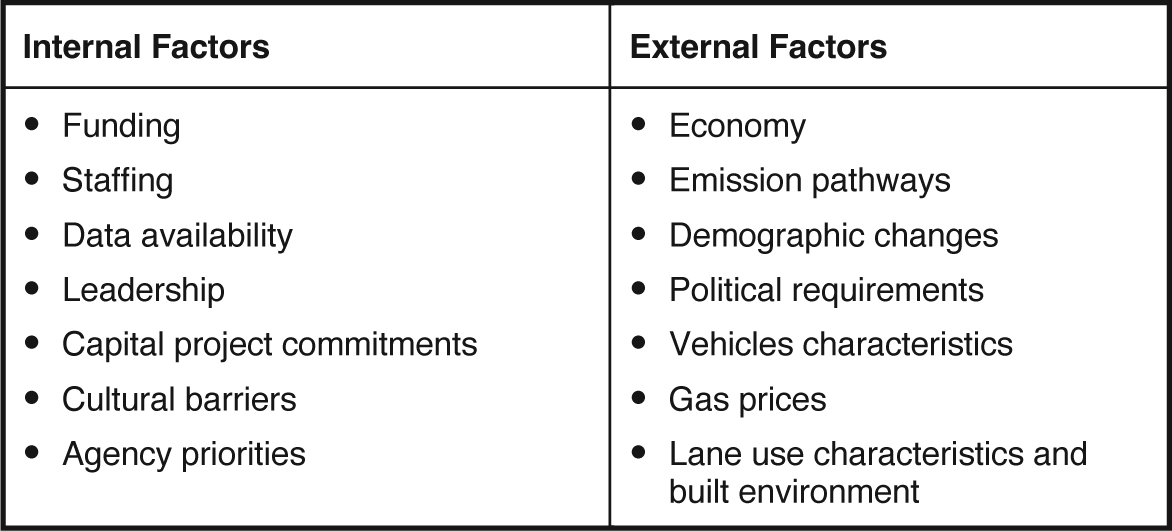
Executing the monitoring framework should include a review of all performance trends for each measure developed. The factors that could have an impact on the measures should be considered as well (Table 5.2), particularly how they can affect progress toward goals. These factors can be noted as explanatory variables that can explain performance changes and can be internal or external. Internal variables are those within the agencyʼs control, while external variables are those out of the agencyʼs control.
Evolving Alignment to SIM Process and Framework Reevaluation
Periodic review of RPMs should lead to an evolving alignment of the rest of the SIM process. The results should lead to adjustments that are integrated into the goals and objectives, selection of measures, baseline assessment, future assessment, selection of actions, and
Source: Adapted from Table 5-4 of the TPM Toolbox (FHWA 2024b).
Long Description.
The table has two sections. The left section is titled 'Internal Factors' and lists the following: Funding; Staffing; Data availability; Leadership; Capital project commitments; Cultural barriers; Agency priorities. The right section is titled 'External Factors' and lists the following: Economy; Emission Pathways; Demographic changes; Political requirements; Vehicle characteristics; Gas prices; Lane use characteristics and built environment.
implementation. The review of RPMs can increase understanding of the connection between resource allocation and performance results. Ultimately, the review allows the agency to better link their everyday activities to their desired results and performance goals.
Over many years, an agencyʼs goals, objectives, performance measures, and data accessibility all change and evolve with shifting internal priorities and due to external factors. With these changes, a reevaluation of the performance management framework is needed to ensure the process during each performance period remains relevant, current, and accurate.
The frequency with which the reevaluation occurs is up to the agency, but it should allow for several cycles of performance monitoring to occur before the process is refreshed. Refreshing too often can be resource-intensive and may not allow for trends in the metrics to be observed. On the other hand, a reevaluation that is too infrequent may not allow the agency to adjust their inputs to properly affect outputs and outcomes. New data sources often become available that may be more accurate than current ones, necessitating a reevaluation process.
5.2 Reporting and Communication
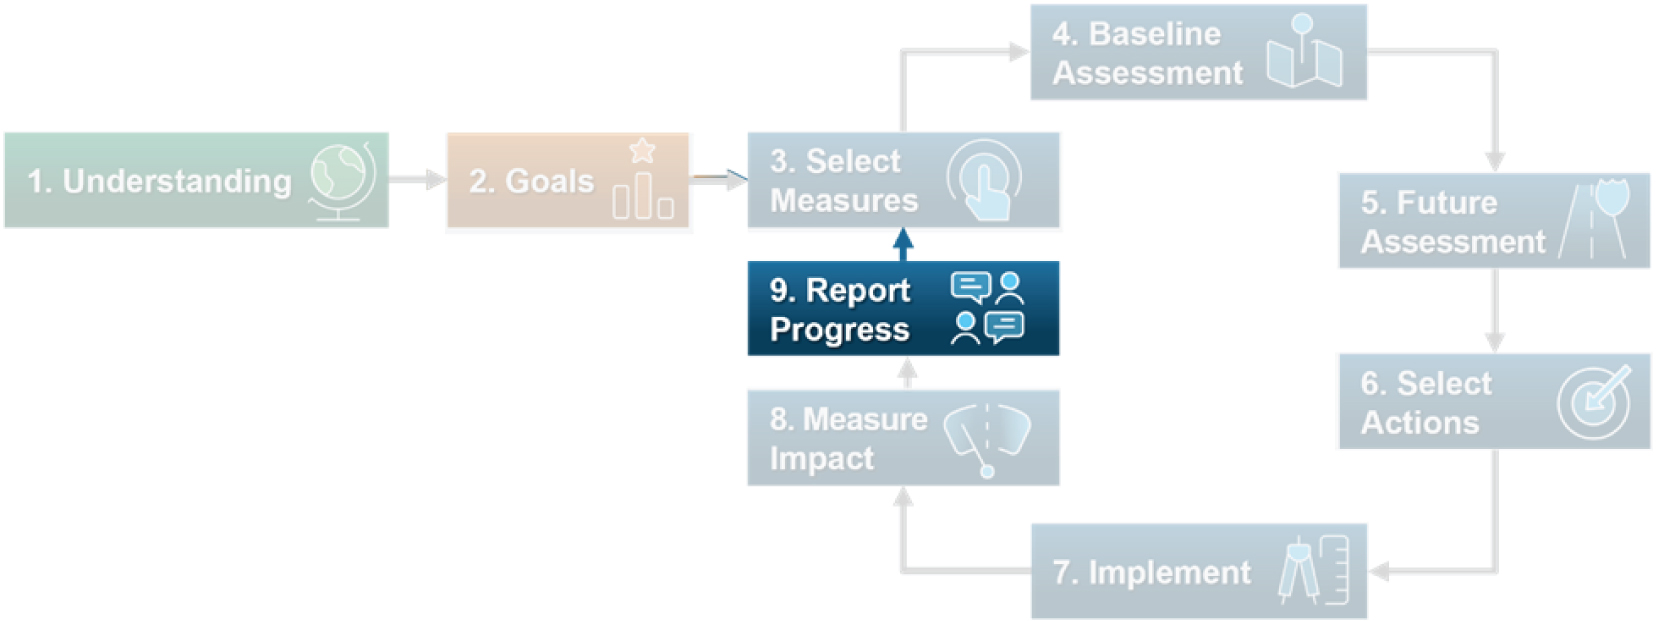
This section covers the reporting and communication of changes in the RPMs, focusing on how to communicate internally to continue improving performance and communicating externally to tell the story of resilience improvements (Step 9, the final step of the SIM) (Figure 5.2).
The final step in the SIM is to use the results of the RPMs to report on the progress the agency is making toward improving the resilience of the transportation system and the agencyʼs transportation assets (Figure 5.2). This step is essential for communicating the impact that the agencyʼs activities have had while also documenting lessons learned and targeting process improvements when the agency conducts a periodic review of their resilience initiatives. This section will cover key approaches for practitioners to consider given the context of reporting and communication, including communicating externally with the public and communicating with internal stakeholders and agency partners. Note that there may be federal reporting and communication requirements that may differ from what is presented.
Reporting Context
Before communicating the results of the RPMs and how they reflect progress toward agency goals and objectives, practitioners should first consider the reporting context for how the RPMs will be received by different audience segments as follows:
- Begins with reiterating the understanding of resilience that informed the agency as it determined the goals and objectives that the RPMs intended to measure.
- This context should be told as one part of a story that connects this context with the measures chosen, the actions taken, and the impact that those actions have had.
- Practitioners should take time to understand the audiences that the agency is going to be communicating with as well as the availability of funding and the consequences that limited funding has on constraining agency choices.
Resilience is used to prepare for hazard events that may quickly draw the attention of stakeholders, such as if a hazard event has recently affected the transportation system. The agency should frame their reporting as founded in a larger, long-term context, and then highlight the agencyʼs response to specific events to document successes and opportunities for improvement within that context.
Long Description.
The implementation model consists of nine steps. They are: 1, Understanding. 2, Goals. 3, Select measures. 4, Baseline assessment. 5, Future assessment. 6, Select actions. 7, Implement. 8, Measure impact. 9, Report progress. Step 9 'Report Progress' is highlighted.
For example, if an agency has chosen to focus on reducing the risks that their assets face from high-priority hazards, such as coastal flooding and geohazards, it may prioritize investments in higher-risk and higher-criticality assets. However, if a flooding event causes damage to lower-criticality assets, the agency may need to balance their success in investing in higher-criticality assets while recognizing an opportunity to improve their risk assessment process to be more inclusive of lower-criticality assets that are also affected by hazard events.
External Communications
For external communications, the agency should focus on telling their story to their collaborators and the public. This requires an understanding of the core components of a communication plan, conducting an audience segmentation to understand the different stakeholders the agency communicates with, and tailoring messages and communication mediums to those different audiences.
As explained in NCHRP Web-Only Document 385: Business Case and Communications Strategies for State DOT Resilience Efforts, to be successful when communicating about resilience with stakeholders and partners, agencies should
- Develop a communication plan that is integrated within their resilience programs and initiatives. At all stages, the agency should consider the critical role that communications play in the success of their initiatives and building support for resilience investments.
- Tailor communications to be targeted toward different audiences.
- Periodically conduct audience segmentation and tailor communication strategies and choice of reporting medium to effectively reach those audiences (Indrakanti et al. 2023).
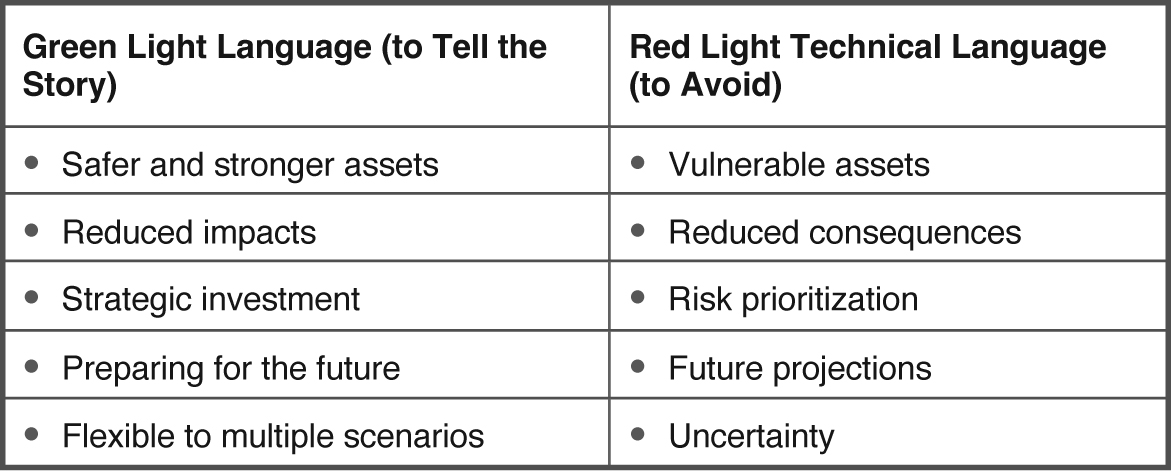
Importantly, agencies should tailor language to reflect the story that the agency is trying to tell and avoid technical language that forms the basis of risk and resilience assessments. Table 5.3 includes some examples of “green light” language to use when telling the story of resilience investments and initiatives as well as “red light” technical language that has a specific meaning within the context of risk and resilience investments that may not be broadly understood by external stakeholders. For example, saying an asset is “vulnerable” will be heard differently by a DOT asset manager compared to a state resident.
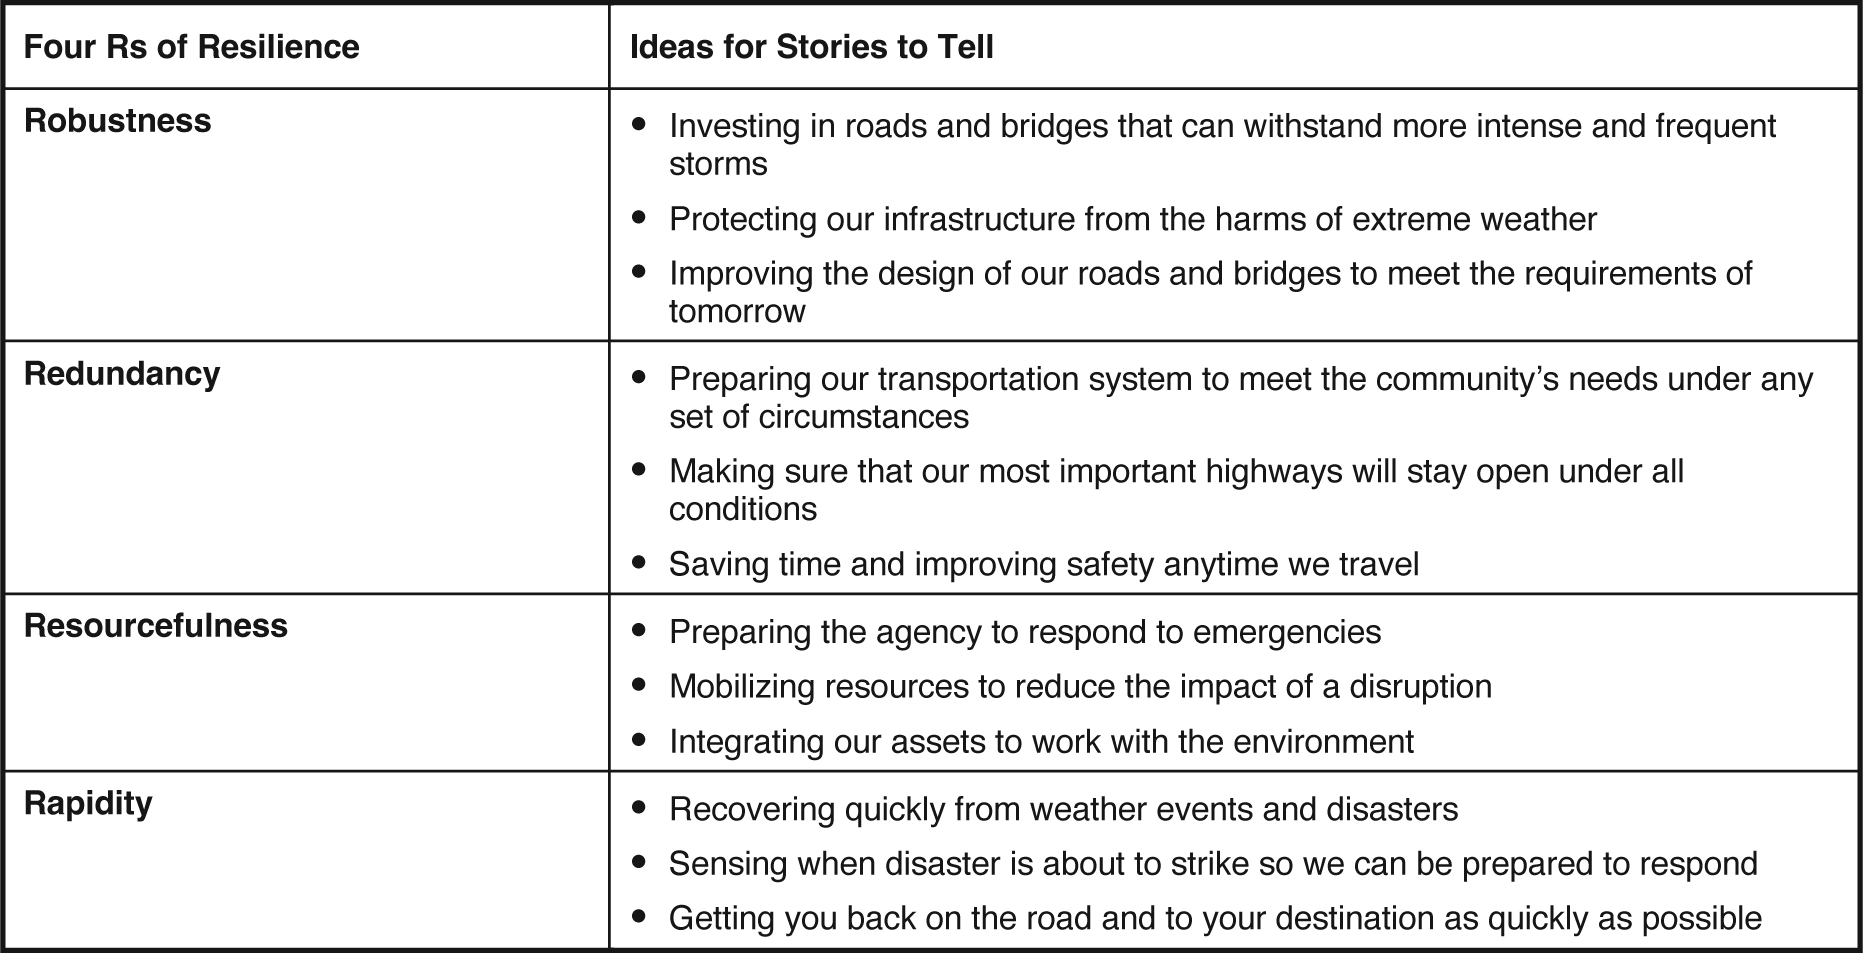
Additionally, the agency should translate the four Rs of resilience that form the basis for the agencyʼs goals, objectives, and RPMs into a story to share with the external public. Table 5.4 shows some ideas to tie each of the four Rs of resilience into a story that captures what the agency is trying to accomplish through their resilience investments.
Source: Adapted from AASHTO (2016) and Figure 6-2 from the TPM Toolbox (FHWA n.d.-c).
Long Description.
The table has two sections. The left section is titled 'Green Light Language (to Tell The Story)' and lists the following: Safer and stronger assets; Reduced impacts; Strategic investment; Preparing for the future; Flexible to multiple scenarios. The right section is titled 'Red Light Technical Language (to Avoid)' and lists the following: Vulnerable assets; Reduced consequences; Risk prioritization; Future projections; Uncertainty.
Long Description.
The column headers of the table are the Four Rs of Resilience and Ideas for Stories to Tell. The data given in the table row-wise are as follows: Row 1: Robustness: Investing in roads and bridges that are able to withstand more intense and frequent storms; Protecting our infrastructure from the harms of extreme weather; Improving the design of our roads and bridges to meet the requirements of tomorrow. Row 2: Redundancy: Preparing our transportation system to meet the community’s needs under any set of circumstances; Making sure that our most important highways will stay open under all conditions; Saving time and improving safety any time we travel. Row 3: Resourcefulness: Preparing the agency to respond to emergencies; Mobilizing resources to reduce the impact of a disruption; Integrating our assets to work with the environment. Row 4: Rapidity: Recovering quickly from weather events and disasters; Sensing when a disaster is about to strike so we can be prepared to respond; Getting you back on the road and to your destination as quickly as possible.
Internal Communications
For internal communications, practitioners should focus on the technical details that form the basis for process improvements and more robust analyses when the agency periodically reviews their resilience initiatives. While external communications focus on telling the story of the agency as they make resilience investments, internal communications should bring practitioners together to improve the analyses they conduct and provide more information for decision-makers to make more informed decisions.
Internal communications should be rooted in a common understanding of technical terms and processes. One such source of these definitions is the resilience glossary in NCHRP Research Report 1014 (Pena et al. 2023). These key terms and definitions should be defined in internal reporting documents. Additionally, practitioners should keep up with this quickly evolving field to ensure that they are learning from the experiences of other agencies and to identify opportunities for improvements to build on the success of others.
Finally, internal communications should consider the return on investment (ROI) that resilience investments and strategies have. This would include tracking the costs of different investments and estimating the benefits that these investments have for financial return and improvement in the well-being of the community. This can also be used to convey the overall value that resilience work has for the agency and can be carried into external communications.


