Measuring Impacts and Performance of State DOT Resilience Efforts: A Guide (2025)
Chapter: 6 Gaps and Future Research

CHAPTER 6
Gaps and Future Research
Though agencies have made significant progress measuring resilience and drafting RPMs, common shortfalls have emerged that require continued research, particularly those that use field data and measurements. Many of them result from data deficiencies, an absence of widely available analytical tools and methodologies, or a lack of time or study. Given the intricacy of transportation systems and the agencies that fund, build, and maintain them, it is understandable that the transition from research to practice is sharp (Special Report 340, 2021).
This guide aims to serve as a foundational step for ongoing and evolving research to make progress toward a standard practice of performance-based resilience investment. This research seeks to standardize how resilience is measured, given how critical it is in transportation planning and decision-making. The questions that this guide seeks to answer are large and real, yet many are still looming.
Key stakeholders were engaged as part of the development of this guide, and they brought forth areas where they universally see a need for continued research. Significant challenges include the concepts of predictability and uncertainty. The work presented in this guide is primarily focused on characterizing system performance now, but how can practitioners use these products to plan for the future?
The real shortcoming that many agencies face is a need for comprehensive data. However, other noticeable gaps may be more experiential. There is intrinsic and practical value in understanding the processes that make up resilience planning (e.g., asset inventories, vulnerability, and risk assessments), the players involved, and a comprehension of who is being served by the system.
The following section categorizes future needs and areas of improvement into four organizing themes that are illustrated tabularly and narratively.
6.1 Organizing Themes
 Processes. How can performance be estimated under changing conditions? What methodologies and workflows are required?
 Community Resilience. How can practitioners integrate community resilience into performance management? How can you ensure usersʼ needs are being accounted for?
 Data and Analysis. What data is critical to deploy robust and evidence-based performance management? What tools and technologies are necessary to perform advanced and predictive analyses?
 Collaboration. Which agencies and organizations need to be at the table?
Table 6.1 lists the research gaps for SIM Steps 2 through 9 and organizes them according to these four themes. The gaps in this table were informed by the collective experience of the guide authors as well as material sourced from the Research Next Steps section of the RPM examples. More detailed information for each RPMʼs next steps can be found in the templates in Appendix B.
In addition to the specific gaps at each SIM step included in Table 6.1, there are additional research gaps that have emerged from the development of this guide. Those gaps are elaborated as follows.
Limitations Related to Redundancy
Though there are challenges associated with measuring each of the four Rs of resilience, redundancy stands out as being the most difficult for agencies to tackle. Agency options for addressing deficiencies in redundancy are limited and may only be possible through long-term capacity expansions, which may be politically challenging. Two of the three RPMs in the compendium of RPMs, Stranded or Severely Detoured Zones (RPM 4) and Alternate Route Planning (RPM 13), focus on investing in areas where low redundancy can have an outsized impact. The remaining RPM, the Redundancy Ratio and/or MRI (RPM 3), provides a methodology to measure system redundancy, and the MRI attempts to connect its user impacts and system robustness. Additional research is needed to better understand travel behavior during disruptions, how to better mitigate the impacts of low redundancy, and effective resilience strategies that agencies could pursue that do not require capacity expansions.
Assessing Impacts on Affected Populations
The resilience practice should strive to be objective and data-driven, emphasizing quantitative methodologies. Yet, the integration of community resilience and the impacts of disruptions on affected populations is often limited to qualitative assessments. These assessments need to be grounded in evidence, observations, and expertise, but still incorporate the experiential qualities that quantitative means often cannot capture.
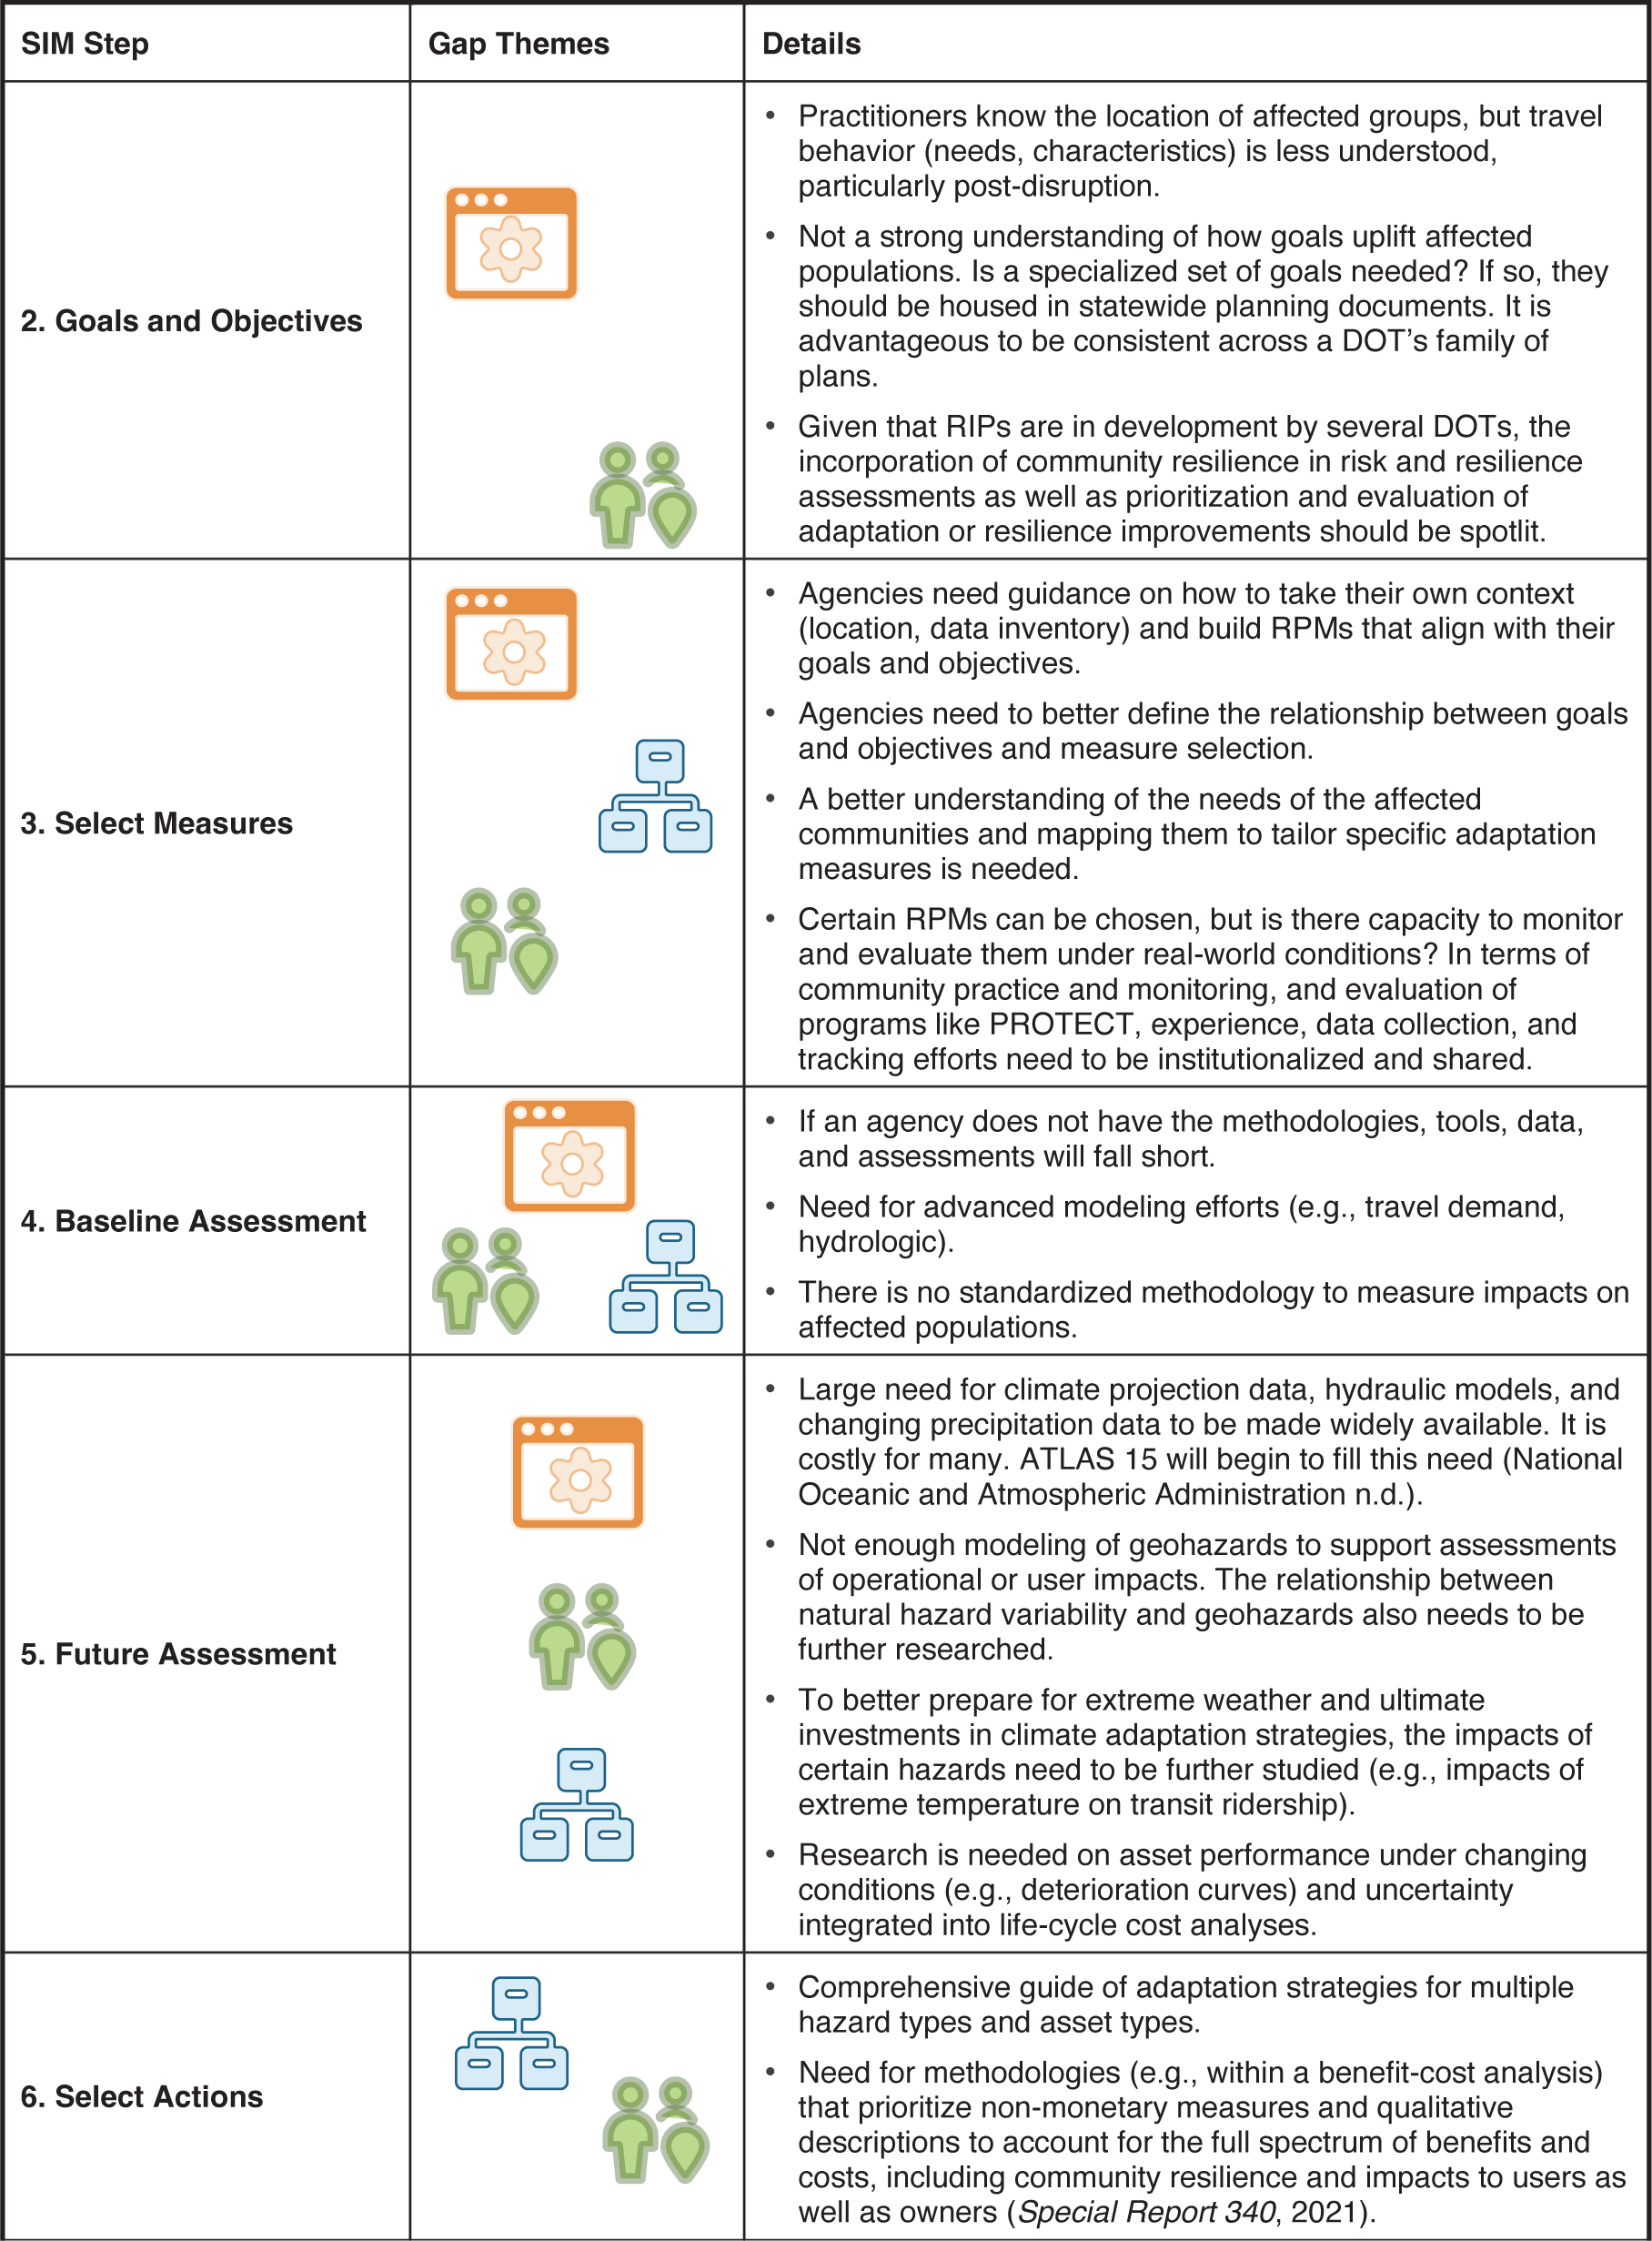
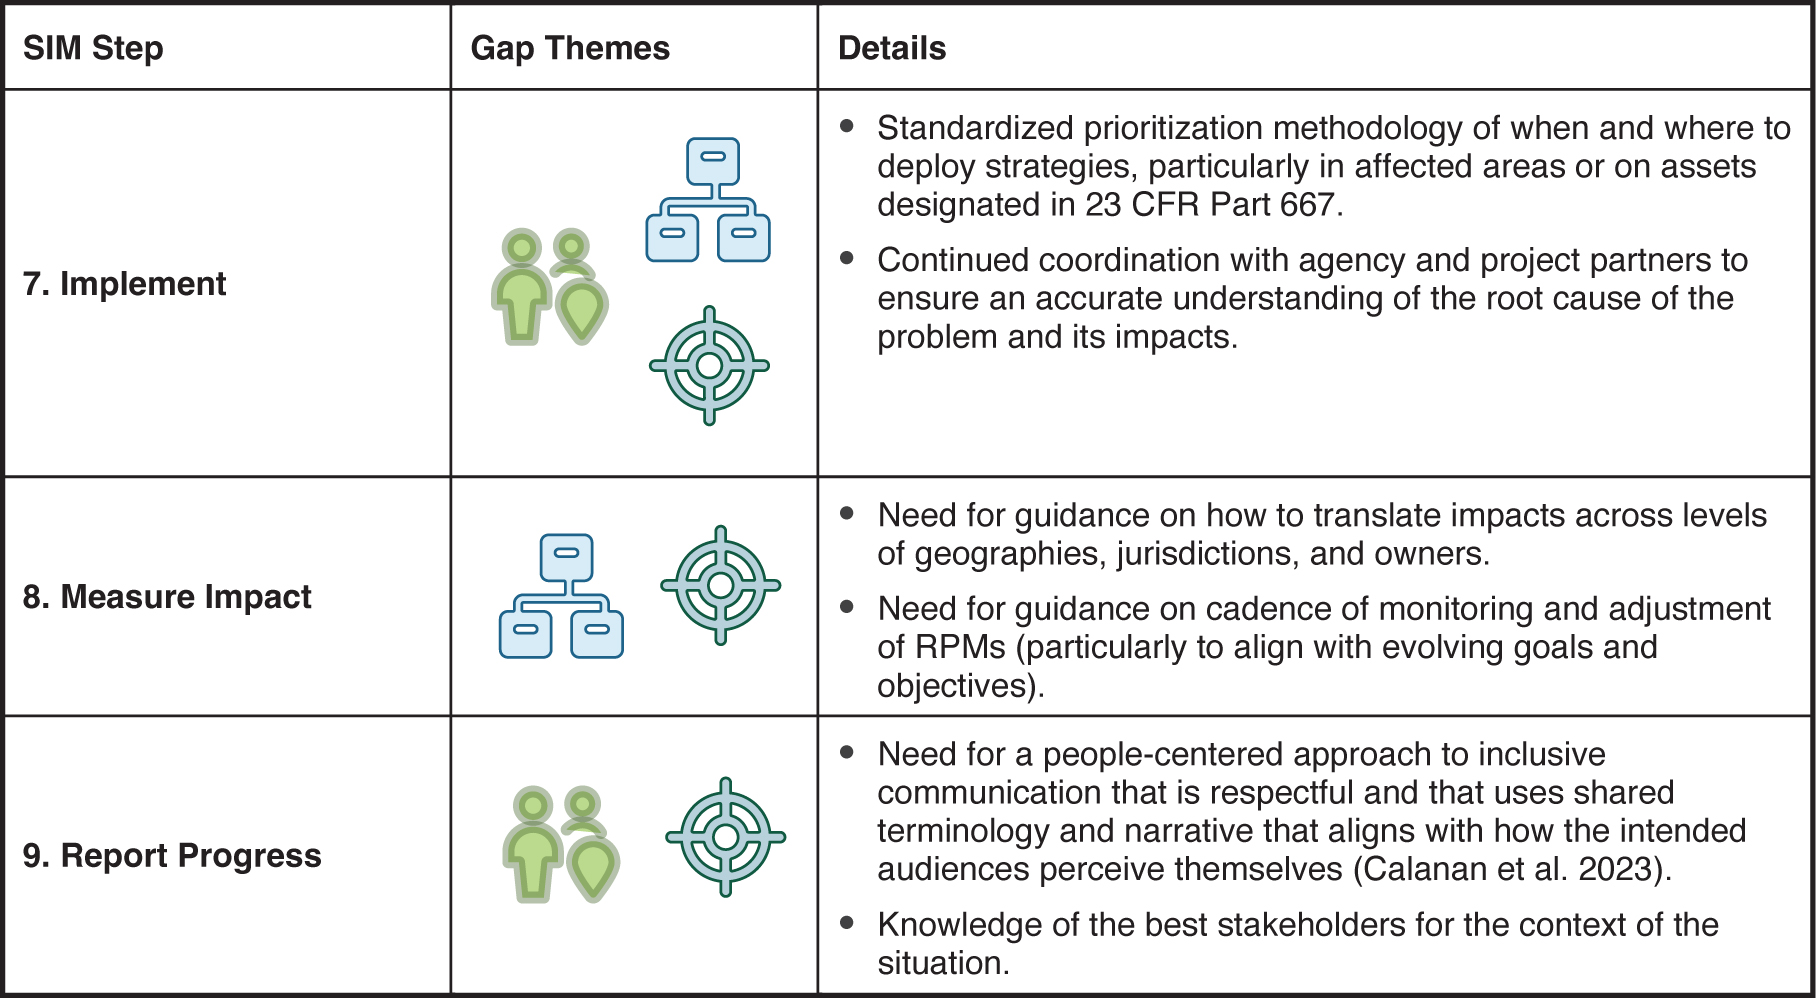
Long Description.
The column headers of the table are SIM Step, Gap Themes, and Details. The data given in the table row-wise are as follows: Row 1: Goals and Objectives: Icons of a dialogue box, and two people. Practitioners know the location of affected groups, but travel behavior (needs, characteristics) is less understood, particularly post-disruption. Not a strong understanding of how goals uplift affected populations. Is a specialized set of goals needed? If so, they should be housed in statewide planning documents. It is advantageous to be consistent across a DOT’s “family of plans.” Given RIPs are in development by several DOTs, the incorporation of community resilience in risk and resilience assessments, as well as prioritization and evaluation of adaptation or resilience improvements, should be spotlit. Row 2: Selecting Measures: Icons of a dialogue box, a flowchart, and two people; Agencies need guidance on how to take their own context (location, data inventory) and build RPMs that align with their goals and objectives; Agencies need to better define the relationship between goals and objectives and measure selection; A better understanding of needs of affected communities and mapping them to tailor them to specific adaptation measures is needed; Certain RPMs can be chosen but is there capacity to monitor and evaluate under real conditions? In terms of community practice and monitoring and evaluation of programs like PROTECT, experience, data collection, and tracking efforts need to be institutionalized and shared. Row 3: Baseline Assessment: Icons of a dialogue box, a flowchart, and two people; If an agency does not have the methodologies, tools, and data, assessments will fall short; Need for advanced modeling efforts (e.g., travel demand, hydrologic); There is no standardized methodology to measure impacts on affected populations. Row 4: Future Assessment: Icons of a dialogue box, a flowchart, and two people; Large need for climate projection data, hydraulic models, and changing precipitation data to be made widely available. It is costly for many. ATLAS 15 will begin to fill this need (NOAA); Not enough modeling of geohazards to support assessments of operational or user impacts. The relationship between natural hazard variability and geohazards also needs to be further researched; To better prepare for extreme weather and ultimate investments in climate adaptation strategies, the impacts of certain hazards need to be further studied (e.g., impacts of extreme temperature on transit ridership); Research is needed on asset performance under changing conditions (e.g., deterioration curves) and uncertainty integrated into life cycle cost analyses. Row 5: Select Actions: Icons of a flowchart, and two people; Comprehensive guide of adaptation strategies for multiple hazard types and asset types; Need for methodologies (e.g., within a benefit cost analysis) that prioritize non-monetary measures and qualitative descriptions to account for the full spectrum of benefits and costs, including community resilience and impacts to users as well as owners (Special Report 340, 2021). Row 6: Implement: Icons of a flowchart, a crosshair, and two people; Standardized prioritization methodology of when and where to deploy strategies, particularly in affected areas or on assets designated in in 23 CFR Part 667; Continued coordination with agency and project partners to ensure an accurate understanding of the root cause of the problem and its impacts. Row 7: Measure Impact: Icons of a flowchart and a crosshair; Need for guidance on how to translate impacts across levels of geographies, jurisdictions, and owners; Need for guidance on cadence of monitoring and adjustment of RPMs (particularly to align with evolving goals and objectives). Row 8: Reporting Progress: Icons of two people and a crosshair; Need for a people-centered approach to inclusive communication that is respectful and that uses shared terminology and narrative that aligns with how the intended audiences perceive themselves (Calanan et al. 2023); Knowledge of the best stakeholders for the context of the situation.
There is no standardized process to measure the impacts on affected populations, with assessments often unclear or foregone. There is a need for data and modeling tools that include the socioeconomic importance of assets to users affected. This quantification of experience is a major gap in ensuring that all community membersʼ needs are accounted for.
Data and Methodologies Related to Natural Hazard Variability and Uncertainty
Resilience is often defined in relation to specific events or disruptions, but is inevitably affected by natural hazard variability. This phenomenon exerts gradual yet substantial effects on infrastructure and transportation systems. To integrate natural hazard variability into resilience assessments, it is necessary to combine resilience assessments with climate modeling (which introduces a greater degree of uncertainty). This element of uncertainty affects agency approaches, budgets, and expertise, leading many to seek high-quality data and models.
Improving transportation resilience requires methods to measure and evaluate investments aimed at preventing losses and expediting recovery from current disruptions while planning for future uncertainty. Effective forward-looking resilience assessments depend on high-quality data and analytical tools. However, much of the data and advanced modeling is not widely available or is prohibitively expensive, particularly for agencies with limited resources.
To better plan for upcoming investments and protect existing assets, practitioners need access to extreme weather projections that address increasingly frequent and severe weather events (i.e., the storms of tomorrow becoming the standard of today). Additionally, agencies should enhance their internal asset management practices and collaborate with resilience experts who know how to conduct thorough vulnerability and risk assessments. This ensures that agencies have the best possible understanding of their systems.
6.2 Conclusion
This guide intends to measure how resilience investments provide value now and over time, but the process of forecasting value needs continued research over the coming years. These RPMs provide in-depth outlines and methodologies to set up data collection, initiate assessments, and lay the groundwork for future assessments today, in hopes that they serve as the foundation for the next several years of DOT practice. As new data is collected and published (like ATLAS-15), new tools are deployed, and more time has passed, the practice will evolve.
Despite the challenges that lie ahead, critical progress has already been made through research efforts like this project and the many that came before (and will come after) it. For example, NCHRP Project 23-32, “Transportation Asset Risk and Resilience,” is currently developing a manual to demonstrate quantitative and repeatable approaches for modeling risk and resilience. These projects endeavor to standardize methodologies so DOTs can easily promote resilience as a key determinant in the management and progress of state transportation systems.
Billions of dollars in federal, state, and local funding have been dedicated to pilot programs, formula and discretionary grant programs, reports, and guidance, all centered on integrating resilience into decision-making and investments. Through this effort of standardization of RPMs, agencies can begin to effectively measure, monitor, and track progress toward a more resilient transportation system.


