Measuring Impacts and Performance of State DOT Resilience Efforts: A Guide (2025)
Chapter: Appendix A: Compendium of RPMs

APPENDIX A
Compendium of RPMs
Table A.1 provides a comprehensive overview of the RPMs. For more information on the first seven RPMs within the table, please see the templates in Appendix B, which can be found on the National Academies Press website (https://nap.nationalacademies.org) by searching for NCHRP Research Report 1159: Measuring Impacts and Performance of State DOT Resilience Efforts: A Guide.
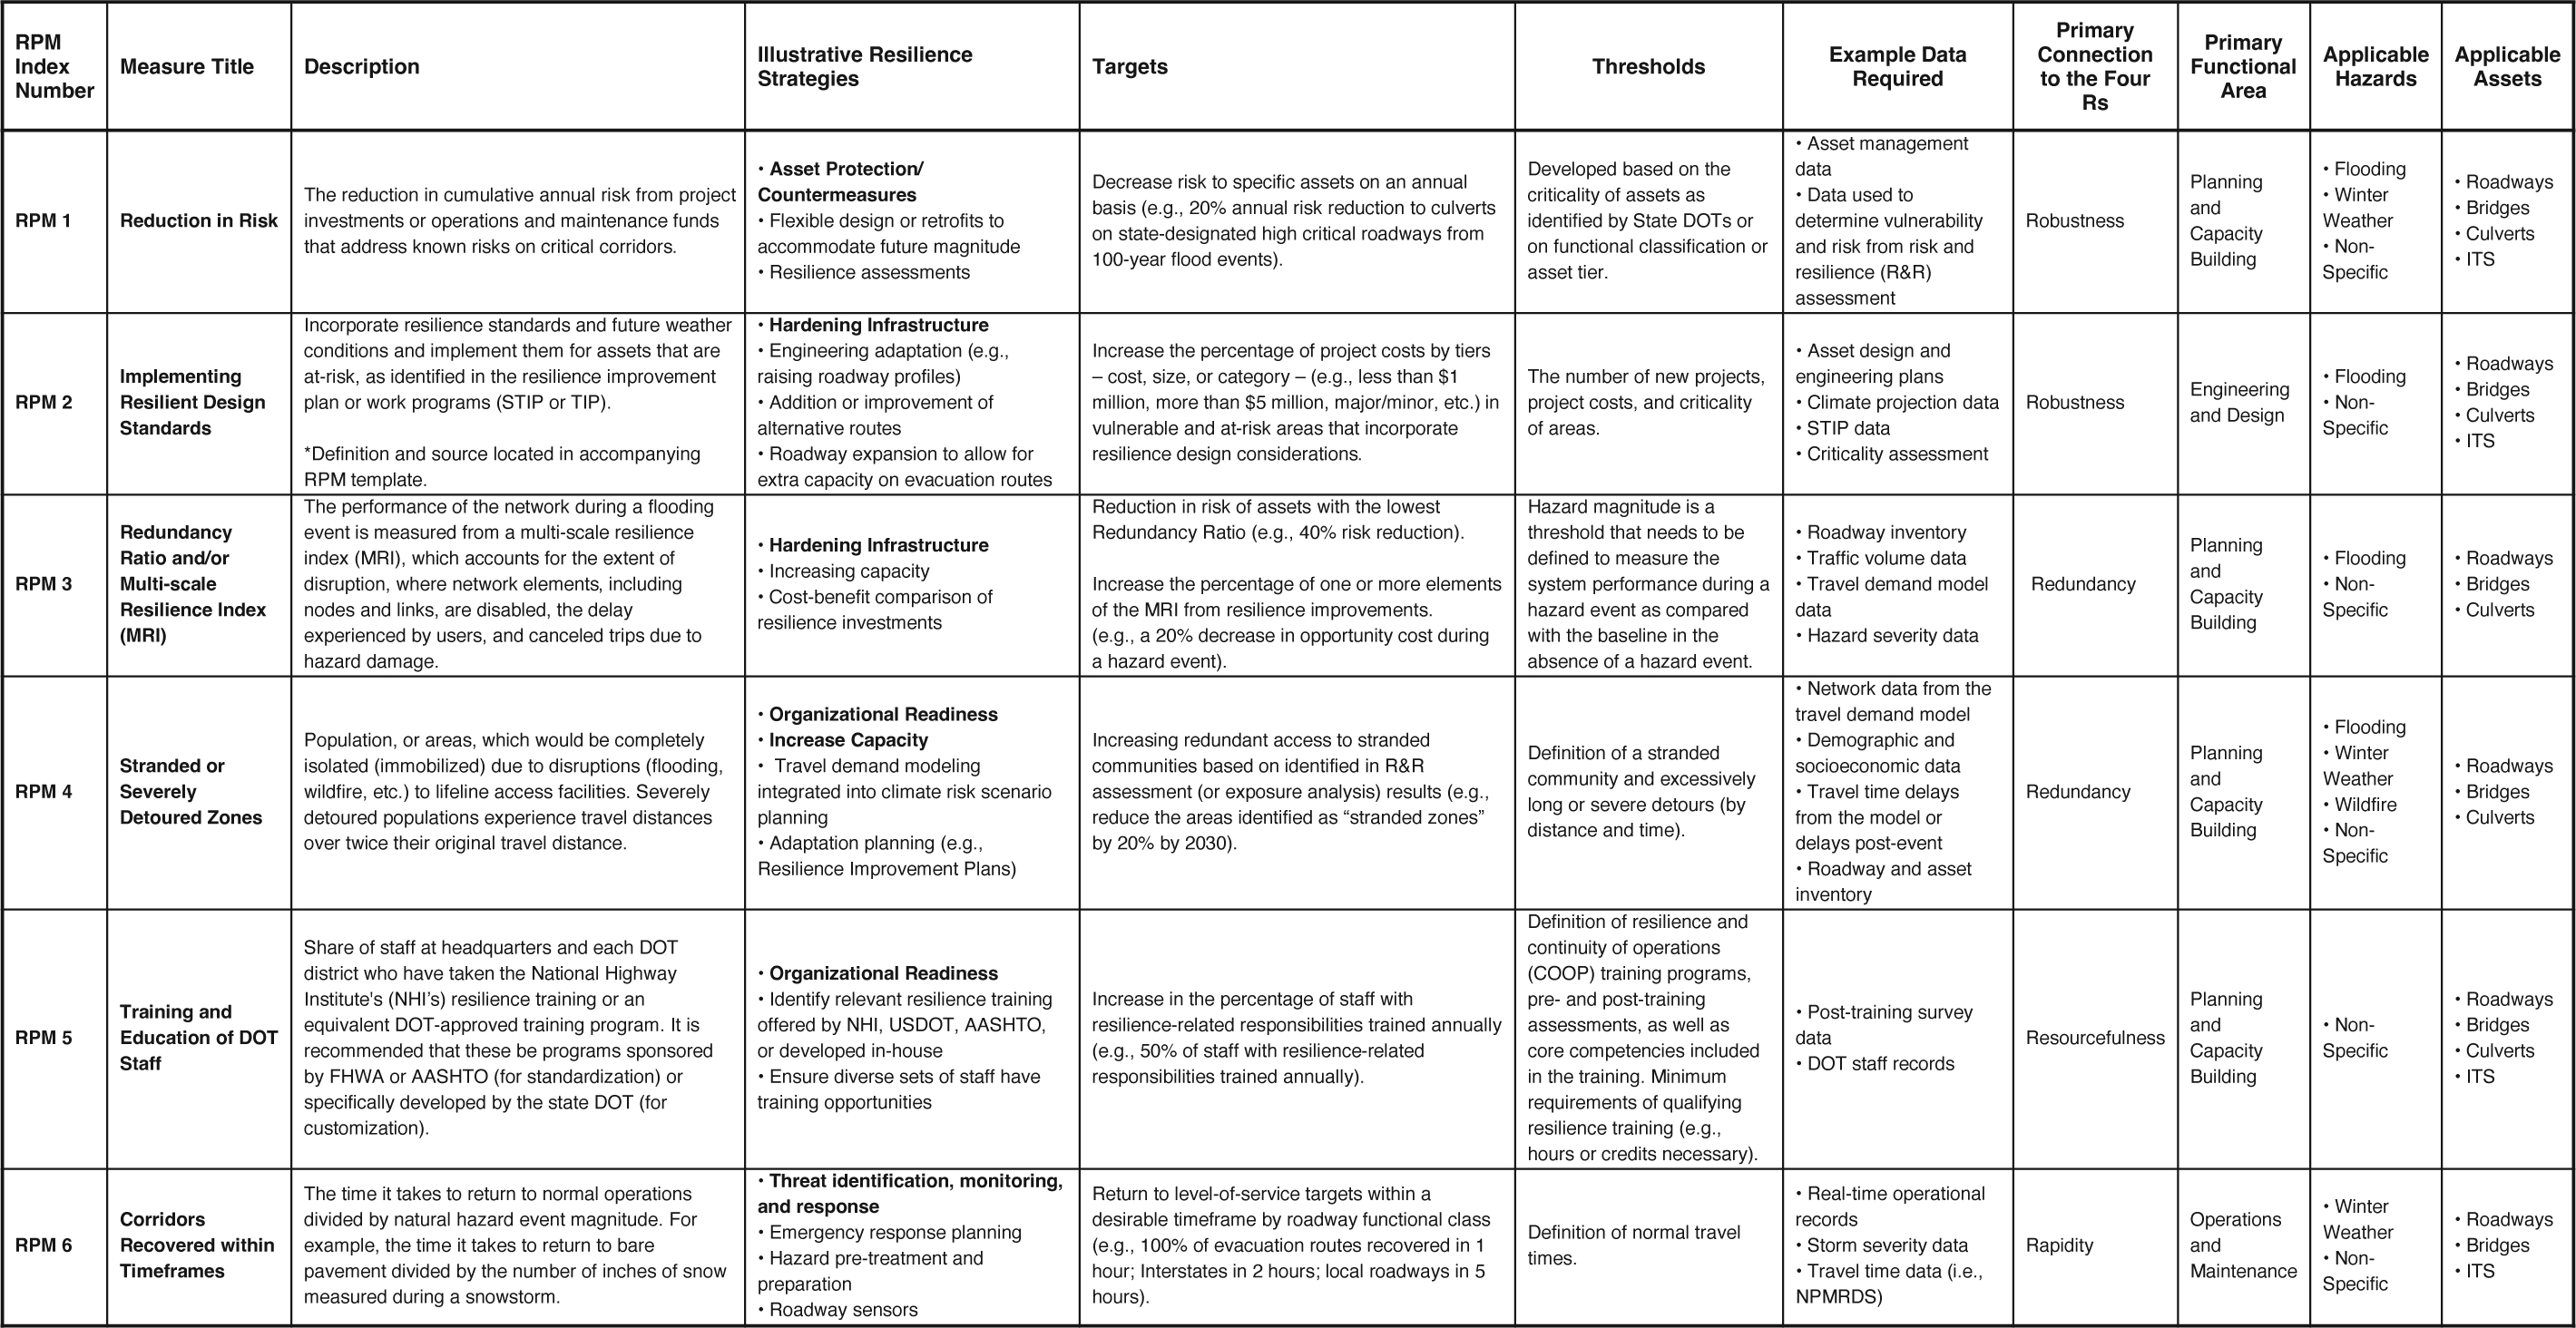
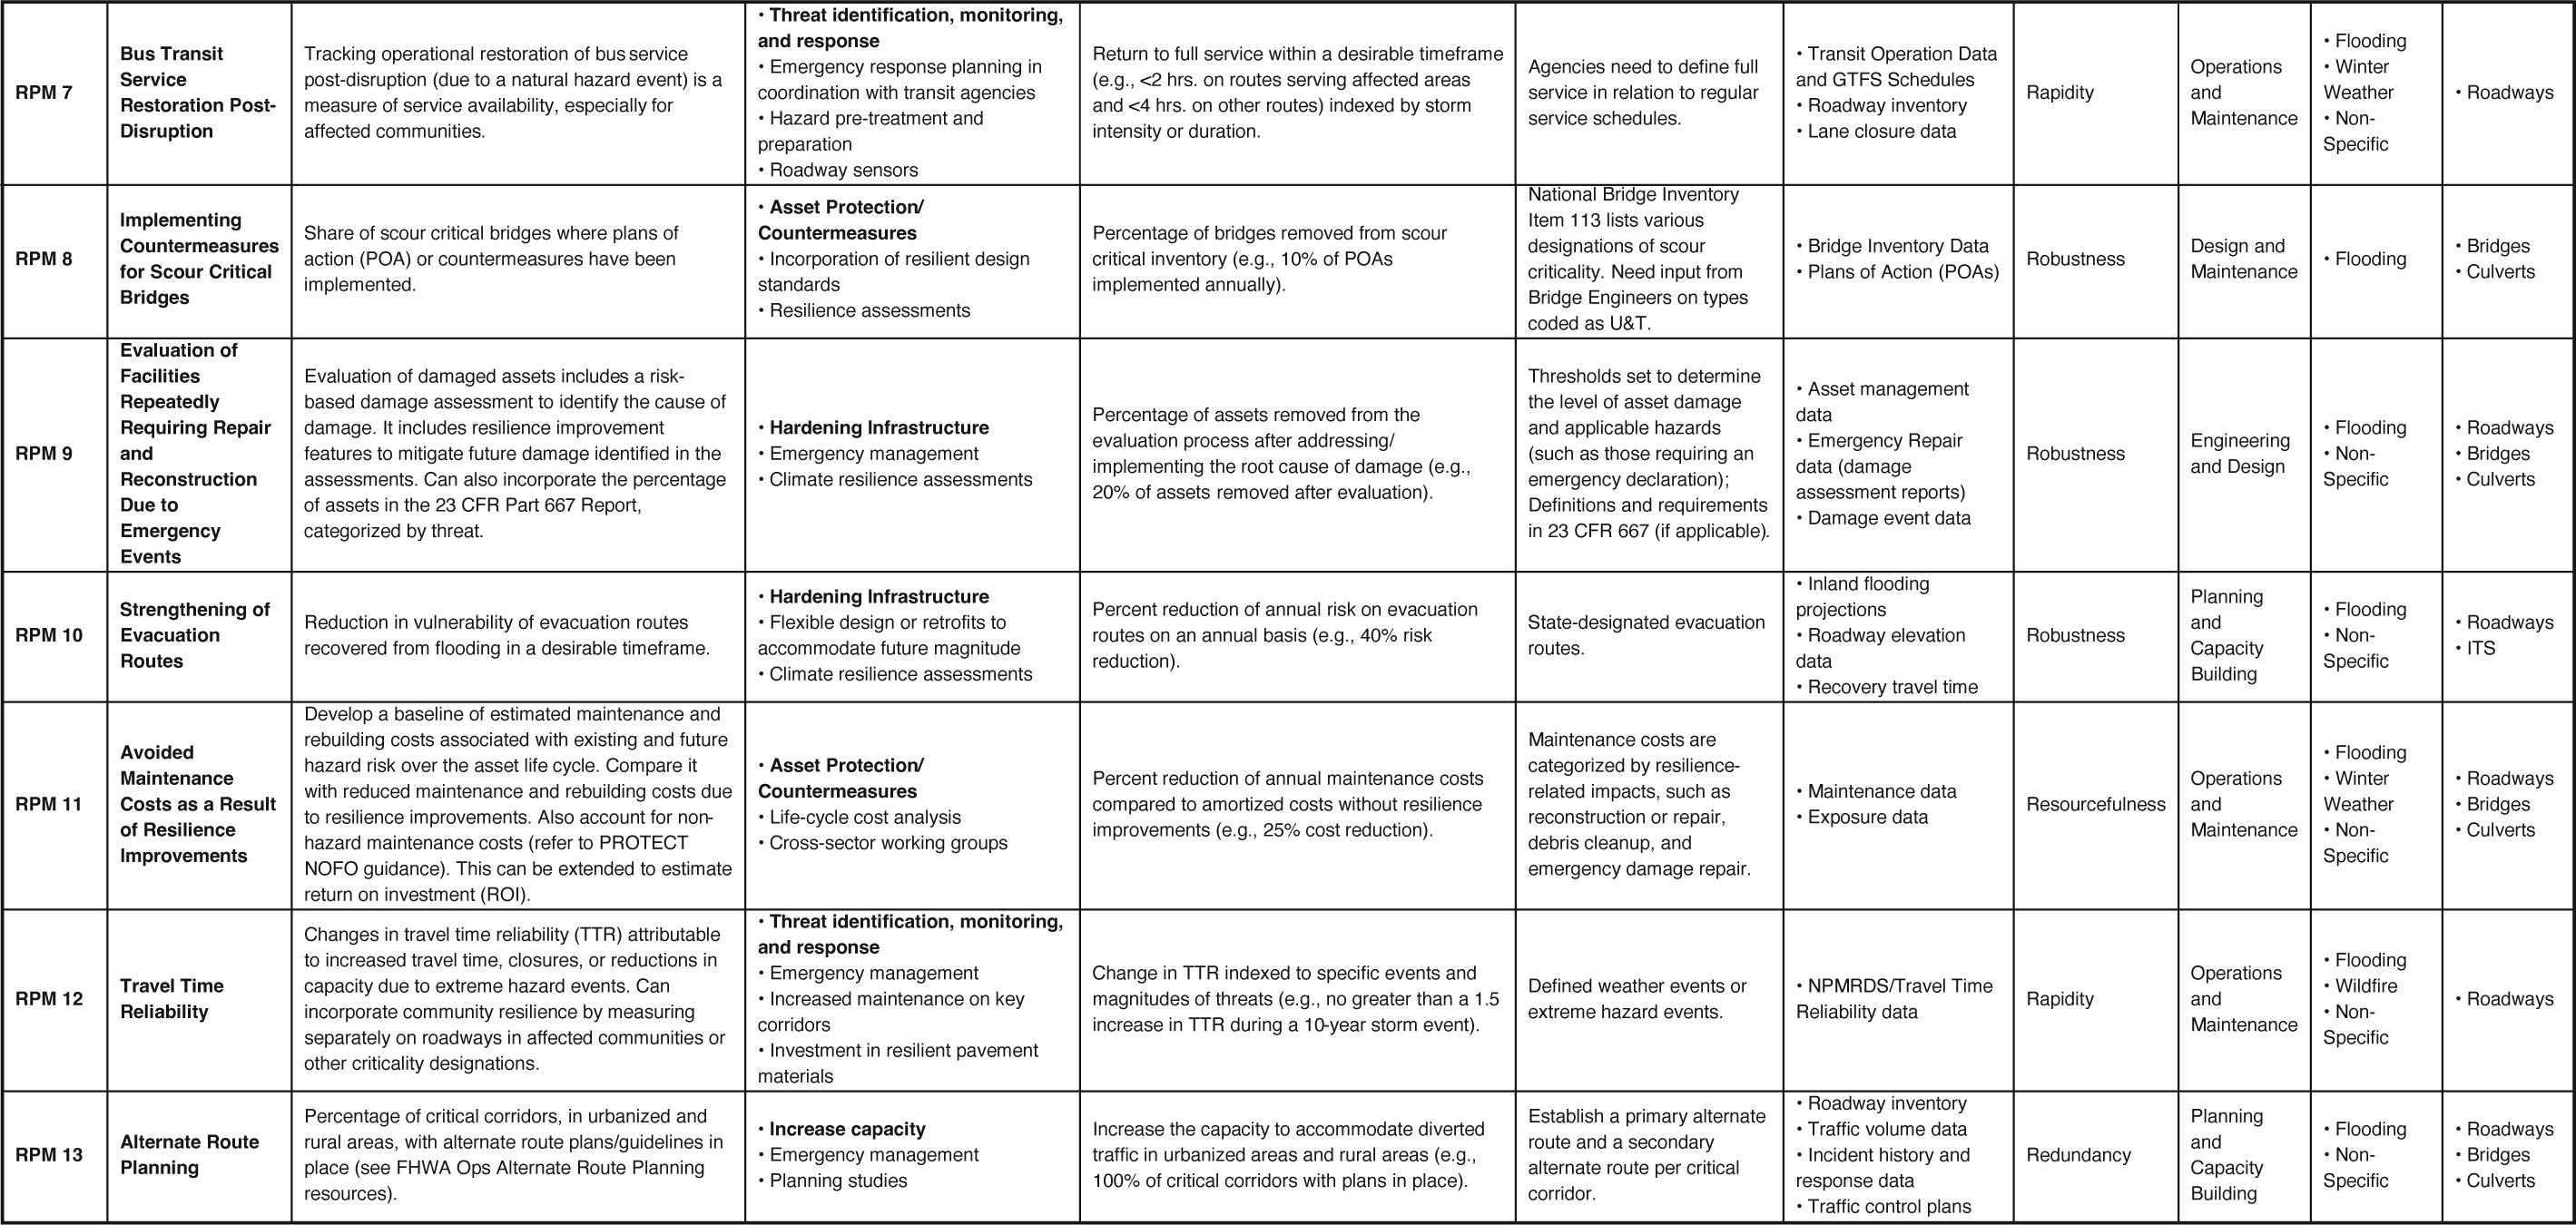
Long Description.
The column headers of the table are RPM Index Number, Measure Title, Description, Illustrative Resilience Strategies, Targets, Thresholds, Example Data Required, Primary Connection to the Four Rs, Primary Functional Area, Applicable Hazards, Applicable Assets. The data given in the table row-wise are as follows: Row 1: RPM1: Reduction in Risk; The reduction in cumulative annual risk from project investments or operations and maintenance funds that address known risks on critical corridors; Asset Protection or Countermeasures; Flexible design and or retrofits to accommodate future magnitude; Resilience assessments; Decrease of risk to specific assets on an annual basis (e.g., 20 percent annual risk reduction to culverts on state designated high critical roadways from 100-year flood events); Developed based on criticality of assets as identified by State DOTs or on functional classification or asset tier; Asset management data; Data used to determine vulnerability and risk from R and R assessment; Robustness; Planning and Capacity Building; Flooding; Winter Weather; Non-Specific; Roadways; Bridges; Culverts; ITS. Row 2: RPM2: Implementing Resilient Design Standards; Incorporate resilience standards and future weather conditions and implement them for assets that are at-risk as identified in the Resilience Improvement Plan or work programs (STIP or TIP). Asterisk definition and source located in accompanying RPM template; Hardening Infrastructure; Engineering adaptation (e.g., raising roadway profiles); Addition or improvement of alternative routes; Roadway expansion to allow for extra capacity on evacuation routes; Increase the percent project costs by tiers – cost, size, or category – (e.g., less than 1 million dollars, more than 5 million dollars, major or minor, etc.) in vulnerable and at-risk areas that incorporate resilience design considerations; The number of new projects, project costs, and criticality of areas; Asset design and engineering plans; Climate projection data; STIP data; Criticality assessment ; Robustness Engineering and Design; Flooding; Non-Specific; Roadways; Bridges; Culverts; ITS. Row 3: RPM3: Redundancy Ratio and or Multi-scale Resilience Index (MRI); The performance of the network during a flooding event as measured from a multi-scale resilience index (MRI), which accounts for the extent of disruption, where network elements, including nodes and links are disabled, the delay experienced by users, and cancelled trips due to hazard damage; Hardening Infrastructure; Increase capacity; Cost-benefit comparison of resilience investments; Reduction in risk of assets with the lowest Redundancy Ratio (e.g., 40 percent risk reduction); Increase percentage of one or more elements of the MRI from resilience improvements (e.g., 20 percent decrease in opportunity cost during a hazard event); Hazard magnitude is a threshold that needs to be defined to measure the system performance during a hazard event as compared with the baseline in the absence of a hazard event; Roadway inventory; Traffic volume data; Travel demand model data; Hazard severity data; Redundancy; Planning and Capacity Building; Flooding; Non-Specific; Roadways; Bridges; Culverts. Row 4: RPM4: Stranded or Severely Detoured Zones; Population, or areas, which would be completely isolated (immobilized) due to disruptions (flooding, wildfire, etc.) to lifeline access facilities. Severely detoured populations experience travel distances in excess of twice their original travel distance; Organizational Readiness; Increase Capacity; Travel demand modelling integrated into climate risk scenario planning; Adaptation planning (e.g., Resilience Improvement Plans); Increase redundant access to stranded communities based identified in R and R assessment (or exposure analysis) results (e.g., reduce the areas identified as “stranded zones” by 20 percent by 2030); Definition of stranded community and excessively long or severed detours (by distance and time); Network data from travel demand model; Demographic and socioeconomic data; Travel time delays from model or delays post-event; Roadway and asset inventory; Redundancy; Planning and Capacity Building; Flooding; Winter Weather; Wildfire; Non-Specific; Roadways; Bridges; Culverts. Row 5: RPM5: Training and Education of DOT Staff; Share of staff at headquarters and each DOT district who have taken the National Highway Institute's (NHI) resilience training or an equivalent DOT-approved training program. It is recommended that these be programs sponsored by FHWA or AASHTO (for standardization) or specifically developed by the state DOT (for customization; Organizational Readiness; Identify relevant resilience training offered by NHI, USDOT, AASHTO or developed in-house; Ensure diverse sets of staff have training opportunities; Increase in percentage of staff with resilience-related responsibilities trained annually (e.g., 50 percent of staff with resilience-related responsibilities trained annually); Definition of resilience and COOP training programs, pre- and post-training assessments, as well as core competencies included in training. Minimum requirements of qualifying resilience training (e.g., hours or credits necessary); Post-training survey data; DOT staff records; Resourcefulness; Planning and Capacity Building; Non-Specific; Roadways; Bridges; Culverts; ITS. Row 6: RPM6: Corridors Recovered within Timeframes: Time it takes to return to normal operations divided by natural hazard event magnitude. For example, time it takes to return to bare pavement divided by the number of inches of snow measured during a snowstorm; Threat identification, monitoring, and response; Emergency response planning; Hazard pre-treatment and preparation; Roadway sensors; Return to level of service targets within a desirable timeframe by roadway functional class (e.g., 100 percent of evacuation routes recovered in 1 hour; Interstates in 2 hours; local roadways in 5 hours); Definition of normal travel times; Real-time operational records; Storm severity data; Travel time data (i.e., NPRMDS); Rapidity; Operations and Maintenance; Winter Weather; Non-Specific; Roadways; Bridges; ITS. Row 7: RPM7: Bus Transit Service Restoration Post-Disruption; Tracking operational restoration of bus service post-disruption (due to result of natural hazard event) is a measure of service availability, especially for affected communities; Threat identification, monitoring, and response; Emergency response planning in coordination with transit agencies; Hazard pre-treatment and preparation; Roadway sensors; Return to full service within a desirable timeframe (e.g., less than 2 hrs. on routes serving affected areas and less than 4 hrs. on other routes) indexed by storm intensity or duration; Agencies need to define full service in relation to regular service schedules; Transit Operation Data and GTFS Schedules; Roadway inventory; Lane closure data; Rapidity; Operations and Maintenance; Flooding; Winter Weather; Non-Specific; Roadways. Row 8: RPM8: Implementing Countermeasures for Scour Critical Bridges;;Share of scour critical bridges where plans of action (POA) or countermeasures have been implemented; Asset Protection or Countermeasures; Incorporation of resilient design standards; Resilience assessments; Percentage of bridges removed from scour critical inventory (e.g., 10 percent of POAs implemented annually); National Bridge Inventory Item 113 lists various designations of scour criticality. Need input from Bridge Engineers on types coded as U and T; Bridge Inventory Data; Plans of Action (POAs); Robustness; Design and Maintenance; Flooding; Bridges; Culverts. Row 9: RPM9: Evaluation of Facilities Repeatedly Requiring Repair and Reconstruction Due to Emergency Events; Evaluation of damaged assets that include a risk-based damage assessment to identify the cause of damage. It includes resilience improvement features to mitigate future damage identified in the assessments. Can also incorporate percent of assets on 23 CFR Part 667 Report categorized by threat; Hardening Infrastructure; Emergency management; Climate resilience assessments Percentage of assets removed from the evaluation process after addressing or implementing the root cause of damage (e.g., 20 percent of assets removed after evaluation); Thresholds set to determine the level of asset damage and applicable hazards (such as those requiring an emergency declaration); Definitions and requirements in 23 CFR 667 (if applicable); Asset management data; Emergency Repair data (damage assessment reports); Damage event data; Robustness; Engineering and Design; Flooding; Non-Specific; Roadways; Bridges; Culverts. Row 10: RPM10: Strengthening of Evacuation Routes: Reduction in vulnerability of evacuation routes recovered from flooding in a desirable timeframe; Hardening Infrastructure; Flexible design and or retrofits to accommodate future magnitude; Climate resilience assessments; Percent reduction of annual risk on evacuation routes on an annual basis (e.g., 40 percent risk reduction). State-designated evacuation routes; Inland flooding projections; Roadway elevation data; Recovery travel time; Robustness; Planning and Capacity Building; Flooding; Non-Specific; Roadways; ITS. Row 11: RPM11: Avoided Maintenance Costs as a result of Resilience Improvements; Develop a baseline of estimated maintenance and rebuilding costs associated with existing and future hazard risk over the asset lifecycle. Compare it with reduced maintenance and rebuilding costs due to resilience improvements. Also account for non-hazard maintenance costs (refer to PROTECT NOFO guidance). This can be extended to estimate return on investment (ROI); Asset Protection or Countermeasures; Lifecycle cost analysis; Cross sector working groups; Percent reduction of annual maintenance costs compared to amortized costs without resilience improvements (e.g., 25 percent cost reduction); Maintenance costs categorized by resilience-related impacts, such as reconstruction or repair, debris cleanup, and emergency damage repair; Maintenance data; Exposure data; Resourcefulness; Operations and Maintenance; Flooding; Winter Weather; Non-Specific; Roadways; Bridges; Culverts. Row 12: RPM12: Travel Time Reliability; Changes in Travel Time Reliability (TTR) attributable to increased travel time, closures, or reductions in capacity due to extreme hazard events. Can incorporate community resilience by measuring separately on roadways in affected communities or other criticality designations; Threat identification, monitoring, and response; Emergency management; Increased maintenance on key corridors; Investment in resilient pavement materials; Change in TTR indexed to specific events and magnitudes of threats (e.g., no greater than a 1.5 increase in TTR during a 10-year storm event); Defined weather events or extreme hazard events; NPMRDS or Travel Time Reliability data; Rapidity; Operations and Maintenance; Flooding; Wildfire; Non-Specific; Roadways. Row 13: RPM13: Alternate Route Planning; Percent of critical corridors, in urbanized and rural areas, with alternate route plans or guidelines in place (see FHWAOps Alternate Route Planning resources); Increase capacity; Emergency management; Planning studies; Increase the capacity to accommodate diverted traffic in urbanized areas and in rural areas (e.g., 100 percent of critical corridors with plans in place); Establish a primary alternate route and a secondary alternate route per critical corridor; Roadway inventory; Traffic volume data; Incident history and response data; Traffic control plans; Redundancy; Planning and Capacity Building; Flooding; Non-Specific; Roadways; Bridges; Culverts.
This page intentionally left blank.


